Article

Quantifying the Effects of Climate Change on the Urban Heat Island Intensity in Luxembourg—Sustainable Adaptation and Mitigation Strategies Through Urban Design

1
Agro-Environmental Systems Group, Environmental Sensing and Modelling (ENVISION), Luxembourg Institute of Science and Technology (LIST), 41, rue du Brill, 4422 Belvaux, Luxembourg
2
Geo-Net Umweltconsulting, 30161 Hannover, Germany
3
Climate Service Center Germany (GERICS), Helmholtz-Zentrum Hereon, Fischertwiete 1, 20095 Hamburg, Germany
4
Chair of Environmental Meteorology, Institute of Earth and Environmental Sciences, University of Freiburg, 79085 Freiburg, Germany
5
Democritus University of Thrace, 69100 Komotini, Greece
*
Author to whom correspondence should be addressed.
Atmosphere 2025, 16(4), 462; https://doi.org/10.3390/atmos16040462
Submission received: 14 February 2025 / Revised: 2 April 2025 / Accepted: 9 April 2025 / Published: 16 April 2025
(This article belongs to the Special Issue Urban Heat Islands and Global Warming (3rd Edition))

Abstract

:
Rapid urbanization and climate change intensify the urban heat island effect. This study quantifies the UHI impact in Luxembourg’s Pro-Sud region and explores sustainable mitigation strategies. In situ and mobile measurements, EURO-CORDEX regional climate projections (RCP4.5), and the FITNAH-3D urban climate model were used considering also future building developments. The results reveal a significant UHI effect, with substantial temperature and thermal stress level differences between urban and rural areas. Regional climate projections indicate a marked UHI intensification under future scenarios. FITNAH-3D simulations show increased thermal stress levels, especially in densely built areas, and highlight green infrastructure’s importance in mitigating UHI effects. Recommendations for spatial unit-specific urban climate measures specifically for vegetation, unsealing, and optimized urban design and planning are provided. Our research emphasizes the urgent need for tailored urban planning, adaptation, and mitigation strategies to enhance urban climate resilience and address thermal stress.

1. Introduction

Rapid urbanization is a defining trend of the 21st century, with populations increasingly concentrated in dense cityscapes. This transformation has a significant impact on local climate, leading to the well-documented phenomenon of higher air temperatures in cities. Balchin and Pjye [1] introduced in 1947 the term urban heat island to describe the fact of an island-like urban overheating, characterized by warmer urban areas surrounded by cooler open spaces. Compared to the surrounding countryside, cities have on average higher surface temperatures, higher air temperatures as well as higher below-ground temperatures [2]. One of the primary reasons for the higher temperatures is the change in the ground surface and building materials used in urban agglomerations [3]. A large proportion of vertical surfaces (surface enlargement) in urban areas, coupled with lower albedo (reflectivity) of these surfaces, results in increased absorption and retention of heat [4]. Moreover, the greater sealing of surfaces, e.g., due to impervious surfaces such as concrete and asphalt, reduces the natural evaporative cooling potential. The higher surface roughness and heat storage capacity of urban materials further exacerbate the problem, trapping heat within the built environment [3]. Another additional important contributor to the UHI intensity is the anthropogenic heat emission from transportation, industrial processes, and operational energy use in buildings [4,5].
According to the Intergovernmental Panel on Climate Change (IPCC), human activities, primarily through the emission of greenhouse gases, have been the principal driver of global warming, and the global surface temperature has risen by 1.1 °C above the 1850–1900 baseline during the period of 2011–2020 [6]. The year 2024 was the warmest year in global temperature records going back to 1850. According to ECMWF, the global average surface air temperature of 15.1 °C was 0.72 °C above the 1991–2020 average and 0.12 °C above 2023, the previous warmest year on record [7]. Regional climate change projections suggest an increase in the mean annual air temperature values—depending on the emission scenario—between +1.3 K (RCP26), +2.1 K (RCP45), and +3.1 K (RCP85) [8]. The UHI effect is being intensified by climate change, posing significant challenges to urban sustainability and human health [9]. As global temperatures rise, cities are experiencing increasingly hotter and partly more humid conditions compared to their surrounding rural areas. Cities in Central European urban agglomerations are experiencing the intensifying impacts of climate change [8,10,11]. These cities, often with a history of industrialization, contribute significantly to greenhouse gas emissions, while simultaneously facing increased risks from extreme weather events. Rising temperatures lead to heatwaves, impacting public health, productivity, and energy consumption [8,12,13].
The understanding of the complex dynamics and interactions among urban design, urban planning, human activities, and environmental influences that contribute to the urban heat island effect is a prerequisite for the development of robust strategies to mitigate and adapt to the challenges posed by rising urban temperatures. Mobile measurements of the UHI effect are a suitable approach for the assessment of temperature variations between urban and rural environments. In contrast to fixed stations, mobile measurements utilize vehicles or other transport methods to capture temperature data across diverse locations within urban settings. This approach enhances the spatial resolution of the air temperature information and allows for the localisation of variations in the urban temperature field influenced by factors such as landscape features, human activity, and microclimates. Table 1 contains selected studies of the assessment of the UHI based on different mobile measurement approaches.
Numerical urban climate models can serve as powerful tools to address this challenge, allowing for the simulation of the impacts of various factors and interventions on urban microclimates [36]. Furthermore, these models facilitate the exploration of scenarios that can include modifications in building materials, urban geometry, incorporation of green and blue urban infrastructure, and the consideration of realistic climate change scenarios [37]. This enables the planners to evaluate the effectiveness of these interventions in reducing the UHI effect. Finally, it is possible to integrate real-time data and advanced computational techniques, such as Internet of Things (IoT) sensors, artificial intelligence (AI, machine learning, and deep learning), and Geographic Information Systems (GISs), to improve the accuracy of predictions related to temperature distributions and heat retention within cities [38,39].
Relying on a modelling approach offers significant advantages over depending solely on fixed and mobile measurement campaigns. By closing the spatial and temporal gaps between measurements on a physically sound basis, additional meteorological variables and thermal stress indices such as the Physiological Equivalent Temperature (PET) and the Universal Thermal Climate Index (UTCI) can be calculated. By modelling comprehensive wind and air temperature fields, a better understanding of the complex urban climates can be obtained. This versatility positions them as fundamental tools for urban climatology research and informed decision-making in urban and landscape planning.
This paper is structured as follows. After the introduction, in Section 2, the material and methods, such as observational datasets; regional climate projections, including the bias-correction method; and the FITNAH-3D model for the bioclimatic assessment of the Southern part of Luxembourg (Pro-Sud region) are described. Section 3 presents the main results and findings, while Section 4 discusses these results in relation to other peer-reviewed international studies. Finally, this paper concludes with a short summary and recommendations for future mitigation and adaptation strategies.

2. Materials and Methods

2.1. In Situ Measurements

2.1.1. Long-Term Station Data for the Bias Correction of Climate Change Projections

Direct measurements were taken from the Findel airport SYNOP station (World Meteorological Organization station, WMO, station ID = 06590) and used as a regional reference time series for this study. The SYNOP station is located approximately six kilometres southeast of the city centre of Luxembourg (coordinates: 49°37′57.547″ N/6°13′58.543″ E) and is the only official WMO weather observation station situated within the Grand Duchy of Luxembourg. The daily air temperature records from the Findel station, spanning the 30-year period from 1 January 1971, to 31 December 2000, were used to bias-correct the output from the multi-model ensemble of the regional climate projections. This bias correction process is a paramount step in improving the reliability and accuracy of climate projections at the regional scale, ensuring that the projected data align more closely with the observed meteorological conditions in Luxembourg.

2.1.2. Special UHI Monitoring Network

For the assessment of the current urban heat island intensities in the Pro-Sud region, a dedicated measurement network was established. Measurements started in June 2023 and continued until June 2024. In three villages of different population sizes and extensions, weather stations with sensors for air temperature were installed (Table 2).
Passive, naturally ventilated radiation shields were used to protect the sensors from direct sunlight exposure. At each site, one station was established in the city centre and a second one in the surrounding rural area. Temporal resolution of the measurements was set to 2 min intervals, and all data were aggregated to hourly values for the subsequent analysis.

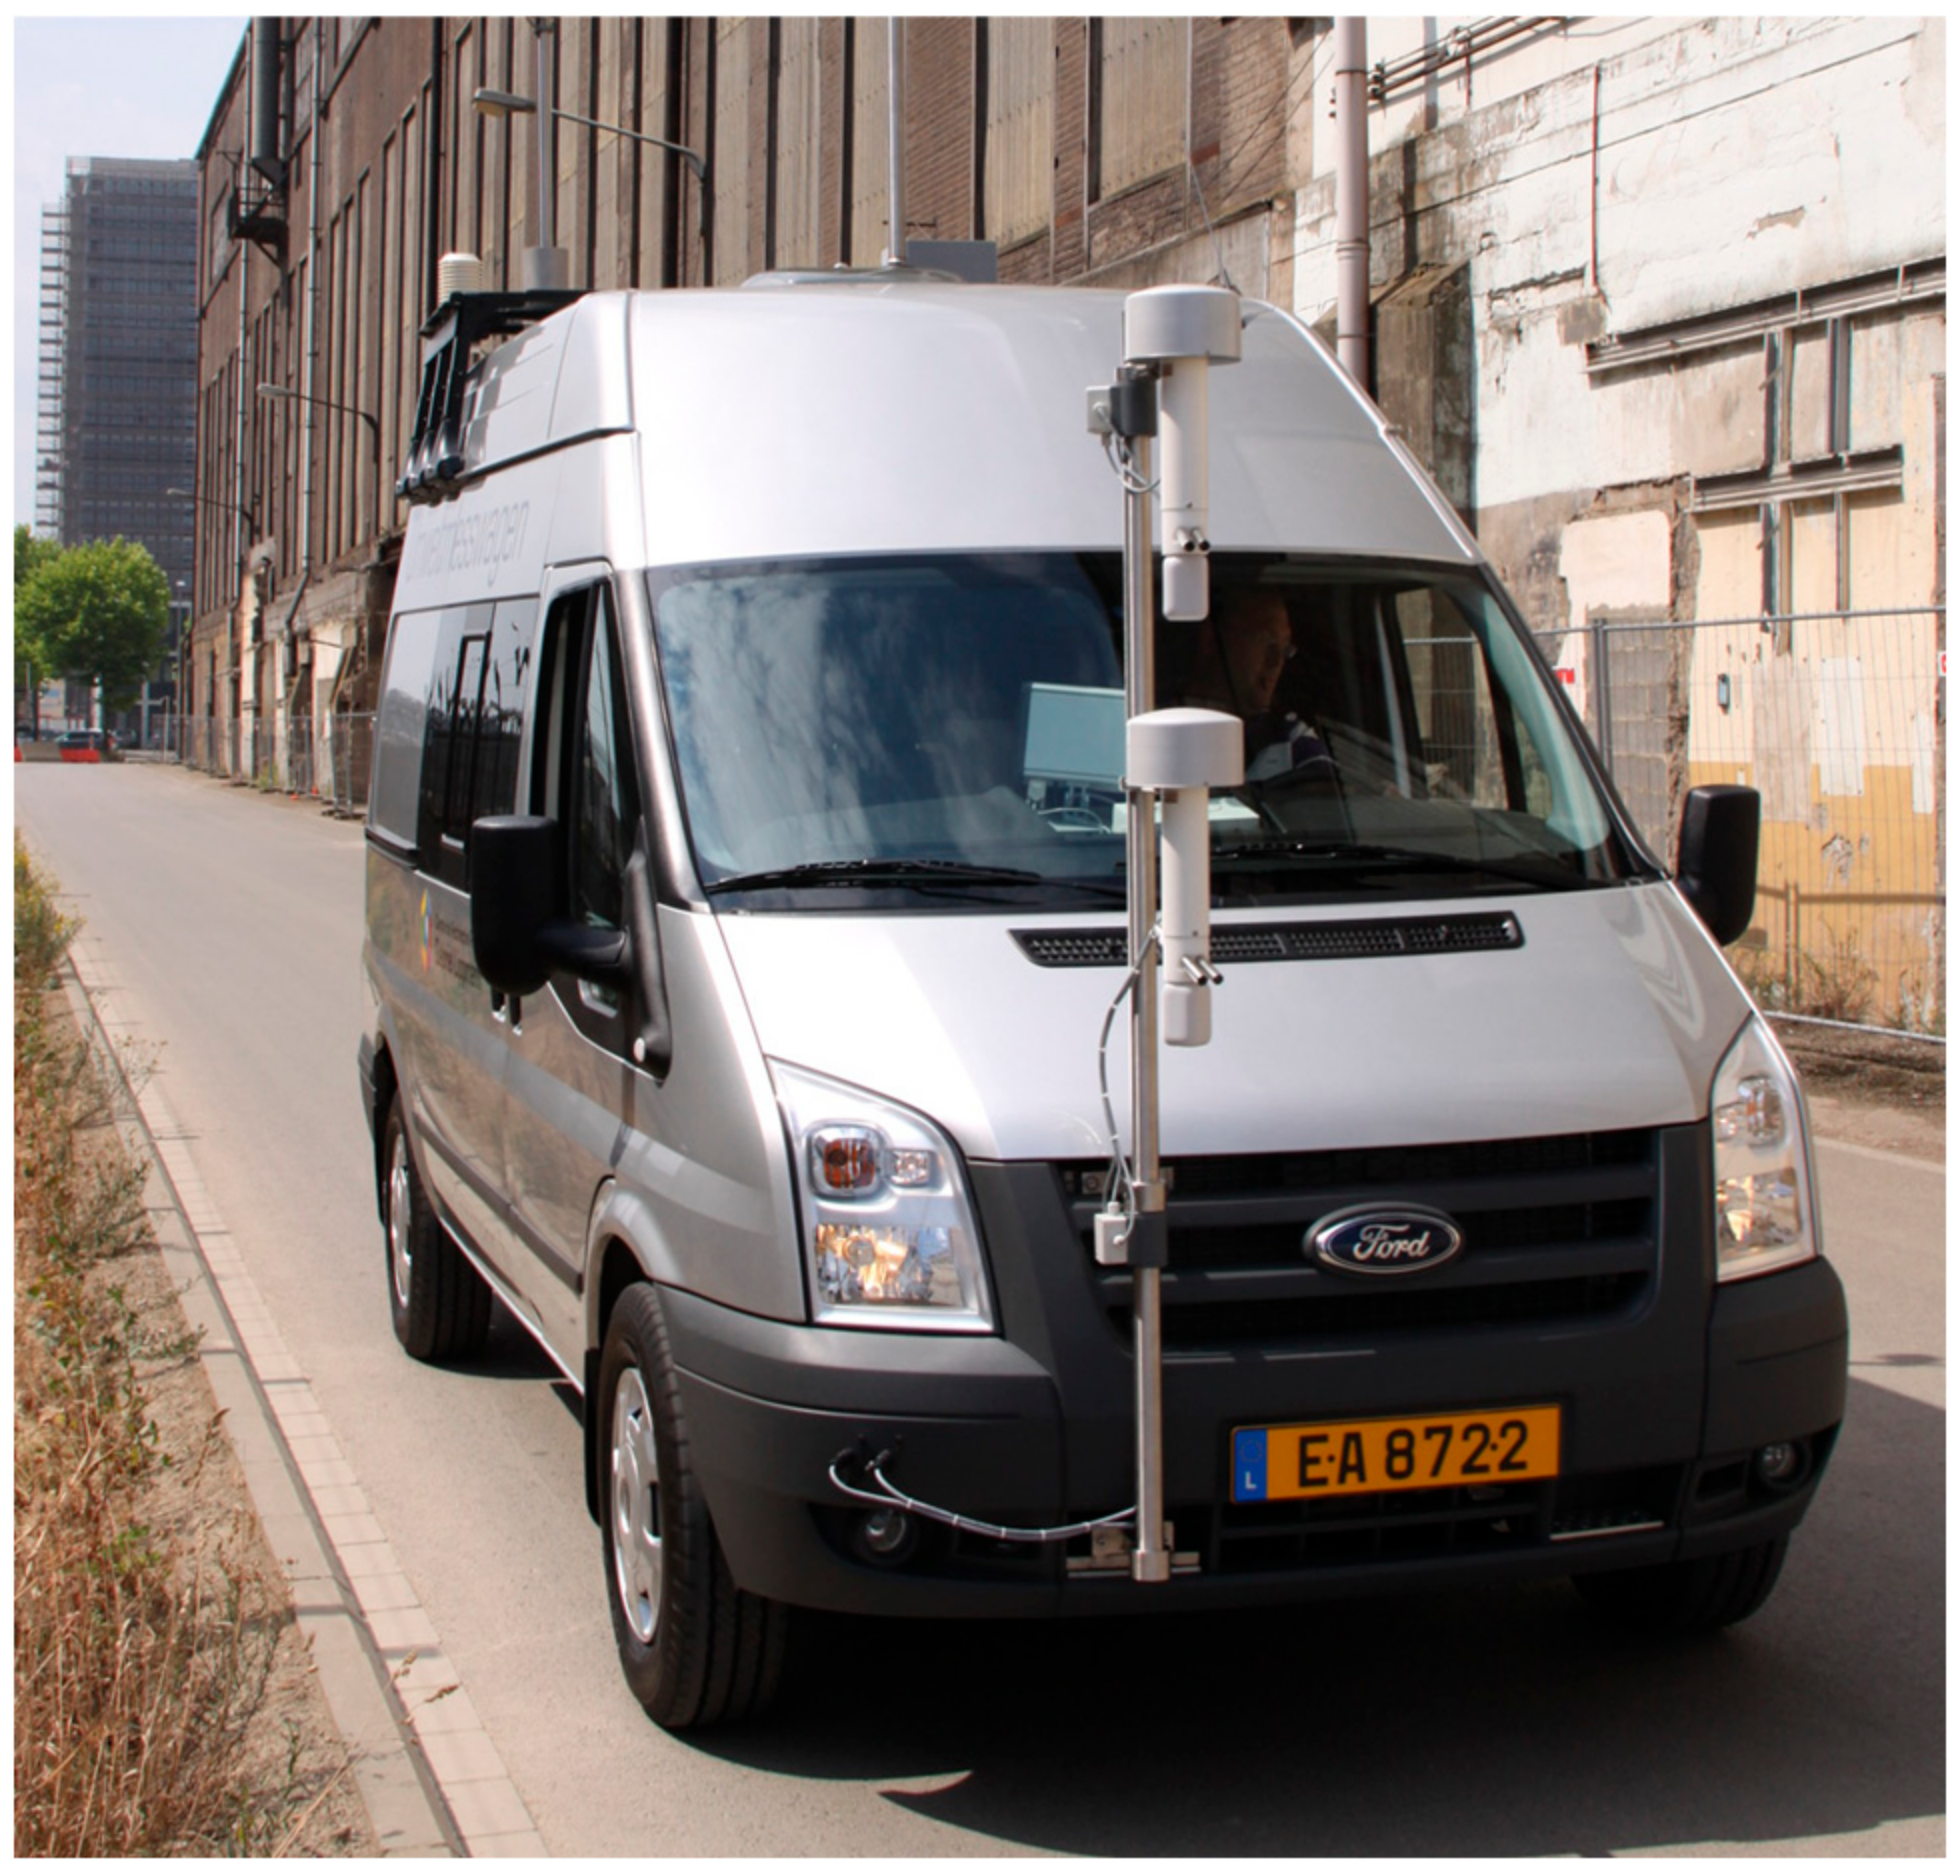
2.1.3. Mobile Measurements

In addition to the stationary measurements, horizontal temperature transects can usefully supplement the meteorological data of the stationary measurement network. For this purpose, the air temperature and humidity were recorded along a previously defined route in Differdange and Esch-sur-Alzette using the specially equipped LIST environmental measurement vehicle (EMV). The EMV is equipped with two actively ventilated psychrometers for measuring dry and wet bulb temperatures (Figure 1).
Data were measured at 6 s intervals and stored for postprocessing and analysis. In addition, the measurements were geolocated with the help of a GPS, which was also included in the EMV. This enables the collection of area-wide information on the air temperature distribution in a city. The measurements were conducted during autochthonous weather conditions because the temperature differences between the city and the surrounding area are particularly pronounced under such conditions. The UHI effect is typically strongest at night. Therefore, the measurements were carried out between 22:00 and 05:00.

2.2. Climate Projections

We used climate projections from the CORDEX initiative for the European domain (EURO-CORDEX), which is part of the World Climate Research Programme, for the assessment of the future thermal stress levels in the Pro-Sud region. The EURO-CORDEX project aims to provide climate change information at the regional level. We extracted air temperature, humidity, surface wind speed, and global radiation from climate model simulations for the Representative Concentration Pathways 4.5 (RCP4.5) over the period 1971 to 2045. These data were used to force the FITNAH-3D model to simulate the future conditions in the area under investigation. The specific climate models used in the analysis are listed in Table 3.
Since the output of a Regional Climate Model (RCM) is—in most cases—biased towards observed fields [40], we follow the example of previous impact studies [8,41,42] and correct the systematic biases of the RCMs with the data from the WMO station Findel based on a non-parametric quantile mapping technique. This method aligns the distribution of the model output with the observed data from the WMO station Findel. This method involves transforming the cumulative distribution function (CDF) of the model output to match the CDF of the observed data. This is performed by using empirical quantiles, without specifying a parametric form for the distributions [43]. The process involves the following steps: (i) sorting the model output and observed data separately in ascending order, (ii) calculating the CDFs of the model output and observed data based on their respective rankings, (iii) determining the quantile mapping function by matching the empirical quantiles of the model output with those of the observed data. This is completed by interpolating between the pairs of corresponding quantile values, and finally, (iv) applying the quantile mapping function to the model output to correct the bias. This flexible method can correct biases across the entire distribution of the model output, not just at specific quantiles. The analysis was conducted using the R programming language for statistical computing [44], with the support of the R-package “qmap” [45]. For this study, three different scenarios, including the foreseen construction activities, were defined (Table 4).

2.3. Urban Modelling

To model the current and future thermal stress levels in the area under investigation, the FITNAH-3D (Flow over Irregular Terrain with Natural and Anthropogenic Heat sources) was used. It is a non-hydrostatic meteorological model designed for simulating wind fields in three dimensions. It was developed with the help of the German Research Foundation’s priority program and is a powerful tool for addressing environmental and meteorological issues in urban and landscape planning, complementing on-site measurements. The model has been applied in various cities in Switzerland, such as Zurich [46], Geneva [47], and Bern [48], or in Bonn and Berlin (Germany) [49,50].
FITNAH-3D, similar to the numerical climate and weather forecast models, is based on a set of fundamental equations, including the Navier–Stokes equation of motion (conservation of momentum), the continuity equation (conservation of mass), and the first law of thermodynamics (conservation of energy). The local climatic characteristics of the study area need to be accurately captured by the numerical model. A finer grid resolution provides more details and structures but also increases the computational requirements and need for input data. A compromise between necessity and feasibility must be found. In our study, the horizontal spatial mesh size used for the FITNAH-3D model is 5 m. The vertical grid is non-equidistant, with denser spacing near the surface to realistically capture the strong variations in meteorological variables. The lowest computing levels are at 2, 5, 10, 15, 20, 30, 40, 50, and 70 m above ground. The grid spacing increases with height, and the model top is located at 3000 m above sea level, where the disturbances from the underlying terrain and land use are assumed to have diminished. FITNAH-3D meets the standards defined in Verein Deutscher Ingenieure (VDI) guideline 3787, Bl.7 [51] for mesoscale wind field models in connection with dynamically and thermally induced wind fields. More details of the FITNAH-3D model are given by Gross [52] and Geo-Net [46,47,48].
Within our study, we used specific input data for the numerical model FITNAH-3D to characterize the landscape of the study area. For the Pro-Sud region, a Digital Elevation Model (DEM) with 1 m spatial resolution was used. Land cover data were taken from the CORINE dataset, and in addition, orthorectified aerial photographs were used. The building and structural height as well as the degree of sealing were obtained from a 3D cadastre of Luxembourg. In cases when data were unavailable, the necessary information was derived from the land cover data. All input data were also compared regarding their plausibility using a current aerial photo dataset.

3. Results

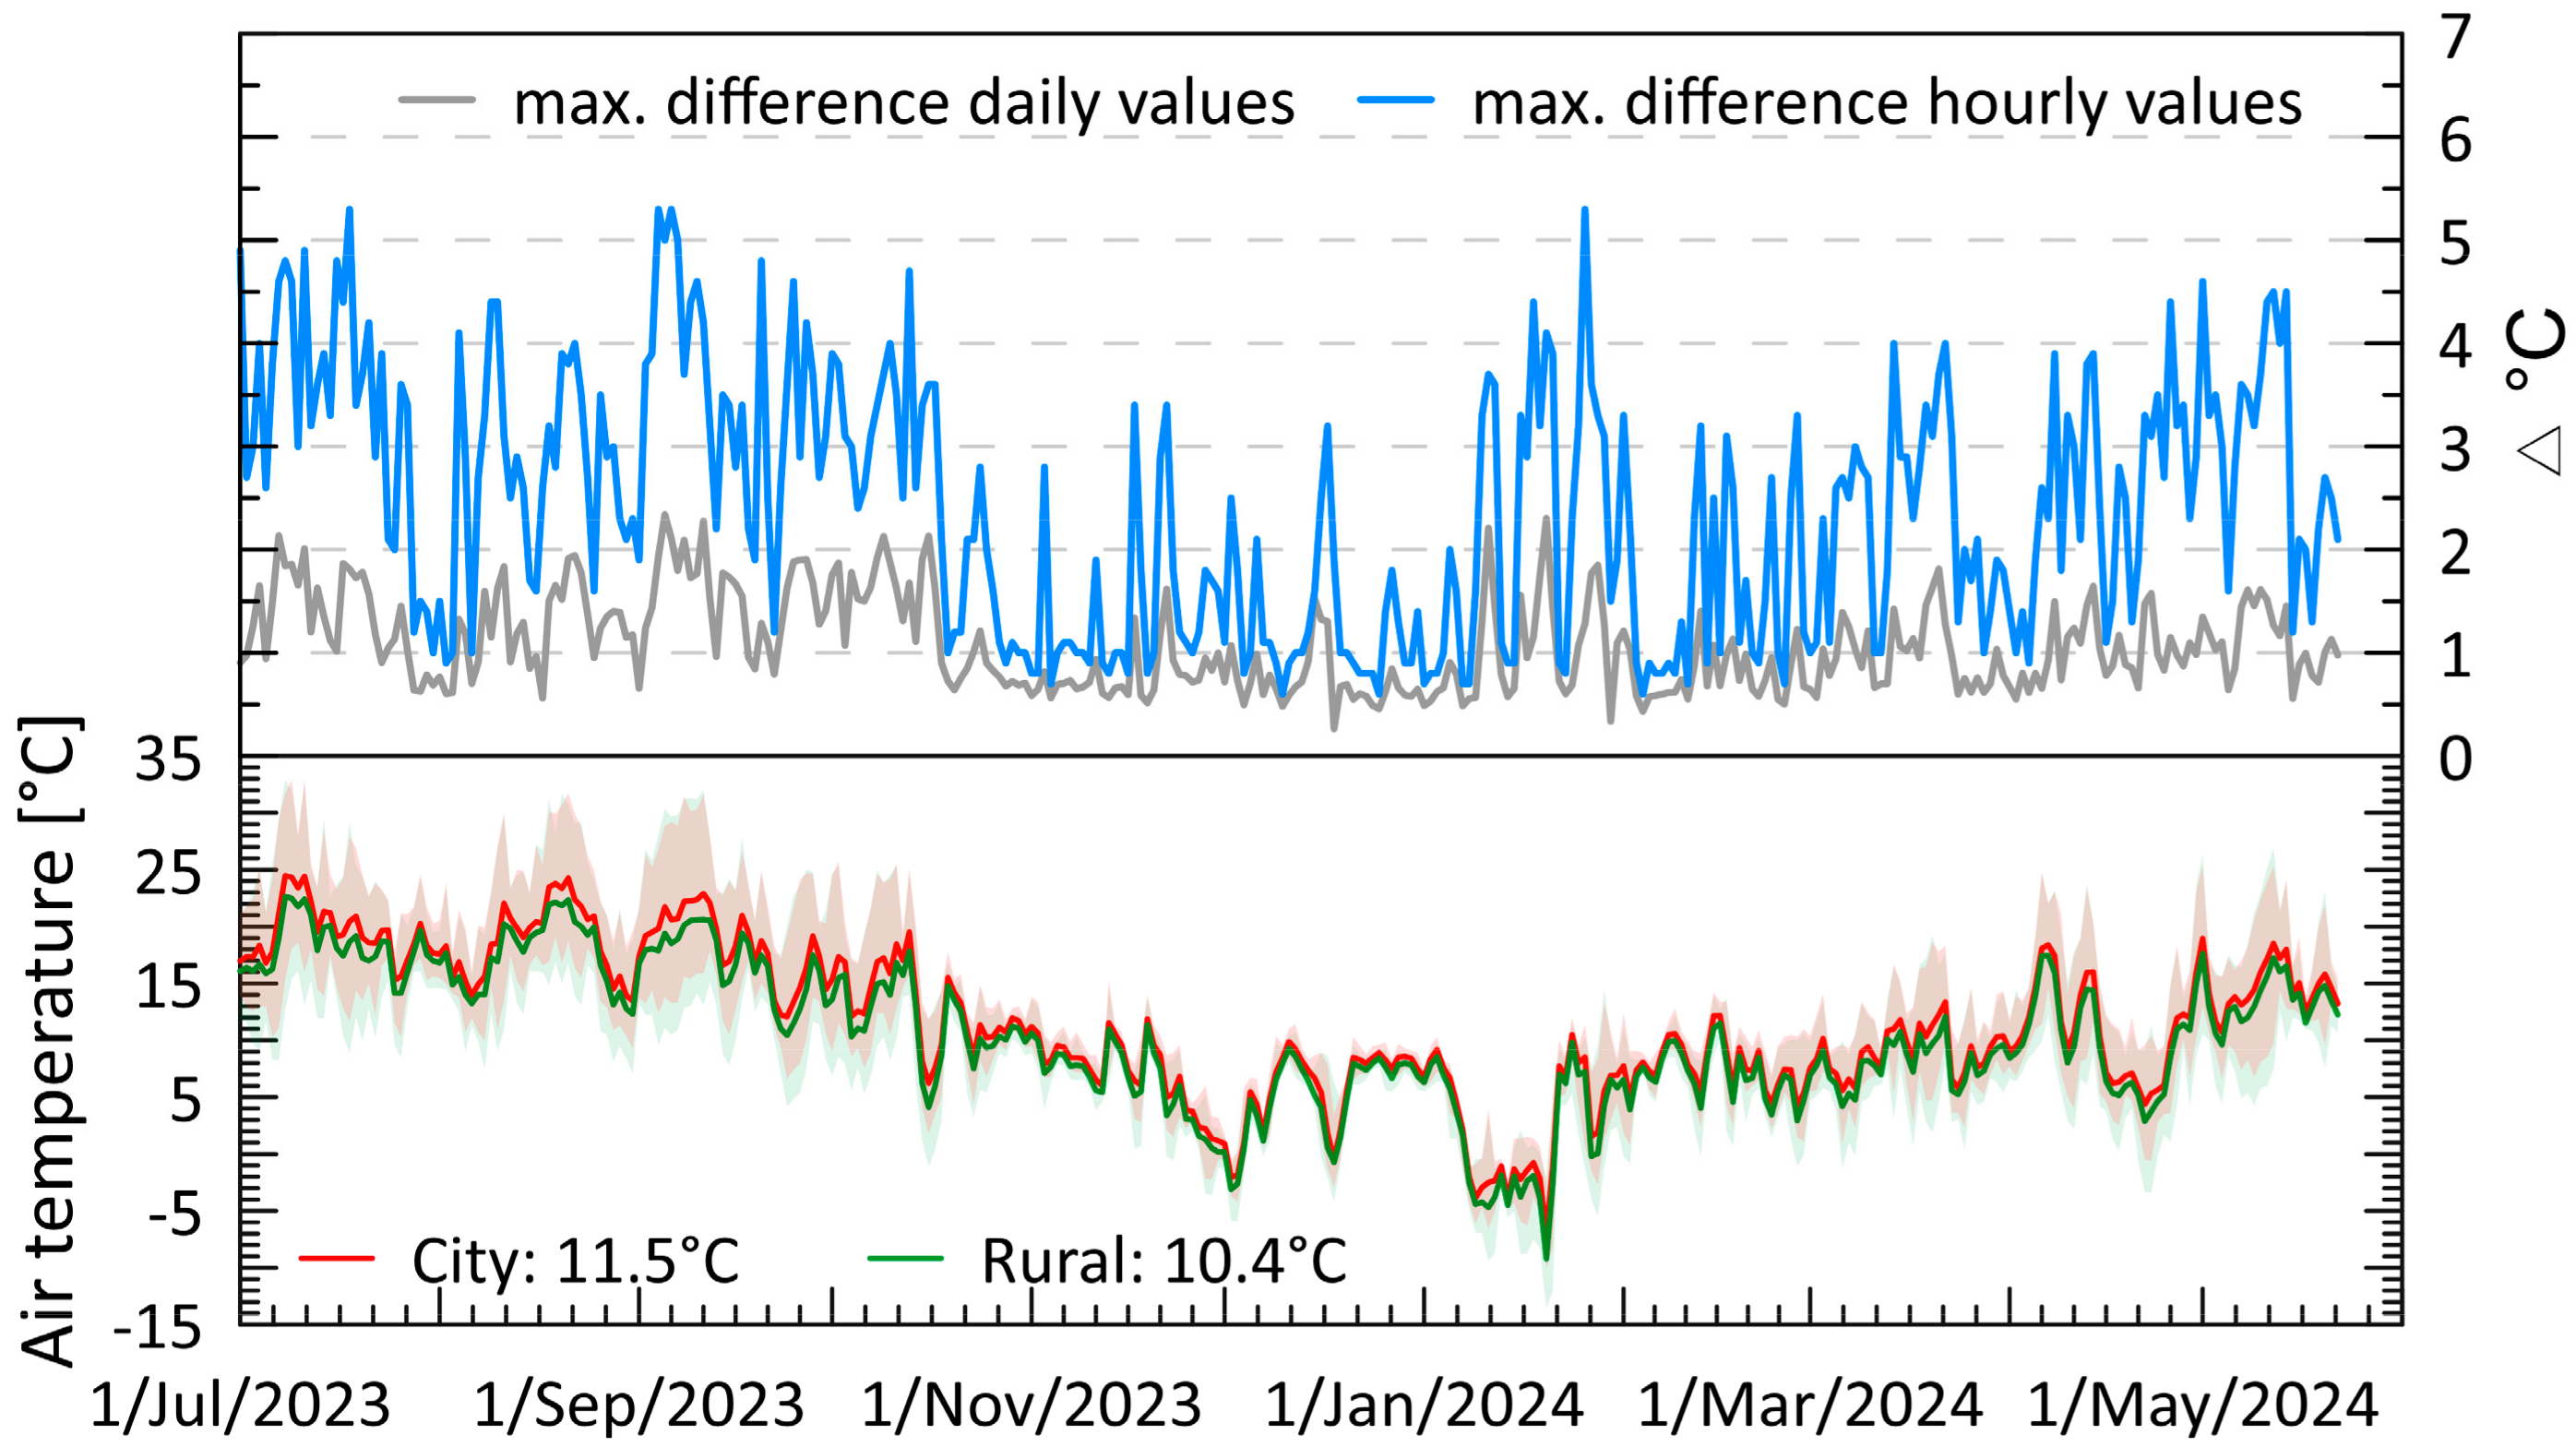
3.1. UHI Intensity Based on Measurements

To supplement and validate the model results with in situ observations, both stationary and complementary mobile measurements of air temperature were conducted. In the municipalities of Kayl, Differdange, and Esch-sur-Alzette, air temperature sensors (enclosed with passive, naturally ventilated radiation shields) were installed at a height of two meters in green spaces on the urban periphery and in the sealed city centre (a total of six measurement points). These measurements were carried out over a period of one year (26 June 2023–22 May 2024) with a time resolution of two minutes. Figure 2 shows the measurement results (maximum difference of daily averages, maximum difference of hourly values, and hourly averages) exemplarily for the two special measurement stations in Esch-sur-Alzette. The maximum differences in daily averages range between 0.7 °C and 2.3 °C, and the differences in hourly values range from 0.7 °C to 5.3 °C. The temperature differences were lowest in the months of November/December 2023 and in the first half of January 2024. In contrast, from July until October 2023, as well as February, March, April, and May 2024, pronounced urban heat island effects can be observed due to higher air temperature differences between the city centre and the rural area (Ellergronn). Ellergronn is a natural reserve area with rich biodiversity and an important role as a vital ecological zone within the region. The highest difference was measured in early September 2023. The data collected in the municipalities of Differdange and Kayl revealed comparable results, however, with smaller observed differences in air temperatures. This was particularly evident in Kayl, where the air temperature difference between rural and urban areas was on average 60% lower than in Esch-sur-Alzette. This can be attributed to the substantially lower population density and corresponding lower urban sealing, which is only a quarter of that in Esch-sur-Alzette.
Mobile air temperature measurements are a fundamental method for the assessment of UHIs, as they can provide high-resolution spatial and temporal data that traditional fixed monitoring stations often cannot deliver. The mobility of measurement systems, such as vehicles equipped with portable sensors, enables the collection of temperature data across diverse urban microclimates, enabling the identification of temperature gradients influenced by land use, vegetation cover, and building materials. Studies employing mobile measurements have demonstrated their effectiveness in mapping UHI intensity and distribution, revealing localized heat hotspots that inform urban planning and climate adaptation strategies [53,54]. Figure 3 shows the results of a nighttime profile measurement in Esch-sur-Alzette on 1 February 2024 (10:12 p.m.–10:41 p.m.) with starting and ending points at the Ellergronn rural location. The maximum air temperature difference between the green area and the city centre is 4 °C. The air temperature difference between the start and end times was 0.3 °C. Therefore, the measured differences between the city centre and Ellergronn can mainly be attributed to the UHI effect.

3.2. CORDEX Regional Climate Projections

A comprehensive analysis of the future climate conditions in Luxembourg (49°36′ N, 6°7′ E) was conducted by extracting time series data reflecting daily mean, maximum, and minimum air temperatures under the Representative Concentration Pathway 4.5 (RCP45) scenario from the EU-CORDEX archive. The RCP45 scenario represents a moderately ambitious climate mitigation pathway, wherein the radiative forcing stabilizes at a level of 4.5 W/m2 prior to the year 2100 because of the implementation of a variety of technologies and strategic measures aimed at reducing greenhouse gas emissions. The air temperature data utilized for this analysis were derived from a three-by-three grid box from the model output and spatially averaged. This averaging process did not incorporate a weighting function. For the forcing of the FITNAH-3D urban climate model, absolute temperature values are required. Before the output of the multi-model ensemble data could be used, a bias correction was applied to the data. This step ensures the alignment of the model’s input data with observed conditions and minimises discrepancies that might otherwise influence the FITNAH-3D results. Figure 4 illustrates the projected changes in the minimum, maximum, and mean air temperatures for the RCP45 scenario, highlighting significant trends in air temperature. The findings indicate a predicted increase in near-surface air temperatures by the end of this century: specifically, an increase of 2.1 K for both minimum and maximum annual temperatures, coupled with a 2.2 K rise in the mean annual temperature. These projections underscore the pressing need for adaptive strategies in urban planning and climate resilience. For the Pro-Sud project, it was decided that the forcing data for the subsequent FITNAH modelling would use the 25th and 75th percentiles of the temperature projections, rather than relying solely on the ensemble mean values.

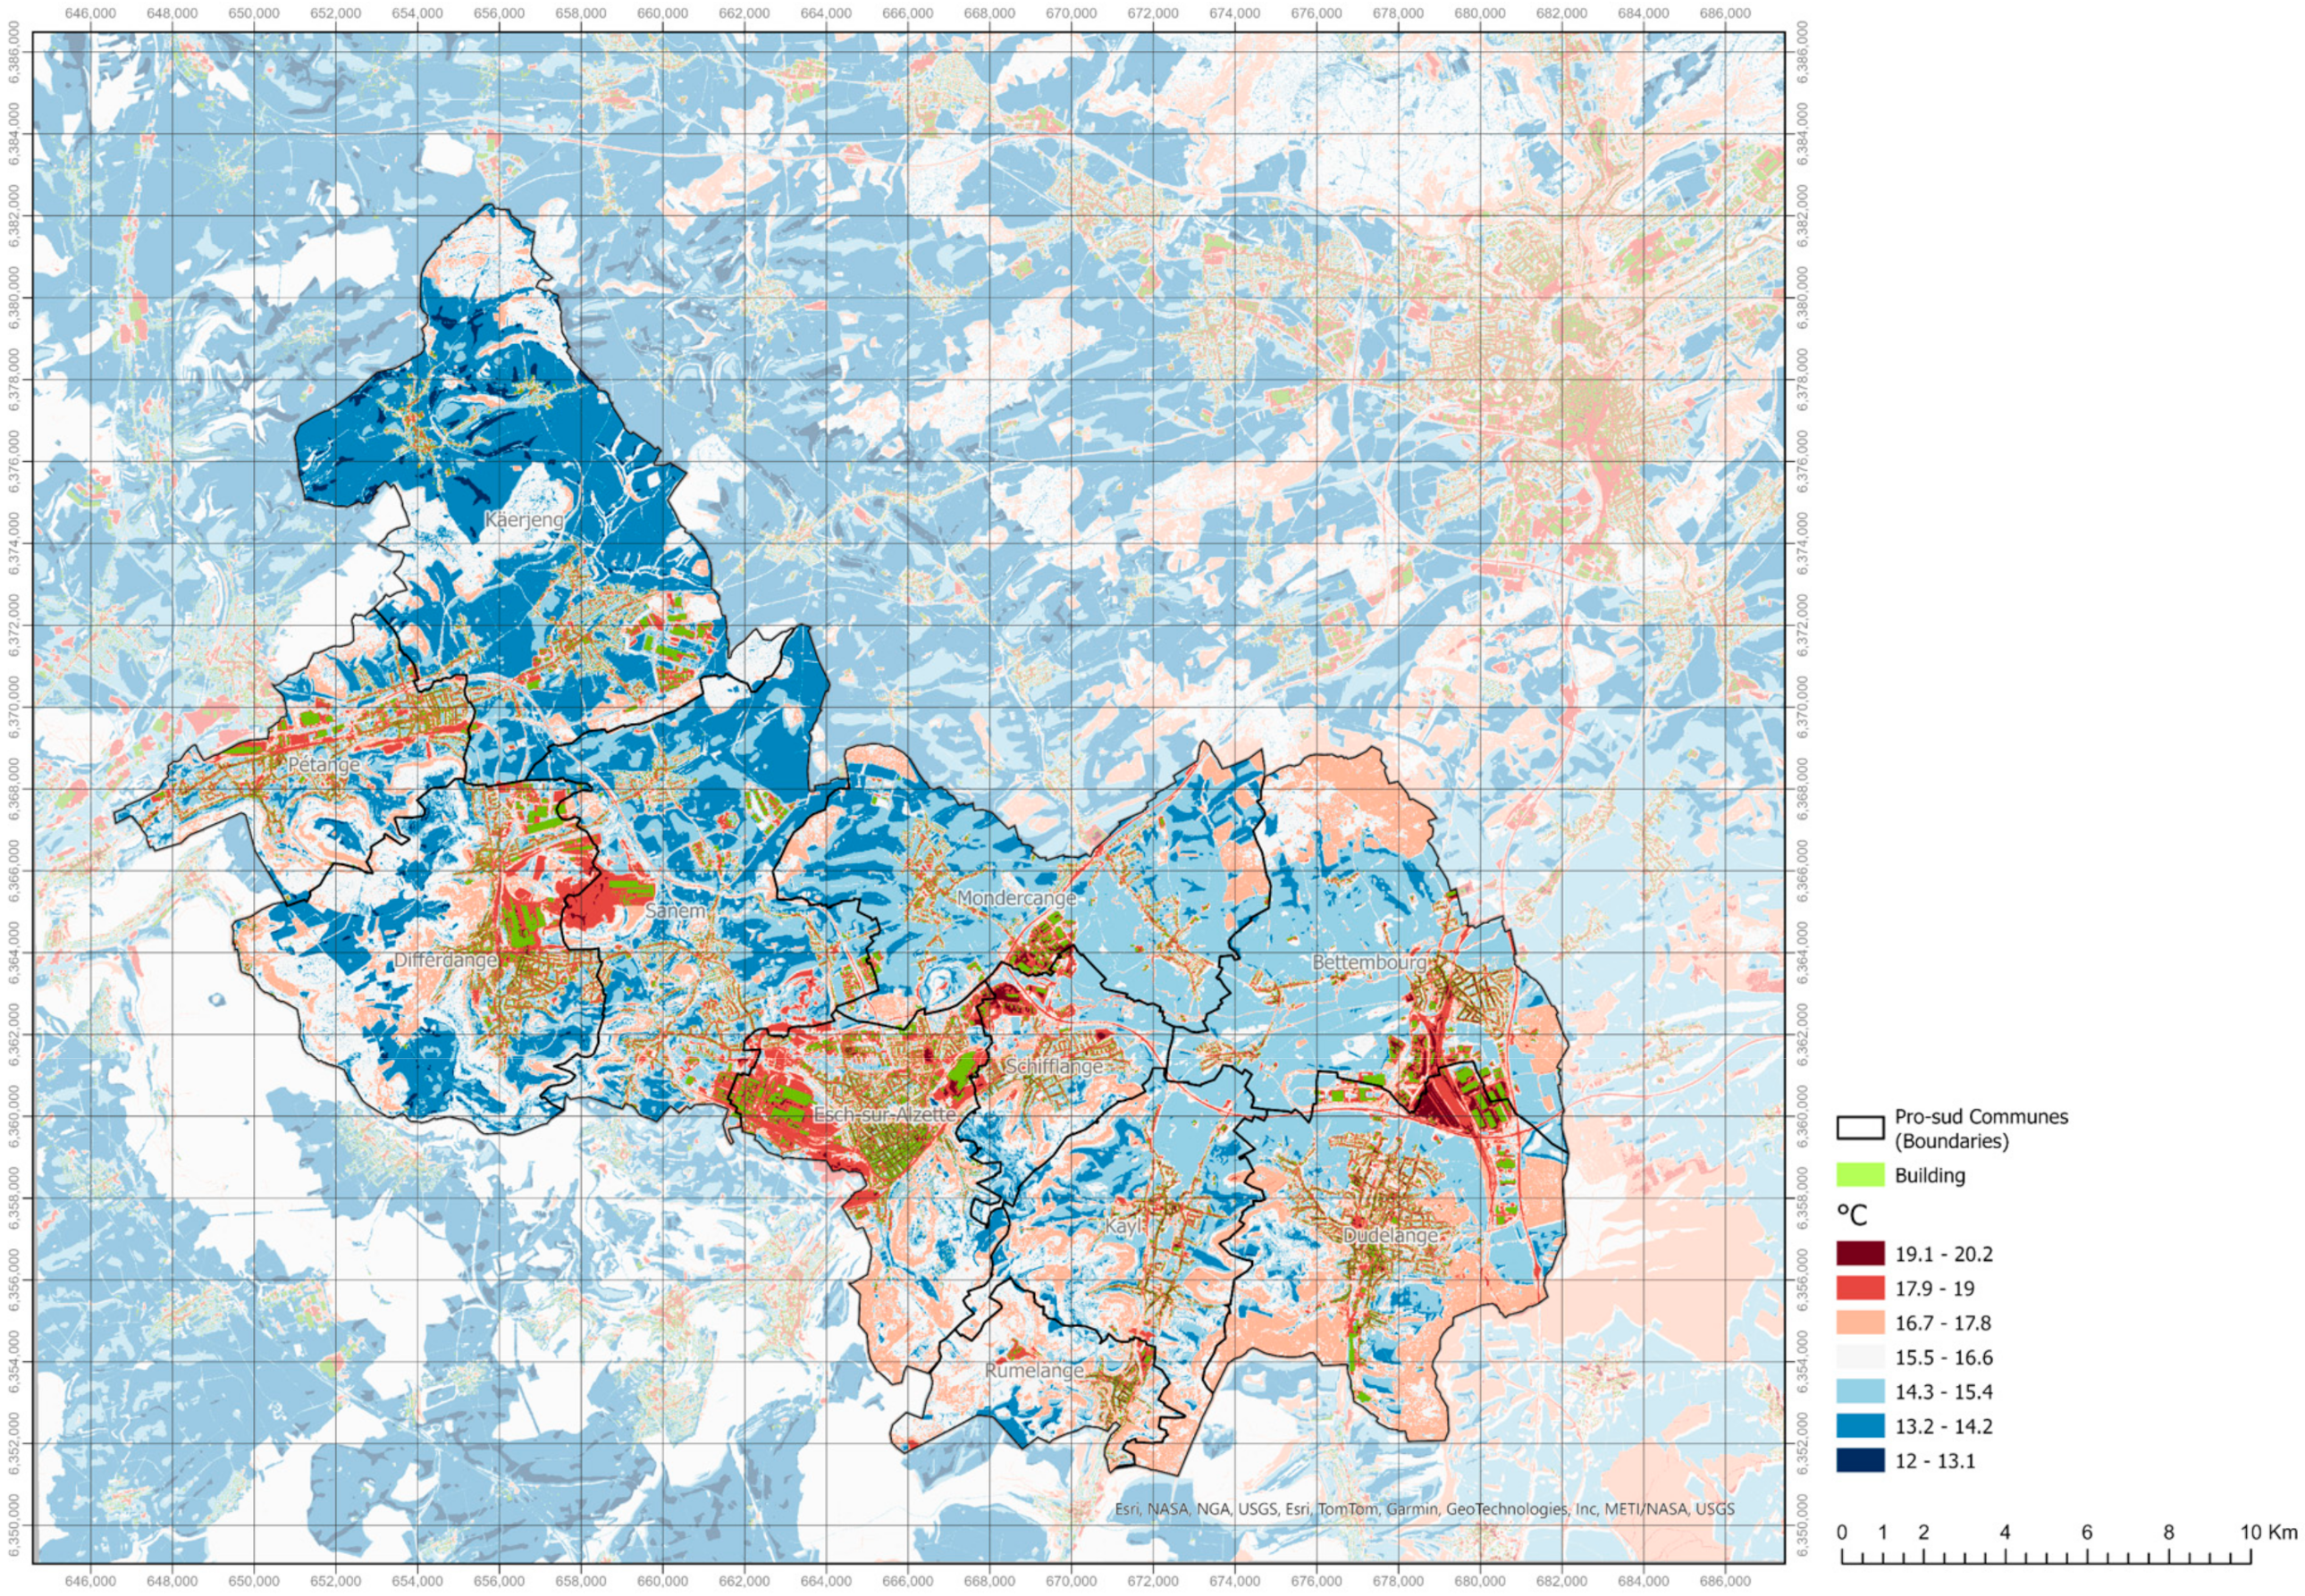
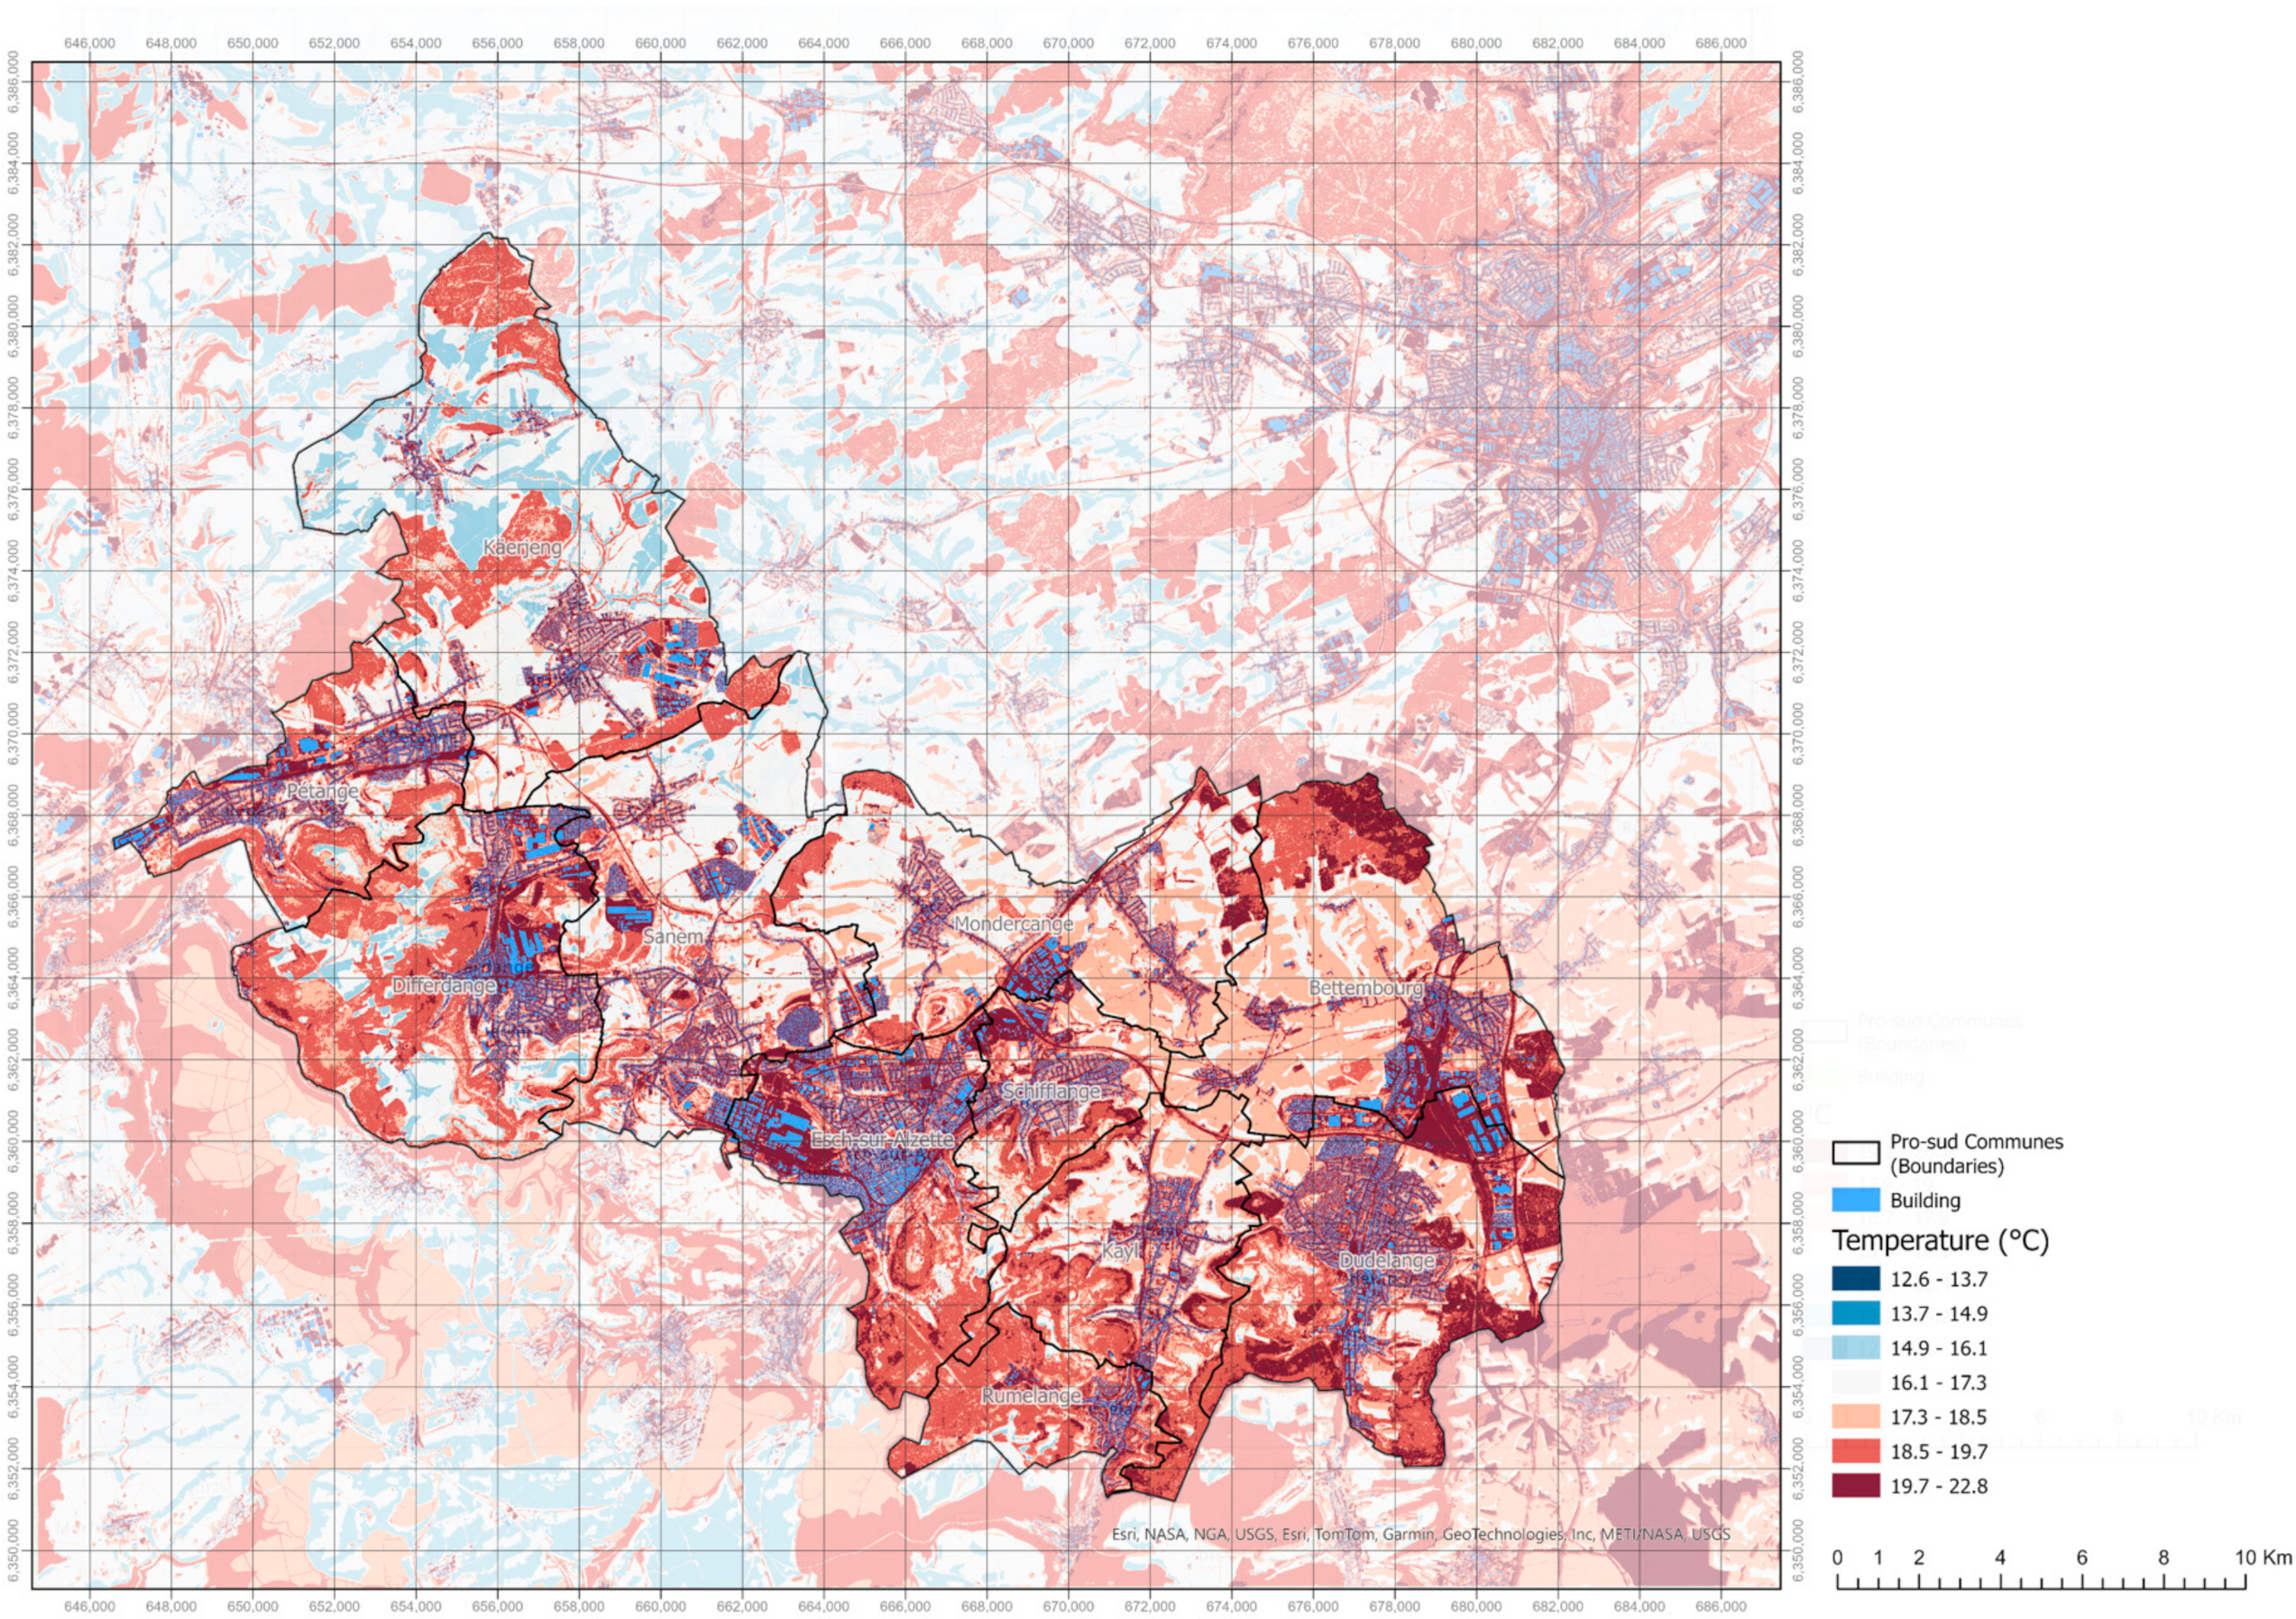
3.3. FITNAH-3D Model Results

The area under investigation (Pro-Sud) covers a total area of 201 km2 with a population of approximately 177,000 inhabitants. The future developments incorporated in this study indicate a significant increase in built-up areas, leading to profound changes in land use. The inhabited built-up area rises from 24 km2 by 21% to 29 km2, while the uninhabited built-up area increases from 13 km2 by 28% to 17 km2. Consequently, the share of the total built-up area in relation to the total area rises from 18.7% to a projected 23.1%. Since the total area remains constant, this comes at the expense of other land use classes. Green open spaces are particularly affected, decreasing from 96 km2 by 8.2% to 88 km2. Forest areas also show a decrease of 1.06% to 55 km2. The changes in land use mainly result from the conversion of unsealed areas into sealed ones, particularly for settlement purposes. All results for the complete Pro-Sud area can be found in the public archive at geoportail.lu. The results for the air temperature at 4 a.m. for the present and future climate conditions (Scenario II) are shown in Figure 5 and Figure 6.
In green and blue are indicated in both figures the areas where new construction activities are foreseen within the next years. A strong increase in the air temperature between the Status Quo and Scenario II can be observed. Especially in the densely populated and heavily sealed areas, this increase is more pronounced.
For a more detailed analysis, air temperatures at 4 a.m. were calculated for six land use classes and the three different scenarios and are presented by boxplots in Figure 7. As expected, the lowest median air temperatures (15.1 °C) were observed for the Status Quo scenario and the land use class green vegetation/spaces. Sealed traffic areas show the highest median air temperatures of 17.9 °C for the Status Quo. For Scenario I, a mean increase of 0.7 K with the lowest values for the water bodies (+0.6 K) and highest values for the uninhabited settlement areas (+1.1 K) are observed. The same trend in the differences (median increase of +2.7 K) can be observed for Scenario II with an increase of 2.2 K for water bodies and +3.0 K for the uninhabited settlement areas.
For a more detailed analysis, the northern part of Esch-sur-Alzette was chosen (Figure 8). Taking the planned new buildings into account, the area expands from the current 60 km2 by 10.04% to a projected area of 66 km2. In addition to the development of new residential areas, there is also an increase in density within the already existing areas. Currently, 41% of the total area is designated as green open spaces, while inhabited built-up areas account for 21.3%. In the future, the green open spaces will be reduced by 38%, while the inhabited built-up areas will increase by 17.1%. The main reason for these opposing developments is that nearly all planned land use changes will result in an expansion of built-up areas.

3.4. Selected Adaptation and Mitigation Measures

A selection of adaptation and mitigation measures to reduce the urban heat island effect, categorized by their mechanism of action, their effect on the urban environment, and their spatial implementation possibilities, are presented in Table 5. These measures, ranging from the micro-scale (in-door greening) to the macro-scale (large-scale green spaces), are crucial for enhancing the resilience of urban areas to rising temperatures and thermal stress driven by climate change. The effectiveness of these measures depends on several factors including the local climatic conditions, the urban morphology, and the scale of implementation. While some measures can be implemented individually by residents or businesses (e.g., in-door greening), others require more extensive, city-wide planning and investment (e.g., developing and optimising public green spaces). These measures provide a framework for urban planners and policymakers to strategically select and prioritize measures that best suit the specific needs and conditions of their communities. The selection of measures should be guided by a detailed assessment of the existing urban environment, considering factors such as building density, land cover types, prevailing wind patterns, and the availability of resources.

4. Discussion

This study investigated the urban heat island effect in Luxembourg’s Pro-Sud region, applying an integrated approach that combines field measurements, the FITNAH-3D urban climate model, and regional climate projections sourced from the EURO-CORDEX initiative. Figure 2, displaying daily mean air temperatures and temperature differences between urban and rural sites in Esch-sur-Alzette, reveals a distinct diurnal cycle and seasonal variations in UHI intensity. The larger temperature differences during warmer months are consistent with findings from numerous studies worldwide that demonstrate increased UHI effects during periods of high solar radiation and ambient temperatures [55,56]. The observed reduced temperature differences during the colder months also align with typical UHI behaviour, where the effect is often less pronounced due to reduced solar input and altered thermal properties of urban materials [57]. Our findings reveal a pronounced UHI intensity, with air temperature differences between urban and rural areas reaching values of 5.3 °C during peak periods (Figure 2). These results strongly corroborate the well-established phenomenon of elevated temperatures in urban settings compared to their surrounding rural counterparts [3,13,58,59]. Several contributing factors drive this UHI intensity, including the extensive sealed surface area of urban structures, the reduced albedo resulting from the dominant use of concrete and asphalt surfaces [2], and the substantial anthropogenic heat emissions from transportation, industrial processes, and energy consumption within the built environment.
UHI intensity, ideally measured by mobile measurements, offers essential insights into the spatial and temporal variations of urban temperatures compared to rural surroundings. These measurements are valuable because they capture real-time data across diverse urban landscapes, providing detailed mapping of temperature discrepancies caused by factors like building density, vegetation cover, and anthropogenic heat sources. Furthermore, these data sets combined with the long-term in situ measurements are a perfect data set for model validation. Figure 3 depicts the results of a night-time mobile measurement transect with the mobile air quality lab of LIST (Figure 1), showing the spatial heterogeneity of the UHI effect within Esch-sur-Alzette. This observation of a significant temperature gradient of more than 4 K between rural and urban areas is typical in UHI studies, reflecting the influence of land cover and surface properties on local temperature distributions. The magnitude of the temperature difference observed (4 °C) falls within the range reported in comparable studies conducted in other European cities [26,58]. Incorporating regional climate projections from EURO-CORDEX, specifically those associated with RCP4.5, allowed an assessment of projected future UHI conditions.
The RCP4.5 emission scenario is a moderate path for future greenhouse gas emissions and related climate change effects. It aims to stabilize the amount of energy trapped in the atmosphere at around 4.5 watts per square meter by 2100 through technological advancements, policies, and changes in behaviour to reduce greenhouse gas emissions. Strategies include increased energy efficiency, a shift to renewable energy sources, carbon capture and storage, sustainable land use, and reforestation. Our analysis revealed a substantial intensification of UHI effects under future climate scenarios, projecting a temperature increase of 2.1 K to 2.2 K for minimum and maximum annual temperatures, respectively, by the end of the 21st century for Luxembourg (Figure 4) [8]. This projected warming significantly exacerbates the UHI effect, thereby underscoring the imperative to implement robust adaptation and mitigation strategies within the urban landscape. Furthermore, the use of the 25th and 75th percentiles of the projected temperature data, rather than the ensemble mean, provides a more conservative yet realistic perspective on the potential range of future impacts.
Numerical urban mesoscale models such as FITNAH-3D are useful tools to answer urban climatological questions that can hardly be addressed by pure measurement campaigns. They can close the spatial and/or temporal gaps between the measurements on a physically sound basis, calculating additional meteorological variables and determining wind and temperature fields as well as thermal stress indices such as PET. The model calculations also offer the advantage that planning variants and compensatory measures can be studied in terms of their effect and efficiency, and optimized solutions can be found in this way [60]. An intercomparison of four different urban climate models including FITNAH-3D was recently published by Burger et al. highlighting the capabilities of FITNAH-3D to reproduce strong small-scale urban temperature gradients [61]. Figure 5 and Figure 6 show FITNAH-3D model results under current (Status Quo) and future (Scenario II) climate conditions and visualize the spatial patterns of air temperature and the projected intensification of the UHI under future climate scenarios. Forcing the FITNAH-3D model [62] with current and future climate boundary conditions as well as with the current and future building structure provided a detailed spatial resolution analysis of the UHI effect, showing clear temperature variations across diverse land use categories. The model results are consistent with many studies that have shown the importance of incorporating both urban morphology and climate change projections to accurately predict future UHI characteristics [63,64,65,66]. The pronounced increases in UHI intensity observed in the model simulations under Scenario II highlight the need for proactive urban planning and mitigation measures. The observed enhancement of UHI intensity under projected climate scenarios emphasizes the crucial need for tailored urban planning interventions at the local spatial scale. These interventions must focus on sustainable design principles and effective mitigation strategies to mitigate the increasing thermal stress experienced within urban areas. The boxplots in Figure 7 show air temperatures at 4 a.m. for six different land use categories and the three scenarios (Status Quo and two future scenarios), highlighting the differences in the modelled air temperature. The lower temperatures observed for green spaces compared to sealed surfaces concur with previous research [67], underscoring the importance of green infrastructure in mitigating UHI effects. The increased temperatures under future scenarios highlight the compounded effect of urbanization and climate change. The magnitude of the increase for water bodies being lower than that for sealed areas further supports the findings of previous studies [19]. Figure 8 visually demonstrates the changes in land use and built-up areas in a selected commune (Esch-sur-Alzette), showing an expansion of built-up areas and a reduction in green spaces for the two future scenarios. The impact of such land use changes is directly reflected in the increased UHI intensity with corresponding higher PET values.
Key strategies, including the incorporation of extensive green and blue infrastructure [68], the strategic selection of building materials with higher albedo values [69], and concerted efforts to reduce anthropogenic heat emissions [70], are listed in Table 5.
Their implementation, however, in the urban planning process requires a shift towards more sustainable practices that integrate ecological principles with efficient urban designs. Aspects of vegetation cover and its effects on the urban heat islands and environmental benefits are broadly discussed in the literature. Urban vegetation can cool cities between and has positive social, health, and economic effects. Temperature reductions depending on vegetation type and density between 1 °C and 5 °C are possible [71,72]. Several studies have shown that green roofs can reduce roof surface temperatures by up to 25 °C and ambient temperatures in surrounding areas by 1–3 °C during peak summer months [73,74,75,76]. Related to the suggested measures to increase the presence of water bodies (Table 5), a recent study by Qiao et al. highlighted the importance of the relationship between water body characteristics and their cooling effects [77]. Especially due to the projected changes in future precipitation patterns with related increasing drought conditions, the importance of blue infrastructure within urban areas will constantly increase [78,79].
Our study provides a valuable contribution to understanding the UHI intensity in Luxembourg under current and future climate conditions. Nevertheless, some limitations warrant acknowledgement. Due to computational constraints, only one RCP could be used for the forcing of the urban climate model, and due to the same reason, an ensemble approach was not suitable for the urban modelling approach.
The time frame for the in situ measurements covered only one year, limiting the range of captured seasonal and inter-annual variability in UHI behaviour. Nevertheless, a short comparison with the time series from an official meteorological station in Luxemburg (WMO ID = 06590) showed that 2024 was no extraordinary year in terms of thermal stress levels. Future research should include extended field campaigns spanning multiple years, incorporating diverse climatic conditions and expanding the geographical scope of analysis to encompass a broader range of urban settings within Luxembourg and other geographical regions with similar climatic characteristics.

5. Conclusions

Our study comprehensively assessed the UHI effect in Luxembourg’s Pro-Sud region, integrating field measurements, urban modelling, and climate projections. The results show a significant and intensifying UHI, with substantial thermal stress differences and projected increases under future climate conditions. The integrated approach provided a more complete understanding of UHI dynamics than single methodologies. While limitations still exist (e.g., measurement duration), this research offers valuable insights for developing adaptation and mitigation strategies emphasising green infrastructure and sustainable urban planning. Further research should investigate (a) how artificial intelligence could support the selection of tailored urban design features (e.g., building density, material properties, and green spaces) and influence the spatial and temporal variability of the UHI effect and (b) the long-term socio-economic impacts of an intensified UHI and how can these be addressed in a more efficient way.

Author Contributions

Conceptualization, J.J. and A.M.; methodology, E.H. and R.L.; validation, I.T.; formal analysis, R.L., J.A.T.-M. and J.J.; measurements, C.L. and I.T.; investigation, writing—original draft preparation, J.J.; writing—review and editing, J.J. and A.M.; visualization, E.H., J.J. and R.L.; funding acquisition, J.J. All authors have read and agreed to the published version of the manuscript.

Funding

This research was funded by Pro-ProSud (Luxembourg). Parts of this research were funded by Ministère de l’Environnement, du Climat et du Développement durable of Luxembourg, in the framework of the CHAPEL project (https://www.list.lu/en/environment/project/chapel/ accessed on 15 January 2024).

Institutional Review Board Statement

Not applicable.

Informed Consent Statement

Not applicable.

Data Availability Statement

The CORDEX Regional Climate Model data are available from the Copernicus Climate Data Store, https://doi-org.proxy.bnl.lu/10.24381/cds.bc91edc3 (accessed on 15 January 2025). The results of the FITNAH-3D model are available at https://www.geoportail.lu/de/ (accessed on 15 April 2025).

Conflicts of Interest

The authors declare no conflicts of interest.

References

  1. Balchin, W.G.V.; Pye, N. A micro-climatological investigation of bath and the surrounding district. Q. J. R. Meteorol. Soc. 1947, 73, 317–318. [Google Scholar] [CrossRef]
  2. Schwarz, N.; Schlink, U.; Franck, U.; Großmann, K. Relationship of land surface and air temperatures and its implications for quantifying urban heat island indicators—An application for the city of Leipzig (Germany). Ecol. Indic. 2012, 18, 693–704. [Google Scholar] [CrossRef]
  3. Oke, T.R.; Mills, G.; Christen, A.; Voogt, J.A. Urban Climates; Cambridge University Press: Cambridge, UK, 2017. [Google Scholar]
  4. Wang, A.; Li, X.-X.; Xin, R.; Chew, L.W. Impact of Anthropogenic Heat on Urban Environment: A Case Study of Singapore with High-Resolution Gridded Data. Atmosphere 2023, 14, 1499. [Google Scholar] [CrossRef]
  5. Shahmohamadi, P.; Che-Ani, A.I.; Maulud, K.N.A.; Tawil, N.M.; Abdullah, N.A.G.; Skaburskis, A. The Impact of Anthropogenic Heat on Formation of Urban Heat Island and Energy Consumption Balance. Urban Stud. Res. 2011, 2011, 497524. [Google Scholar] [CrossRef]
  6. IPCC. Climate Change 2023: Synthesis Report; Contribution of Working Groups I, II and III to the Sixth Assessment Report of the Intergovernmental Panel on Climate Change; IPCC: Geneva, Switzerland, 2023; pp. 35–115. [Google Scholar]
  7. WMO. State of the Global Climate 2024; World Meteorological Organization: Geneva, Swizerland, 2025. [Google Scholar]
  8. Junk, J.; Sulis, M.; Trebs, I.; Torres-Matallana, J.A. Evaluating the Present and Future Heat Stress Conditions in the Grand Duchy of Luxembourg. Atmosphere 2024, 15, 112. [Google Scholar] [CrossRef]
  9. Masselot, P.; Mistry, M.; Vanoli, J.; Schneider, R.; Iungman, T.; Garcia-Leon, D.; Ciscar, J.C.; Feyen, L.; Orru, H.; Urban, A.; et al. Excess mortality attributed to heat and cold: A health impact assessment study in 854 cities in Europe. Lancet Planet Health 2023, 7, e271–e281. [Google Scholar] [CrossRef]
  10. Pietrapertosa, F.; Olazabal, M.; Simoes, S.G.; Salvia, M.; Fokaides, P.A.; Ioannou, B.I.; Viguié, V.; Spyridaki, N.-A.; De Gregorio Hurtado, S.; Geneletti, D.; et al. Adaptation to climate change in cities of Mediterranean Europe. Cities 2023, 140, 104452. [Google Scholar] [CrossRef]
  11. Masson, V.; Lemonsu, A.; Hidalgo, J.; Voogt, J. Urban climates and climate change. Annu. Rev. Environ. Resour. 2020, 45, 411–444. [Google Scholar] [CrossRef]
  12. Karwat, A.; Franzke, C.L. Future projections of heat mortality risk for major European cities. Weather Clim. Soc. 2021, 13, 913–931. [Google Scholar] [CrossRef]
  13. Possega, M.; Aragao, L.; Ruggieri, P.; Santo, M.A.; Di Sabatino, S. Observational evidence of intensified nocturnal urban heat island during heatwaves in European cities. Environ. Res. Lett. 2022, 17, 124013. [Google Scholar] [CrossRef]
  14. Batur, I.; Markolf, S.A.; Chester, M.V.; Middel, A.; Hondula, D.M.; Vanos, J. Street-level heat and air pollution exposure informed by mobile sensing. Transp. Res. Part D Transp. Environ. 2022, 113, 103535. [Google Scholar] [CrossRef]
  15. Bonn, B.; von Schneidemesser, E.; Andrich, D.; Quedenau, J.; Gerwig, H.; Lüdecke, A.; Kura, J.; Pietsch, A.; Ehlers, C.; Klemp, D.; et al. BAERLIN2014—The influence of land surface types on and the horizontal heterogeneity of air pollutant levels in Berlin. Atmos. Chem. Phys. 2016, 16, 7785–7811. [Google Scholar] [CrossRef]
  16. Brandsma, T.; Wolters, D. Measurement and Statistical Modeling of the Urban Heat Island of the City of Utrecht (the Netherlands). J. Appl. Meteorol. Climatol. 2012, 51, 1046–1060. [Google Scholar] [CrossRef]
  17. Brown, M.J.; Ivey, A.; McPherson, T.N.; Boswell, D.; Pardyjak, E.R. A Study of the Oklahoma City Urban Heat Island Using Ground Measurements and Remote Sensing; U.S. Department of Energy Office of Scientific and Technical Information: Oak Ridge, TN, USA, 2004.
  18. Chàfer, M.; Tan, C.L.; Cureau, R.J.; Hien, W.N.; Pisello, A.L.; Cabeza, L.F. Mobile measurements of microclimatic variables through the central area of Singapore: An analysis from the pedestrian perspective. Sustain. Cities Soc. 2022, 83, 103986. [Google Scholar] [CrossRef]
  19. Heusinkveld, B.G.; van Hove, L.W.A.; Jacobs, C.M.J.; Steeneveld, G.J.; Elbers, J.A.; Moors, E.J.; Holtslag, A.A.M. Use of a mobile platform for assessing urban heat stress in Rotterdam. In Proceedings of the 7th Conference on Biometeorology, Freiburg, Germany, 12–14 April 2010. [Google Scholar]
  20. Husni, E.; Prayoga, G.A.; Tamba, J.D.; Retnowati, Y.; Fauzandi, F.I.; Yusuf, R.; Yahya, B.N. Microclimate investigation of vehicular traffic on the urban heat island through IoT-Based device. Heliyon 2022, 8, e11739. [Google Scholar] [CrossRef]
  21. Kousis, I.; Pigliautile, I.; Pisello, A.L. Intra-urban microclimate investigation in urban heat island through a novel mobile monitoring system. Sci. Rep. 2021, 11, 9732. [Google Scholar] [CrossRef]
  22. Kousis, I.; Manni, M.; Pisello, A.L. Environmental mobile monitoring of urban microclimates: A review. Renew. Sustain. Energy Rev. 2022, 169, 112847. [Google Scholar] [CrossRef]
  23. Kousis, I.; Pigliautile, I.; Pisello, A.L. A Mobile Vehicle-Based Methodology for Dynamic Microclimate Analysis. Int. J. Environ. Res. 2021, 15, 893–901. [Google Scholar] [CrossRef]
  24. Machado, J.A.; de Azevedo, T.R. Detection of the urban heat-Island effect from a surface mobile platform. Rev. Teledetección 2007, 27, 59–70. [Google Scholar]
  25. Oke, T.R.; Maxwell, G.B. Urban heat island dynamics in Montreal and Vancouver. Atmos. Environ. 1975, 9, 191–200. [Google Scholar] [CrossRef]
  26. Romero Rodríguez, L.; Sánchez Ramos, J.; Molina Félix, J.L.; Álvarez Domínguez, S. Urban-scale air temperature estimation: Development of an empirical model based on mobile transects. Sustain. Cities Soc. 2020, 63, 102471. [Google Scholar] [CrossRef]
  27. Sharifi, E.; Soltani, A. Patterns of Urban Heat Island Effect in Adelaide: A Mobile Traverse Experiment. Mod. Appl. Sci. 2017, 11, 80–90. [Google Scholar] [CrossRef]
  28. Shi, R.; Hobbs, B.; Zaitchik, B.; Waugh, D.; Scott, A.; Zhang, Y. Monitoring intra-urban temperature with dense sensor networks: Fixed or mobile? An empirical study in Baltimore, MD. Urban Clim. 2021, 39, 100979. [Google Scholar] [CrossRef]
  29. Stewart, I.D. A systematic review and scientific critique of methodology in modern urban heat island literature. Int. J. Climatol. 2011, 31, 200–217. [Google Scholar] [CrossRef]
  30. Sun, C.-Y.; Kato, S.; Gou, Z. Application of Low-Cost Sensors for Urban Heat Island Assessment: A Case Study in Taiwan. Sustainability 2019, 11, 2759. [Google Scholar] [CrossRef]
  31. Taha, H.; Levinson, R.; Mohegh, A.; Gilbert, H.; Ban-Weiss, G.; Chen, S.C. Air-Temperature Response to Neighborhood-Scale Variations in Albedo and Canopy Cover in the Real World: Fine-Resolution Meteorological Modeling and Mobile Temperature Observations in the Los Angeles Climate Archipelago. Climate 2018, 6, 53. [Google Scholar] [CrossRef]
  32. Voelkel, J.; Shandas, V. Towards Systematic Prediction of Urban Heat Islands: Grounding Measurements, Assessing Modeling Techniques. Climate 2017, 5, 41. [Google Scholar] [CrossRef]
  33. Yin, Y.; Grundstein, A.; Mishra, D.; Hashemi, N.; Lakshmish, L.A. A mobile sensor-based Approach for Analyzing and Mitigating Urban Heat Hazards. In Proceedings of the EGU General Assembly, Vienna, Austria, 3–8 May 2020. [Google Scholar]
  34. Yin, Y.; Hashemi Tonekaboni, N.; Grundstein, A.; Mishra, D.; Ramaswamy, L.; Dowd, J. Urban ambient air temperature estimation using hyperlocal data from smart vehicle-borne sensors. Comput. Environ. Urban Syst. 2020, 84, 101538. [Google Scholar] [CrossRef]
  35. Zeynali, R.; Bitelli, G.; Mandanici, E. Mobile data acquisition and processing in support of an urban heat island study. Int. Arch. Photogramm. Remote Sens. Spat. Inf. Sci. 2023, XLVIII-1/W1-2023, 563–569. [Google Scholar] [CrossRef]
  36. Tehrani, A.A.; Veisi, O.; Kia, K.; Delavar, Y.; Bahrami, S.; Sobhaninia, S.; Mehan, A. Predicting urban Heat Island in European cities: A comparative study of GRU, DNN, and ANN models using urban morphological variables. Urban Clim. 2024, 56, 102061. [Google Scholar] [CrossRef]
  37. Santos Nouri, A.; Costa, J.P.; Santamouris, M.; Matzarakis, A. Approaches to Outdoor Thermal Comfort Thresholds through Public Space Design: A Review. Atmosphere 2018, 9, 108. [Google Scholar] [CrossRef]
  38. Tanoori, G.; Soltani, A.; Modiri, A. Machine Learning for Urban Heat Island (UHI) Analysis: Predicting Land Surface Temperature (LST) in Urban Environments. Urban Clim. 2024, 55, 101962. [Google Scholar] [CrossRef]
  39. Li, F.; Yigitcanlar, T.; Nepal, M.; Nguyen, K.; Dur, F. Machine Learning and Remote Sensing Integration for Leveraging Urban Sustainability: A Review and Framework. Sustain. Cities Soc. 2023, 96, 104653. [Google Scholar] [CrossRef]
  40. Piani, C.; Haerter, J.; Coppola, E. Statistical bias correction for daily precipitation in regional climate models over Europe. Theor. Appl. Climatol. 2010, 99, 187–192. [Google Scholar] [CrossRef]
  41. Junk, J.; Torres, A.; El Jaroudi, M.; Eickermann, M. Impact of Climate Change on the Phenology of Winter Oilseed Rape (Brassica napus L.). Agriculture 2024, 14, 1049. [Google Scholar] [CrossRef]
  42. Molitor, D.; Junk, J. Climate change is implicating a two-fold impact on air temperature increase in the ripening period under the conditions of the Luxembourgish grape growing region. OENO One 2019, 53, 409–422. [Google Scholar] [CrossRef]
  43. Rajczak, J.; Pall, P.; Schär, C. Projections of extreme precipitation events in regional climate simulations for Europe and the Alpine Region. J. Geophys. Res. Atmos. 2013, 118, 3610–3626. [Google Scholar] [CrossRef]
  44. R Core Team. R: A Language and Environment for Statistical Computing; R Foundation for Statistical Computing: Vienna, Austria, 2023. [Google Scholar]
  45. Gudmundsson, L. Qmap: Statistical Transformations for Post-Processing Climate Model Output, R Package Version 1.0-4; R Core Team: Vienna, Austria, 2016. [Google Scholar]
  46. GEO-NET. Analysis of Climate-Ecological Functions and Processes for the Area of the Canton of Zurich; GEO-NET: Hannover, Germany, 2018; p. 98. [Google Scholar]
  47. GEO-NET. Climate-Ecological Situation in the Canton of Geneva: Model-Based Climate Analysis; GEO-NET: Hannover, Germany, 2020; p. 83. [Google Scholar]
  48. GEO-NET. Climate-Ecological Situation of the City of Bern: Model-Based Climate Analysis; GEO-NET: Hannover, Germany, 2023; p. 65. [Google Scholar]
  49. Puntub, W.; Tanja, S.; Mark, F.; Jörn, B.; Matthias, G.; Simone, S.; and Wannewitz, M. Linking science and practice in participatory future-oriented assessment and planning of human heat stress vulnerability in Bonn, Germany. J. Environ. Plan. Manag. 2023, 66, 1918–1937. [Google Scholar] [CrossRef]
  50. Hurley, A.G.; Heinrich, I. Assessing urban-heating impact on street tree growth in Berlin with open inventory and environmental data. Urban Ecosyst. 2023, 27, 359–375. [Google Scholar] [CrossRef]
  51. VDI. VDI-Richtlinie 3783, Bl.7: Environmental Meteorology—Prognostic Mesoscale Wind Field Models—Evaluation for Dynamically and Thermally Induced Flow Fields; VDI: Mandaluyong, Philippines, 2017; p. 83. [Google Scholar]
  52. Gross, G. Results of supercomputer simulations of meteorological mesoscale phenomena. Fluid Dyn. Res. 1992, 10, 483–498. [Google Scholar] [CrossRef]
  53. Lee, J.; Kim, S. Modeling Urban Temperature Using Measurements from Mobile and Stationary Monitoring Stations. Sustainability 2024, 16, 8897. [Google Scholar] [CrossRef]
  54. Martinez-Soto, A.; Vera-Fonseca, M.; Valenzuela-Toledo, P.; Melillan-Raguileo, A.; Shupler, M. Heat on the Move: Contrasting Mobile and Fixed Insights into Temuco’s Urban Heat Islands. Sensors 2025, 25, 1251. [Google Scholar] [CrossRef] [PubMed]
  55. Xin, J.; Yang, J.; Wang, L.-E.; Jin, C.; Xiao, X.; Xia, J. Seasonal differences in the dominant factors of surface urban heat islands along the urban-rural gradient. Front. Environ. Sci. 2022, 10, 974811. [Google Scholar] [CrossRef]
  56. Sismanidis, P.; Bechtel, B.; Perry, M.; Ghent, D. The seasonality of surface urban heat islands across climates. Remote Sens. 2022, 14, 2318. [Google Scholar] [CrossRef]
  57. Giridharan, R.; Kolokotroni, M. Urban heat island characteristics in London during winter. Sol. Energy 2009, 83, 1668–1682. [Google Scholar] [CrossRef]
  58. Junk, J.; Helbig, A.; Lüers, J. Urban climate and air quality at Trier, Germany. Int. J. Biometeorol. 2003, 47, 230–238. [Google Scholar] [CrossRef]
  59. Rizwan, A.; Dennis, L.; Liu, C. A review on the generation, determination and mitigation of Urban Heat Island. J. Environ. Sci. 2008, 20, 120–128. [Google Scholar] [CrossRef]
  60. Nieuwenhuijsen, M.J. New urban models for more sustainable, liveable and healthier cities post COVID-19; reducing air pollution, noise and heat island effects and increasing green space and physical activity. Environ. Int. 2021, 157, 106850. [Google Scholar] [CrossRef]
  61. Burger, M.; Gubler, M.; Holtmann, A.; Brönnimann, S. Spoilt for choice—Intercomparison of four different urban climate models. Urban Clim. 2024, 58, 102166. [Google Scholar] [CrossRef]
  62. Frenzen, G. Documentation of the Regional Climate Model Based on FITNAH; DFVLR: Cologne, Germany, 1987.
  63. Zhou, B.; Rybski, D.; Kropp, J.P. On the statistics of urban heat island intensity. Geophys. Res. Lett. 2013, 40, 5486–5491. [Google Scholar] [CrossRef]
  64. Ward, K.; Lauf, S.; Kleinschmit, B.; Endlicher, W. Heat waves and urban heat islands in Europe: A review of relevant drivers. Sci. Total Environ. 2016, 569, 527–539. [Google Scholar] [CrossRef] [PubMed]
  65. Theeuwes, N.E.; Steeneveld, G.J.; Ronda, R.J.; Holtslag, A.A. A diagnostic equation for the daily maximum urban heat island effect for cities in northwestern Europe. Int. J. Climatol. 2017, 37, 443–454. [Google Scholar] [CrossRef]
  66. Lauwaet, D.; De Ridder, K.; Saeed, S.; Brisson, E.; Chatterjee, F.; van Lipzig, N.P.; Maiheu, B.; Hooyberghs, H. Assessing the current and future urban heat island of Brussels. Urban Clim. 2016, 15, 1–15. [Google Scholar] [CrossRef]
  67. Shao, H.; Kim, G. A comprehensive review of different types of green infrastructure to mitigate urban heat islands: Progress, functions, and benefits. Land 2022, 11, 1792. [Google Scholar] [CrossRef]
  68. Veerkamp, C.J.; Schipper, A.M.; Hedlund, K.; Lazarova, T.; Nordin, A.; Hanson, H.I. A review of studies assessing ecosystem services provided by urban green and blue infrastructure. Ecosyst. Serv. 2021, 52, 101367. [Google Scholar] [CrossRef]
  69. Irfeey, A.M.M.; Chau, H.-W.; Sumaiya, M.M.F.; Wai, C.Y.; Muttil, N.; Jamei, E. Sustainable mitigation strategies for urban heat island effects in urban areas. Sustainability 2023, 15, 10767. [Google Scholar] [CrossRef]
  70. Degirmenci, K.; Desouza, K.C.; Fieuw, W.; Watson, R.T.; Yigitcanlar, T. Understanding policy and technology responses in mitigating urban heat islands: A literature review and directions for future research. Sustain. Cities Soc. 2021, 70, 102873. [Google Scholar] [CrossRef]
  71. Gherri, B. The Role of Urban Vegetation in Counteracting Overheating in Different Urban Textures. Land 2023, 12, 2100. [Google Scholar] [CrossRef]
  72. Newman, P. Biophilic urbanism: A case study on Singapore. Aust. Plan. 2014, 51, 47–65. [Google Scholar] [CrossRef]
  73. Cascone, S.; Vitaliano, S. Innovative green roof technologies in Mediterranean climate: Implications for sustainable design of the built environment. Build. Environ. 2025, 273, 112715. [Google Scholar] [CrossRef]
  74. Wang, Y.; Wang, Z.H.; Rahmatollahi, N.; Hou, H. The impact of roof systems on cooling and building energy efficiency. Appl. Energy 2024, 376, 124339. [Google Scholar] [CrossRef]
  75. de Oliveira Santos, T.D.; Pacheco, F.A.L.; Fernandes, L.F.S. A systematic analysis on the efficiency and sustainability of green facades and roofs. Sci. Total Environ. 2024, 932, 173107. [Google Scholar] [CrossRef] [PubMed]
  76. Aggarwal, C.; Molleti, S. State-of-the-Art Review: Effects of Using Cool Building Cladding Materials on Roofs. Buildings 2024, 14, 2257. [Google Scholar] [CrossRef]
  77. Qiao, Y.; Sun, H.; Qi, J.; Liu, S.; Li, J.; Ji, Y.; Wang, H.; Peng, Y. Examining water bodies’ cooling effect in urban parks with buffer analysis and random forest regression. Urban Clim. 2025, 59, 102301. [Google Scholar] [CrossRef]
  78. Gupta, A.; De, B.; Das, S.; Mukherjee, M. Thermal hazards in urban spaces: A review of climate-resilient planning and design to reduce the heat stress. Urban. Clim. 2025, 59, 102296. [Google Scholar] [CrossRef]
  79. Gupta, A.; De, B. Blue space resilient urban planning to enhance severely distressed thermal environment. Phys. Chem. Earth Parts A/B/C 2025, 137, 103804. [Google Scholar] [CrossRef]
Figure 1. Environmental measurement vehicle (EMV) of the Luxembourg Institute of Science and Technology (LIST).
Atmosphere 16 00462 g001
Figure 2. Daily averages of air temperature between the rural and city locations at Esch-sur-Alzette (lower part of the figure) as well as daily and hourly differences between rural and city (upper part of the figure), period 1 July 2023–22 May 2024.
Atmosphere 16 00462 g002
Figure 3. Results of a night-time profile measurement drive in Esch-zur-Alzette on 1 February 2024 (22:12–22:41) with start and end points at Ellergronn. The temperature scale shows measured air temperatures (Tempt1) in the range of 0.37 °C and 4.4 °C.
Atmosphere 16 00462 g003
Figure 4. Left side of each figure: time series of the multi-model ensemble of (a) maximum annual, (b) minimum annual, and (c) mean annual air temperatures for the RCP45 scenario. The spread (shaded grey area) is defined by ±one standard deviation of the ensemble. Additionally, the means of the 30-year time slices (reference period (REF) 1971–1990, near future (NF) 2021–2050, and far future (FF) 2070–2099) are presented as red lines. Right side of each figure: boxplots of daily values for REF, NF, and FF. The whiskers extend to 1.5 times the interquartile range. Data points outside this range are represented as individual red dots.
Atmosphere 16 00462 g004
Figure 5. Results of the FITNAH-3D Model for the Pro-Sud region for current climate conditions (Status Quo). Air temperature at 4 a.m. Areas where future building activities are foreseen are shown in green. Black lines indicate the borders of the individual communes (administrative units).
Atmosphere 16 00462 g005
Figure 6. Results of the FITNAH-3D model for the Pro-Sud region for future climate conditions (Scenario II). Air temperature at 4 a.m. Areas where future building activities are foreseen are shown in blue. Black lines indicate borders of the individual communes (administrative units).
Atmosphere 16 00462 g006
Figure 7. Boxplots of the three different scenarios (blue = Status Quo; green = Scenario I (weak climate change), and orange = Scenario II (strong climate change)) for RCP45 and different land use classes. The boxplots were created as follows: The lower and upper hinges correspond to the first and third quartiles of the data. The upper and lower whisker extends from the hinge to the largest and lowest value no further than 1.5 times the Inter-Quartile Range. Data beyond the end of the whiskers are outliers and are plotted individually as black dots.
Atmosphere 16 00462 g007
Figure 8. Results of the FITNAH-3D model for PET value for the commune of Esch-sur-Alzette for the Status Quo (a) and future Scenario II (b) at 4 a.m.
Atmosphere 16 00462 g008
Table 1. Selected studies using different kinds of mobile measurements for the assessment of the urban heat island.
AuthorYearTitleAbstract Summary
Batur, I., Markolf, S.A., Chester, M.V., et al. [14]2022Street-level heat and air pollution exposure informed by mobile sensingMobile sensors on public transportation vehicles were used to measure fine-scale urban heat and air pollution.
Bonn, B., von Schneidemesser, E., Andrich, D., et al. [15]2016BAERLIN2014—the influence of land surface types on and the horizontal heterogeneity of air pollutant levels in BerlinThe paper describes mobile urban heat island measurements using bicycle, van, and airborne platforms to quantify the impact of urban vegetation on air pollutant levels.
Brandsma, T., Wolters, D. [16]2012Measurement and Statistical Modeling of the Urban Heat Island of the City of Utrecht (the Netherlands)The paper describes a mobile bicycle-based system for measuring urban microclimate data to study the urban heat island effect.
Brown, M.J., Ivey, A., McPherson, T.N., et al. [17]2004A study of the Oklahoma City urban heat island using ground measurements and remote sensingThe paper describes mobile urban heat island measurements with a vehicle in Oklahoma City and uses remote sensing to analyse temperature variations across land use types.
Chàfer, M., Tan, C.L., Cureau, R.J., et al. [18]2022Mobile measurements of microclimatic variables through the central area of Singapore: an analysis from the pedestrian perspectiveMobile measurements of microclimate variables in Singapore’s central area reveal the impact of urban morphology on the urban heat island effect.
Heusinkveld, B., Hove, B., Jacobs, C., et al. [19]2010Use of a mobile platform for assessing urban heat stress in RotterdamMobile measurements using a cargo bicycle platform assessed the urban heat island intensity and the cooling effects of urban parks and greenery in Rotterdam.
Husni, E., Prayoga, G.A., Tamba, J.D., et al. [20]2022Microclimate investigation of vehicular traffic on the urban heat island through IoT-Based deviceThis paper investigates the impact of vehicular traffic on the urban heat island using IoT-based sensors and traffic data.
Kousis, I., Pigliautile, I., Pisello, A.L. [21]2021Intra-urban microclimate investigation in urban heat island through a novel mobile monitoring systemThe paper presents a novel mobile monitoring (van) system for investigating intra-urban microclimate and urban heat island effects.
Kousis, I.,Manni, M.Pisello, A.L. [22]2022Environmental mobile monitoring of urban microclimates: A reviewThis review examines mobile monitoring systems using motorized and non-motorized vehicles to measure urban microclimates, air quality, light, and noise pollution.
Kousis, I., Pigliautile, I., Pisello, A.L. [23]2021A Mobile Vehicle-Based Methodology for Dynamic Microclimate AnalysisThis paper presents a vehicle-based methodology for monitoring microclimate conditions in urban areas.
Machado, J.A., de Azevedo, T.R. [24]2007Detection of the urban heat-island effect form a surface mobile platform The paper measures the urban heat island effect in Sao Paulo using a mobile platform with infrared thermometers.
Oke, T.R., Maxwell, G.B. [25]1975Urban heat island dynamics in Montreal and VancouverThe paper used automobile traverses to measure urban heat island dynamics in Montreal and Vancouver.
Rodriguez, L.R., Ramos, J.S., Flor, F.J.S., et al. [26]2020Analyzing the urban heat Island: Comprehensive methodology for data gathering and optimal design of mobile transectsThe paper proposes a methodology for conducting mobile urban heat island measurements using a vehicle.
Sharifi, E., Soltani, A. [27]2017Patterns of Urban Heat Island Effect in Adelaide: A Mobile Traverse Experiment The paper conducted mobile urban heat island measurements in Adelaide, Australia using vehicle traverses.
Shi, R., Hobbs, B., Zaitchik, B., et al. [28]2021Monitoring intra-urban temperature with dense sensor networks: Fixed or mobile? An empirical study in Baltimore, MDVehicle-based mobile monitoring alone does not fully capture intra-urban temperature variability compared to a fixed sensor network.
Stewart, I.D. [29]2011A systematic review and scientific critique of methodology in modern urban heat island literatureThis paper critically discusses the methodological quality of urban heat island studies in the period from 1950 until –2007.
Sun, C.Y, Kato, S., Gou, Z. [30]2019Application of Low-Cost Sensors for Urban Heat Island Assessment: A Case Study in TaiwanThis paper used low-cost sensors mounted on mobile vehicles to measure urban heat island effects.
Taha, H., Levinson, R., Mohegh, A., et al. [31] 2018Air-Temperature Response to Neighborhood-Scale Variations in Albedo and Canopy Cover in the Real World: Fine-Resolution Meteorological Modeling and Mobile Temperature Observations in the Los Angeles Climate ArchipelagoThe paper used mobile temperature observations from vehicles to characterize the urban heat island effect and evaluate the cooling effects of increasing urban albedo and vegetation.
Voelkel, J., Shandas, V. [32]2017Towards Systematic Prediction of Urban Heat Islands: Grounding Measurements, Assessing Modeling TechniquesIn this paper, vehicle-based temperature measurements were used to study urban heat island variation and develop statistical models for predicting urban heat.
Yin, Y., Grundstein, A., Mishra, D., et al. [33] 2020A mobile sensor-based Approach for Analyzing and Mitigating Urban Heat HazardsThe paper presents a mobile sensor-based approach to analyse and mitigate urban heat hazards by collecting high-frequency temperature data from vehicle-mounted sensors.
Yin, Y., Hashemi Tonekaboni, N., Grundstein, A., et al. [34] 2020Urban ambient air temperature estimation using hyperlocal data from smart vehicle-borne sensorsThis paper describes vehicle-mounted sensors used to measure hyperlocal urban ambient air temperature variability and map urban heat hazards.
Zeynali, R., Bitelli, B., Mandanici, E. [35]2023Mobile data acquisition and processing in support of an urban heat island studyThe paper shows mobile urban heat island measurements with a vehicle and uses various interpolation models to correct the mobile data using fixed station measurements.
Table 2. Measurement sites for the assessment of the urban heat island intensity in the Pro-Sud region.
Staton NameClassificationLocationHeight Above Sea Level
Esch-sur-Alzette Icity5.98479 E|49.49418 N293 m asl.
Esch-sur-Alzette IIrural5.97786 E|49.48469 N301 m asl.
Differdange Icity5.88876 E|49.52401 N304 m asl.
Differdange IIrural5.87633 E|49.52224 N347 m asl.
Kayl Icity6.04073 E|49.48579 N289 m asl.
Kayl IIrural6.05161 E|49.48686 N299 m asl.
Table 3. Regional climate change projections with model abbreviations, the driving Global Climate Model (GCM), the Regional Climate Model (RCM) used for the dynamical downscaling as well as the institutions that are responsible for the model runs; temporal resolution: daily data; period: 1971–2045, RCP45 [8].
Model AbbreviationGlobal Climate Model (GCM)Regional Climate Model (RCM)
M1CNRM-CERFACS-CNRM-CM5CNRM-ALADIN53_v1
M2CNRM-CERFACS-CNRM-CM5RMIB-UGent-ALARO-0_v1
M3MOHC-HadGEM2-ESKNMI-RACMO22E_v2
M4MOHC-HadGEM2-ESSMHI-RCA4_v1
M5MPI-M-MPI-ESM-LRMPI-CSC-REMO2009_v1
M6MPI-M-MPI-ESM-LRSMHI-RCA4_v1a
M7NCC-NorESM1-MDMI-HIRHAM5_v2
M8MOHC-HadGEM2-ESCLMcom-CCLM4-8-17_v1
M9CNRM-CERFACS-CNRM-CM5SMHI-RCA4_v1
M10IPSL-IPSL-CM5A-MRIPSL-INERIS-WRF331F_v1
M11CNRM-CERFACS-CNRM-CM5CLMcom-CCLM4-8-17_v1
M12ICHEC-EC-EARTHKNMI-RACMO22E_v1
M13IPSL-IPSL-CM5ASMHI-RCA4_v1
M14MPI-M-MPI-ESM-LRCLMcom-CCLM4-8-17_v1
Table 4. Different scenarios used in this study.
Scenario NameDescription
Status Quo
-
FITNAH-3D modelling
-
Current climate (2019–2023)
-
Current building structure
Scenario I; weak climate change signal 2045
-
FITNAH-3D modelling
-
Future climate (multi-model ensemble from CORDEX 2040–2050); 25th percentile from RCP45 (+0.7 K compared to Status Quo
-
Current building structure plus additional planned buildings
Scenario II; strong climate change signal 2045
-
FITNAH-3D modelling
-
Future climate (multi-model ensemble from CORDEX 2040–2050); 75th percentile from RCP45 (+2.7 K compared to Status Quo
-
Current building structure plus additional planned buildings
Table 5. Recommendations for spatial unit-specific urban climate measures for the Pro-Sud region.
MeasureExplanationEffectSpatial Implementation
Indoor/backyard greening
-
Vegetation and unsealing
-
Reducing heat stress
-
Inner and backyard courtyards
Creating public green spaces
-
Small parks and green spaces in inner-city areas
-
Reducing heat stress
-
Networking of green spaces
-
Vacant lots, larger backyards
Climate-optimised design of outdoor surfaces
-
Bright colours (especially roofs) and building materials that retain little heat
-
Reducing heat stress
-
Roofs, if applicable, roads, paths, squares, parking lots
Minimize unsealing/sealing content
-
Lawns or partial sealing
-
Low number of above-ground parking spaces
-
Reducing heat stress
-
Roads, squares, parking lots, buildings, courtyards
Blue–green traffic space design
-
Blue or green measures for increasing the proportion of vegetation in the traffic area and creating open water areas
-
Reducing heat stress
-
Roads, paths, squares, parking lots
Shading of outdoor recreation areas
-
Trees or structural measures (awnings, roofing, sun sails)
-
Reducing heat stress
-
Roads, paths, squares, parking lots, buildings in the residential and working environment
Developing and optimising public green spaces
-
Microclimatic diversity of green spaces (open meadows, trees, water areas, plantations)
-
Reducing heat stress
-
Green and open spaces
-
Roads, squares, parking lots
Maintaining and improving cold air production
-
Protection of cold air generation areas and enhancement of areas with lower cold air production
-
Implement evaporative plants
-
Reducing heat stress
-
Green and open spaces
Protecting, expanding, and creating open, moving water surfaces
-
Urban climate function of larger flowing and still waters areas
-
Low-roughness ventilation corridors that transport cold and fresh air
-
During summer, bodies of water have a cooling effect on their immediate surroundings during the day
-
Waters
-
Green and open spaces
Paying attention to the position of the building structure and spacing areas
-
Building arrangement parallel to the cold air flow and/or sufficient (green) open spaces between the buildings
-
Improvement of cold air flow
-
Reduction in heat accumulation
-
New construction, building complexes
Avoidance of exchange barriers
-
Avoid structural or natural obstacles running transversely to the direction of flow in the area influenced by cold air flows
-
Protection of the air exchange system
-
Green and open spaces,
-
Well-ventilated residential and commercial areas
Protection and networking of areas relevant to the cold air balance
-
Keeping large green spaces free, preferably water-supplied and characterised by flat vegetation
-
Protection against excessive overheating and deterioration of ventilation
-
Green and open spaces
Green roof
-
Extensive or intensive green roofs
-
Improvement of the indoor climate
-
With large-scale implementation and low roof height, improvement of the immediately adjacent outdoor climate possible
-
Flat roofs
-
If necessary, gently sloping roofs
Façade greening
-
Ground- or system-bound façade greening
-
Improvement of the indoor climate and the immediately adjacent outdoor climate
-
Building
Shading of buildings by trees or structural measures
-
Façade greening, trees, balcony design, structural measures such as external sun protection elements, reflective solar control glass
-
Improvement of the indoor climate
-
Building
Technical building cooling
-
Adiabatic exhaust air cooling in which rainwater is used
-
Adsorption chillers powered by solar energy or waste heat
-
Cooling of the interior of buildings through building air conditioning that is as sustainable as possible
-
Buildings in which passive measures cannot be sufficiently applied
Disclaimer/Publisher’s Note: The statements, opinions and data contained in all publications are solely those of the individual author(s) and contributor(s) and not of MDPI and/or the editor(s). MDPI and/or the editor(s) disclaim responsibility for any injury to people or property resulting from any ideas, methods, instructions or products referred to in the content.

