
Spatiotemporal Dynamics of Retrogressive Thaw Slumps in the Shulenanshan Region of the Western Qilian Mountains

 , , , , ,
Abstract
1. Introduction
2. Materials and Methods
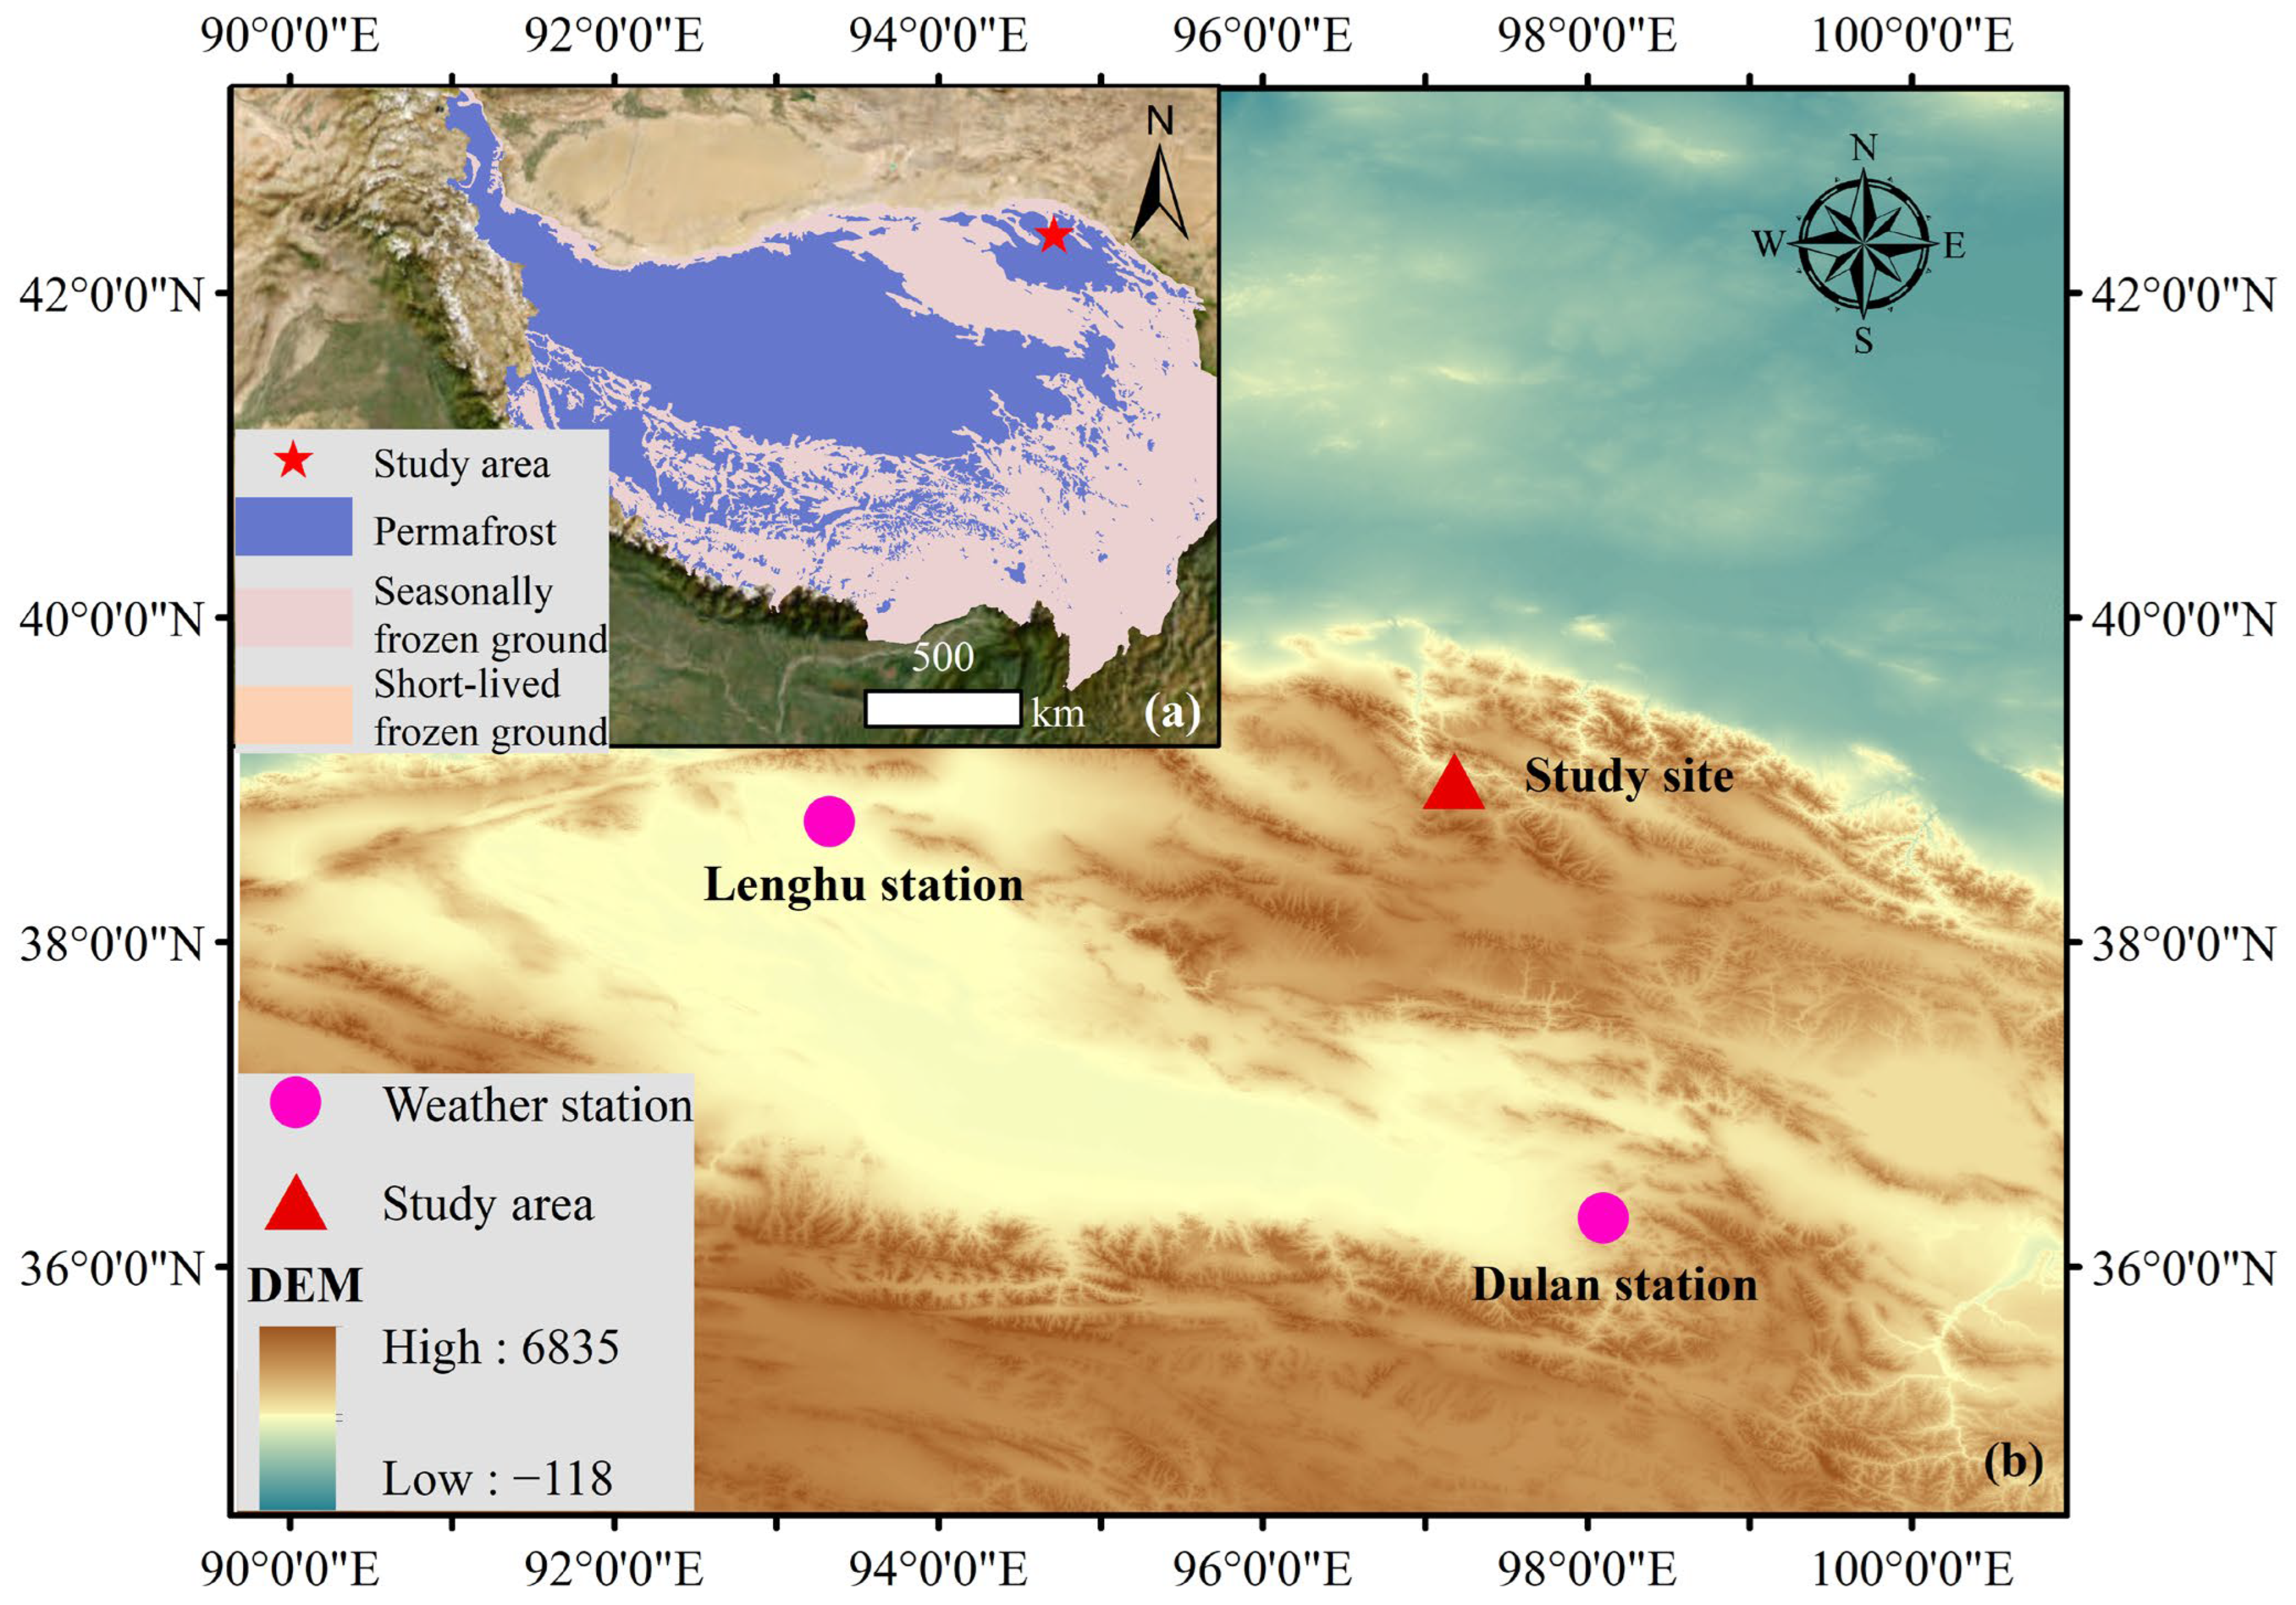
2.1. Study Area
2.2. Dataset
- (1)
- Digital elevation models (DEM) data
- (2)
- Remote sensing image
- (3)
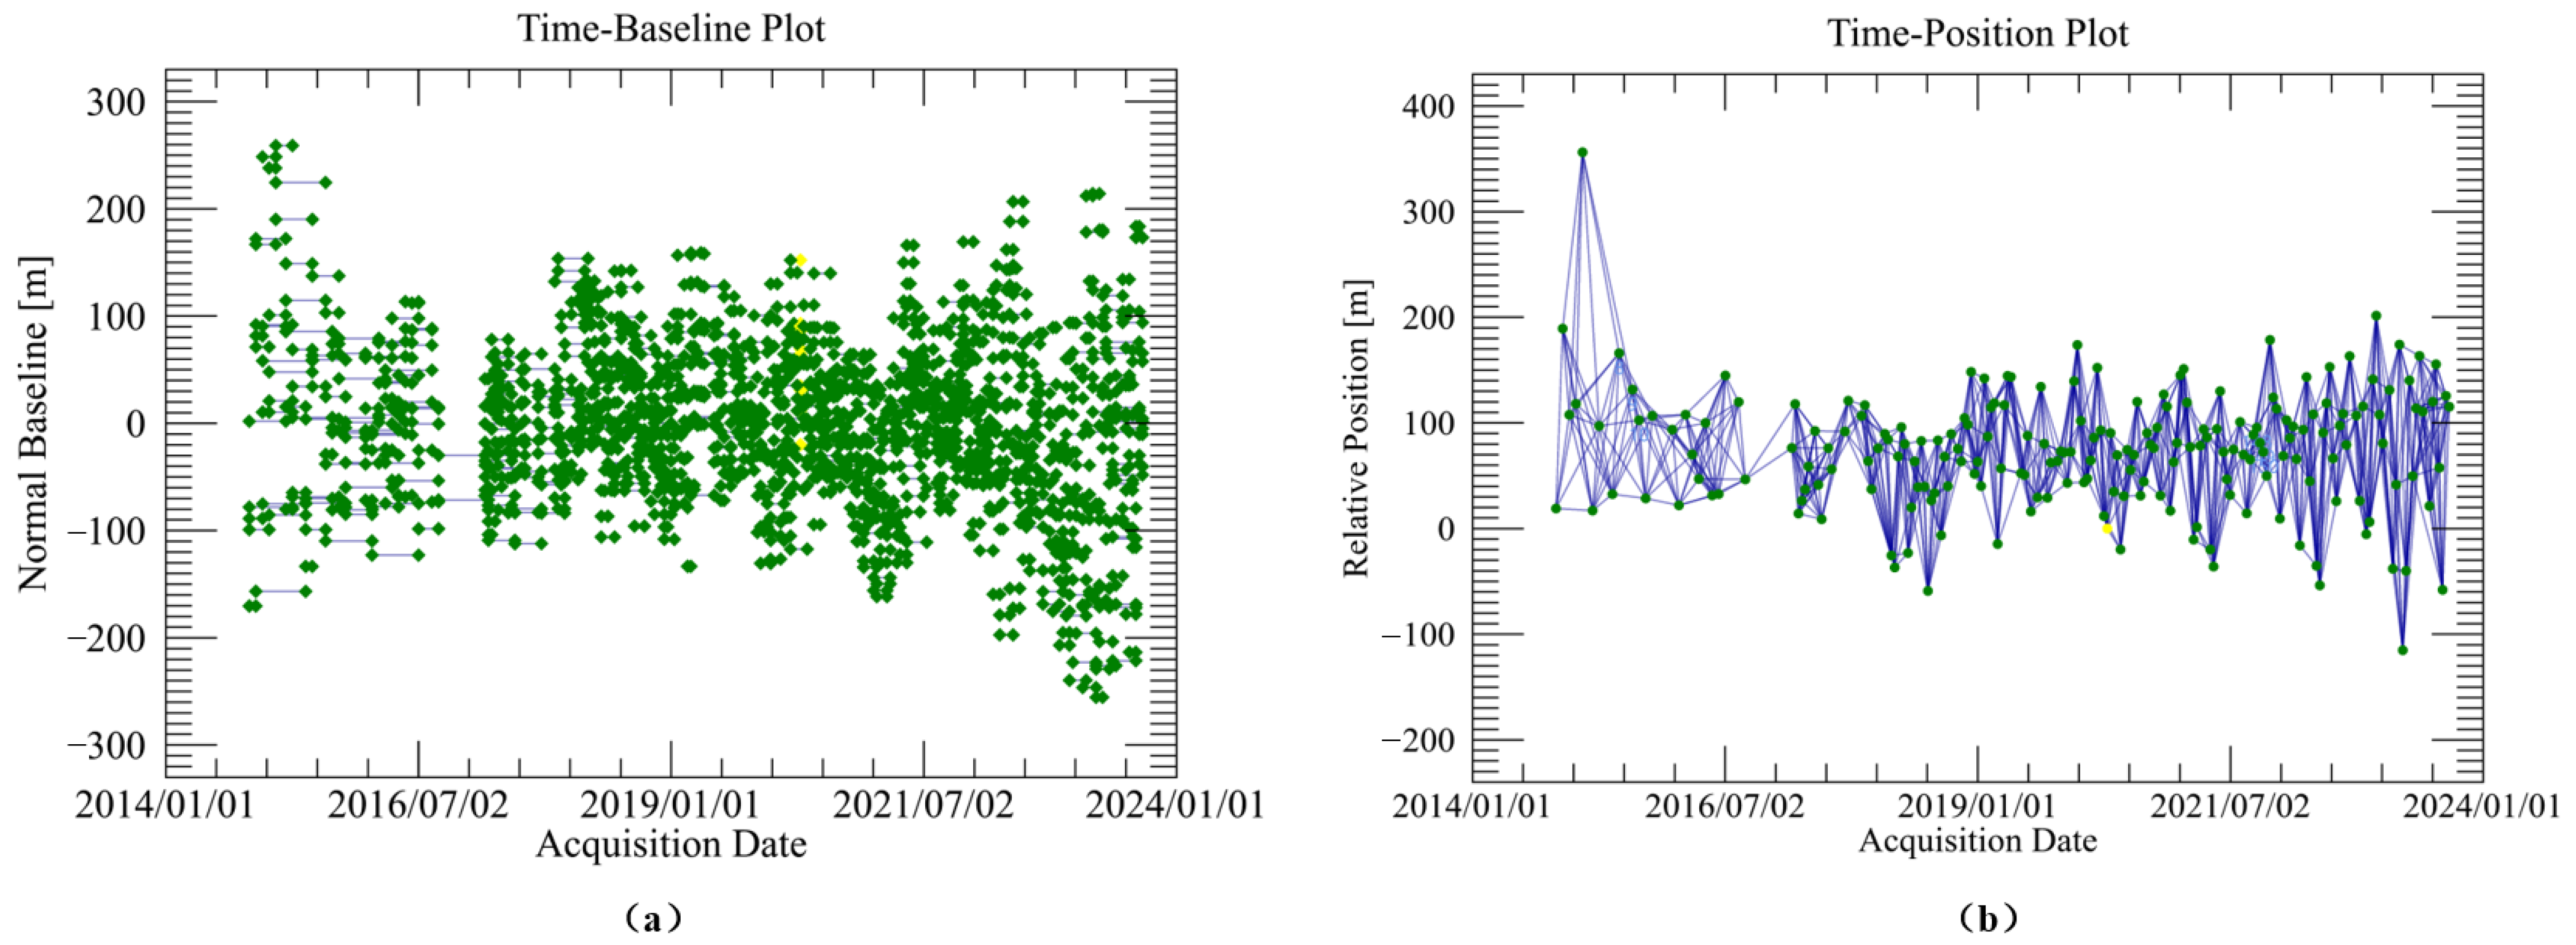
- Sentinel-1 data
- (4)
- Local precipitation and temperature data
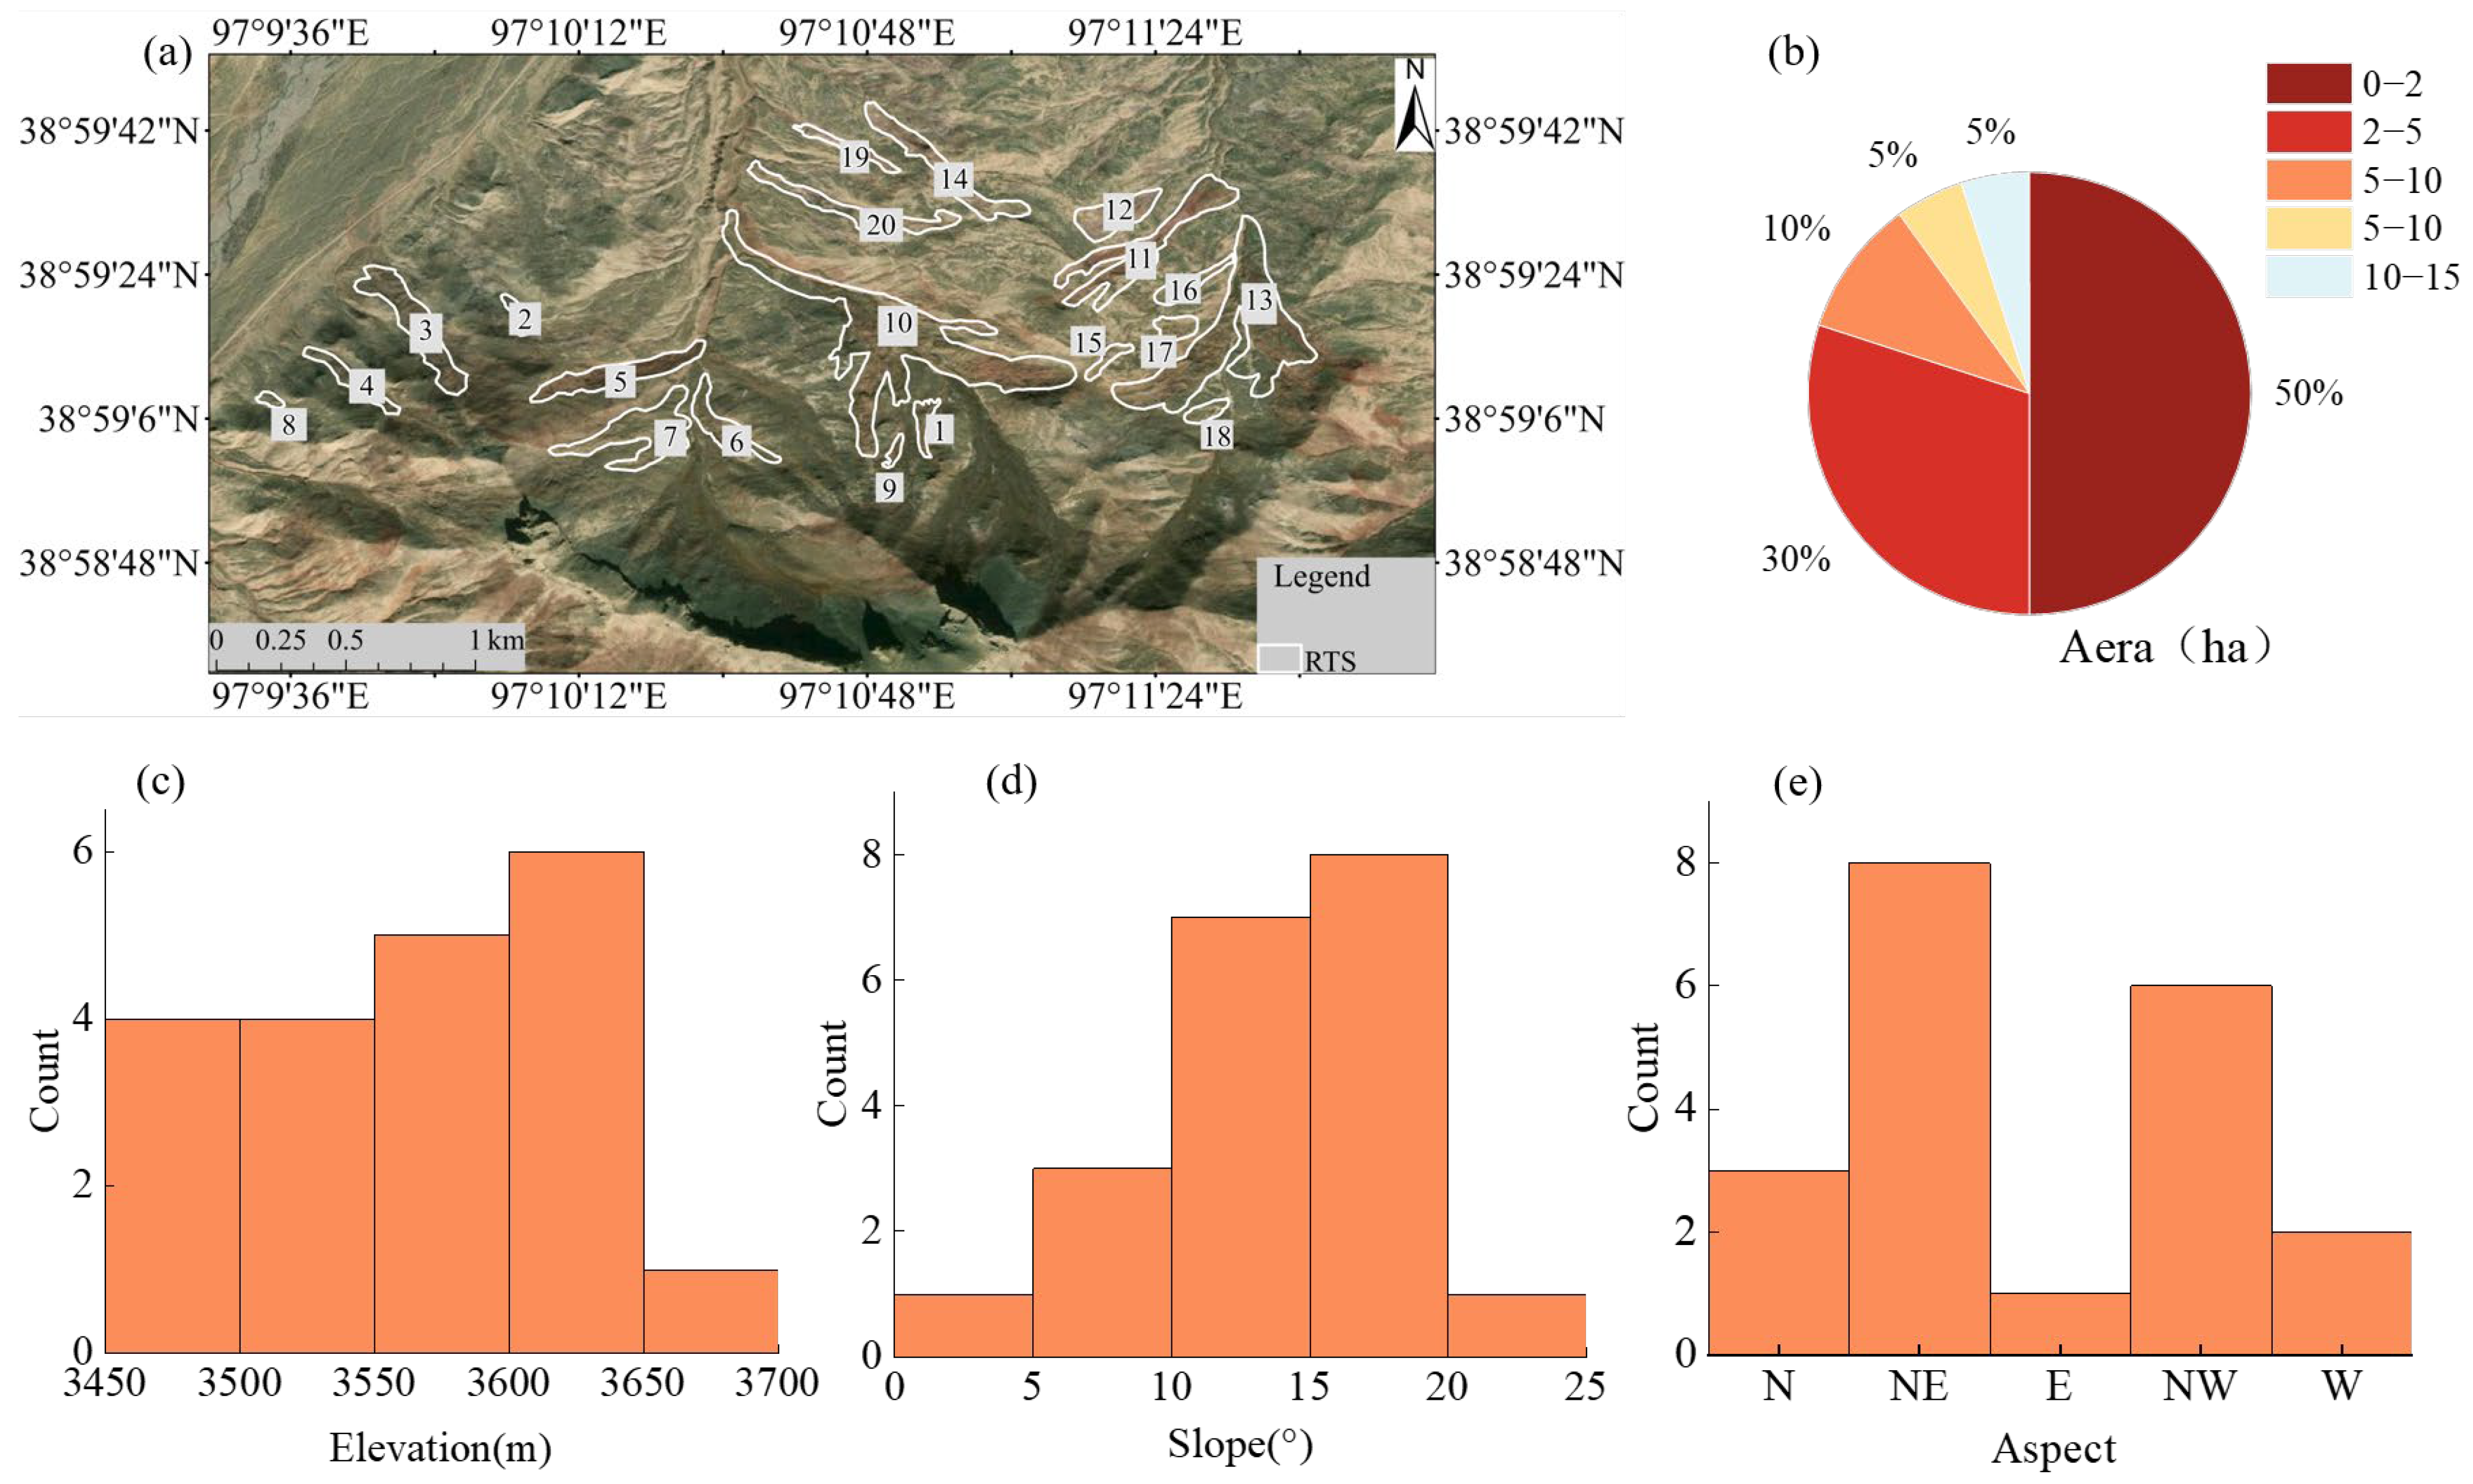
2.3. RTSs Geometric Characteristics
2.4. InSAR Processing
3. Results
3.1. Terrain and Geometric Characteristics
3.2. Spatiotemporal Changes of RTS Areas
- (1)
- Active RTSs
- (2)
- Stable RTSs
- (3)
- Mature Slumps
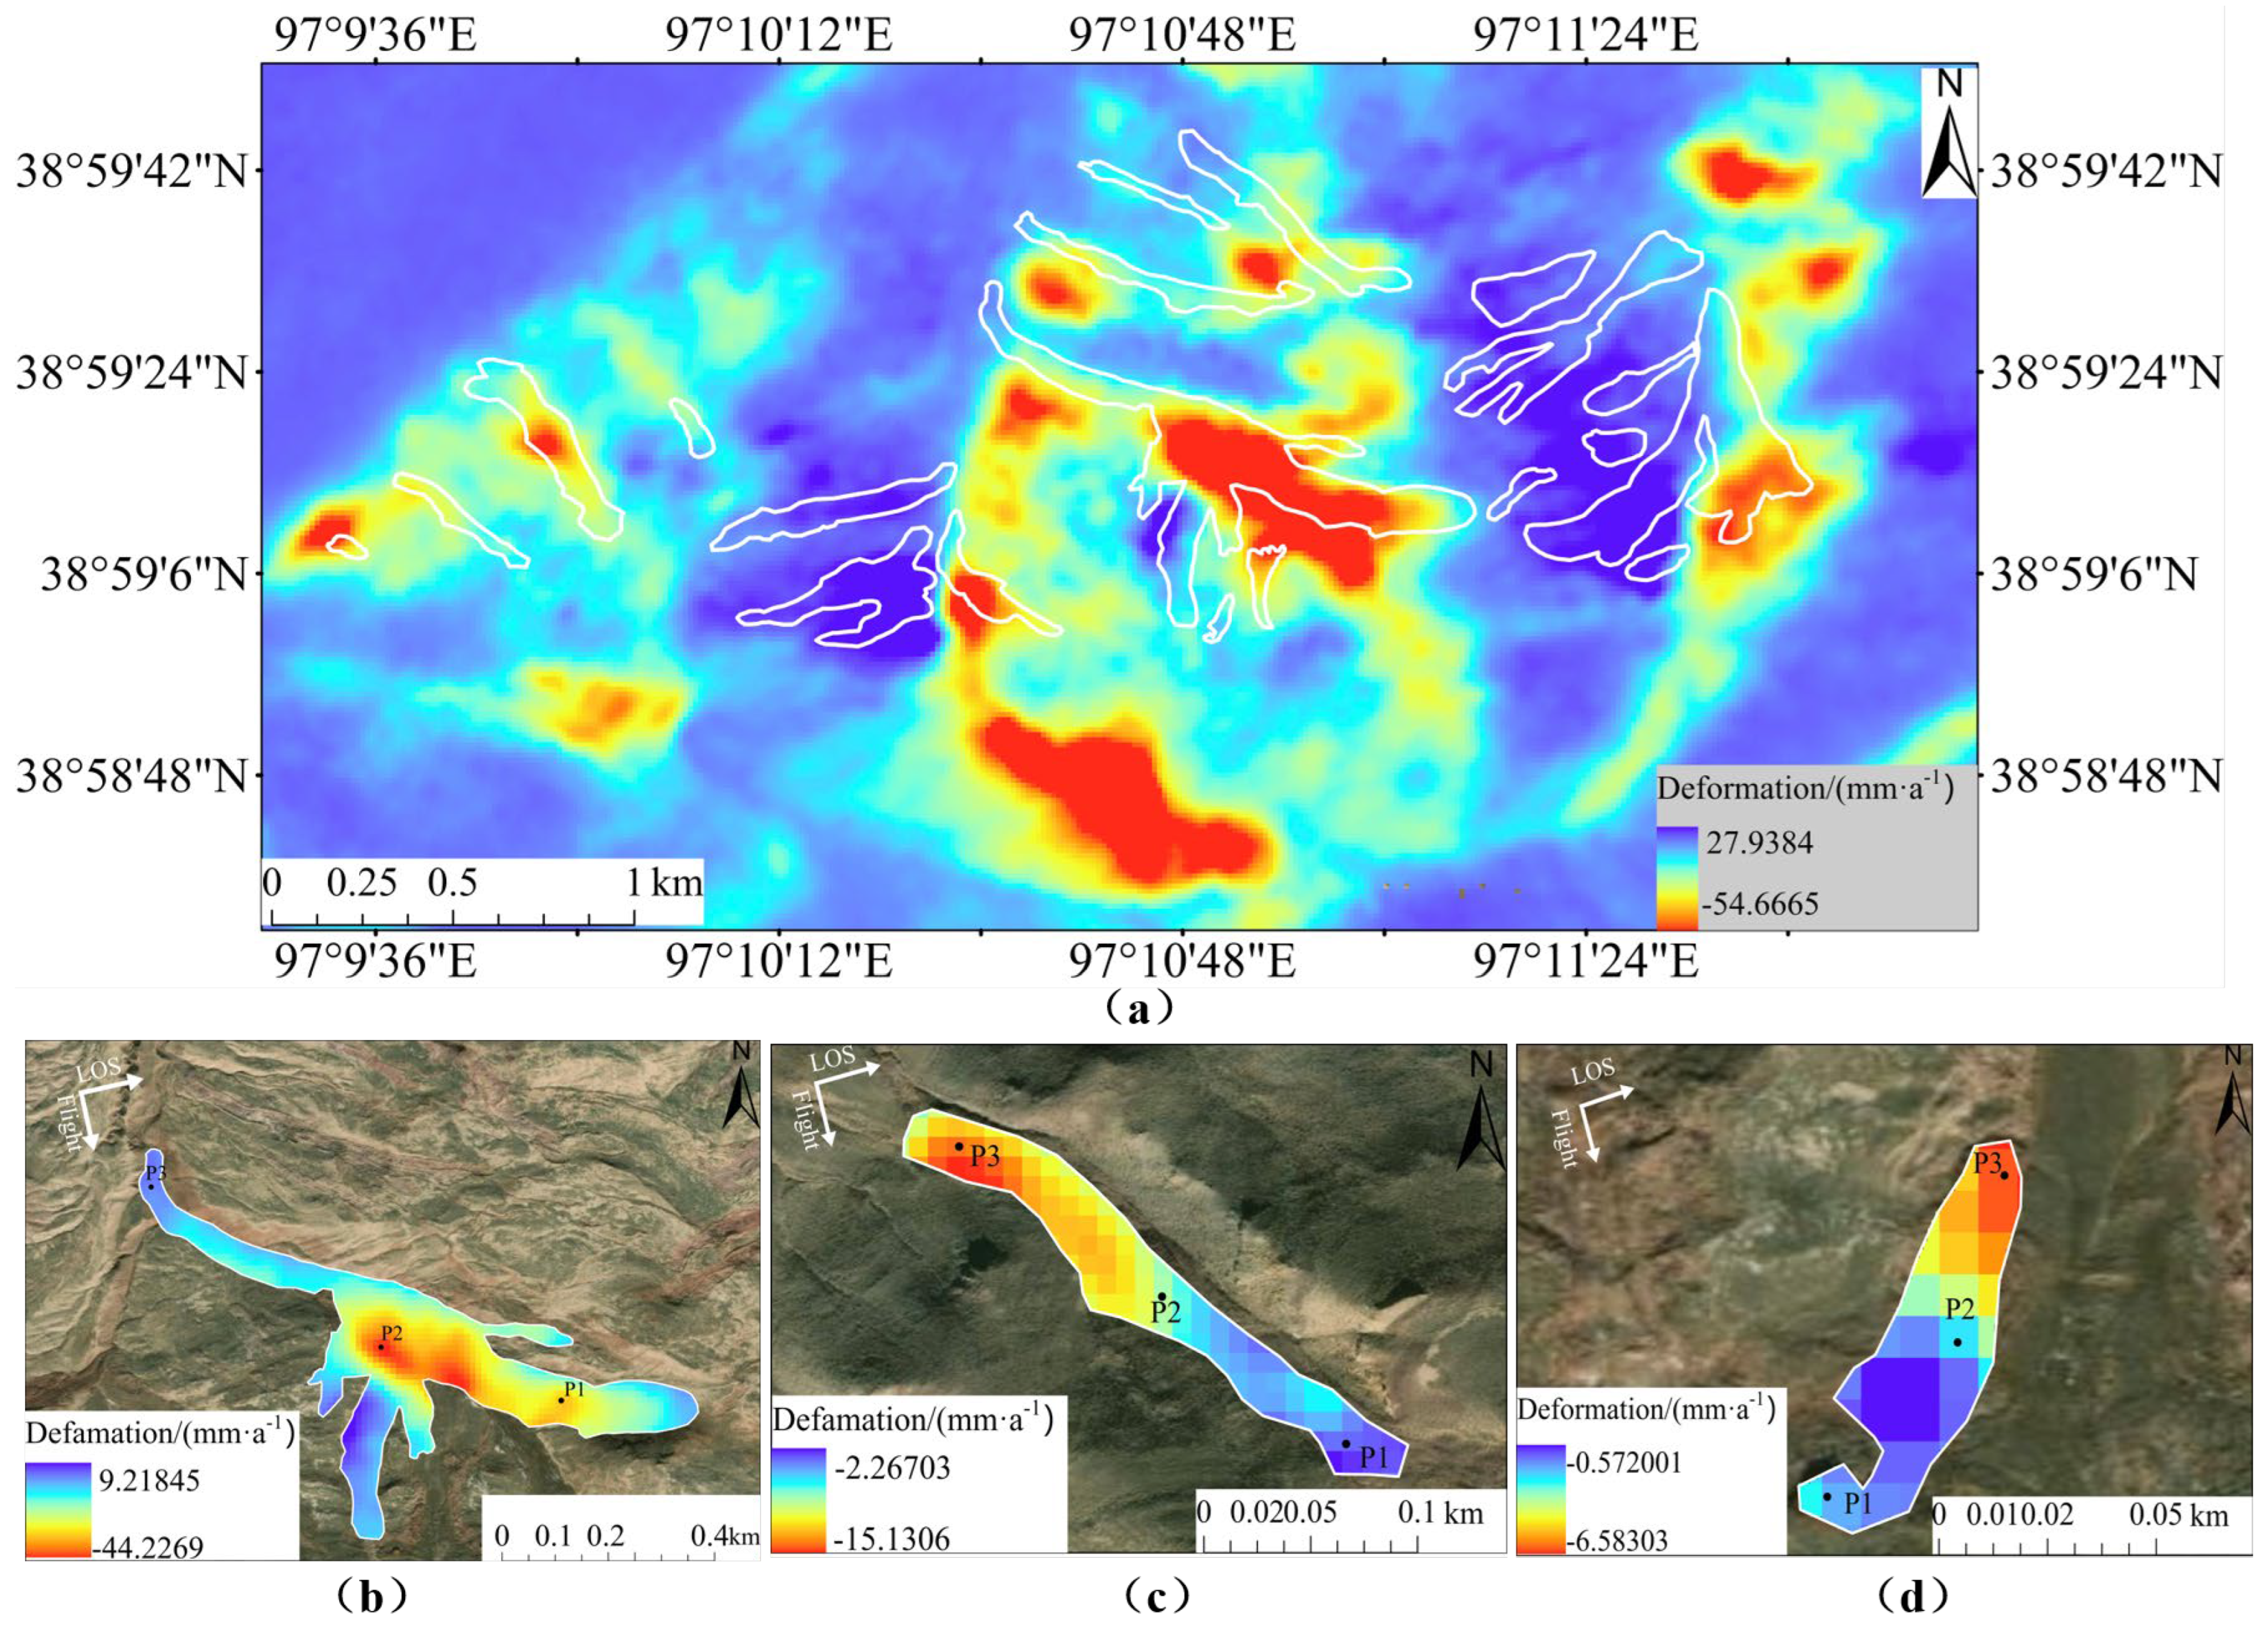
3.3. Surface Deformation Characteristics
- (1)
- Active RTSs
- (2)
- Stable RTSs
- (3)
- Mature RTSs
4. Discussion
4.1. Triggering Mechanisms of RTS Activities
4.2. Development of RTSs
5. Conclusions
Author Contributions
Funding
Institutional Review Board Statement
Informed Consent Statement
Data Availability Statement
Conflicts of Interest
References
- Harris, C.; Davies, M.C.R.; Etzelmüller, B. The assessment of potential geotechnical hazards associated with mountain permafrost in a warming global climate. Permafr. Periglac. Process. 2001, 12, 145–156. [Google Scholar] [CrossRef]
- Jin, H.; Jin, X.; He, R.; Luo, D.; Chang, X.; Wang, S.; Marchenko, S.S.; Yang, S.; Yi, C.; Li, S.; et al. Evolution of Permafrost in China during the Last 20 Ka. Sci. China Earth Sci. 2019, 62, 1207–1223. [Google Scholar] [CrossRef]
- Jin, H.; Li, S.; Cheng, G.; Shaoling, W.; Li, X. Permafrost and Climatic Change in China. Glob. Planet. Change 2000, 26, 387–404. [Google Scholar] [CrossRef]
- Chadburn, S.E.; Burke, E.J.; Cox, P.M.; Friedlingstein, P.; Hugelius, G.; Westermann, S. An Observation-Based Constraint on Permafrost Loss as a Function of Global Warming. Nat. Clim. Change 2017, 7, 340–344. [Google Scholar] [CrossRef]
- Ni, J.; Wu, T.; Zhu, X.; Hu, G.; Zou, D.; Wu, X.; Li, R.; Xie, C.; Qiao, Y.; Pang, Q.; et al. Simulation of the Present and Future Projection of Permafrost on the Qinghai-Tibet Plateau with Statistical and Machine Learning Models. J. Geophys. Res. Atmos. 2021, 126, e2020JD033402. [Google Scholar] [CrossRef]
- Li, Y.; Liu, Y.; Chen, J.; Dang, H.; Zhang, S.; Mei, Q.; Zhao, J.; Wang, J.; Dong, T.; Zhao, Y. Advances in Retrogressive Thaw Slump Research in Permafrost Regions. Permafr. Periglac. Process. 2024, 35, 125–142. [Google Scholar] [CrossRef]
- Luo, J.; Niu, F.; Lin, Z.; Liu, M.; Yin, G. Recent Acceleration of Thaw Slumping in Permafrost Terrain of Qinghai-Tibet Plateau: An Example from the Beiluhe Region. Geomorphology 2019, 341, 79–85. [Google Scholar] [CrossRef]
- Segal, R.A.; Lantz, T.C.; Kokelj, S.V. Acceleration of Thaw Slump Activity in Glaciated Landscapes of the Western Canadian Arctic. Environ. Res. Lett. 2016, 11, 034025. [Google Scholar] [CrossRef]
- Mu, C.; Shang, J.; Zhang, T.; Fan, C.; Wang, S.; Peng, X.; Zhong, W.; Zhang, F.; Mu, M.; Jia, L. Acceleration of Thaw Slump during 1997–2017 in the Qilian Mountains of the Northern Qinghai-Tibetan Plateau. Landslides 2020, 17, 1051–1062. [Google Scholar] [CrossRef]
- Lewkowicz, A.G.; Way, R.G. Extremes of Summer Climate Trigger Thousands of Thermokarst Landslides in a High Arctic Environment. Nat. Commun. 2019, 10, 1329. [Google Scholar] [CrossRef]
- Lantuit, H.; Pollard, W.H. Fifty Years of Coastal Erosion and Retrogressive Thaw Slump Activity on Herschel Island, Southern Beaufort Sea, Yukon Territory, Canada. Geomorphology 2008, 95, 84–102. [Google Scholar] [CrossRef]
- Ramage, J.L.; Irrgang, A.M.; Morgenstern, A.; Lantuit, H. Increasing Coastal Slump Activity Impacts the Release of Sediment and Organic Carbon into the Arctic Ocean. Biogeosciences 2018, 15, 1483–1495. [Google Scholar] [CrossRef]
- Ward Jones, M.K.; Pollard, W.H.; Jones, B.M. Rapid Initialization of Retrogressive Thaw Slumps in the Canadian High Arctic and Their Response to Climate and Terrain Factors. Environ. Res. Lett. 2019, 14, 055006. [Google Scholar] [CrossRef]
- Nesterova, N.; Leibman, M.; Kizyakov, A.; Lantuit, H.; Tarasevich, I.; Nitze, I.; Veremeeva, A.; Grosse, G. Review Article: Retrogressive Thaw Slump Characteristics and Terminology. Cryosphere 2024, 18, 4787–4810. [Google Scholar] [CrossRef]
- Niu, F.; Cheng, G.; Ni, W.; Jin, D. Engineering-Related Slope Failure in Permafrost Regions of the Qinghai-Tibet Plateau. Cold Reg. Sci. Technol. 2005, 42, 215–225. [Google Scholar] [CrossRef]
- Kokelj, S.V.; Jorgenson, M.T. Advances in Thermokarst Research. Permafr. Periglac. Process. 2013, 24, 108–119. [Google Scholar] [CrossRef]
- Mesquita, P.S.; Wrona, F.J.; Prowse, T.D. Effects of Retrogressive Permafrost Thaw Slumping on Sediment Chemistry and Submerged Macrophytes in Arctic Tundra Lakes. Freshw. Biol. 2010, 55, 2347–2358. [Google Scholar] [CrossRef]
- Cheng, G.; Wu, T. Responses of Permafrost to Climate Change and Their Environmental Significance, Qinghai-Tibet Plateau. J. Geophys. Res. Earth Surf. 2007, 112, F02S03. [Google Scholar] [CrossRef]
- Zhao, L.; Zou, D.; Hu, G.; Du, E.; Pang, Q.; Xiao, Y.; Li, R.; Sheng, Y.; Wu, X.; Sun, Z.; et al. Changing Climate and the Permafrost Environment on the Qinghai–Tibet (Xizang) Plateau. Permafr. Periglac. Process. 2020, 31, 396–405. [Google Scholar] [CrossRef]
- Luo, J.; Niu, F.; Lin, Z.; Liu, M.; Yin, G.; Gao, Z. Inventory and Frequency of Retrogressive Thaw Slumps in Permafrost Region of the Qinghai–Tibet Plateau. Geophys. Res. Lett. 2022, 49, e2022GL099829. [Google Scholar] [CrossRef]
- Hu, B.; Wu, Y.; Zhang, X.; Yang, B.; Chen, J.; Li, H.; Chen, X.; Chen, Z. Monitoring the Thaw Slump-Derived Tthermokarst in the Qinghai-Tibet Plateau Using Satellite SAR Interferometry. J. Sens. 2019, 2019, 1698432. [Google Scholar] [CrossRef]
- Jiao, Z.; Xu, Z.; Guo, R.; Zhou, Z.; Jiang, L. Potential of Multi-Temporal InSAR for Detecting Retrogressive Thaw Slumps: A Case of the Beiluhe Region of the Tibetan Plateau. Int. J. Disaster Risk Sci. 2023, 14, 523–538. [Google Scholar] [CrossRef]
- Liu, Y.; Qiu, H.; Kamp, U.; Wang, N.; Wang, J.; Huang, C.; Tang, B. Higher Temperature Sensitivity of Retrogressive Thaw Slump Activity in the Arctic Compared to the Third Pole. Sci. Total Environ. 2024, 914, 170007. [Google Scholar] [CrossRef] [PubMed]
- Tong, K.; Li, Z.; Zhu, L.; Tao, G.; Zhang, Y.; Yang, W.; Zhang, J. Fold-and-Thrust Deformation of the Hinterland of Qilian Shan, Northeastern Tibetan Plateau since Mesozoic with Implications for the Plateau Growth. J. Asian Earth Sci. 2020, 198, 104131. [Google Scholar] [CrossRef]
- Wei, S.; Wang, X.; Wang, K.; Liu, L.; Liang, B.; Zhao, W. Rethinking Spatiotemporal Variations in Air Temperature over the Qilian Mountains, Western China, from 1979 to 2018. Atmos. Res. 2023, 286, 106671. [Google Scholar] [CrossRef]
- Ran, Y.; Li, X.; Cheng, G.; Zhang, T.; Wu, Q.; Jin, H.; Jin, R. Distribution of Permafrost in China: An Overview of Existing Permafrost Maps. Permafr. Periglac. Process. 2012, 23, 322–333. [Google Scholar] [CrossRef]
- Harris, I.; Osborn, T.J.; Jones, P.; Lister, D. Version 4 of the CRU TS Monthly High-Resolution Gridded Multivariate Climate Dataset. Sci. Data 2020, 7, 109. [Google Scholar] [CrossRef]
- Gruber, S.; Haeberli, W. Permafrost in Steep Bedrock Slopes and Its Temperature-Related Destabilization Following Climate Change. J. Geophys. Res. Earth Surf. 2007, 112, F02S18. [Google Scholar] [CrossRef]
- Walvoord, M.A.; Kurylyk, B.L. Hydrologic Impacts of Thawing Permafrost—A Review. Vadose Zone J. 2016, 15, vzj2016.01.0010. [Google Scholar] [CrossRef]
- Balser, A.W.; Jones, J.B.; Gens, R. Timing of Retrogressive Thaw Slump Initiation in the Noatak Basin, Northwest Alaska, USA. J. Geophys. Res. Earth Surf. 2014, 119, 1106–1120. [Google Scholar] [CrossRef]
- Lamoureux, S.F.; Lafrenière, M.J. Fluvial Impact of Extensive Active Layer Detachments, Cape Bounty, Melville Island, Canada. Arct. Antarct. Alp. Res. 2009, 41, 59–68. [Google Scholar] [CrossRef]
- Bai, R.; Lai, Y.; Zhang, M.; Ren, J. Study on the coupled heat-water-vapor-mechanics process of unsaturated soils. J. Hydrol. 2020, 585, 124784. [Google Scholar] [CrossRef]
- Bai, R.; Lai, Y.; Zhang, M.; Jiang, H. Investigating the thermo-hydro-mechanical behavior of loess subjected to freeze–thaw cycles. Acta Geotech. 2024, 19, 6305–6318. [Google Scholar] [CrossRef]
- Chen, J.; Zhang, J.; Wu, T.-H.; Liu, L.; Zhang, F.-Y.; Hao, J.-M.; Huang, L.-C.; Wu, X.-D.; Wang, P.-L.; Xia, Z.-X.; et al. Elevation-Dependent Shift of Landslide Activity in Mountain Permafrost Regions of the Qilian Mountains. Adv. Clim. Change Res. 2024, 15, 1067–1077. [Google Scholar] [CrossRef]


| No. | Area/ha | Length/m | Width/m | Slope/° | Aspect | Elevation/m | Type |
|---|---|---|---|---|---|---|---|
| 1 | 0.8 | 200.9 | 71.3 | 20.55 | N | 3618.334 | Stable |
| 2 | 0.7 | 160.9 | 44.3 | 10.15 | NW | 3474.288 | Mature |
| 3 | 4.6 | 548 | 114.2 | 11.58 | NW | 3501.196 | Stable |
| 4 | 1.4 | 391 | 54.1 | 9.39 | NW | 3487.292 | Stable |
| 5 | 3.6 | 633.1 | 68.9 | 7.22 | NE | 3537.859 | Active |
| 6 | 2.3 | 372.9 | 100.6 | 13.35 | N | 3598.773 | Active |
| 7 | 5.3 | 519.8 | 218.7 | 10.81 | NE | 3601.044 | Stable |
| 8 | 0.3 | 93.3 | 42.2 | 2.37 | W | 3472.859 | Mature |
| 9 | 0.3 | 127.3 | 43.5 | 15.15 | NE | 3607.837 | Mature |
| 10 | 19.4 | 1312.1 | 211.1 | 7.57 | NW | 3589.668 | Active |
| 11 | 6.2 | 683.1 | 92.9 | 16.26 | NE | 3605.761 | Active |
| 12 | 2.6 | 316.1 | 88.1 | 15.43 | NE | 3570.772 | Stable |
| 13 | 14.6 | 763.3 | 191.9 | 17.89 | N | 3638.459 | Active |
| 14 | 3.8 | 595.1 | 85.1 | 17.39 | NW | 3520.616 | Mature |
| 15 | 0.6 | 207.1 | 46.3 | 17.25 | NE | 3651.339 | Stable |
| 16 | 1.4 | 313.3 | 76.4 | 16.74 | NE | 3581.576 | Stable |
| 17 | 1.0 | 150.2 | 74.3 | 11.35 | E | 3594.876 | Active |
| 18 | 0.7 | 167.4 | 60.1 | 16.47 | NE | 3640.511 | Stable |
| 19 | 1.1 | 399.5 | 31.5 | 11.34 | NW | 3455.1 | Active |
| 20 | 3.3 | 722.1 | 71.8 | 11.12 | W | 3501.483 | Active |
| Average | 3.7 | 433.83 | 89.37 | 12.90 | 3562.482 |
Disclaimer/Publisher’s Note: The statements, opinions and data contained in all publications are solely those of the individual author(s) and contributor(s) and not of MDPI and/or the editor(s). MDPI and/or the editor(s) disclaim responsibility for any injury to people or property resulting from any ideas, methods, instructions or products referred to in the content. |
© 2025 by the authors. Licensee MDPI, Basel, Switzerland. This article is an open access article distributed under the terms and conditions of the Creative Commons Attribution (CC BY) license (https://creativecommons.org/licenses/by/4.0/).
Share and Cite
Zhou, Y.; Zhang, Q.; Li, G.; Du, Q.; Chen, D.; Chen, J.; Su, A.; Wang, M.; Wang, X.; Wang, B. Spatiotemporal Dynamics of Retrogressive Thaw Slumps in the Shulenanshan Region of the Western Qilian Mountains. Atmosphere 2025, 16, 466. https://doi.org/10.3390/atmos16040466
Zhou Y, Zhang Q, Li G, Du Q, Chen D, Chen J, Su A, Wang M, Wang X, Wang B. Spatiotemporal Dynamics of Retrogressive Thaw Slumps in the Shulenanshan Region of the Western Qilian Mountains. Atmosphere. 2025; 16(4):466. https://doi.org/10.3390/atmos16040466
Chicago/Turabian StyleZhou, Yu, Qingnan Zhang, Guoyu Li, Qingsong Du, Dun Chen, Junhao Chen, Anshuang Su, Miao Wang, Xu Wang, and Benfeng Wang. 2025. "Spatiotemporal Dynamics of Retrogressive Thaw Slumps in the Shulenanshan Region of the Western Qilian Mountains" Atmosphere 16, no. 4: 466. https://doi.org/10.3390/atmos16040466
APA StyleZhou, Y., Zhang, Q., Li, G., Du, Q., Chen, D., Chen, J., Su, A., Wang, M., Wang, X., & Wang, B. (2025). Spatiotemporal Dynamics of Retrogressive Thaw Slumps in the Shulenanshan Region of the Western Qilian Mountains. Atmosphere, 16(4), 466. https://doi.org/10.3390/atmos16040466