Article

Drought Monitoring in the Agrotechnological Districts of the Semear Digital Center

by
Tamires Lima da Silva
1,*,
Luciana Alvim Santos Romani
1,
Silvio Roberto Medeiros Evangelista
1,
Mihai Datcu
2 and
Silvia Maria Fonseca Silveira Massruhá
3
1
Embrapa Digital Agriculture, Campinas 13083-886, Brazil
2
Department of Applied Electronics and Information Engineering, Faculty of Electronics, Telecommunications and Information Technology, University Politehnica of Bucharest, 060042 București, Romania
3
Embrapa, Brasília 70770-901, Brazil
*
Author to whom correspondence should be addressed.
Atmosphere 2025, 16(4), 465; https://doi.org/10.3390/atmos16040465
Submission received: 15 January 2025 / Revised: 25 March 2025 / Accepted: 9 April 2025 / Published: 17 April 2025
(This article belongs to the Special Issue Observation of Climate Change and Cropland with Satellite Data)

Abstract

:
Drought affects the agricultural sector, posing challenges for farm management, particularly among medium- and small-scale producers. This study uses climate data from remote sensing products to evaluate drought trends in the Semear Digital Center’s Agrotechnological Districts (DATs), which are characterized by a high concentration of small- and medium-sized farms in Brazil. Precipitation data from Climate Hazards Group InfraRed Precipitation with Station (CHIRPS) and land surface temperature data from Moderate Resolution Imaging Spectroradiometer (MODIS) were applied to calculate the Standardized Precipitation–Evapotranspiration Index (SPEI) for a 6-month timescale from 2000 to 2024, with analysis divided into 2000–2012 and 2013–2024. Some limitations were noted: MODIS systematically underestimated temperatures, while CHIRPS tended to underestimate precipitation for most of the DATs. Despite discrepancies, these datasets remain valuable for drought monitoring in areas where long-term ground weather station data are lacking for SPEI assessments. Agricultural drought frequency and severity increased in the 2013–2024 period. Exceptional, extreme, severe, and moderate drought events rose by 7.3, 5.4, 2.2 and 1.0 times, respectively. These trends highlight the importance of adopting smart farming technologies to enhance the resilience of the DATs to climate change.

1. Introduction

The Semear Digital Center aims to increase the productivity of small- and medium-sized farms through research, development, and innovation in information and communication technologies. To achieve this goal, ten municipalities in Brazil, located across different states and biomes, were selected based on socioeconomic indicators, including the concentration of small- and medium-sized farms. The Agrotechnological Districts (DATs) located in these municipalities are pilot regions in which smart farming solutions have been tailored to meet the specific needs of farmers [1].
Smart farming solutions play a crucial role in addressing the challenges of climate change in Brazilian agriculture and livestock, as they increase resilience and adaptive capacity and reduce the vulnerability of agribusiness [2,3]. Technologies involved in smart farming include robotics, digital twins, nanotechnology, cloud computing, the Internet of Things (IoT), gene editing, artificial intelligence (AI), sensors, machine learning (ML), unmanned aerial vehicles (drones), and satellite imagery [3,4,5]. For instance, drones and satellite imagery provide detailed views of agricultural areas, enabling the development of algorithms to monitor crops and livestock health, soil moisture levels, and fertilization needs [6,7].
Technological innovation is vital because, without it, global warming is expected to reduce Brazil’s agricultural output per hectare by 18%, with potential impacts on individual municipalities ranging from −40% to +15% [8]. The Intergovernmental Panel on Climate Change has indicated that since the 1950s, human activities have likely increased the frequency of extreme weather events, such as droughts and heatwaves [9]. In Brazil, especially in regions outside the south, droughts recorded since 2011 have been more intense and severe than those experienced in the past 60 years [10]. Southeast Brazil has also significantly increased summer droughts and heatwaves events [11].
Drought can affect both high- and low-rainfed areas and is classified into four types: meteorological, agricultural, hydrological, and socioeconomic. Meteorological drought refers to a prolonged lack of or below-normal rainfall. Agricultural drought impacts plant growth and development, denoting how soil moisture fails to meet the water requirements of plants, reflecting an imbalance between precipitation and evapotranspiration. Hydrological drought relates to decreases in surface or subsurface hydrology (i.e., significant drops in aquifer water levels or lower river flows than the long-term average), and socioeconomic drought occurs when water shortages adversely affect socioeconomic systems, illustrating a failure of water resource systems to meet demands [12,13,14].
The impacts of agricultural droughts on crop production can lead to famine, social conflicts over water allocation, land disputes, and significant migration flows [14,15]. Small and medium-sized farms are especially vulnerable to these adverse effects [16]. Therefore, effective drought monitoring is essential for managing risks and developing mitigation strategies, such as adopting smart farming solutions.
Numerous indices can monitor and analyze drought occurrences [17,18,19,20,21,22,23,24]. They can be divided into site-based and remote sensing-based indices. Examples of site-based indices include the Palmer Drought Severity Index (PDSI), Crop Moisture Index (CMI), Standardized Precipitation Evapotranspiration Index (SPEI), and Standardized Precipitation Index (SPI), which are typically derived from ground-based observations of hydro-climatic variables, such as precipitation, temperature, and soil moisture. On the other hand, remote sensing-based indices, like the Vegetation Condition Index (VCI), Temperature Vegetation Dryness Index (TVDI), Normalized Difference Water Index (NDWI), and Vegetation Health Index (VHI), rely on unique spectral signatures of canopy characteristics and soil surface mainly in shortwave infrared, red, and thermal spectral bands [25,26].
One of the most commonly used site-based indices for monitoring and analyzing drought occurrences and severity is the SPEI [27,28,29,30,31,32]. This index relies on precipitation and temperature data, using temperature to estimate potential evapotranspiration (PET) through the Thornthwaite methodology [33]. By incorporating temperature variations into drought assessments, the SPEI is a robust tool for evaluating the increasing severity of droughts under conditions of global warming [20].
Although the World Meteorological Organization (WMO) recommends the SPI as the standard drought index, it has limitations when evaluating the impacts of climate change [34]. The main limitation is that SPI depends solely on precipitation data and does not account for temperature effects. As temperature increasingly influences drought conditions in a warming climate, the SPEI offers a more comprehensive assessment of drought dynamics.
Many studies on drought monitoring utilize remote sensing-based indices to analyze vegetation and soil moisture characteristics. They also incorporate site-based indices derived from weather station data or climate data obtained from remote sensing products [35,36,37,38].
Remote sensing products, such as the Climate Hazards Group InfraRed Precipitation with Station (CHIRPS) data [39] and the Moderate Resolution Imaging Spectroradiometer (MODIS) [40], offer over two decades of high-resolution precipitation and land surface temperature data, respectively. These datasets are particularly valuable for monitoring agricultural droughts in regions lacking long-term ground-based weather station data. By leveraging these remote sensing tools, researchers and practitioners can calculate site-based drought indices, such as the SPEI to assess drought conditions and their impacts under warming climates. This approach enables a more comprehensive understanding of drought dynamics and supports the development of targeted mitigation strategies in vulnerable agricultural areas.
Thus, this study employs climate data obtained through remote sensing from CHIRPS and MODIS to compute the SPEI within the Agrotechnological Districts of the Semear Digital Center. The goal is to monitor agricultural drought, thereby offering a clearer understanding of drought patterns and changes in severity in response to shifting climate conditions. Furthermore, the study emphasizes how smart farming solutions can mitigate the impacts of agricultural droughts.

2. Materials and Methods
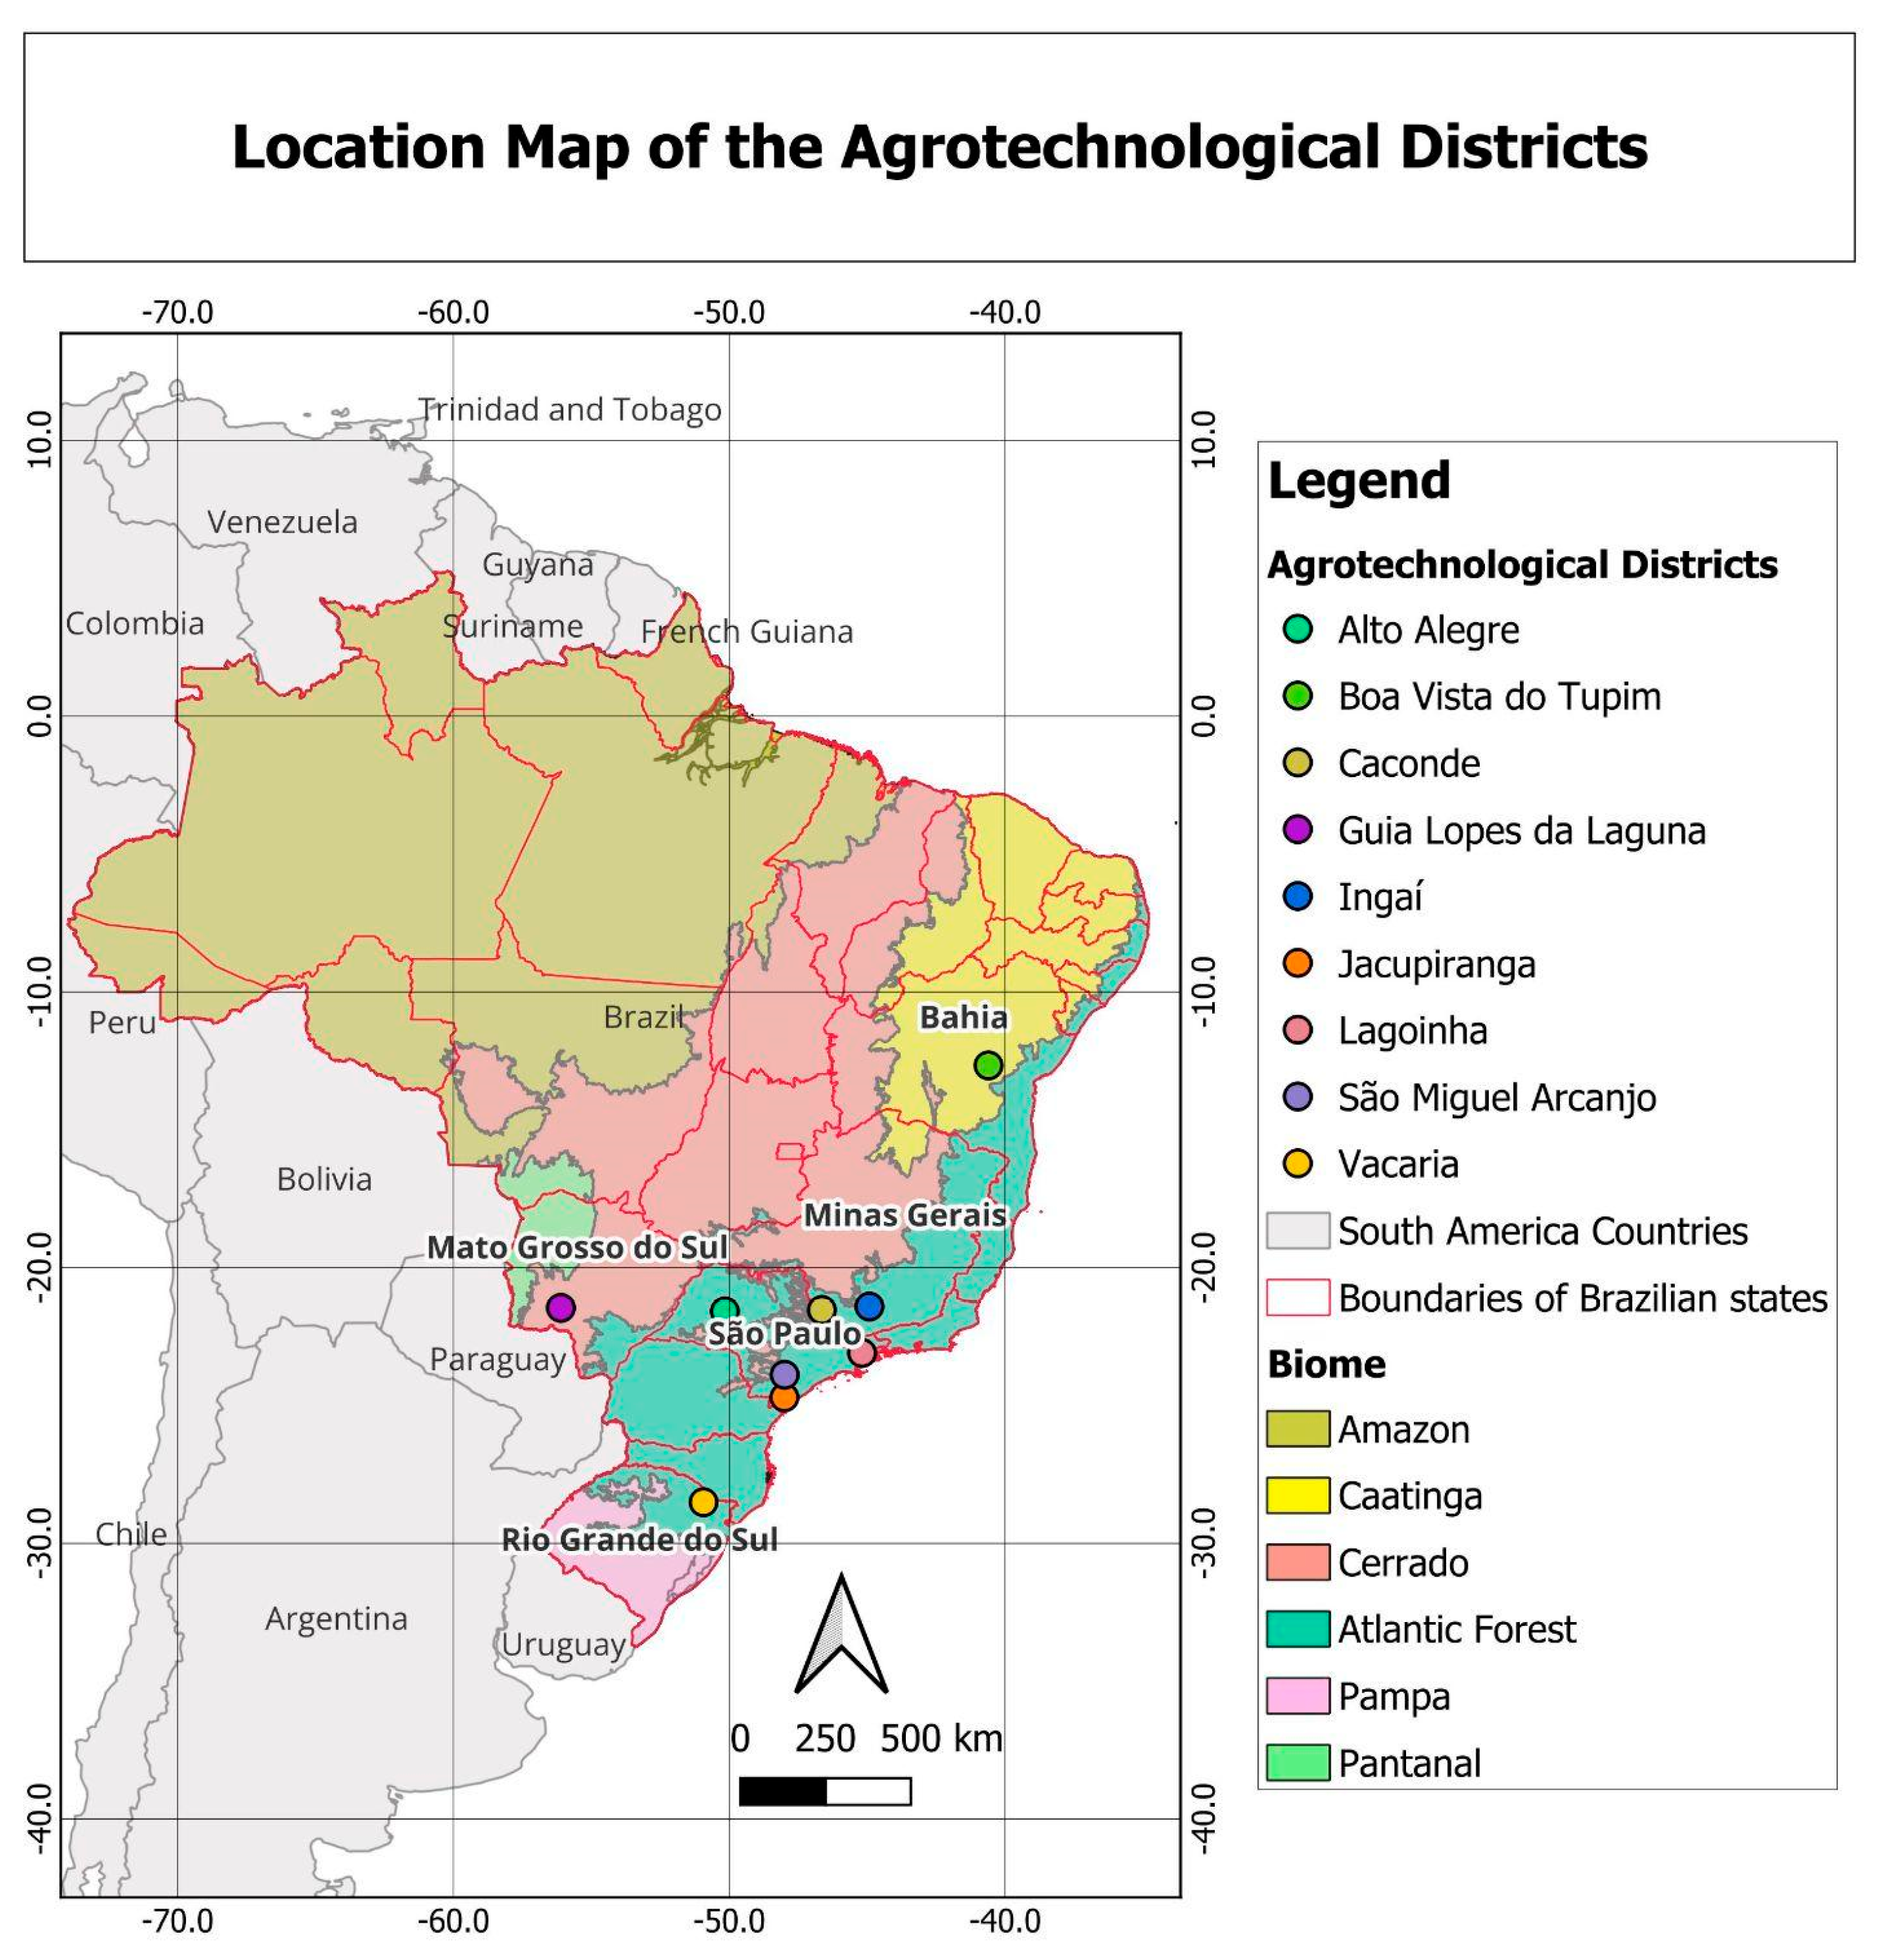
2.1. Study Area

Precipitation data from CHIRPS and land surface temperature data from MODIS were obtained for nine of the ten DATs: Alto Alegre, Boa Vista do Tupim, Caconde, Guia Lopes da Laguna, Ingaí, Jacupiranga, Lagoinha, São Miguel Arcanjo, and Vacaria (Figure 1). Ground-based climate observations for these DATs were sourced from the Agritempo database, which compiles daily climate data from 1600 weather stations across Brazil [41]. The locations and elevation of the Agritempo weather stations are provided in Table 1.
The DATs of Alto Alegre, Caconde, Jacupiranga, Lagoinha, São Miguel Arcanjo, Ingaí, and Vacaria are located in the Atlantic Forest biome. The first six are in southeastern Brazil, while Vacaria is in the Southern region.
Boa Vista do Tupim and Guia Lopes da Laguna are in the Caatinga and Cerrado biomes, respectively, corresponding to Brazil’s Northeastern and Midwest regions.

Climate and Elevation

According to the Köppen climate classification [42], Alto Alegre has an Aw climate, which is characterized as a tropical climate with dry winters. In contrast, Guia Lopes da Laguna features an Af climate, indicating a tropical climate without a dry season. Both the Aw and Af climates have average temperatures during the coldest month that are equal to 18 °C or higher (Table 2).
Caconde, Ingaí, and Lagoinha exhibit a Cwb climate, classified as a humid subtropical climate with dry winters and temperate summers, typical of highland areas in tropical regions. Jacupiranga and São Miguel Arcanjo display a Cfa climate, a humid subtropical oceanic climate lacking a dry season and hot summers. Vacaria experiences a Cfb climate, a humid subtropical oceanic climate with no dry season and temperate summers characterized by consistent year-round precipitation.
The Cwb, Cfa, and Cfb climate classifications are characterized by average temperatures in the coldest month ranging from −3 °C to just below 18 °C. On the other hand, Boa Vista do Tupim experiences a BSh climate, which signifies a dry semi-arid environment typical of low latitudes and altitudes. This climate type is further distinguished by an annual mean temperature of 18 °C or higher.
Mean elevation data from the Copernicus Global and European Digital Elevation Model (GLO-30 product) [43] shows variation across the study areas. Ingaí represents the highest elevation site at 953.64 m, followed by Caconde, Vacaria, and Lagoinha, all exceeding 850 m. São Miguel Arcanjo occupies an intermediate position at 700.89 m, while Alto Alegre and Boa Vista do Tupim cluster near 435 m. The lowest elevations occur in Jacupiranga (103.56 m) and Guia Lopes da Laguna (285.32 m).

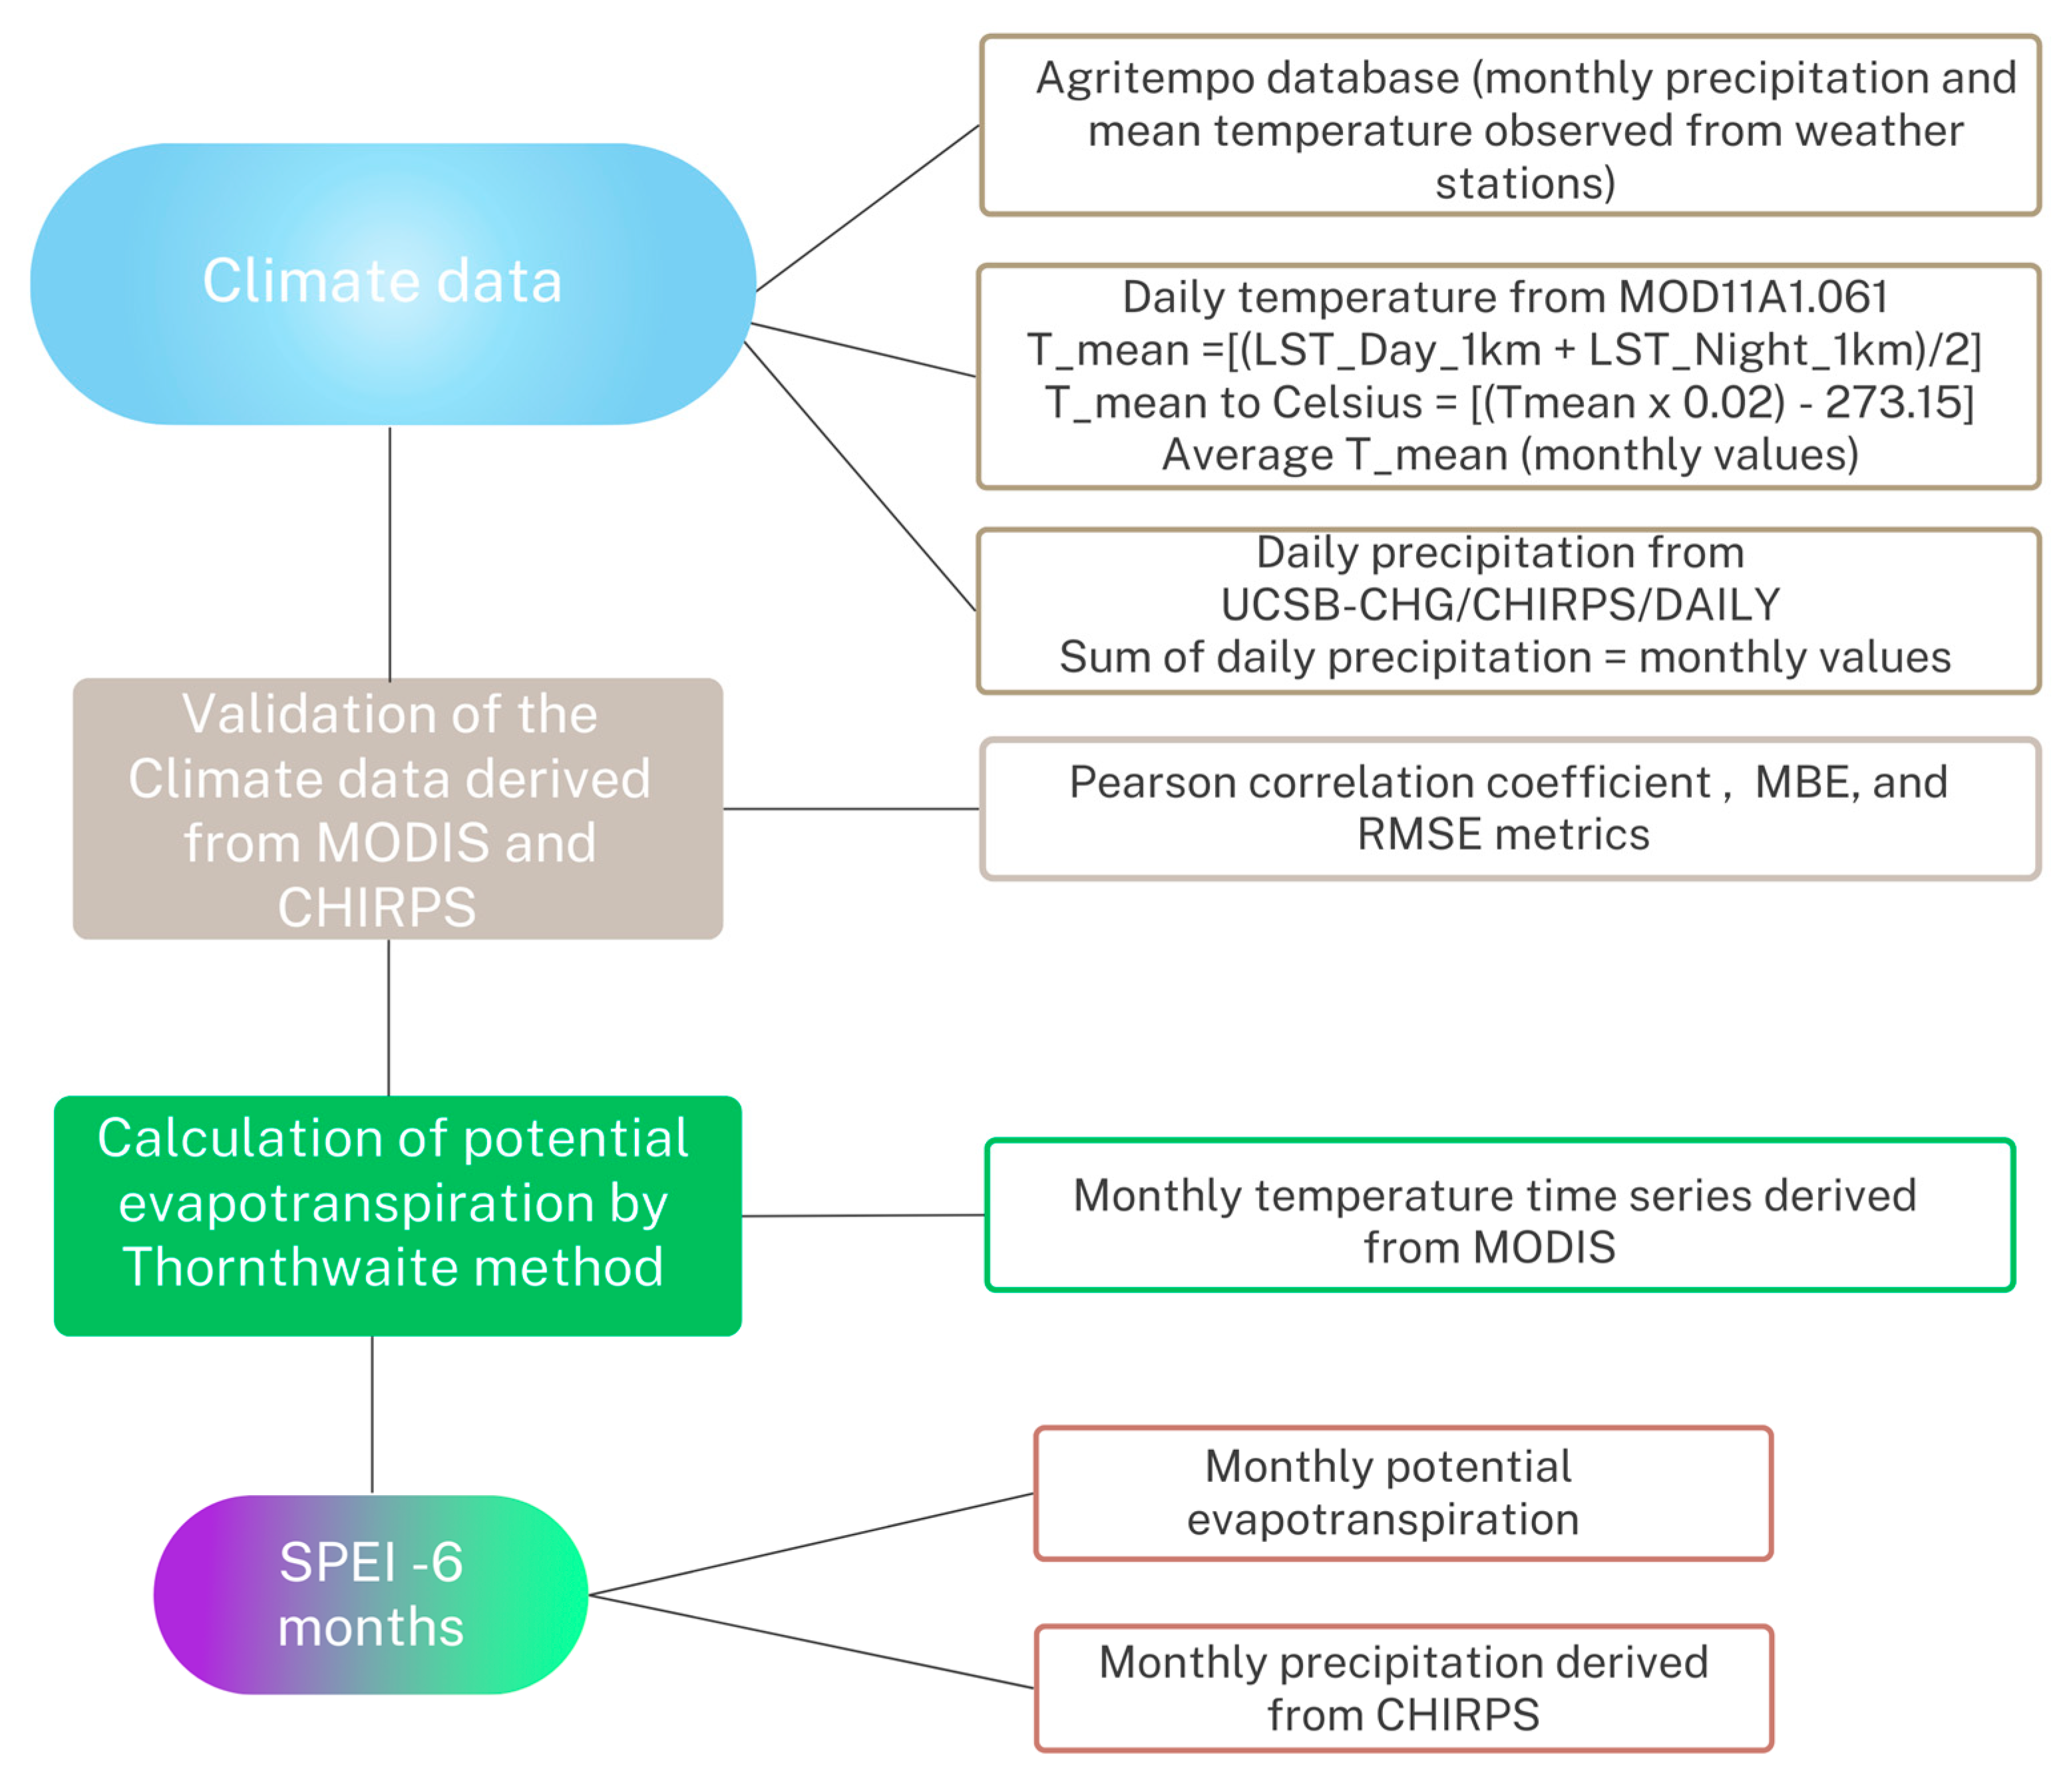
2.2. Validation and SPEI Calculation

To validate the precipitation and land surface temperature time series derived from CHIRPS and MODIS, respectively, we used observed monthly precipitation and temperature data from the Agritempo database.
The MODIS data from the Terra Moderate Resolution Imaging Spectroradiometer Land Surface Temperature/Emissivity Daily Version 6.1 (MOD11A1.061) product are available from 24 February 2000 to the present. It has a spatial resolution of 1 km and a temporal resolution of 1 day, providing daily per-pixel land surface temperature (LST) and emissivity [40].
We gathered mean daily LST data from March 2000 to October 2024 for all the DATs using the Google Earth Engine platform by averaging the MODIS daytime and nighttime LST (see Figure 2). The temperatures were then converted from Kelvin to degrees Celsius. If any data were missing during the studied period, we filled those gaps using linear interpolation.
CHIRPS measures atmospheric precipitation at a high resolution of 0.05° (≈5 km) and results from the combination of satellite and gridded data and in situ climate normal from weather stations. It calibrates global Cold Cloud Duration rainfall estimates using the Tropical Rainfall Measuring Mission Multi-satellite Precipitation Analysis version 7. Data are available from 1 January 1981, to the present [39]. Daily precipitation data from the UCSB-CHG/CHIRPS/DAILY product from March 2000 to October 2024 was retrieved using the Google Earth Engine platform (see Supplementary Materials).
We aggregated MODIS and CHIRPS data into monthly values and validated them using comprehensive statistical metrics. To assess the strength of the linear relationship between our derived data and ground-based observations from Agritempo, we calculated the Pearson correlation coefficient [44]. Additionally, we employed the mean bias error (MBE) to detect systematic biases (over- or under-predictions) and the root mean square error (RMSE) to evaluate overall prediction accuracy [45].
Table 3 summarizes these metrics, providing an interpretation that clarifies their implications for our analysis. Table 4 further classifies the Pearson correlation results based on established interpretation ranges, as defined by Schober et al. [46].
After the validation process, MODIS monthly temperature data and the DATs’ latitude were utilized to calculate PET using the Thornthwaite method [33]. This calculation was performed with a Python (version 3.11.6) script (see Supplementary Materials), following the methodology outlined in [20].
Monthly precipitation and evapotranspiration data were used to calculate the SPEI using the R (version 4.4.2) Package SPEI [47]. According to the WMO guidelines [34], agricultural drought is typically evaluated using timescales ranging from 1 to 6 months. For this study, a 6-month timescale was chosen to account for the varying growth cycles of crops.

2.3. Analysis of Trends: Comparing 2000–2012 and 2013–2024

We analyzed precipitation, temperature, and SPEI-6 trends over two periods: 2000–2012 and 2013–2024. This comparative approach enabled us to assess whether droughts have increased in frequency and severity in recent years and to investigate the extent to which changes in precipitation and temperature patterns contribute to the observed trend.
Raster files from MODIS and CHIRPS, containing the mean for 2000–2012 and 2013–2024, were used to calculate the anomaly for temperature and precipitation, respectively, following Equation (1).
Z = (F − H)
where: F = mean temperature or precipitation for the 2013–2024 period, H = mean temperature or precipitation for the 2000–2012 period, and Z = computed anomaly.
Positive values of the anomaly indicate that the precipitation or temperature for the 2013–2024 period is above that of the 2000–2012 period. In contrast, negative values indicate the opposite.
We applied the Modified Mann–Kendall (MMK) test to detect trends in precipitation, temperature, and SPEI data for the 2000–2012 and 2013–2024 periods at a 5% significance level. This statistical test, proposed by Hamed and Rao (1998) [48], adjusts the variance of the Mann–Kendall test to minimize the effects of autocorrelation, ensuring more accurate trend analysis. All significant lags were considered. The null hypothesis (H0) assumes no trend, while the alternative hypothesis (H1) indicates a monotonic trend. The analysis was conducted in Python using the pymannkendall package [49].

2.4. SPEI Intensity and Frequency: Comparing 2000–2012 and 2013–2024

We classified the SPEI-6 results into different degrees of intensity, following the methodology described in the Drought Monitor of Brazil [50]. Drought intensity was divided into five categories: slight drought, moderate drought, severe drought, extreme drought, and exceptional drought (Table 5).
The classification process was implemented using a Python script, and a pie chart was used to compare the 2000–2012 and 2013–2024 periods, considering each Agrotechnological District.

3. Results

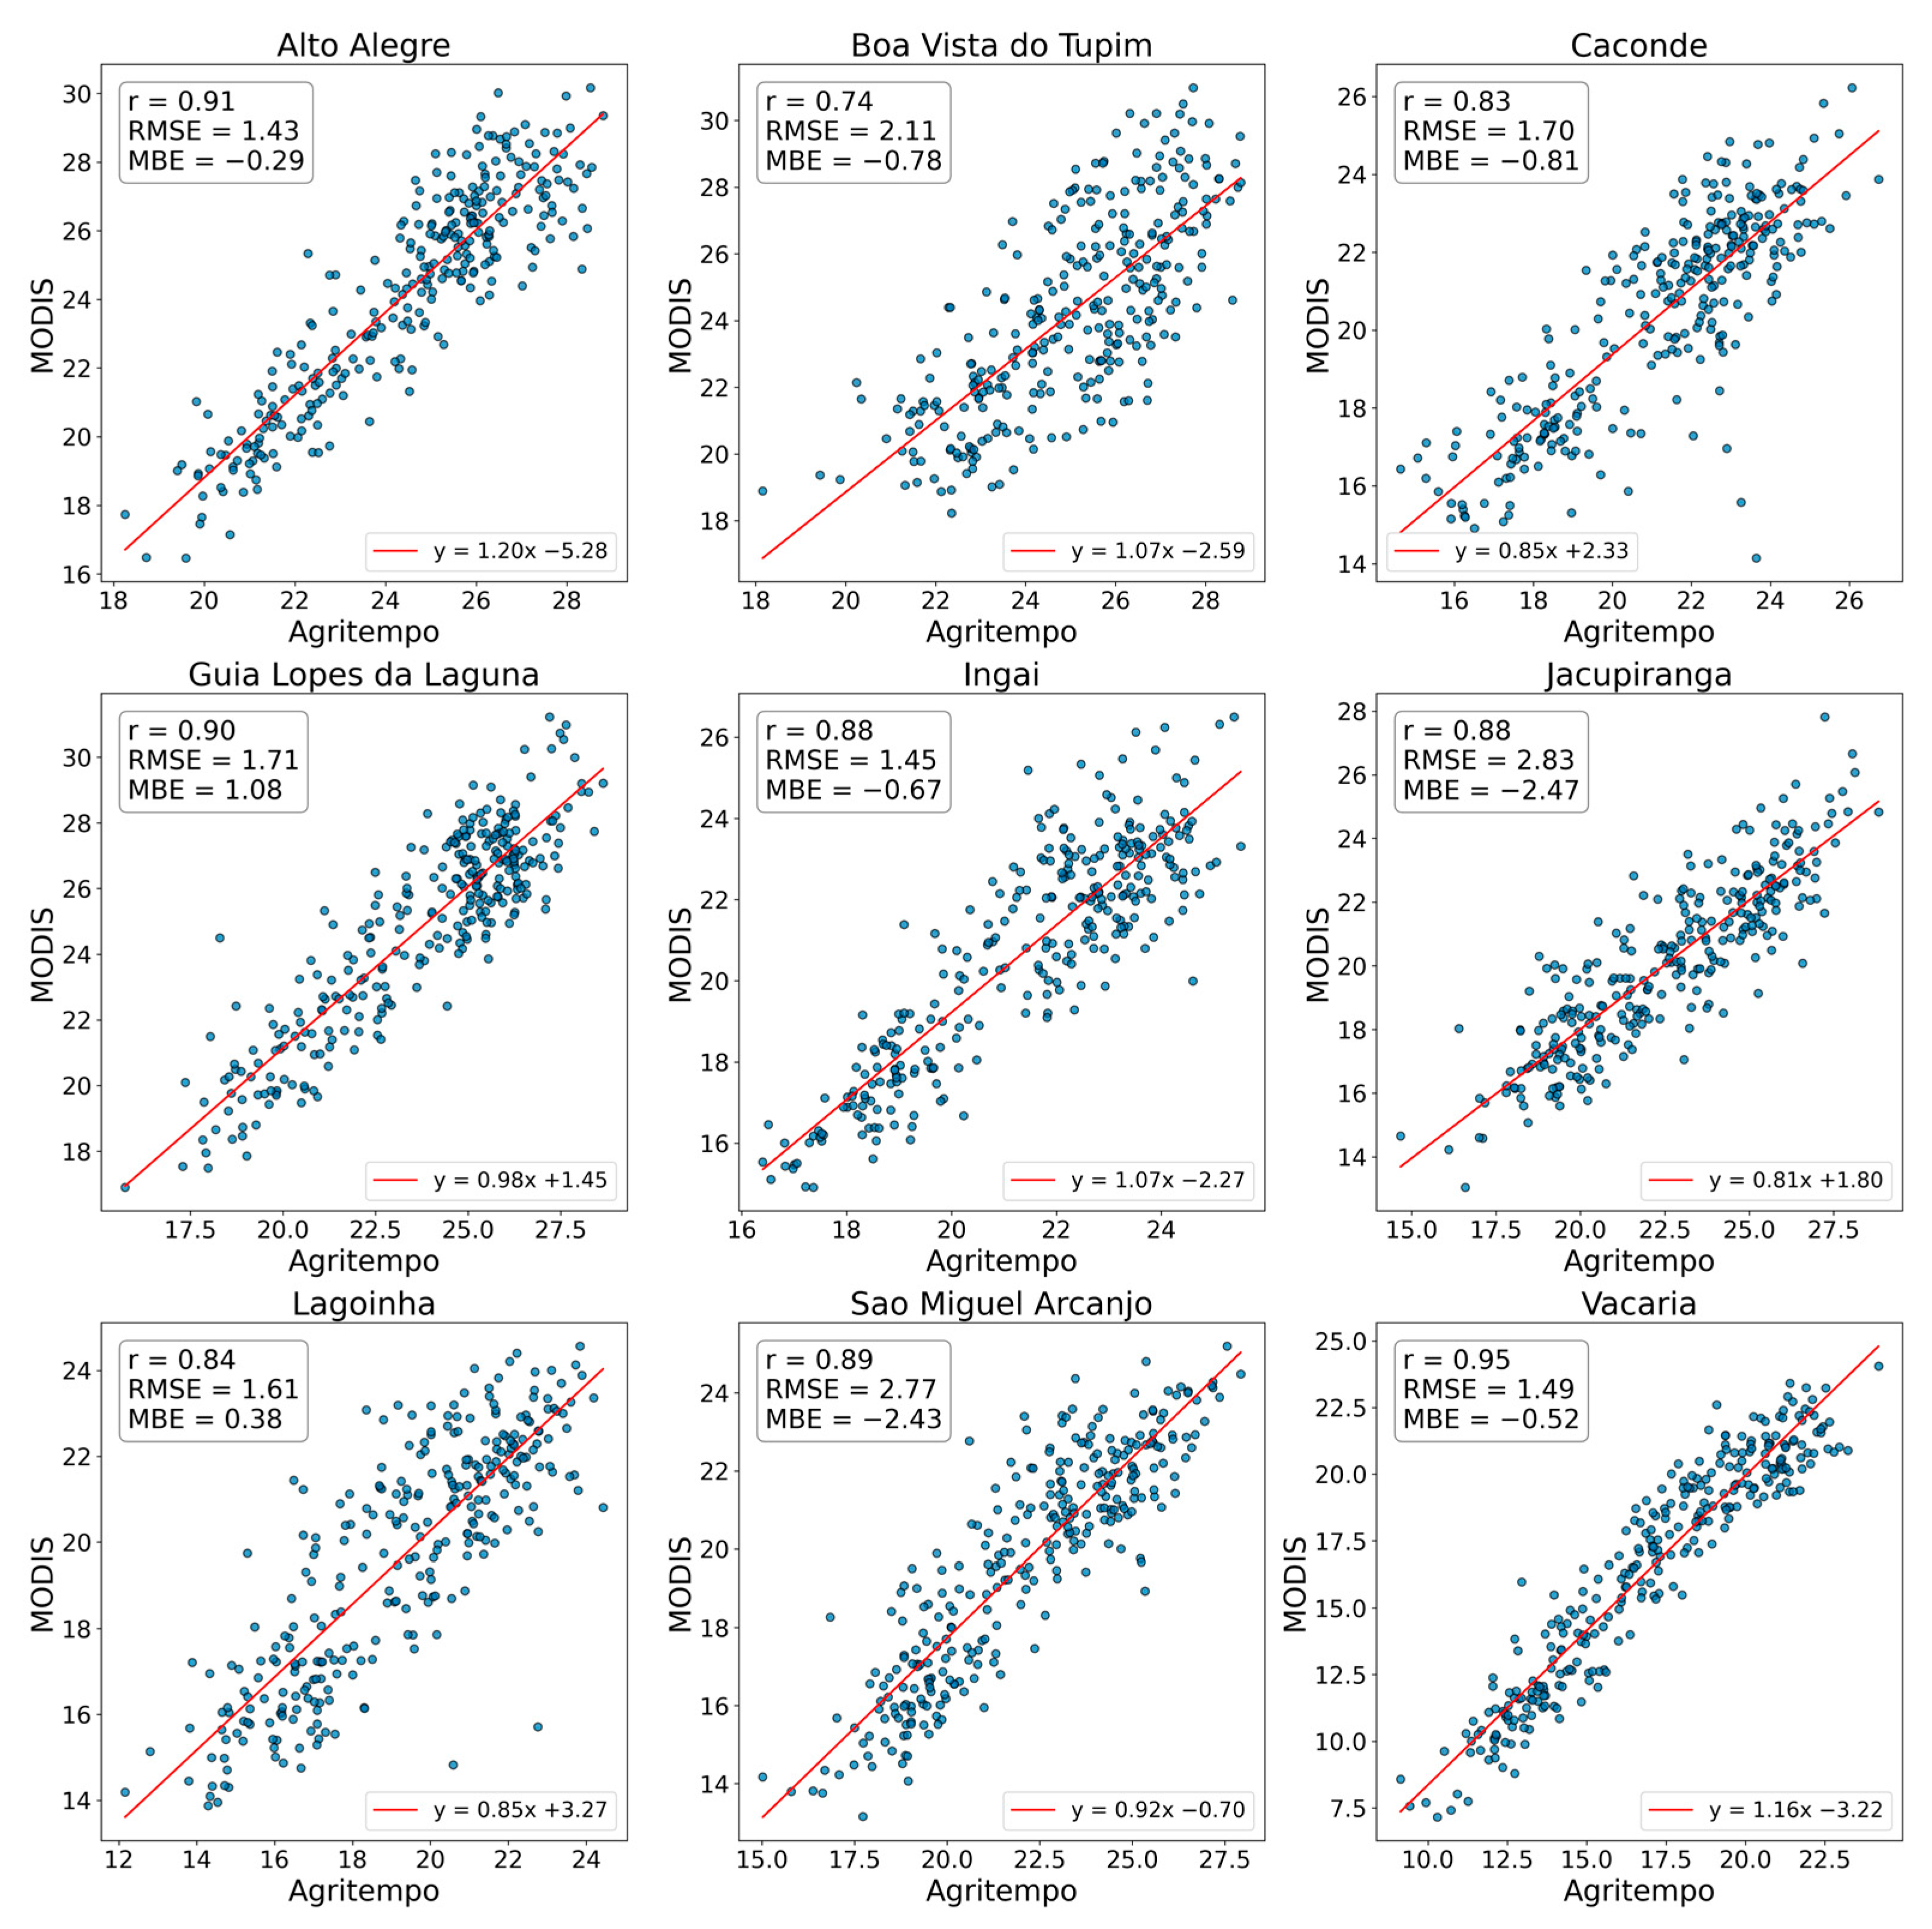
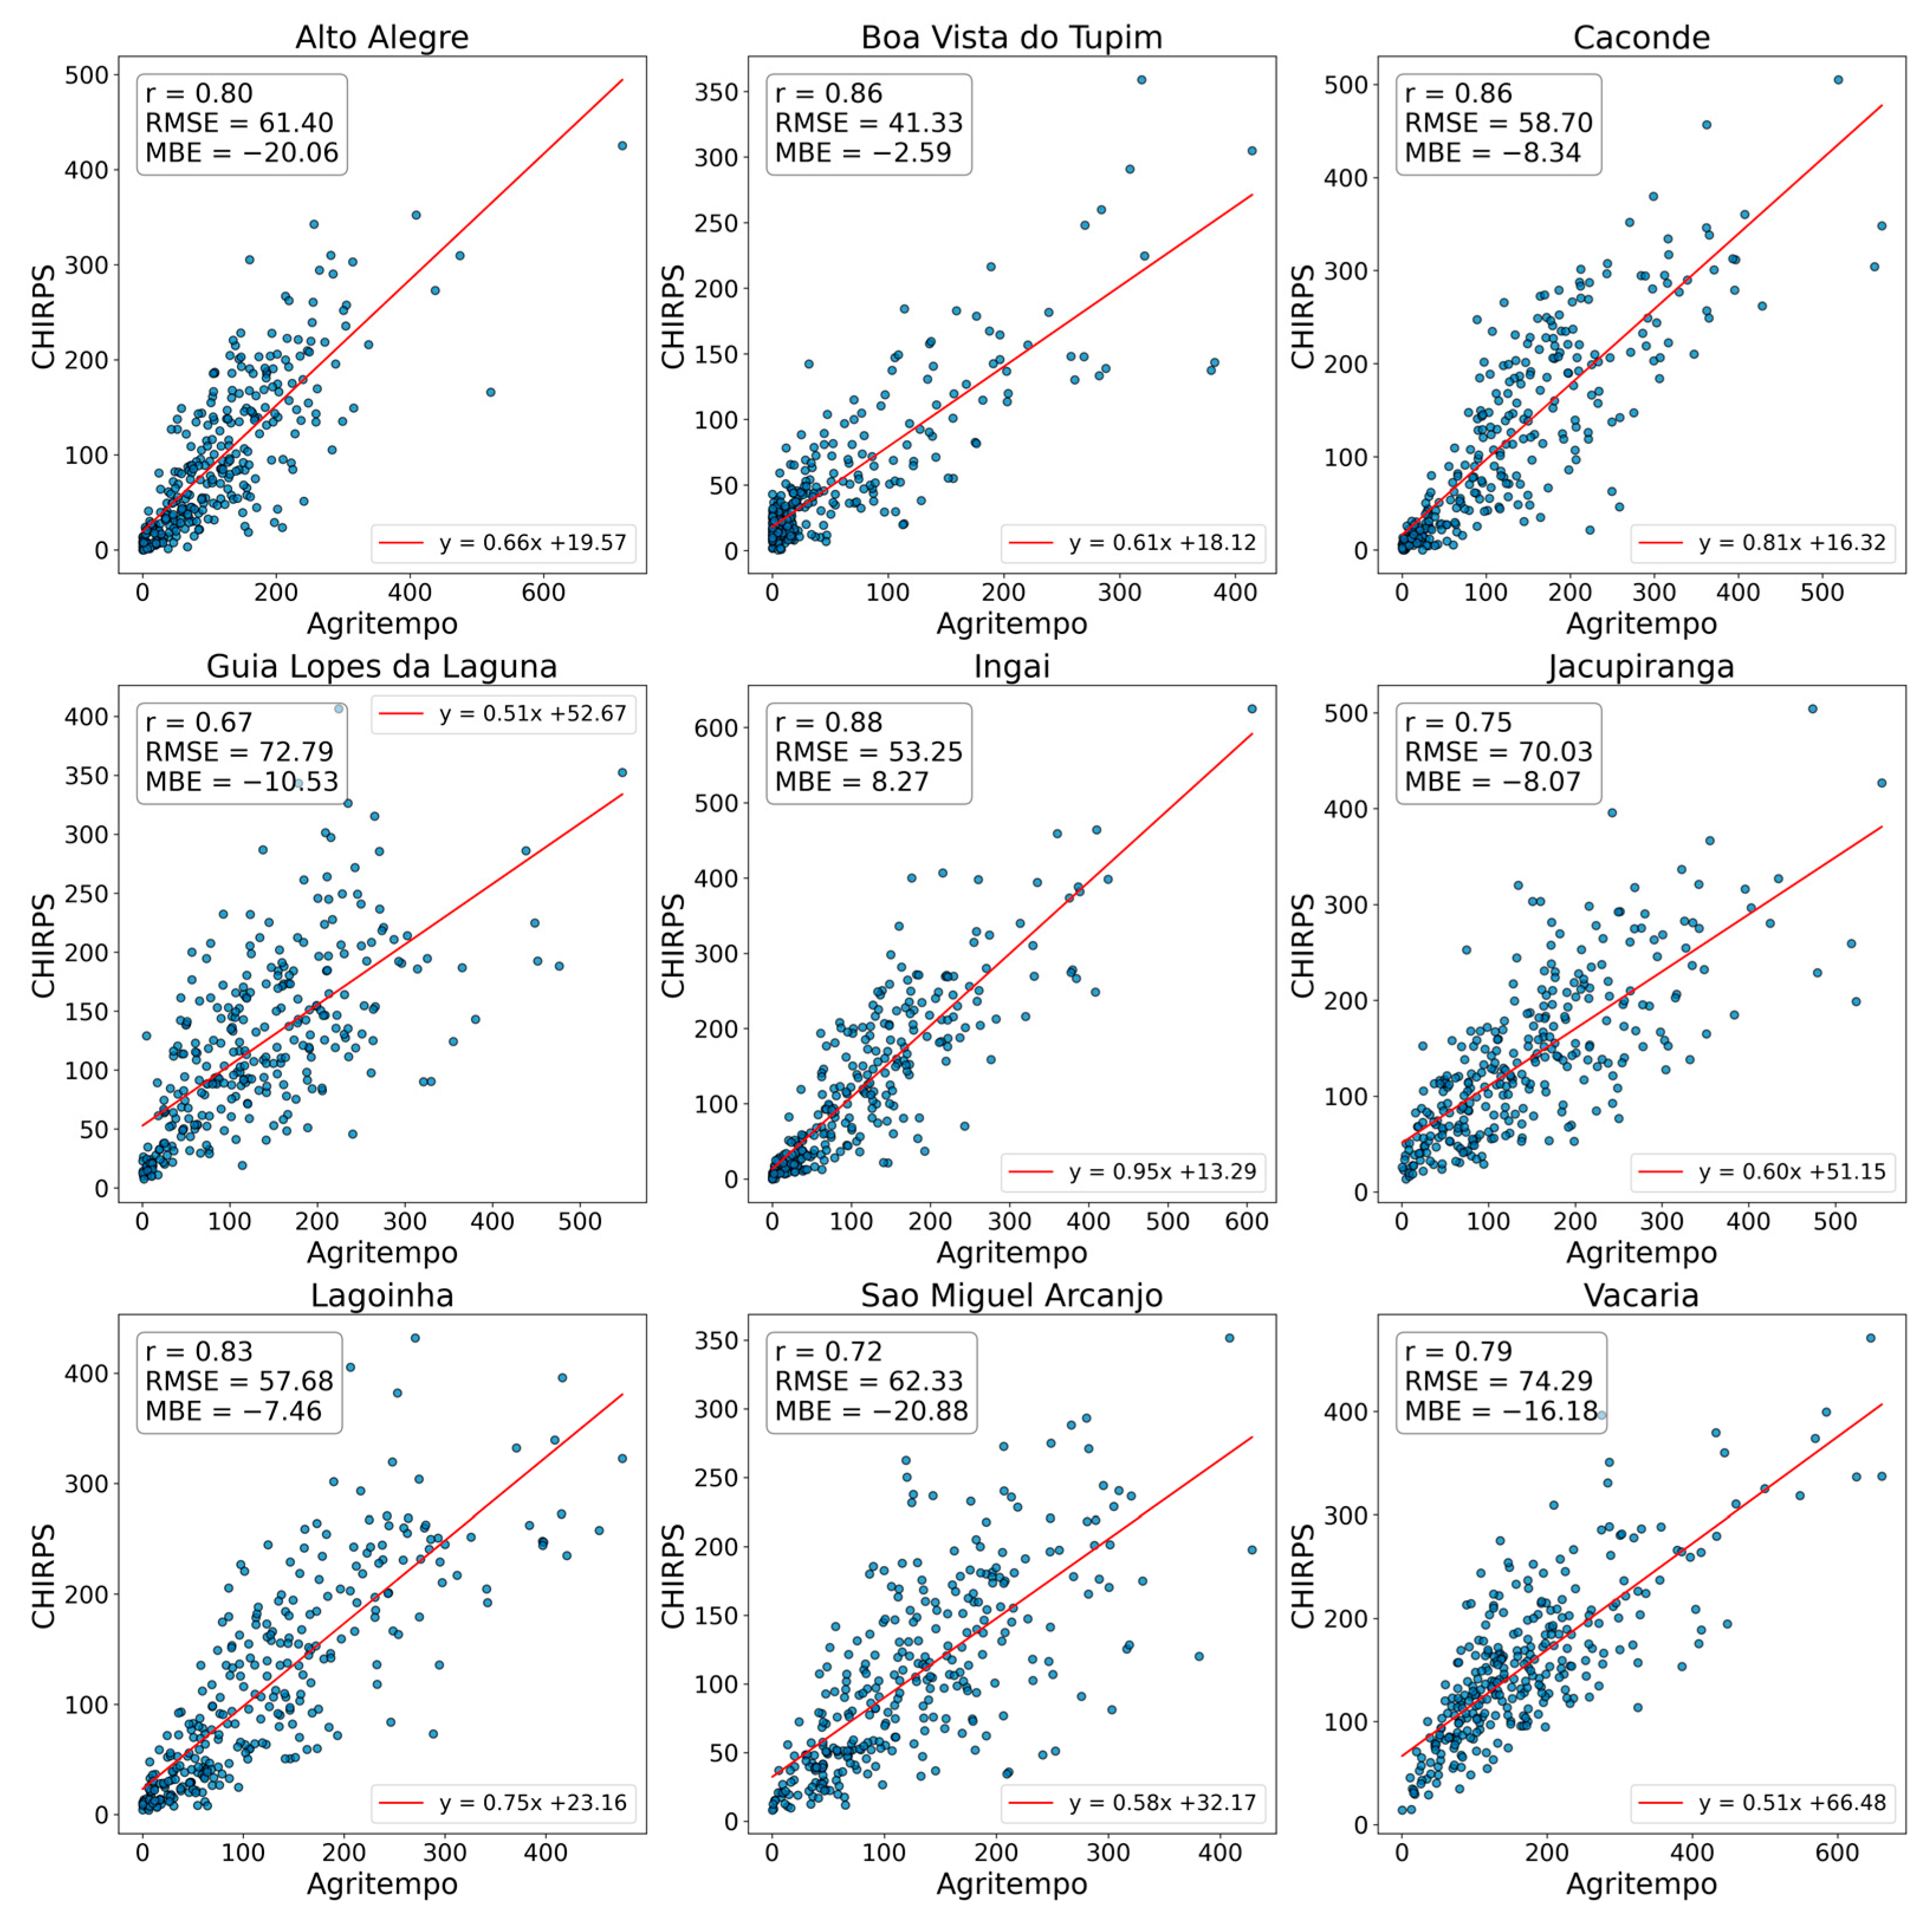
3.1. Validation of Climate Data Derived from Remote Sensing

Pearson correlation coefficients (r) exceeded 0.80 in eight of the nine DATs (Alto Alegre, Caconde, Guia Lopes da Laguna, Ingaí, Jacupiranga, Lagoinha, São Miguel Arcanjo, and Vacaria), indicating a strong linear relationship between monthly MODIS LST data and Agritempo weather station measurements. The RMSE values, which quantify overall deviation from observed values, ranged from 1.43 °C to 2.83 °C. Alto Alegre, Caconde, Guia Lopes da Laguna, Ingaí, Lagoinha, and Vacaria exhibited lower RMSEs (<1.72 °C). While Boa Vista do Tupim, Jacupiranga, and São Miguel Arcanjo showed higher deviations (>2 °C), with RMSEs of 2.11 °C, 2.83 °C, and 2.77 °C, respectively (Figure 3).
The MBE revealed a positive bias in MODIS temperatures compared to Agritempo at Guia Lopes da Laguna (MBE = 1.08 °C) and Lagoinha (MBE = 0.38 °C), indicating MODIS overestimation. In contrast, MODIS temperatures exhibited a systematic negative bias in the remaining DATs, with MBE values ranging from −0.29 °C to −2.47 °C. Specifically, Alto Alegre (−0.29 °C), Boa Vista do Tupim (−0.78 °C), Caconde (−0.81 °C), Ingaí (−0.67 °C), Jacupiranga (−2.47 °C), São Miguel Arcanjo (−2.43 °C), and Vacaria (−0.52 °C) all showed underestimation by MODIS.
Monthly CHIRPS precipitation data showed strong linear relationships with Agritempo ground observations across all DATs. Five locations (Alto Alegre, Boa Vista do Tupim, Caconde, Ingaí, and Lagoinha) exhibited particularly strong correlations (r ≥ 0.80), while the remaining four (Guia Lopes da Laguna, Jacupiranga, São Miguel Arcanjo, and Vacaria) showed slightly lower but still strong linear relationships, with coefficients ranging from r = 0.67 to r = 0.79 (Figure 4).
The RMSE, which quantifies the average error in CHIRPS precipitation data relative to Agritempo, ranged from 41.33 mm/month in Boa Vista do Tupim to 74.29 mm/month in Vacaria. CHIRPS slightly overestimated precipitation in Ingaí, with an MBE of +8.27 mm/month. In contrast, in all other DATs, CHIRPS consistently underestimated precipitation, with the most pronounced underestimations observed in Alto Alegre (−20.06 mm/month), São Miguel Arcanjo (−20.88 mm/month), and Vacaria (−16.18 mm/month).

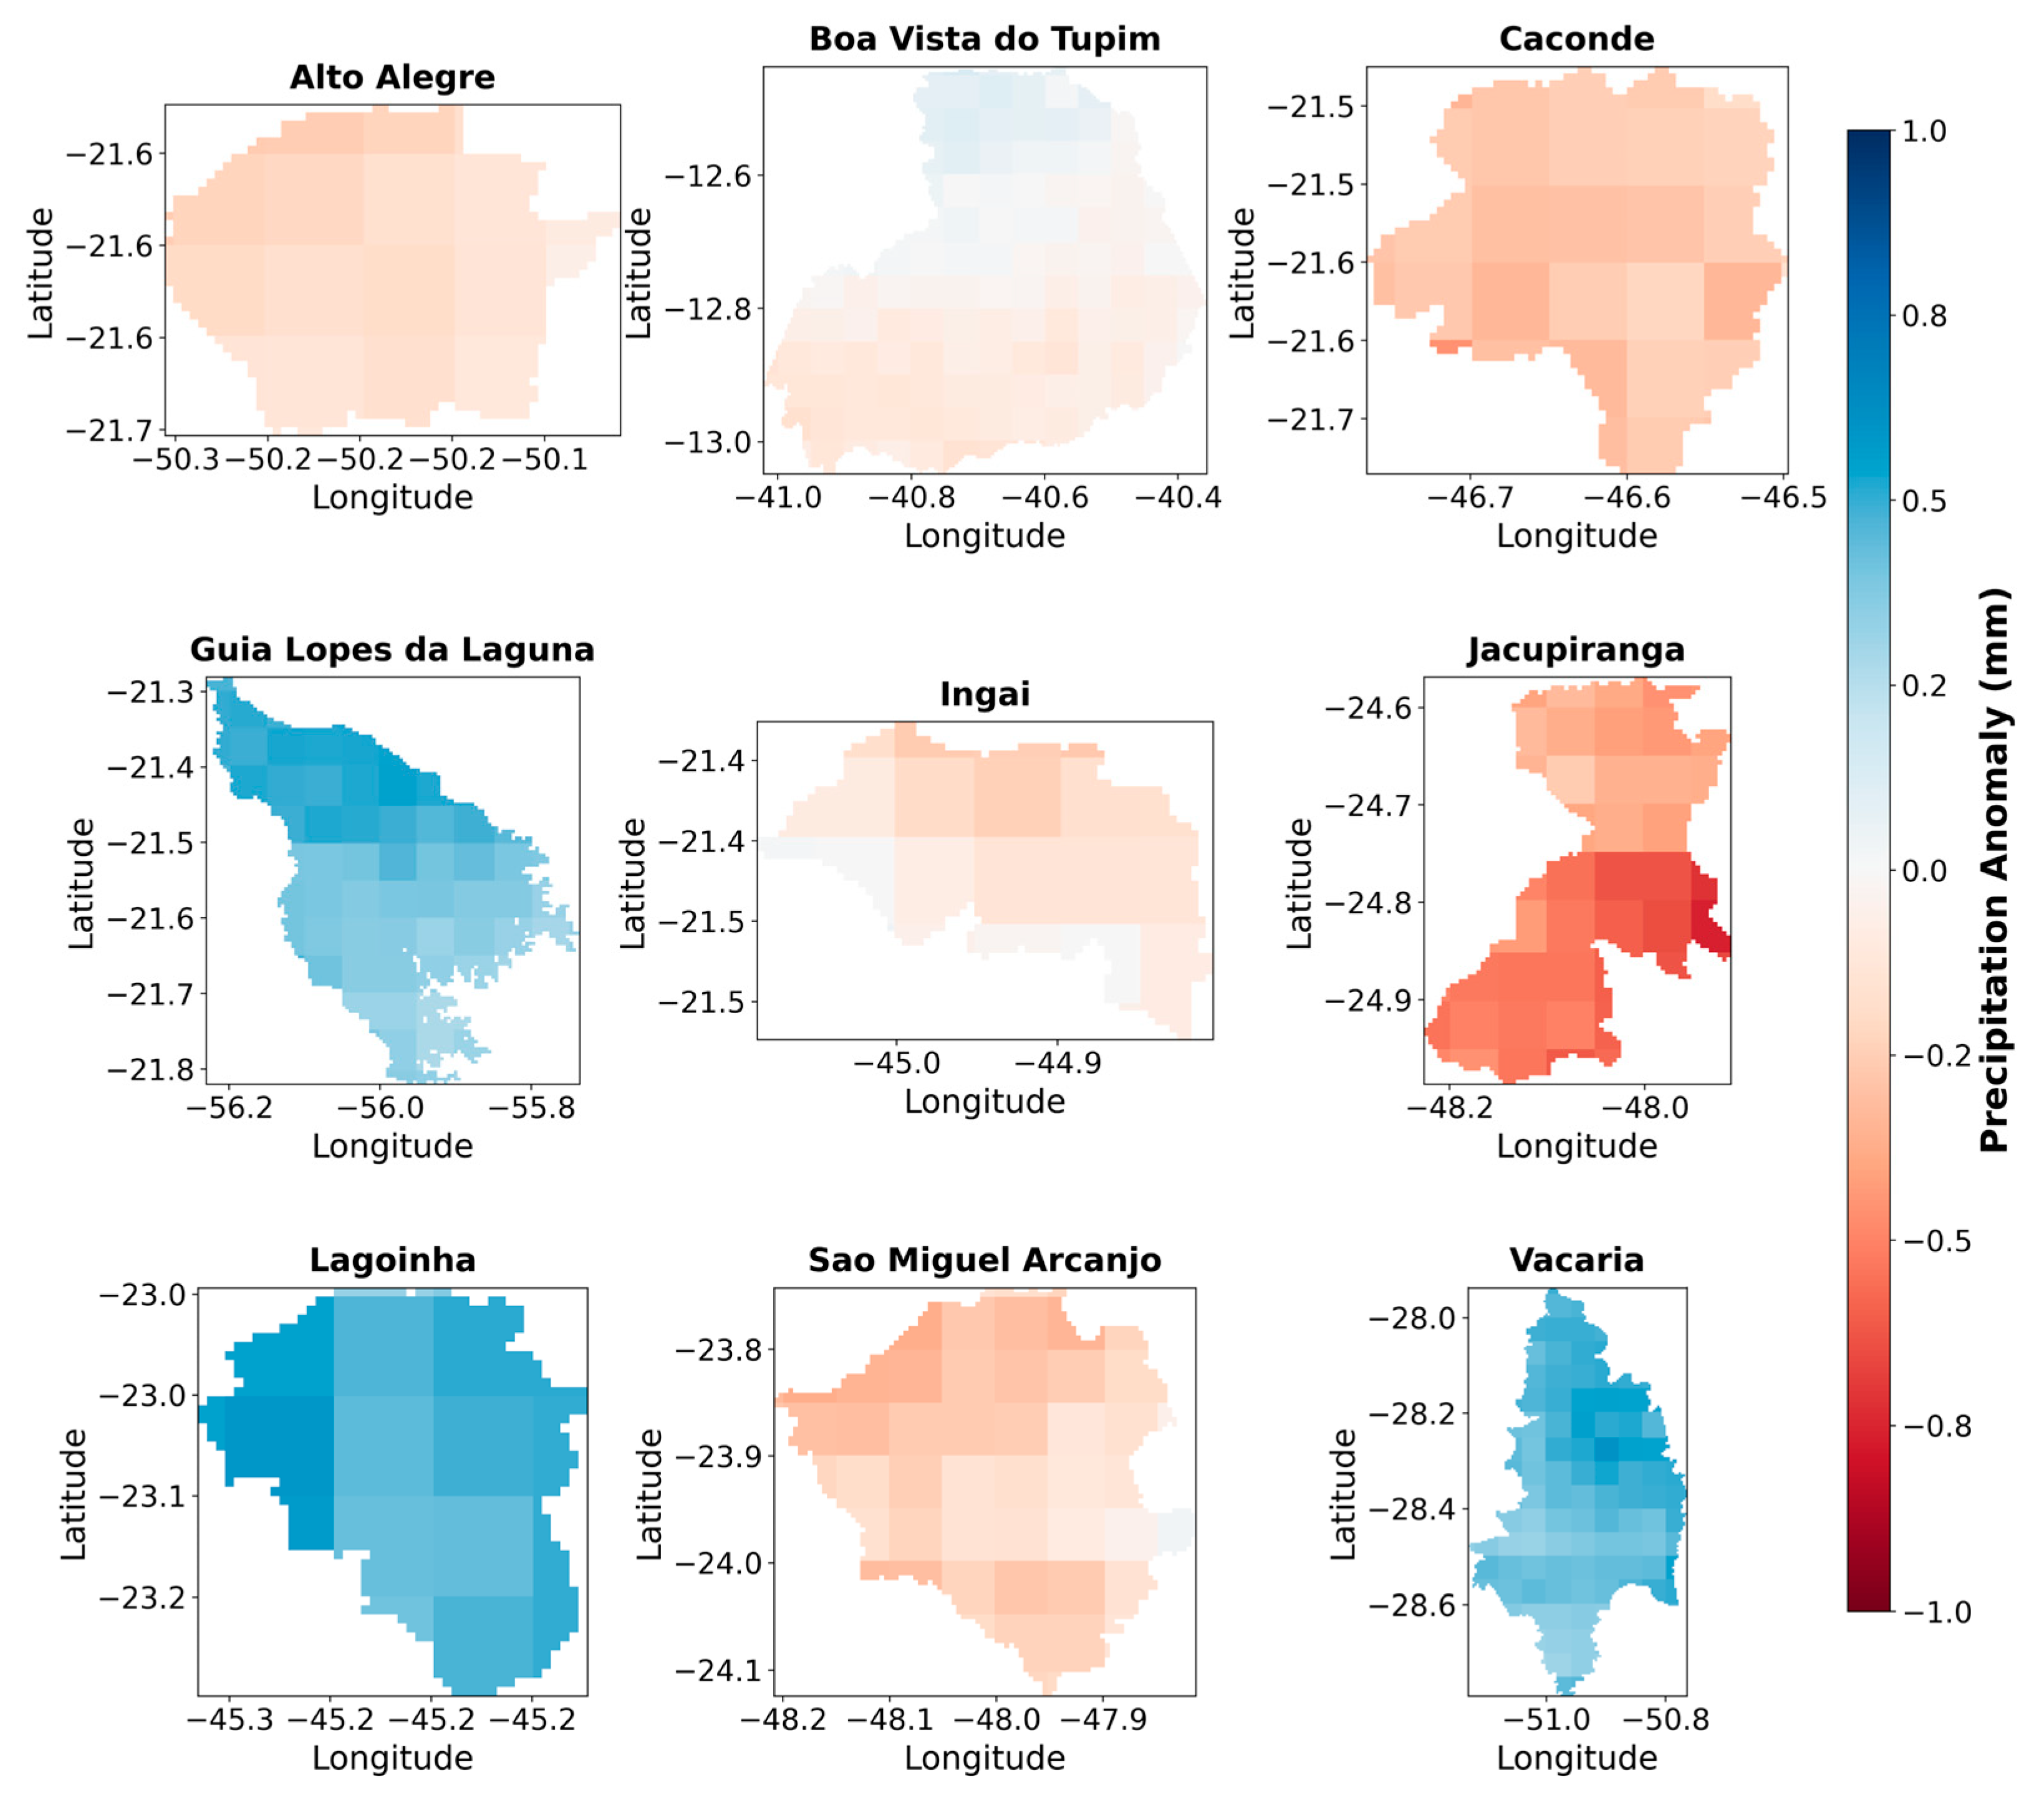
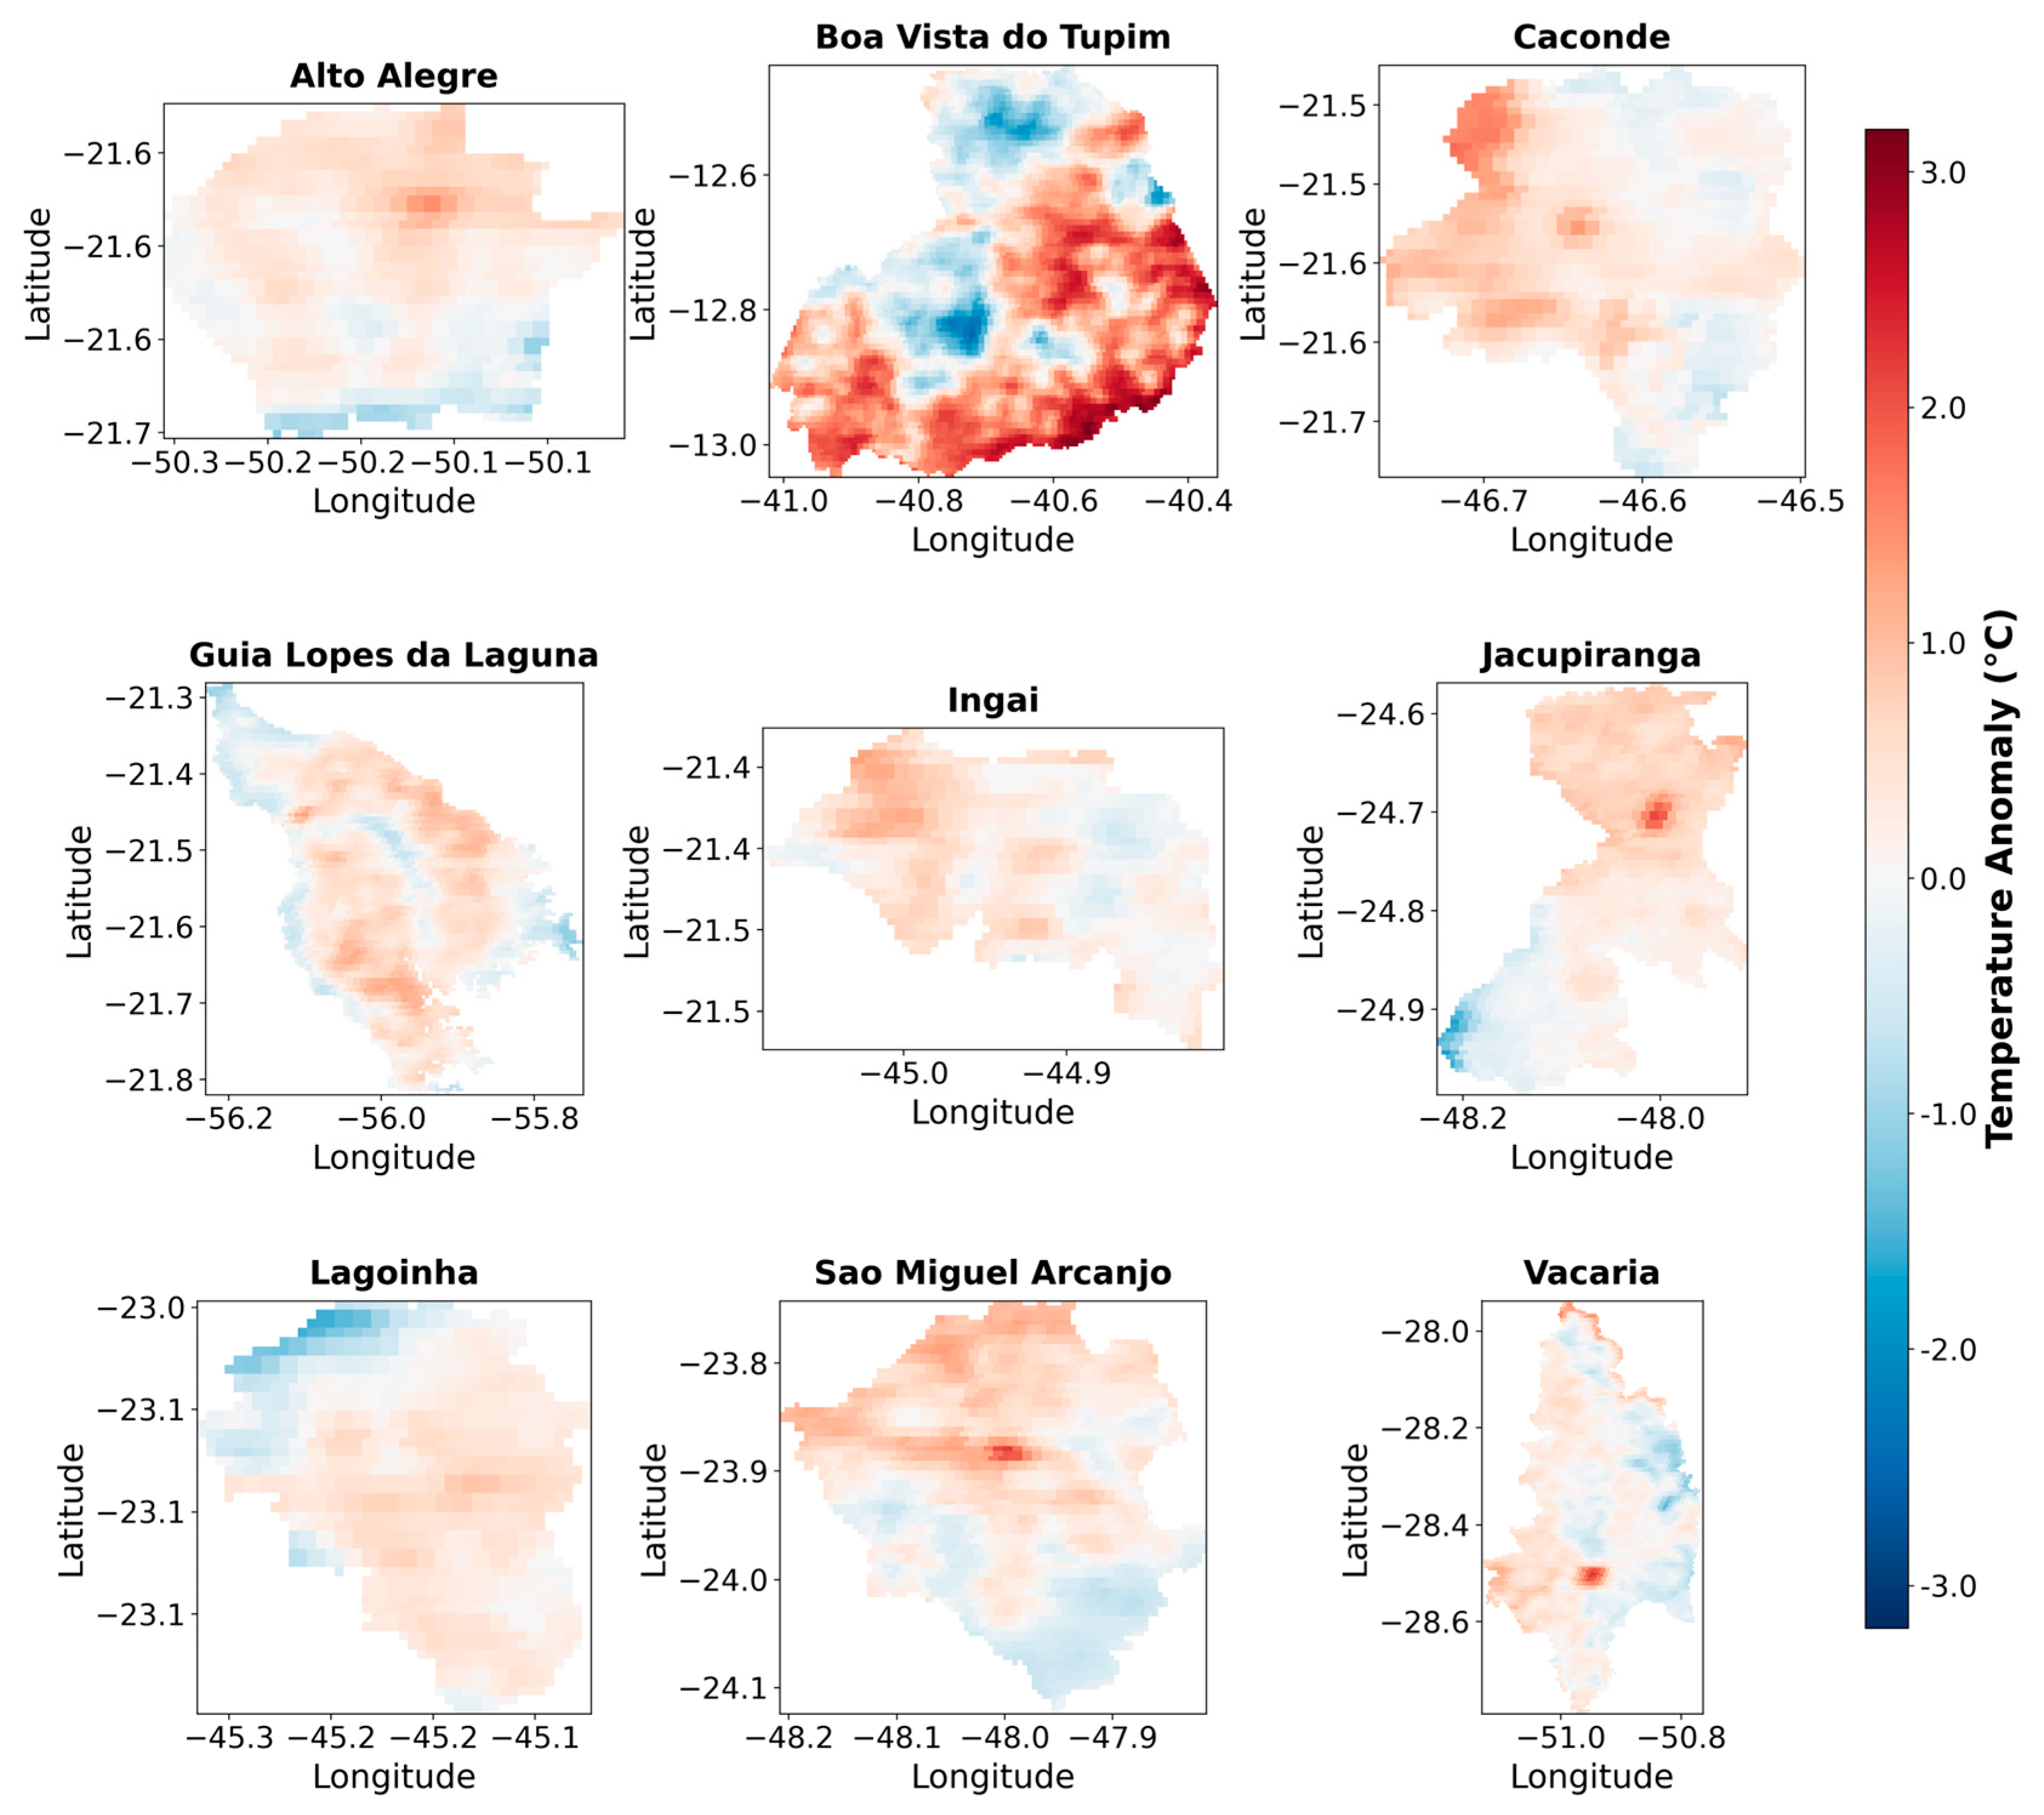
3.2. Precipitation and Temperature Anomaly

The changes in precipitation anomalies from 2013 to 2024, compared to the period from 2000 to 2012, displayed spatial variation. The maximum values ranged from −0.11 to 1.13 mm, while the minimum values varied from −1.09 to 0.35 mm (Figure 5 and Table 6).
The mean precipitation anomalies revealed distinct regional patterns. Guia Lopes da Laguna, Lagoinha, and Vacaria experienced increases ranging from 0.42 to 0.49 mm above the 2000–2012 baseline. In contrast, the remaining six DATs—Alto Alegre, Boa Vista do Tupim, Caconde, Ingaí, Jacupiranga, and São Miguel Arcanjo—showed decreases, ranging from −0.48 mm (Jacupiranga) to −0.04 mm (Boa Vista do Tupim) below the baseline. Trend analysis further clarified these patterns: Guia Lopes da Laguna, Jacupiranga, São Miguel Arcanjo, and Vacaria exhibited statistically significant increasing trends, while Alto Alegre showed a decreasing trend. No statistically significant trends were observed for Boa Vista do Tupim, Caconde, Ingaí, or Lagoinha. Despite the negative mean anomaly in São Miguel Arcanjo, the MMK test indicated an increasing trend for this agrotechnological district (Table 6).
Temperature anomalies also exhibited spatial variation, with maximum anomalies ranging from 0.90 to 3.18 °C and minimum anomalies ranging from −2.52 to −0.56 °C (Figure 6, Table 7).
Results from the analysis of the mean temperature anomalies demonstrated that 2013–2024 was warmer than the baseline period of 2000–2012, with anomalies ranging from 0.09 to 0.70 °C. In most DATs, mean temperature anomalies remained below 0.50 °C, except for Boa Vista do Tupim, which recorded a mean anomaly of 0.70 °C. Notwithstanding this overall warming trend, the MMK test revealed a divergent pattern, indicating statistically significant increasing trends only for Boa Vista do Tupim and Lagoinha DATs. Conversely, decreasing trends were observed in Alto Alegre, Ingaí, Jacupiranga, and São Miguel Arcanjo, while no statistically significant trend was detected for Caconde, Guia Lopes da Laguna, and Vacaria (Table 7).

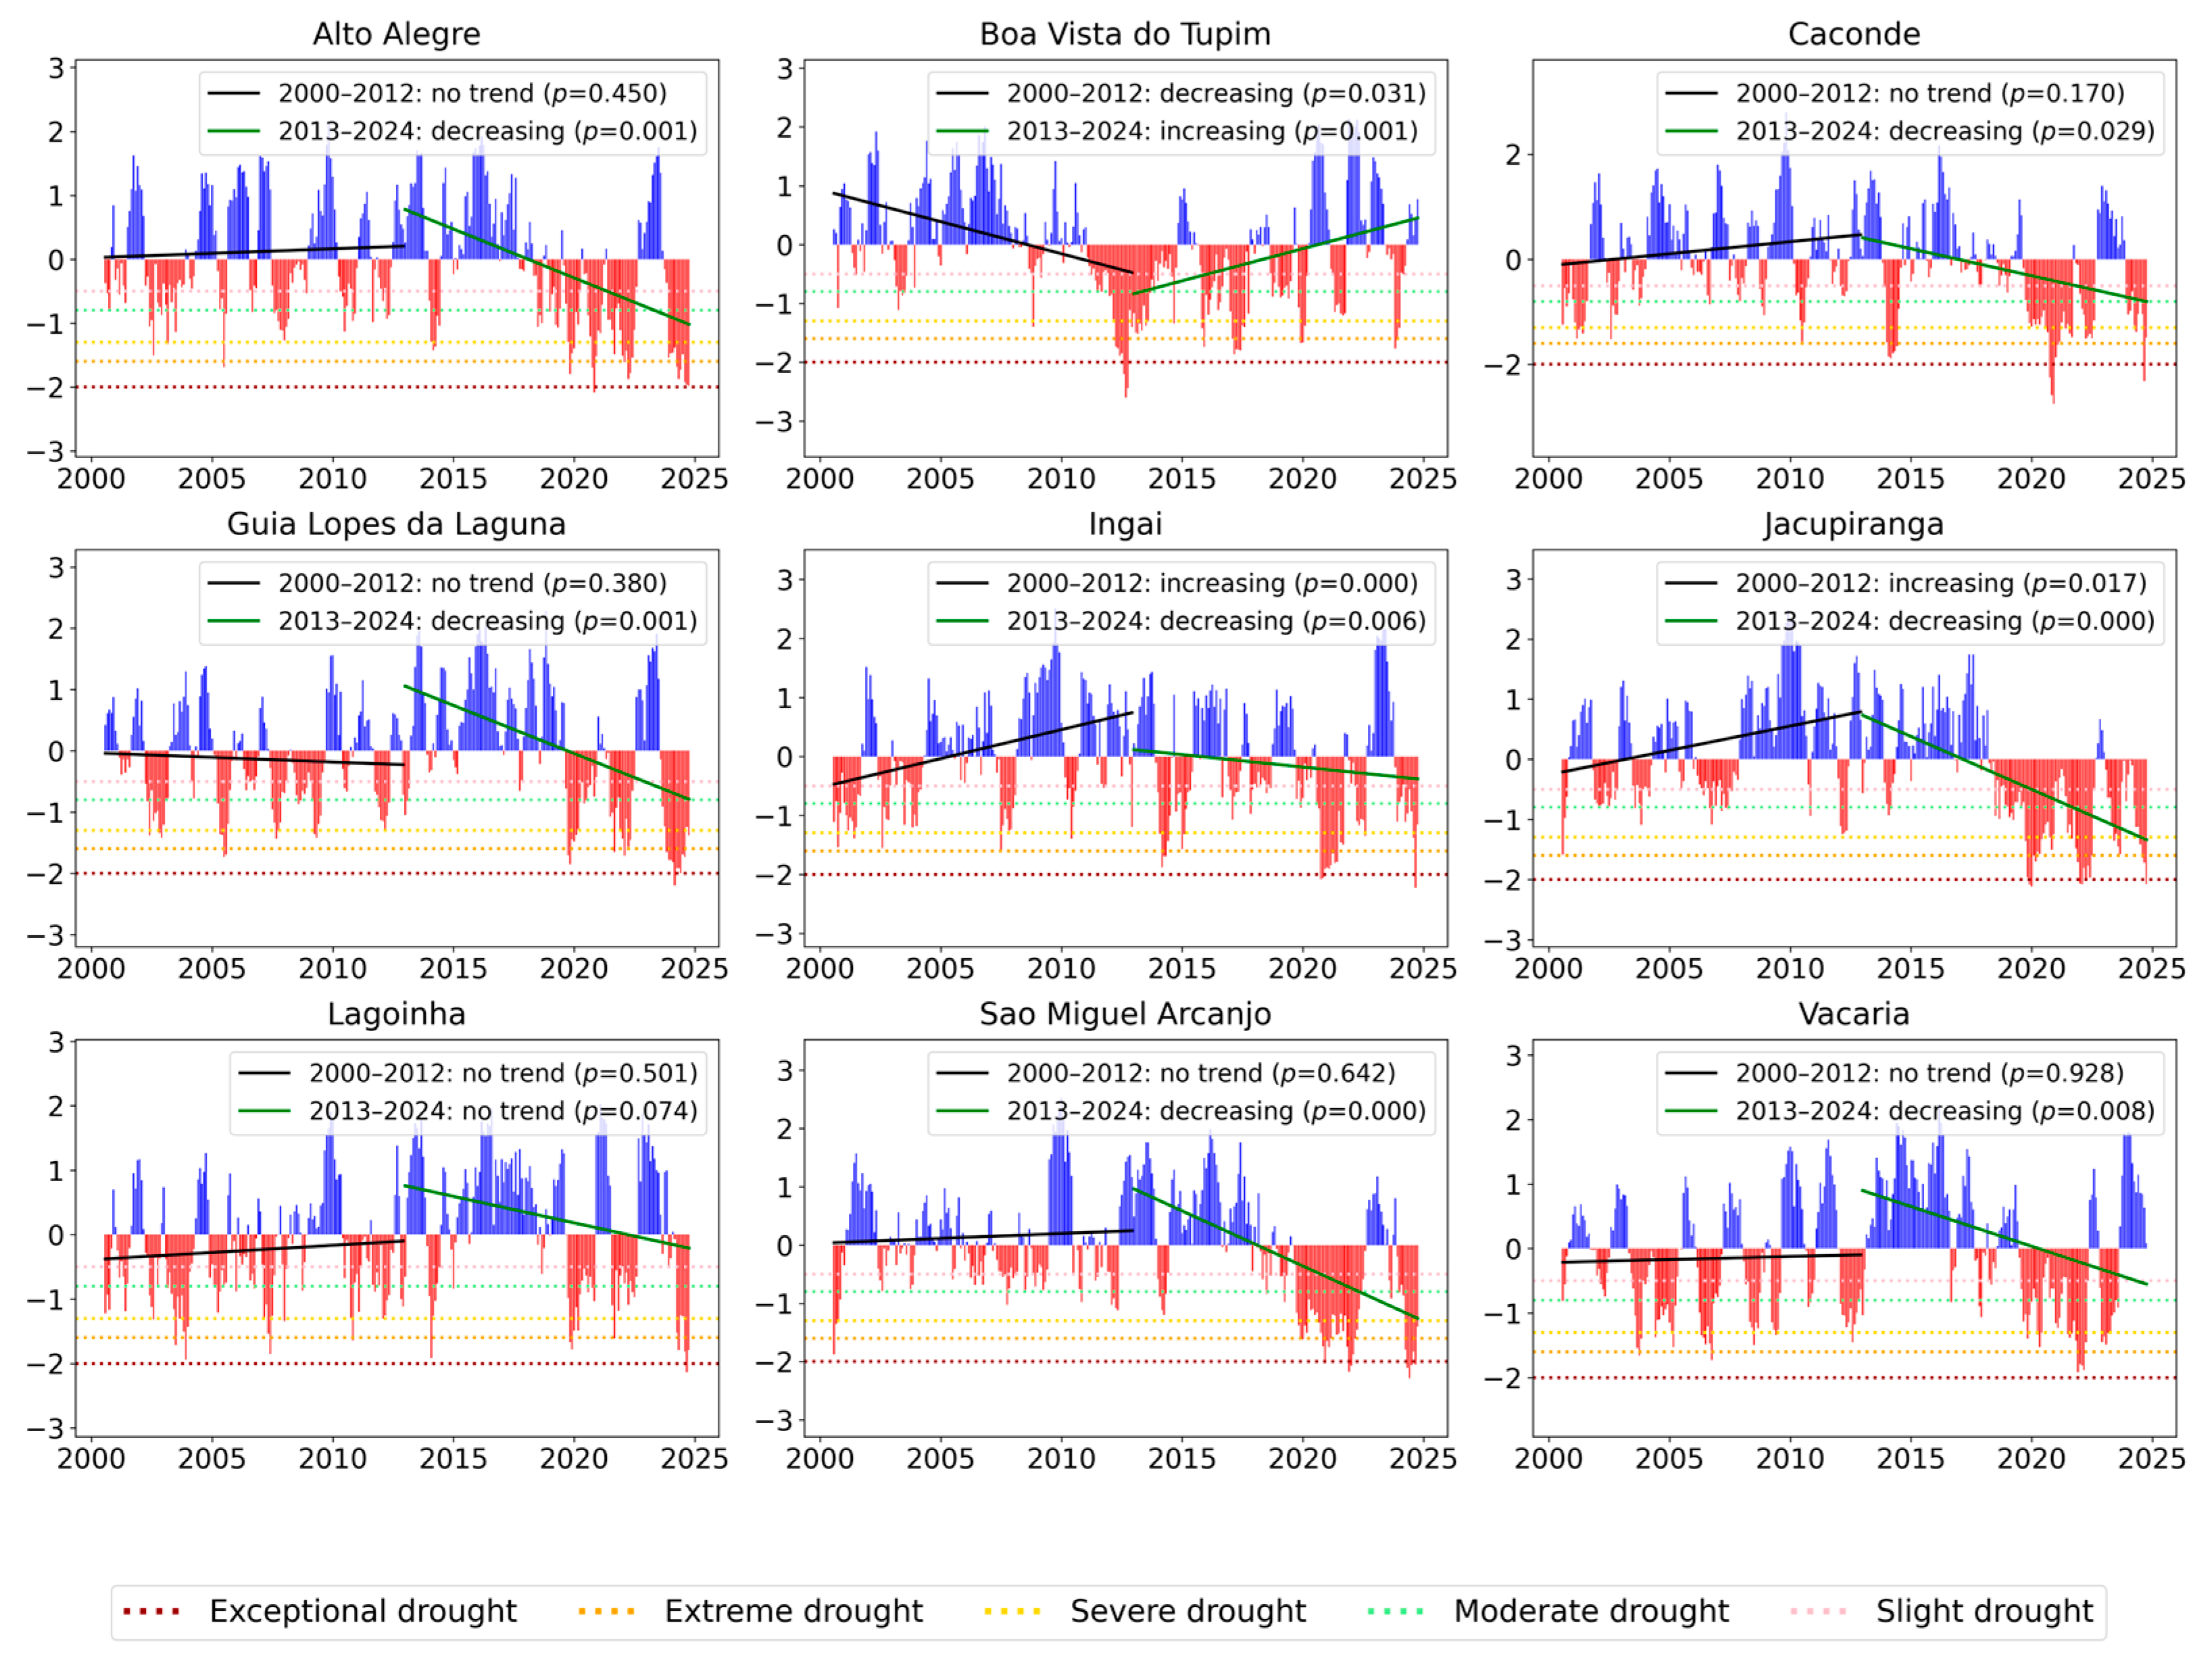
3.3. Trend of SPEI-6

Agricultural drought monitoring in the DATs using SPEI-6 revealed heterogeneous spatial patterns. Between 2000 and 2012, most assessed DATs—including Alto Alegre, Caconde, Lagoinha, and São Miguel Arcanjo in southeastern Brazil, as well as Guia Lopes da Laguna and Vacaria in the central-western and southern regions—showed no statistically significant trends in drought conditions. In contrast, Jacupiranga and Ingaí exhibited a significantly increasing trend, indicating a shift toward wetter conditions. At the same time, Boa Vista do Tupim in the northeast showed a significant decrease, suggesting a transition to drier conditions (Figure 7).
From 2013 to 2024, Alto Alegre, Caconde, Guia Lopes da Laguna, Jacupiranga, São Miguel Arcanjo, and Vacaria exhibited a significant decreasing trend, marking a reversal from their no trend conditions in the 2000–2012 period and signaling heightened drought susceptibility. Ingaí experienced a notable shift from a wetter trend (2000–2012) to drier conditions (2013–2024). Conversely, Boa Vista do Tupim reversed its previous decreasing trend, showing an increasing trend during the latter period. Lagoinha remained the only DAT with no significant trend, which was consistent with its earlier pattern.
Table 8 outlines the most severe drought events in the DATs during the periods of 2000–2012 and 2013–2024. From 2000 to 2012, several DATs experienced extreme droughts, including Jacupiranga and São Miguel Arcanjo in August 2000; Lagoinha in December 2003; Alto Alegre and Guia Lopes da Laguna in July 2005; Vacaria in October 2006; and Ingaí in July 2007. Boa Vista do Tupim experienced its most intense drought, classified as exceptional, in September 2012. In contrast, Caconde’s most severe drought event occurred in July 2010 and was classified as severe rather than extreme or exceptional.
In the subsequent period of 2013–2024, drought conditions intensified, with several DATs reporting exceptional drought—the highest severity category. Notable occurrences included Jacupiranga in January 2020, Alto Alegre in November 2020, Caconde in December 2020, Guia Lopes da Laguna in March 2024, São Miguel Arcanjo in June 2024, and Ingaí and Lagoinha in September 2024. Additionally, extreme drought events were recorded in Boa Vista do Tupim in March 2017 and Vacaria in December 2021.

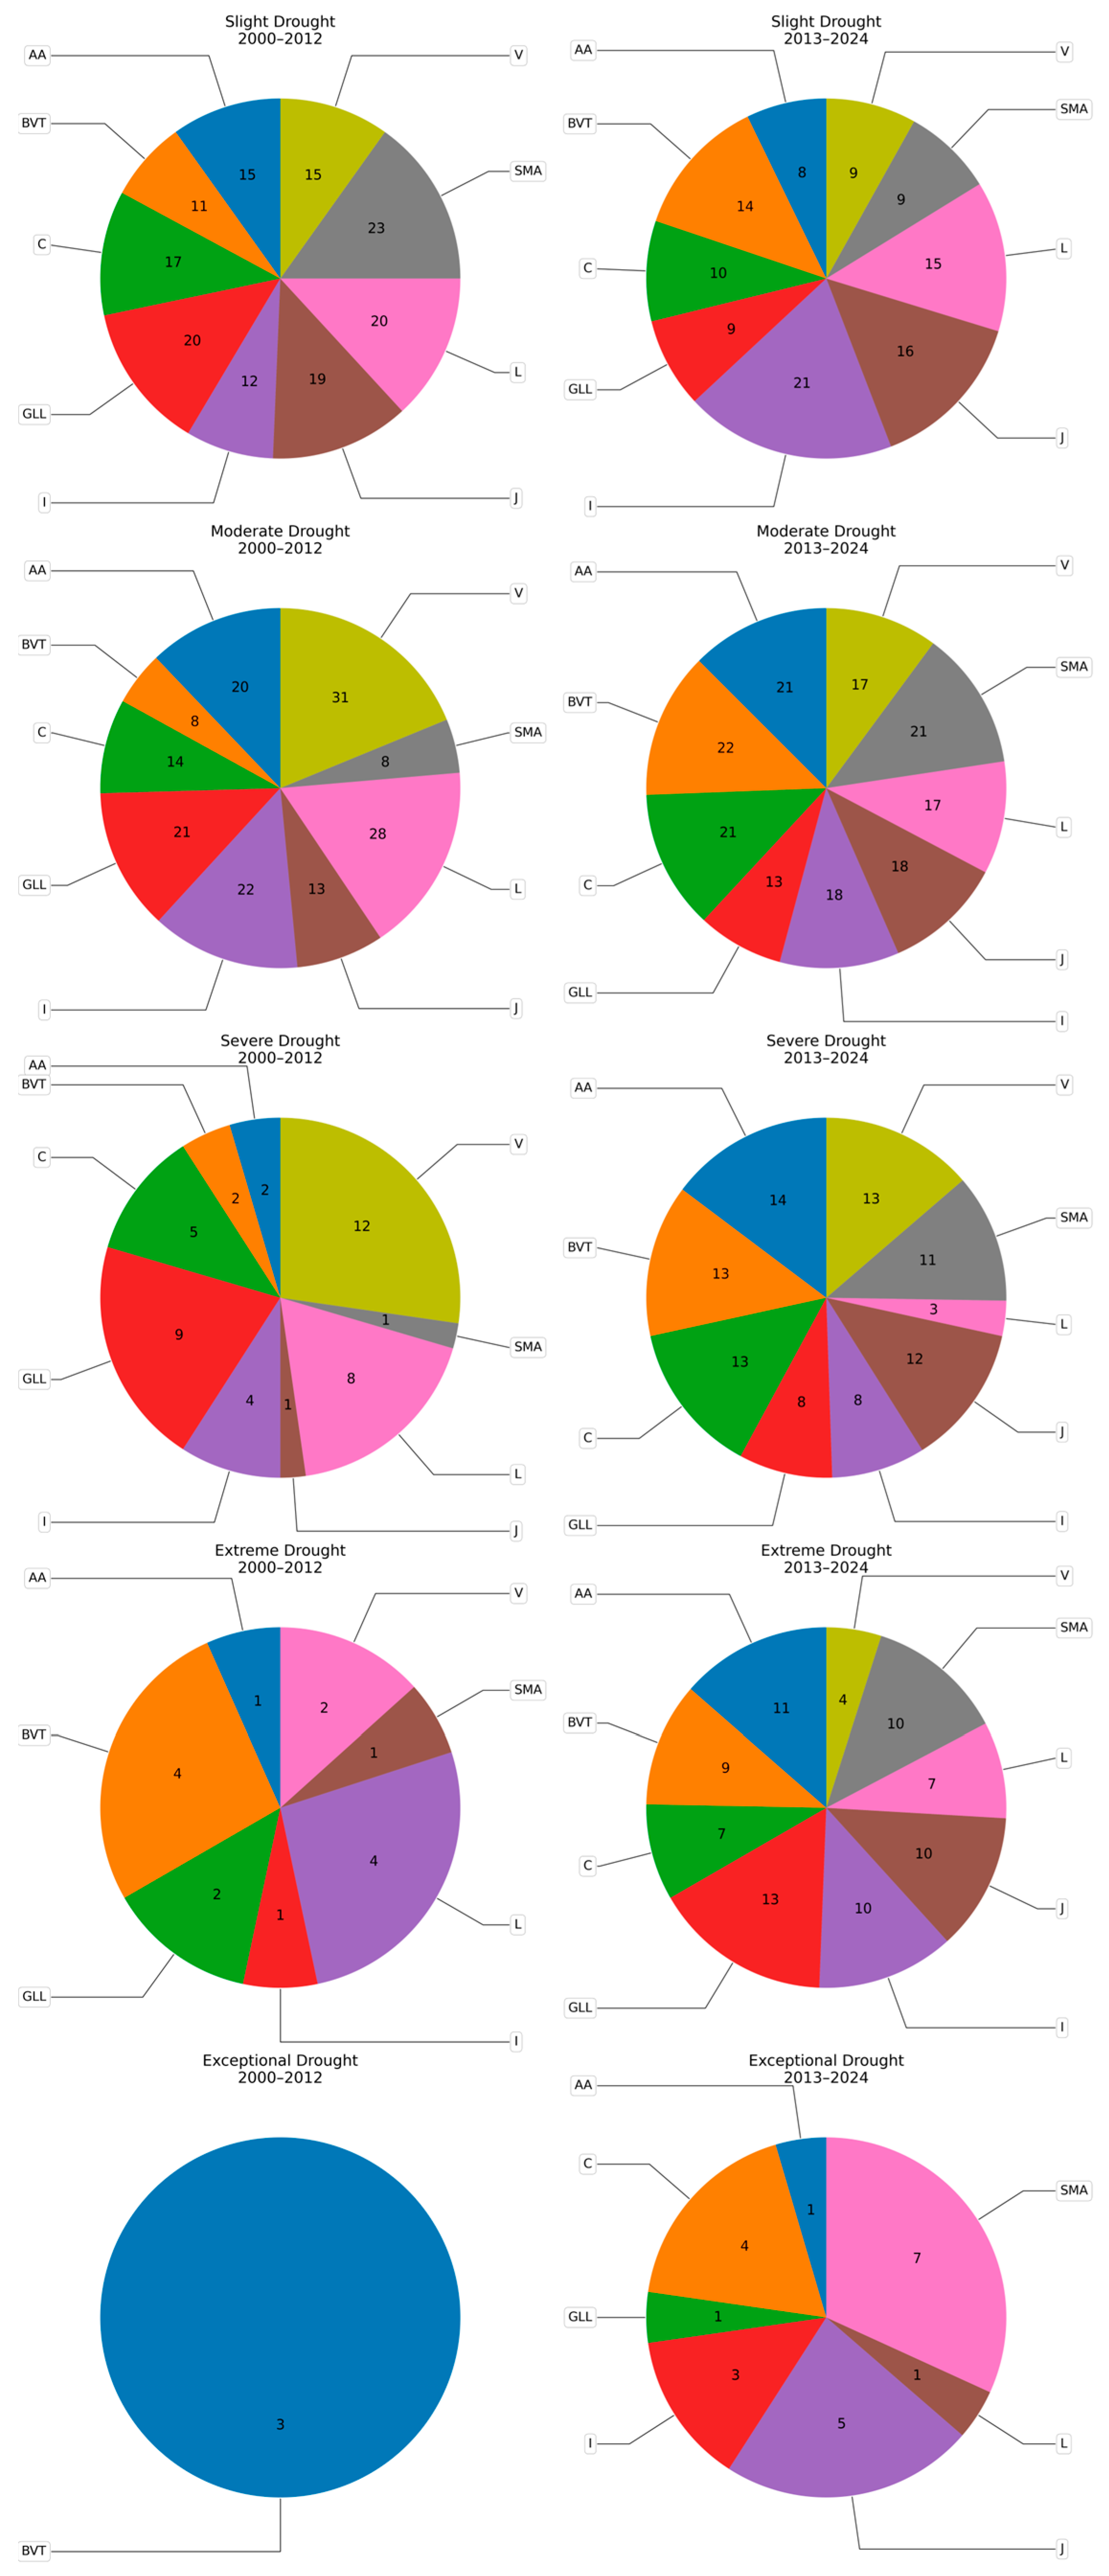
3.4. Frequency of Droughts by Intensity Category

The frequency of each drought intensity category, based on SPEI-6 results, varied between the periods 2000–2012 and 2013–2024, as well as among the DATs (Figure 8).

3.4.1. Slight Drought

Between 2000 and 2012, 152 slight drought events were recorded. The DATs experienced varying frequencies: Boa Vista do Tupim had 11 episodes, Ingaí 12, Alto Alegre and Vacaria 15, Caconde 17, Jacupiranga 19, Lagoinha and Guia Lopes da Laguna 20, and São Miguel Arcanjo had 23 events.
From 2013 to 2024, slight drought occurrences decreased to 111. The frequency of these events, listed from highest to lowest, are as follows: Ingaí (21), Jacupiranga (16), Lagoinha (15), Boa Vista do Tupim (14), Caconde (10), Guia Lopes da Laguna, São Miguel Arcanjo, and Vacaria (9), and Alto Alegre (8).

3.4.2. Moderate Drought

The category of moderate drought was the most frequently recorded, with 165 events documented between 2000 and 2012 and 168 events from 2013 to 2024. During the first period, Boa Vista do Tupim and São Miguel Arcanjo each recorded 8 occurrences, Jacupiranga, Caconde, Alto Alegre, Guia Lopes da Laguna, and Ingaí reported 13, 14, 20, 21, and 22 events, respectively. Lagoinha and Vacaria had the highest numbers, with 28 and 31 episodes, respectively.
In the 2013–2024 period, Lagoinha and Vacaria recorded 17 moderate drought events each, while Ingaí and Jacupiranga reported 18 events. Alto Alegre, Caconde, and São Miguel Arcanjo presented 21 events each, Boa Vista do Tupim recorded 22, and Guia Lopes da Laguna had 13 events.

3.4.3. Severe Drought

Between 2000 and 2012, 44 severe drought events were recorded. The distribution of these occurrences was as follows: Jacupiranga and São Miguel Arcanjo experienced one event, Alto Alegre and Boa Vista do Tupim had two, Ingaí recorded four, Caconde had five, Lagoinha recorded eight, Guia Lopes da Laguna experienced nine, and Vacaria faced twelve.
Severe drought events increased over time; from 2013 to 2024, 95 events were recorded. The distribution during this time was as follows: Lagoinha (3 events), Ingaí and Guia Lopes da Laguna (8 each), São Miguel Arcanjo (11), Jacupiranga (12), Boa Vista do Tupim, Caconde, and Vacaria (13 each), and Alto Alegre (14).

3.4.4. Extreme Drought

Between 2000 and 2012, 15 extreme drought events were recorded. These included one each in Alto Alegre, Ingaí, and São Miguel Arcanjo, two each in Vacaria and Guia Lopes da Laguna, and four each in Lagoinha and Boa Vista do Tupim.
In contrast, from 2013 to 2024, there was a dramatic increase in extreme drought occurrences, with 81 events reported. The distribution of these events was as follows: 4 in Vacaria, 7 in Lagoinha and Caconde, 9 in Boa Vista do Tupim, 10 in Ingaí, Jacupiranga, and São Miguel Arcanjo, 11 in Alto Alegre, and 13 in Guia Lopes da Laguna.

3.4.5. Exceptional Drought

From 2000 to 2012, Boa Vista do Tupim was the only region to experience exceptional drought conditions, recording three distinct episodes. However, between 2013 and 2024, the number of affected DATs increased to seven. Alto Alegre, Guia Lopes da Laguna, and Lagoinha each recorded one episode, while Ingaí, Caconde, Jacupiranga, and São Miguel Arcanjo documented three, four, five, and seven episodes, respectively. In total, there were 22 reports of exceptional drought events between 2013 and 2024, indicating a significant rise in extreme drought conditions across the DATs.

4. Discussion

This study demonstrates a strong linear relationship between monthly temperature data derived from MODIS and Agritempo weather station records, with Pearson’s correlation coefficients exceeding 0.80 in over 80% of the DATs. In contrast, Liu et al. [51] reported that more than 70% of Pearson correlation coefficients were below 0.8 when analyzing the relationship between LST from MODIS and air temperature from weather stations in Brazil, highlighting a divergence from our findings. This discrepancy may be attributed to regional climatic variations or distinct environmental characteristics affecting temperature measurements.
The fundamental difference between MODIS and ground-based weather station measurements is a key factor influencing these results. MODIS captures LST, which reflects complex energy fluxes between the ground and atmosphere, encompassing all surface-atmosphere interactions [52,53]. Conversely, weather stations, following WMO guidelines, measure air temperature at a standardized height of 1.25 to 2 m above ground level [54]. These inherent differences, combined with atmospheric conditions (e.g., cloud cover, wind speed), topographic complexity, elevation, and land cover variations, significantly affect the accuracy of MODIS LST compared to weather station air temperature, as corroborated by previous studies [55,56,57,58,59].
The RMSE values from MODIS validation indicate varying deviation levels between MODIS LST and observed temperatures across the DATs. Alto Alegre, Caconde, Guia Lopes da Laguna, Ingaí, Lagoinha, and Vacaria exhibited relatively low errors (RMSE < 1.72 °C), whereas Boa Vista do Tupim, Jacupiranga, and São Miguel Arcanjo showed higher discrepancies (RMSE slightly above 2 °C). According to the Global Climate Observing System [60], the required accuracy for LST derived from satellite observations at a 1–10 km spatial resolution is 0.5–2.0 °C for agricultural, hydrological, and meteorological research applications. Based on this benchmark, MODIS LST data meets the recommended accuracy threshold in most DATs, except for the three locations with RMSE values marginally exceeding 2 °C.
Mean bias error analysis revealed consistent biases in MODIS temperature estimates across the studied regions. MODIS overestimated temperatures in Guia Lopes da Laguna and Lagoinha, while underestimating them in all other locations, with the largest negative biases observed in Jacupiranga (MBE = −2.47 °C) and São Miguel Arcanjo (MBE = −2.43 °C). These results contradict Liu et al. [51], who reported a positive MODIS bias for Brazil (1.42–1.87 °C for 2003–2016 data). Factors such as altitude, temperature variability, latitude, and sensor viewing angle, as suggested by Ummus [61], likely explain the biases observed in this study.
The monthly precipitation from CHIRPS presented a strong linear relationship with Agritempo. The Pearson correlation coefficients ranged from 0.67 in Guia Lopes da Laguna to 0.88 in Ingaí. These results align with previous research. For instance, Oliveira-Júnior et al. [62] reported a correlation of 0.71 in Ponta Porã, approximately 175 km from Guia Lopes da Laguna, supporting our findings. Similarly, Caparoci Nogueira et al. [63] observed a slightly higher correlation of 0.96 in the southeast region of Minas Gerais, the state where Ingaí is situated.
CHIRPS predominantly underestimated monthly precipitation across most DATs, with underestimations ranging from −2.59 mm/month in Boa Vista do Tupim to −20.88 mm/month in São Miguel Arcanjo. This pattern is consistent with previous studies [64,65]. Notably, Ingaí presented an exception, displaying an overestimation of 8.27 mm/month, corroborating earlier research that reported an overestimation of 3.45 mm/month in southern Minas Gerais [63].
The RMSE values, which measure average error, varied significantly among the DATs, ranging from 41.33 to 74.29 mm/month. This variability can be attributed to geographical locationand regional climate patterns [66]. In addition, these differences may result from complex topographic features where precipitation is controlled by orography or inconsistencies in gauge-based calibration [67].
Uncertainties in MODIS and CHIRPS data, including biases and combined errors, can affect the reliability of drought severity assessments and trend analyses. Nevertheless, these datasets remain essential for climate-related drought monitoring, particularly in regions with sparse ground-based meteorological data.
The mean precipitation anomalies for 2013–2024, relative to 2000–2012, revealed distinct regional trends. Guia Lopes da Laguna, Jacupiranga, São Miguel Arcanjo, and Vacaria exhibited increasing precipitation anomalies, consistent with previous research. For instance, for many parts of the Brazilian Midwest (where Guia Lopes da Laguna is located), Santos et al. [68], documented rising intensity and frequency of precipitation extremes between 1979 and 2019, while the increase in Vacaria aligns with southern Brazil’s “wet-get-wetter” hypothesis [69]. Conversely, Boa Vista do Tupim, Caconde, Ingaí, and Lagoinha showed no significant trends, while Alto Alegre displayed a decreasing trend. This spatial variability is likely due to the complex interplay of large-scale atmospheric dynamics and local circulation systems, such as the El Niño-Southern Oscillation (ENSO), the South Atlantic Convergence Zone (SACZ), the South Atlantic Subtropical Anticyclone (SASA), and cold fronts, which modulate precipitation patterns in Brazil [70].
Concurrently, mean temperature anomalies indicate that 2013–2024 was consistently warmer than 2000–2012 (anomalies: +0.09 to +0.70 °C), corroborating broader warming trends in Brazil [71,72]. Statistically significant cooling trends occurred in Alto Alegre, Ingaí, Jacupiranga, and São Miguel Arcanjo, whereas Boa Vista do Tupim and Lagoinha exhibited warming trends. No discernible trend was detected in Caconde, Guia Lopes da Laguna, or Vacaria.
Temperature shifts, especially toward warming conditions, have significant hydrological implications, as rising temperatures can increase evapotranspiration rates and elevate water demand, intensifying moisture deficitseven in regions where precipitation remains stable.
The trend analysis of SPEI-6 showed only one significant decreasing trend in the 2000–2012 period (Boa Vista do Tupim); however, a pronounced decreasing trend emerged in the period 2013–2024 in the majority of DATs—except Lagoinha and Boa Vista do Tupim. This is consistent with national studies that have linked increased drought trends to global warming [10,11,36,38,72,73,74].Moderate drought remained the dominant category across both periods, increasing approximately by 1.0 times (new value divided by the old), rom 2000–2012 to 2013–2024. Notably, exceptional, extreme, and severe drought categories saw substantial increases of approximately 7.3, 5.4, and 2.2 times respectively. Only slight drought decreased (−0.7). This escalation in drought frequency highlights the DATs’ growing vulnerability, emphasizing the need for adaptive strategies, such as adopting technological innovations linked to smart farming. Promoting technological innovations associated with smart farming is crucial for enhancing the resilience of small and medium-sized farms, thereby mitigating their vulnerability to climate change.
To illustrate the impact of agricultural drought on crop yields and its subsequent economic repercussions, we examine the case of the agrotechnological district of Caconde, a major coffee-producing region in Brazil. This agrotechnological district attracted media attention in both 2020 and 2024 due to severe droughts [75,76], which significantly affected coffee production. The decline in supply was driven by rising temperatures, increased potential evapotranspiration, and prolonged water deficits. In particular, high temperatures during the blossoming phase led to flower abortion, severely reducing crop productivity [77]. This decline in output, in turn, contributed to rising coffee prices, highlighting the broader economic consequences of extreme drought conditions [78].
Small and medium-sized farms within the DATs can significantly improve their resilience to agricultural drought through the adoption of innovative farming solutions. Real-time data acquisition is crucial, facilitated by IoT-connected sensors that monitor soil and plant health, including nutrient levels, moisture, and disease. This data, combined with the use of drought-resistant crop varieties and bio inputs, can enhance plant robustness and soil health. AI-driven resource optimization can ensure the efficient allocation of fertilizers, water, and pesticides, while robotic harvesting minimizes waste and damage, particularly for delicate crops. Predictive analytics, powered by machine learning algorithms, can provide more accurate yield forecasts based on multiple data sources. Smart traps- such as sticky or pheromone traps combined with cameras or sensors—can provide real-time insights into pest activity. Furthermore, farm management mobile apps and high-resolution imaging technologies can help farmers to make more precise decisions. By integrating these technologies, farms can enhance resilience, improve efficiency, and adapt to the increasing risks associated with drought conditions [3,4,5,6,7].
Some of these smart farming solutions are already being implemented in the Semear Digital Center’s DATs. In Caconde, farmers are using a mobile application to manage fish farming and deploying drones to apply bio-inputs in coffee plots. In Vacaria, a robot has been developed to harvest apples in orchards, enhancing efficiency and reducing labor dependency. Meanwhile, in Alto Alegre, smart traps combining sticky traps with cameras have been introduced to monitor sugarcane borer populations, enabling more precise and targeted pest management [79,80,81].

5. Conclusions

MODIS temperature and CHIRPS precipitation data offer a valuable alternative for drought monitoring in regions with limited long-term ground weather station data for SPEI assessments. However, it’s crucial to acknowledge the inherent biases: MODIS systematically underestimated temperatures, and CHIRPS tended to underestimate precipitation across most DATs. These biases may impact the precision of drought severity and trend analyses. Nonetheless, in areas where ground meteorological data is scarce, MODIS and CHIRPS remain essential tools for climate-related drought monitoring.
The comparative analysis of the periods 2000–2012 and 2013–2024 reveals significant changes in precipitation anomalies across the DATs. While Guia Lopes da Laguna, Lagoinha, and Vacaria exhibited positive mean precipitation anomalies, Alto Alegre, Boa Vista do Tupim, Caconde, Ingaí, Jacupiranga, and São Miguel Arcanjo experienced negative anomalies. Furthermore, mean temperature anomalies indicate a warming trend during the 2013–2024 period. These climatic shifts can contribute to the intensification of drought conditions in the DATs.
A significant escalation in the frequency and severity of agricultural drought events occurred between 2013 and 2024, with increases ranging from 1.0 to 7.3 times compared to 2000 to 2012. Notably, the highest drought categories—exceptional, extreme, and severe—demonstrated the most substantial increases, highlighting the intensified drought severity and the increased vulnerability of the DATs.
In this context, the adoption of smart farming technologies can significantly enhance the resilience of farms in the DATs, helping to mitigate vulnerabilities and improve adaptability. However, to fully address the complex and multifaceted challenges posed by drought, future research must adopt a holistic approach that integrates land use patterns, vegetation cover dynamics, and socioeconomic data. Additionally, we believe that collaborative efforts involving researchers, agricultural extension services, local farmers’ associations, and regional policymakers will be critical to translating scientific insights into actionable solutions, ensuring the sustainability of agricultural practices in the face of a changing climate.

Supplementary Materials

The following supporting information can be downloaded at: https://www.mdpi.com/article/10.3390/atmos16040465/s1, Figures; DATs shapefiles; DATs Raster files for anomaly analysis; Google Earth Engine script to retrieve MODIS and CHIRPS data; Python scripts; SPEI R script; Location map QGIS project; DATs climate data from CHIRPS and MODIS; DATs climate data from Agritempo; DATs SPEI drought severity classification; DATs SPEI results.

Author Contributions

Conceptualization, T.L.d.S., L.A.S.R., S.R.M.E., M.D. and S.M.F.S.M.; methodology, T.L.d.S., L.A.S.R., S.R.M.E. and M.D.; software, T.L.d.S.; validation, T.L.d.S.; formal analysis, T.L.d.S.; investigation, T.L.d.S. and L.A.S.R.; resources, L.A.S.R. and S.M.F.S.M.; data curation, T.L.d.S.; writing—original draft preparation, T.L.d.S.; writing—review and editing, L.A.S.R., S.R.M.E., M.D. and S.M.F.S.M.; visualization, T.L.d.S.; supervision, L.A.S.R., S.R.M.E., M.D. and S.M.F.S.M.; project administration, L.A.S.R. and S.M.F.S.M.; funding acquisition, L.A.S.R. and S.M.F.S.M. All authors have read and agreed to the published version of the manuscript.

Funding

This study was financed, in part, by the São Paulo Research Foundation (FAPESP), Brasil. Process Number #2024/10569-5 and #2022/09319-9.

Institutional Review Board Statement

Not applicable.

Informed Consent Statement

Not applicable.

Data Availability Statement

The original contributions presented in this study are included in the article and Supplementary Materials. For further inquiries, please contact the corresponding author.

Acknowledgments

This study was financed, in part, by the São Paulo Research Foundation (FAPESP), Brasil. Process Number #2024/10569-5 and #2022/09319-9. The authors acknowledge the valuable insights from the reviewers.

Conflicts of Interest

The authors declare no conflicts of interest.

References

  1. Semear Digital. Available online: https://www.semear-digital.cnptia.embrapa.br/dats/ (accessed on 11 January 2025).
  2. Massruhá, S.M.F.S.; Leite, M.A.D.A.; Oliveira, S.R.D.M.; Meira, C.A.A.; Luchiari Junior, A.; Bolfe, E.L. (Eds.) Digital Agriculture: Research, Development and Innovation in Production Chains; Embrapa: Brasília, Brazil, 2023; Chapter 1; pp. 17–35. [Google Scholar]
  3. Pivot, D.; Waquil, P.D.; Talamini, E.; Finocchio, C.P.S.; Dalla Corte, V.F.; de Vargas Mores, G. Scientific development of smart farming technologies and their application in Brazil. Inf. Process. Agric. 2018, 5, 21–32. [Google Scholar] [CrossRef]
  4. Moysiadis, V.; Sarigiannidis, P.; Vitsas, V.; Khelifi, A. Smart farming in Europe. Comput. Sci. Rev. 2021, 39, 100345. [Google Scholar] [CrossRef]
  5. Idoje, G.; Dagiuklas, T.; Iqbal, M. Survey for smart farming technologies: Challenges and issues. Comput. Electr. Eng. 2021, 92, 107104. [Google Scholar] [CrossRef]
  6. Shamshiri, R.R.; Sturm, B.; Weltzien, C.; Fulton, J.; Khosla, R.; Schirrmann, M.; Raut, S.; Basavegowda, D.H.; Yamin, M.; Hameed, I.A. Digitalization of Agriculture for sustainable crop production: A use-case review. Front. Environ. Sci. 2024, 12, 1375193. [Google Scholar] [CrossRef]
  7. Fuentes-Peñailillo, F.; Gutter, K.; Vega, R.; Silva, G.C. Transformative Technologies in Digital Agriculture: Leveraging Internet of Things, Remote Sensing, and Artificial Intelligence for Smart Crop Management. J. Sens. Actuator Netw. 2024, 13, 39. [Google Scholar] [CrossRef]
  8. Assunção, J.; Chein, F. Climate change and agricultural productivity in Brazil: Future perspectives. Environ. Dev. Econ. 2016, 21, 581–602. [Google Scholar] [CrossRef]
  9. IPCC. Summary for Policymakers. In Climate Change 2023: Synthesis Report. Contribution of Working Groups I, II and III to the Sixth Assessment Report of the Intergovernmental Panel on Climate Change; Core Writing Team, Lee, H., Romero, J., Eds.; IPCC: Geneva, Switzerland, 2023; pp. 1–34. Available online: https://www.ipcc.ch/report/ar6/syr/downloads/report/IPCC_AR6_SYR_FullVolume.pdf (accessed on 4 April 2025).
  10. Cunha, A.P.M.A.; Zeri, M.; Deusdará Leal, K.; Costa, L.; Cuartas, L.A.; Marengo, J.A.; Tomasella, J.; Vieira, R.M.; Barbosa, A.A.; Cunningham, C.; et al. Extreme Drought Events over Brazil from 2011 to 2019. Atmosphere 2019, 10, 642. [Google Scholar] [CrossRef]
  11. Geirinhas, J.L.; Russo, A.; Libonati, R.; Sousa, P.M.; Miralles, D.G.; Trigo, R.M. Recent increasing frequency of compound summer drought and heatwaves in Southeast Brazil. Environ. Res. Lett. 2021, 16, 034036. [Google Scholar] [CrossRef]
  12. Wilhite, D.A.; Glantz, M.H. Understanding: The drought phenomenon: The role of definitions. Water Int. 1985, 10, 111–120. [Google Scholar] [CrossRef]
  13. Hazaymeh, K.; Hassan, Q.K. Remote sensing of agricultural drought monitoring: A state of art review. AIMS Environ. Sci. 2016, 3, 604–630. [Google Scholar] [CrossRef]
  14. Marengo, J.A.; Galdos, M.V.; Challinor, A.; Cunha, A.P.; Marin, F.R.; Vianna, M.d.S.; Alvala, R.C.S.; Alves, L.M.; Moraes, O.L.; Bender, F. Drought in Northeast Brazil: A review of agricultural and policy adaptation options for food security. Clim. Resil Sustain. 2021, 1, e17. [Google Scholar] [CrossRef]
  15. van Ginkel, M.; Biradar, C. Drought Early Warning in Agri-Food Systems. Climate 2021, 9, 134. [Google Scholar] [CrossRef]
  16. Sass, K.S.; Konak, A.; de Macedo, M.B.; Benso, M.R.; Shrimpton, E.; Balta-Ozkan, N.; Sarmah, T.; Mendiondo, E.M.; da Silva, G.J.; da Silva, P.G.C.; et al. Enhancing drought resilience and vulnerability assessment in small farms: A global expert survey on multidimensional indicators. Int. J. Disaster Risk Reduct. 2024, 110, 104616. [Google Scholar] [CrossRef]
  17. Palmer, W.C. Meteorological Drought; Research Paper No. 45; U.S. Department of Commerce, Weather Bureau: Washington, DC, USA, 1965; pp. 1–58.
  18. Palmer, W.C. Keeping track of crop moisture conditions, nationwide: The New Crop Moisture Index. Weatherwise 1968, 21, 156–161. [Google Scholar] [CrossRef]
  19. McKee, T.B.; Doesken, N.J.; Kleist, J. The relationship of drought frequency and duration to time scales. In Proceedings of the Eight Conference on Applied Climatology, Anaheim, CA, USA, 17–22 January 1993; American Meteorological Society: Boston, MA, USA, 1993; pp. 179–184. [Google Scholar]
  20. Vicente-Serrano, S.M.; Beguería, S.; López-Moreno, J.I. A Multiscalar Drought Index Sensitive to Global Warming: The Standardized Precipitation Evapotranspiration Index. J. Clim. 2010, 23, 1696–1718. [Google Scholar] [CrossRef]
  21. Kogan, F.N. Application of vegetation index and brightness temperature for drought detection. Adv. Space Res. 1995, 15, 91–100. [Google Scholar] [CrossRef]
  22. Gao, B. NDWI—A normalized difference water index for remote sensing of vegetation liquid water from space. Remote Sens. Environ. 1996, 58, 257–266. [Google Scholar] [CrossRef]
  23. Kogan, F.N. Global drought watch from space. Bull. Am. Meteorol. Soc. 1997, 78, 621–636. [Google Scholar] [CrossRef]
  24. Sandholt, I.; Rasmussen, K.; Andersen, J. A simple interpretation of the surface temperature/vegetation index space for assessment of surface moisture status. Remote Sens. Environ. 2002, 79, 213–224. [Google Scholar] [CrossRef]
  25. Liu, X.; Zhu, X.; Pan, Y.; Li, S.; Liu, Y.; Ma, Y. Agricultural drought monitoring: Progress, challenges, and prospects. J. Geogr. Sci. 2016, 26, 750–767. [Google Scholar] [CrossRef]
  26. Ndayiragije, J.M.; Li, F. Effectiveness of Drought Indices in the Assessment of Different Types of Droughts, Managing and Mitigating Their Effects. Climate 2022, 10, 125. [Google Scholar] [CrossRef]
  27. Nikolova, N.; Radeva, K.; Todorov, L.; Matev, S. Drought Dynamics and Drought Hazard Assessment in Southwest Bulgaria. Atmosphere 2024, 15, 888. [Google Scholar] [CrossRef]
  28. Drumond, A.; de Oliveira, M.; Reboita, M.S.; Stojanovic, M.; Nunes, A.M.P.; da Rocha, R.P. Moisture Transport during Anomalous Climate Events in the La Plata Basin. Atmosphere 2024, 15, 876. [Google Scholar] [CrossRef]
  29. Yang, W.; Doulabian, S.; Shadmehri Toosi, A.; Alaghmand, S. Unravelling the Drought Variance Using Machine Learning Methods in Six Capital Cities of Australia. Atmosphere 2024, 15, 43. [Google Scholar] [CrossRef]
  30. Peng, Y.; Peng, T.; Li, Y. Spatiotemporal Characteristics of Drought in Northwest China Based on SPEI Analysis. Atmosphere 2023, 14, 1188. [Google Scholar] [CrossRef]
  31. Pacheco, J.; Solera, A.; Avilés, A.; Tonón, M.D. Influence of ENSO on Droughts and Vegetation in a High Mountain Equatorial Climate Basin. Atmosphere 2022, 13, 2123. [Google Scholar] [CrossRef]
  32. Espinosa, L.A.; Portela, M.M.; Matos, J.P.; Gharbia, S. Climate Change Trends in a European Coastal Metropolitan Area: Rainfall, Temperature, and Extreme Events (1864–2021). Atmosphere 2022, 13, 1995. [Google Scholar] [CrossRef]
  33. Thornthwaite, C.W. An Approach toward a Rational Classification of Climate. Geogr. Rev. 1948, 38, 55–94. [Google Scholar] [CrossRef]
  34. World Meteorological Organization. Standardized Precipitation Index User Guide; WMO-No. 1090; WMO: Geneva, Switzerland, 2012; pp. 1–16. [Google Scholar]
  35. Buma, W.G.; Lee, S.-I. Multispectral Image-Based Estimation of Drought Patterns and Intensity around Lake Chad, Africa. Remote Sens. 2019, 11, 2534. [Google Scholar] [CrossRef]
  36. Cuartas, L.A.; Cunha, A.P.M.d.A.; Alves, J.A.; Parra, L.M.P.; Deusdará-Leal, K.; Costa, L.C.O.; Molina, R.D.; Amore, D.; Broedel, E.; Seluchi, M.E.; et al. Recent Hydrological Droughts in Brazil and their Impact on Hydropower Generation. Water 2022, 14, 601. [Google Scholar] [CrossRef]
  37. Ryu, J.-H.; Han, K.-S.; Lee, Y.-W.; Park, N.-W.; Hong, S.; Chung, C.-Y.; Cho, J. Different Agricultural Responses to Extreme Drought Events in Neighboring Counties of South and North Korea. Remote Sens. 2019, 11, 1773. [Google Scholar] [CrossRef]
  38. Tomasella, J.; Cunha, A.P.M.A.; Simões, P.A.; Zeri, M. Assessment of trends, variability and impacts of droughts across Brazil over the period 1980–2019. Nat. Hazards 2022, 116, 2173–2190. [Google Scholar] [CrossRef]
  39. Funk, C.; Peterson, P.; Landsfeld, M.; Pedreros, D.; Verdin, J.; Shukla, S.; Husak, G.; Rowland, J.; Harrison, L.; Hoell, A.; et al. The climate hazards infrared precipitation with stations—A new environmental record for monitoring extremes. Sci. Data 2015, 2, 150066. [Google Scholar] [CrossRef] [PubMed]
  40. MODIS. MOD11A1 v061: MODIS/Terra Land Surface Temperature/Emissivity Daily L3 Global 1km SIN Grid; NASA LP DAAC: Sioux Falls, SD, USA, 2021. [CrossRef]
  41. Agritempo. Available online: https://www.agritempo.gov.br/br/sobre-nos/ (accessed on 10 December 2024).
  42. Alvares, C.A.; Stape, J.L.; Sentelhas, P.C.; de Moraes, G.J.L.; Sparovek, G. Köppen’s Climate Classification Map for Brazil. Meteorol. Z. 2013, 22, 711–728. [Google Scholar] [CrossRef] [PubMed]
  43. European Union, Copernicus Land Monitoring Service. Copernicus Digital Elevation Model GLO-30. 2024. Available online: https://dataspace.copernicus.eu/ (accessed on 12 December 2024).
  44. Pearson, K., VII. Mathematical contributions to the theory of evolution.—III. Regression, heredity, and panmixia. Philos. Trans. R. Soc. London. Ser. A Contain. Pap. A Math. Or. Phys. Character 1896, 187, 253–318. [Google Scholar] [CrossRef]
  45. Willmott, C.J. Some Comments on the Evaluation of Model Performance. Bull. Amer. Meteor. Soc. 1982, 63, 1309–1313. [Google Scholar] [CrossRef]
  46. Schober, P.; Boer, C.; Schwarte, L.A. Correlation Coefficients: Appropriate use and interpretation. Anesth. Analg. 2018, 126, 1763–1768. [Google Scholar] [CrossRef]
  47. Beguería, S.; Vicente-Serrano, S.M. SPEI: Calculation of the Standardized Precipitation-Evapotranspiration Index (Version 1.7) [Computer Software]. 2017. Available online: https://CRAN.R-project.org/package=SPEI (accessed on 11 January 2025).
  48. Hamed, K.H.; Rao, A.R. A modified Mann-Kendall trend test for autocorrelated data. J. Hydrol. 1998, 204, 182–196. [Google Scholar] [CrossRef]
  49. Hussain, M.M.; Mahmud, I. PyMannKendall: A python package for non parametric mann kendall family of trend tests. J. Open Source Softw. 2019, 4, 1556. [Google Scholar] [CrossRef]
  50. Monitor de Secas do Brasil. Available online: https://monitordesecas.ana.gov.br/tabela-de-classificacao (accessed on 10 December 2024).
  51. Liu, J.; Hagan, D.F.T.; Holmes, T.R.; Liu, Y. An Analysis of Spatio-Temporal Relationship between Satellite-Based Land Surface Temperature and Station-Based Near-Surface Air Temperature over Brazil. Remote Sens. 2022, 14, 4420. [Google Scholar] [CrossRef]
  52. Wan, Z.; Zhang, Y.; Zhang, Q.; Li, Z.L. Quality assessment and validation of the MODIS global land surface temperature. Int. J. Remote Sens. 2004, 25, 261–274. [Google Scholar] [CrossRef]
  53. Wan, Z.; Zhang, Y.; Zhang, Q.; Li, Z. Validation of the land-surface temperature products retrieved from Terra Moderate Resolution Imaging Spectroradiometer data. Remote Sens. Environ. 2002, 83, 163–180. [Google Scholar] [CrossRef]
  54. World Meteorological Organization. Chapter 2: Measurement of Temperature. In Guide to Instruments and Methods of Observation: Volume I–Measurement of Meteorological Variables (WMO-No. 8); WMO: Geneva, Switzerland, 2012; pp. 90–124. [Google Scholar]
  55. Mildrexler, D.J.; Zhao, M.; Running, S.W. A global comparison between station air temperatures and MODIS land surface temperatures reveals the cooling role of forests. J. Geophys. Res. 2011, 116, G03025. [Google Scholar] [CrossRef]
  56. Golkar, F.; Sabziparvar, A.A.; Khanbilvardi, R.; Nazemosadat, M.J.; Zand-Parsa, S.; Rezaei, Y. Estimation of instantaneous air temperature using remote sensing data. Int. J. Remote Sens. 2017, 39, 258–275. [Google Scholar] [CrossRef]
  57. Mutiibwa, D.; Strachan, S.; Albright, T. Land Surface Temperature and Surface Air Temperature in Complex Terrain. IEEE J. Sel. Top. Appl. Earth Obs. Remote Sens. 2015, 8, 4762–4774. [Google Scholar] [CrossRef]
  58. Urban, M.; Eberle, J.; Hüttich, C.; Schmullius, C.; Herold, M. Comparison of Satellite-Derived Land Surface Temperature and Air Temperature from Meteorological Stations on the Pan-Arctic Scale. Remote Sens. 2013, 5, 2348–2367. [Google Scholar] [CrossRef]
  59. El Kenawy, A.M.; Hereher, M.E.; Robaa, S.M. An Assessment of the Accuracy of MODIS Land Surface Temperature over Egypt Using Ground-Based Measurements. Remote Sens. 2019, 11, 2369. [Google Scholar] [CrossRef]
  60. World Meteorological Organization (WMO); United Nations Educational, Scientific and Cultural Organization (UNESCO); United Nations Environment Programme (UNEP); International Council for Science (ICSU). Systematic Observation Requirements for Satellite-Based Products for Climate Supplemental Details to the Satellite-Based Component of the Implementation Plan for the Global Observing System for Climate in Support of the UNFCCC; WMO: Geneva, Switzerland, 2011; Available online: https://library.wmo.int/idurl/4/48411 (accessed on 11 January 2025).
  61. Ummus, M.E. Avaliações de Estimativas de Temperatura da Superfície Terrestre em Eventos Frios Para a Regiao Sul do Brasil, Utilizando dados do Sensor MODIS; INPE: São Jose dos Campos, Brazil, 2009; p. 129. Available online: http://urlib.net/sid.inpe.br/mtc-m18@80/2009/08.31.21.00 (accessed on 11 January 2025).
  62. Oliveira-Júnior, J.F.d.; Silva Junior, C.A.d.; Teodoro, P.E.; Rossi, F.S.; Blanco, C.J.C.; Lima, M.; Gois, G.d.; Correia Filho, W.L.F.; Santiago, D.d.B.; Vanderley, M.H.G.d.S. Confronting CHIRPS dataset and in situ stations in the detection of wet and drought conditions in the Brazilian Midwest. Int. J. Climatol. 2021, 41, 4478–4493. [Google Scholar] [CrossRef]
  63. Caparoci Nogueira, S.; Moreira, M.; Lordelo Volpato, M. Evaluating Precipitation Estimates from Eta, TRMM and CHRIPS Data in the South-Southeast Region of Minas Gerais State—Brazil. Remote Sens. 2018, 10, 313. [Google Scholar] [CrossRef]
  64. Paredes-Trejo, F.J.; Barbosa, H.A.; Lakshmi Kumar, T.V. Validating CHIRPS-Based Satellite Precipitation Estimates in Northeast Brazil. J. Arid Environ. 2017, 139, 26–40. [Google Scholar] [CrossRef]
  65. Cavalcante, R.B.; Ferreira, D.B.d.S.; Pontes, P.R.M.; Tedeschi, R.G.; Costa, C.P.W.d.; Souza, E.B.d. Evaluation of extreme rainfall indices from CHIRPS precipitation estimates over the Brazilian Amazonia. Atmos. Res. 2020, 238, 104879. [Google Scholar] [CrossRef]
  66. Du, H.; Tan, M.L.; Zhang, F.; Chun, K.P.; Li, L.; Kabir, M.H. Evaluating the effectiveness of CHIRPS data for hydroclimatic studies. Theor. Appl. Climatol. 2023, 155, 1519–1539. [Google Scholar] [CrossRef]
  67. Wu, W.; Li, Y.; Luo, X.; Zhang, Y.; Ji, X.; Li, X. Performance evaluation of the CHIRPS precipitation dataset and its utility in drought monitoring over Yunnan Province, China. Geomat. Nat. Hazards Risk 2019, 10, 2145–2162. [Google Scholar] [CrossRef]
  68. dos Santos, L.O.F.; Machado, N.G.; Biudes, M.S.; Geli, H.M.E.; Querino, C.A.S.; Ruhoff, A.L.; Ivo, I.O.; Lotufo Neto, N. Trends in Precipitation and Air Temperature Extremes and Their Relationship with Sea Surface Temperature in the Brazilian Midwest. Atmosphere 2023, 14, 426. [Google Scholar] [CrossRef]
  69. Martini, L.C.P. Changes in rainfall patterns in southern Brazil over 1961–2020 period detected by rain gauge data. Int. J. Climatol. 2022, 42, 9101–9114. [Google Scholar] [CrossRef]
  70. Luiz-Silva, W.; Oscar-Júnior, A.C.; Cavalcanti, I.F.A.; Treistman, F. An overview of precipitation climatology in Brazil: Space-time variability of frequency and intensity associated with atmospheric systems. Hydrol. Sci. J. 2021, 66, 289–308. [Google Scholar] [CrossRef]
  71. Curado, L.F.A.; de Paulo, S.R.; de Paulo, I.J.C.; de Oliveira Maionchi, D.; da Silva, H.J.A.; de Oliveira Costa, R.; da Silva, I.M.C.B.; Marques, J.B.; de Souza Lima, A.M.; Rodrigues, T.R. Trends and Patterns of Daily Maximum, Minimum and Mean Temperature in Brazil from 2000 to 2020. Climate 2023, 11, 168. [Google Scholar] [CrossRef]
  72. Marengo, J.A.; Jimenez, J.C.; Espinoza, J.C.; Cunha, A.P.; Aragão, L.E.O. Increased climate pressure on the agricultural frontier in the Eastern Amazonia–Cerrado transition zone. Sci. Rep. 2022, 12, 457. [Google Scholar] [CrossRef]
  73. CEMADEN; INPE. Nota Técnica: Elaboração dos Mapas de Índice de Aridez e Precipitação Total Acumulada para o Brasil. Centro Nacional de Monitoramento e Alertas de Desastres Naturais (CEMADEN), Instituto Nacional de Pesquisas Espaciais (INPE), 2023. Available online: https://www.gov.br/cemaden/pt-br/assuntos/noticias-cemaden/estudo-do-cemaden-e-do-inpe-identifica-pela-primeira-vez-a-ocorrencia-de-uma-regiao-arida-no-pais/nota-tecnica_aridas.pdf (accessed on 3 February 2025).
  74. Stríkis, N.M.; Buarque, P.F.S.M.; Cruz, F.W.; Bernal, J.P.; Vuille, M.; Tejedor, E.; Santos, M.S.; Shimizu, M.H.; Ampuero, A.; Du, W.; et al. Modern anthropogenic drought in Central Brazil unprecedented during last 700 years. Nat. Commun. 2024, 15, 1728. [Google Scholar] [CrossRef]
  75. G1. Available online: https://g1.globo.com/sp/sao-carlos-regiao/noticia/2020/10/09/falta-de-chuva-e-baixa-umidade-do-ar-devem-causar-prejuizo-a-safra-do-cafe-em-caconde.ghtml (accessed on 10 December 2024).
  76. AP News. Available online: https://apnews.com/article/brazil-climate-change-drought-coffee-harvest-a6516a4b314e6ba7c11513c08afb6996 (accessed on 10 December 2024).
  77. DaMatta, F.M.; Ramalho, J.D.C. Impacts of drought and temperature stress on coffee physiology and production: A review. Braz. J. Plant Physiol. 2006, 18, 55–81. [Google Scholar] [CrossRef]
  78. Moraes-Oliveira, A.F.d.; Aparecido, L.E.d.O.; Figueira, S.R.F. Economic and climatic models for estimating coffee supply. Pesqui. Agropecuária Bras. 2017, 52, 1158–1166. [Google Scholar] [CrossRef]
  79. Semear Digital. Available online: https://www.semear-digital.cnptia.embrapa.br/noticia/01/2025/parceria-vai-levar-conectividade-e-tecnologia-digital-para-manejo-de-pragas-em-pequenas-e-medias-propriedades/ (accessed on 3 February 2025).
  80. Semear Digital. Available online: https://www.semear-digital.cnptia.embrapa.br/noticia/10/2024/comite-internacional-do-projeto-semear-digital-visita-embrapa-e-instituicoes-parceiras-2/ (accessed on 3 February 2025).
  81. Agrofy News. Available online: https://news.agrofy.com.br/noticia/204060/embrapa-vai-levar-inclusao-digital-fruticultores-do-rs (accessed on 3 February 2025).
Figure 1. Location map of agrotechnological districts.
Atmosphere 16 00465 g001
Figure 2. Flowchart of the Standardized Precipitation Evapotranspiration Index calculation process.
Atmosphere 16 00465 g002
Figure 3. Correlation between land surface temperature from MODIS and observed temperature data from Agritempo dataset (from March 2000 to October 2024). r = Pearson correlation coefficient; RMSE = Root mean square error; MBE = Mean bias error.
Atmosphere 16 00465 g003
Figure 4. Correlation between monthly precipitation data from CHIRPS and Agritempo dataset (from March 2000 to October 2024). r = Pearson correlation coefficient; RMSE = Root mean square error; MBE = Mean bias error.
Atmosphere 16 00465 g004
Figure 5. Precipitation anomalies representing differences between the 2000–2012 and 2013–2024 periods.
Atmosphere 16 00465 g005
Figure 6. Temperature anomalies representing differences between the 2000–2012 and 2013–2024 periods.
Atmosphere 16 00465 g006
Figure 7. Standardized Precipitation Evapotranspiration Index (SPEI-6), drought intensity categories (exceptional, extreme, severe, moderate, and slight), and Modified Mann–Kendall trend test results for 2000–2012 and 2013–2024 in the Agrotechnological Districts.
Atmosphere 16 00465 g007
Figure 8. Frequency and severity of drought events in the Agrotechnological Districts for the periods 2000–2012 and 2013–2024. AA = Alto Alegre, BVT = Boa Vista do Tupim, C = Caconde, GLL = Guia Lopes da Laguna, I = Ingaí, J = Jacupiranga, L = Lagoinha, SMA = São Miguel Arcanjo, V = Vacaria.
Atmosphere 16 00465 g008
Table 1. Location and elevation of Agritempo weather stations.
Agrotechnological DistrictsLatitudeLongitudeElevation (m)
Alto Alegre−21.58−50.16521.0
Boa Vista do Tupim−12.75−41.00260.0
Caconde−21.50−46.75834.0
Guia Lopes da Laguna−21.50−56.00380.0
Ingaí−21.40−44.92951.0
Jacupiranga−24.75−48.003.0
Lagoinha−23.00−45.251030.0
São Miguel Arcanjo−23.85−48.16672.0
Vacaria−28.50−51.001040.0
Table 2. Characteristics of the agrotechnological districts.
DATsStateLat.Long.Mean
Elevation
(m)
Köppen Climate Classification
Alto AlegreSão Paulo −21.58−50.16434.67Aw Tropical with dry winters
Boa Vista do TupimBahia−12.66−40.60436.68BSh Dry Semi-arid low latitudes and altitudes
CacondeSão Paulo −21.53−46.64868.51Cwb Humid subtropical with dry winters and temperate summers
Guia Lopes da LagunaMato Grosso do Sul −21.45−56.10285.32Af Tropical climate without a dry season
IngaíMinas Gerais −21.40−44.92953.64Cwb Humid subtropical with dry winters and temperate summers
JacupirangaSão Paulo−24.69−48.00103.56Cfa Humid subtropical oceanic climate lacking a dry season and hot summers
LagoinhaSão Paulo−23.08−45.19922.23Cwb Humid subtropical with dry winters and temperate summers
São Miguel ArcanjoSão Paulo −23.87−47.99700.89Cfa Humid subtropical oceanic climate lacking a dry season and hot summers
VacariaRio Grande do Sul−28.50−50.93881.40Cfb Humid subtropical oceanic climate without a dry season but with temperate summers
Source: [42,43]. DATs = Agrotechnological Districts; Lat. = latitude; Long. = longitude.
Table 3. Metrics, best values, and results interpretation.
MetricBest Value Analysis Interpretation
r1 or −1Direction and strength of a linear relationship
MBE0Performance considering average bias; negative value represents underestimation, and positive value indicates overestimation
RMSE0Measures the average magnitude of errors and is sensitive to large deviations.
Source: [44,45]. r = Pearson correlation coefficient; MBE = Mean bias error; RMSE = Root mean square error.
Table 4. Pearson correlation coefficient interpretation.
rInterpretation
0.00–0.10Negligible correlation
0.10–0.39Weak correlation
0.40–0.69Moderate correlation
0.70–0.89Strong correlation
0.90–1.00Very strong correlation
Source: [46]. r = Pearson correlation coefficient.
Table 5. Drought intensity categories.
CategorySPEI Probably Impacts
Slight drought −0.50 to −0.79Reduced planting, decreased growth in crops and pastures
Moderate drought−0.80 to −1.29Some damage to crops and pastures; streams, reservoirs, or wells at low levels; developing or imminent water shortages; voluntary water use restrictions requested.
Severe drought−1.30 to −1.59Likely crop or pasture losses; common water shortages; mandatory water restrictions imposed.
Extreme drought−1.60 to −1.99Major losses in crops and pastures; widespread water shortages; strict water restrictions enforced.
Exceptional drought<−2.00Exceptional and widespread crops and pasture losses; severe water shortages in reservoirs, streams, and wells create emergencies.
Source: [50]. SPEI = Standardized Precipitation Evapotranspiration Index.
Table 6. Descriptive statistics of precipitation anomalies and results of the Modified Mann–Kendall Trend test.
Agrotechnological DistrictsMean Minimum Maximum Standard Deviation MMK TrendMMK p-Value
Alto Alegre−0.17−0.24−0.110.03decreasing0.000
Boa Vista do Tupim−0.04−0.360.200.11no trend0.147
Caconde−0.27−0.43−0.060.08no trend0.729
Guia Lopes da Laguna0.420.240.570.05increasing0.000
Ingaí−0.12−0.200.000.04no trend0.185
Jacupiranga−0.48−1.090.340.30increasing0.000
Lagoinha0.490.081.130.22no trend0.427
São Miguel Arcanjo−0.22−0.520.150.12increasing0.000
Vacaria0.450.350.550.04increasing0.000
MMK = Modified Mann–Kendall trend test.
Table 7. Descriptive statistics of temperature anomalies and results of the Modified Mann–Kendall trend test.
Agrotechnological DistrictsMean Minimum Maximum Standard Deviation MMK TrendMMK p-Value
Alto Alegre0.21−1.171.470.39decreasing0.000
Boa Vista do Tupim0.70−2.523.181.13increasing0.000
Caconde0.33−0.701.800.45no trend0.687
Guia Lopes da Laguna0.26−1.131.300.44no trend0.063
Ingaí0.28−0.561.270.36decreasing0.006
Jacupiranga0.32−1.682.110.46decreasing0.000
Lagoinha0.14−1.590.900.43increasing0.032
São Miguel Arcanjo0.27−0.742.230.50decreasing0.000
Vacaria0.09−1.422.250.41no trend0.742
MMK = Modified Mann–Kendall trend test.
Table 8. Most intense drought events in the 2000–2012 and 2013–2024 periods in the Agrotechnological Districts.
Agrotechnological DistrictsMonth and YearWorst SPEI-6Drought Category
2000–2012
Alto AlegreJuly 2005−1.69Extreme drought
Boa Vista do TupimSeptember 2012−2.60Exceptional drought
CacondeJuly 2010−1.57Severe drought
Guia Lopes da LagunaJuly 2005−1.73Extreme drought
IngaíJuly 2007−1.62Extreme drought
JacupirangaAugust 2000−1.59Extreme drought
LagoinhaDecember 2003−1.94Extreme drought
São Miguel ArcanjoAugust 2000−1.88Extreme drought
VacariaOctober 2006−1.73Extreme drought
2013–2024
Alto AlegreNovember 2020−2.09Exceptional drought
Boa Vista do TupimMarch 2017−1.87Extreme drought
CacondeDecember 2020−2.75Exceptional drought
Guia Lopes da LagunaMarch 2024−2.19Exceptional drought
IngaíSeptember 2024−2.22Exceptional drought
JacupirangaJanuary 2020−2.11Exceptional drought
LagoinhaSeptember 2024−2.13Exceptional drought
São Miguel ArcanjoJune 2024−2.29Exceptional drought
VacariaDecember 2021−1.91Extreme drought
SPEI-6 = Standardized Precipitation Evapotranspiration Index at 6-moth timescale.
Disclaimer/Publisher’s Note: The statements, opinions and data contained in all publications are solely those of the individual author(s) and contributor(s) and not of MDPI and/or the editor(s). MDPI and/or the editor(s) disclaim responsibility for any injury to people or property resulting from any ideas, methods, instructions or products referred to in the content.

