
Investigating the Trend Changes in Temperature Extreme Indices in Iran


Abstract
1. Introduction
2. Materials and Methods
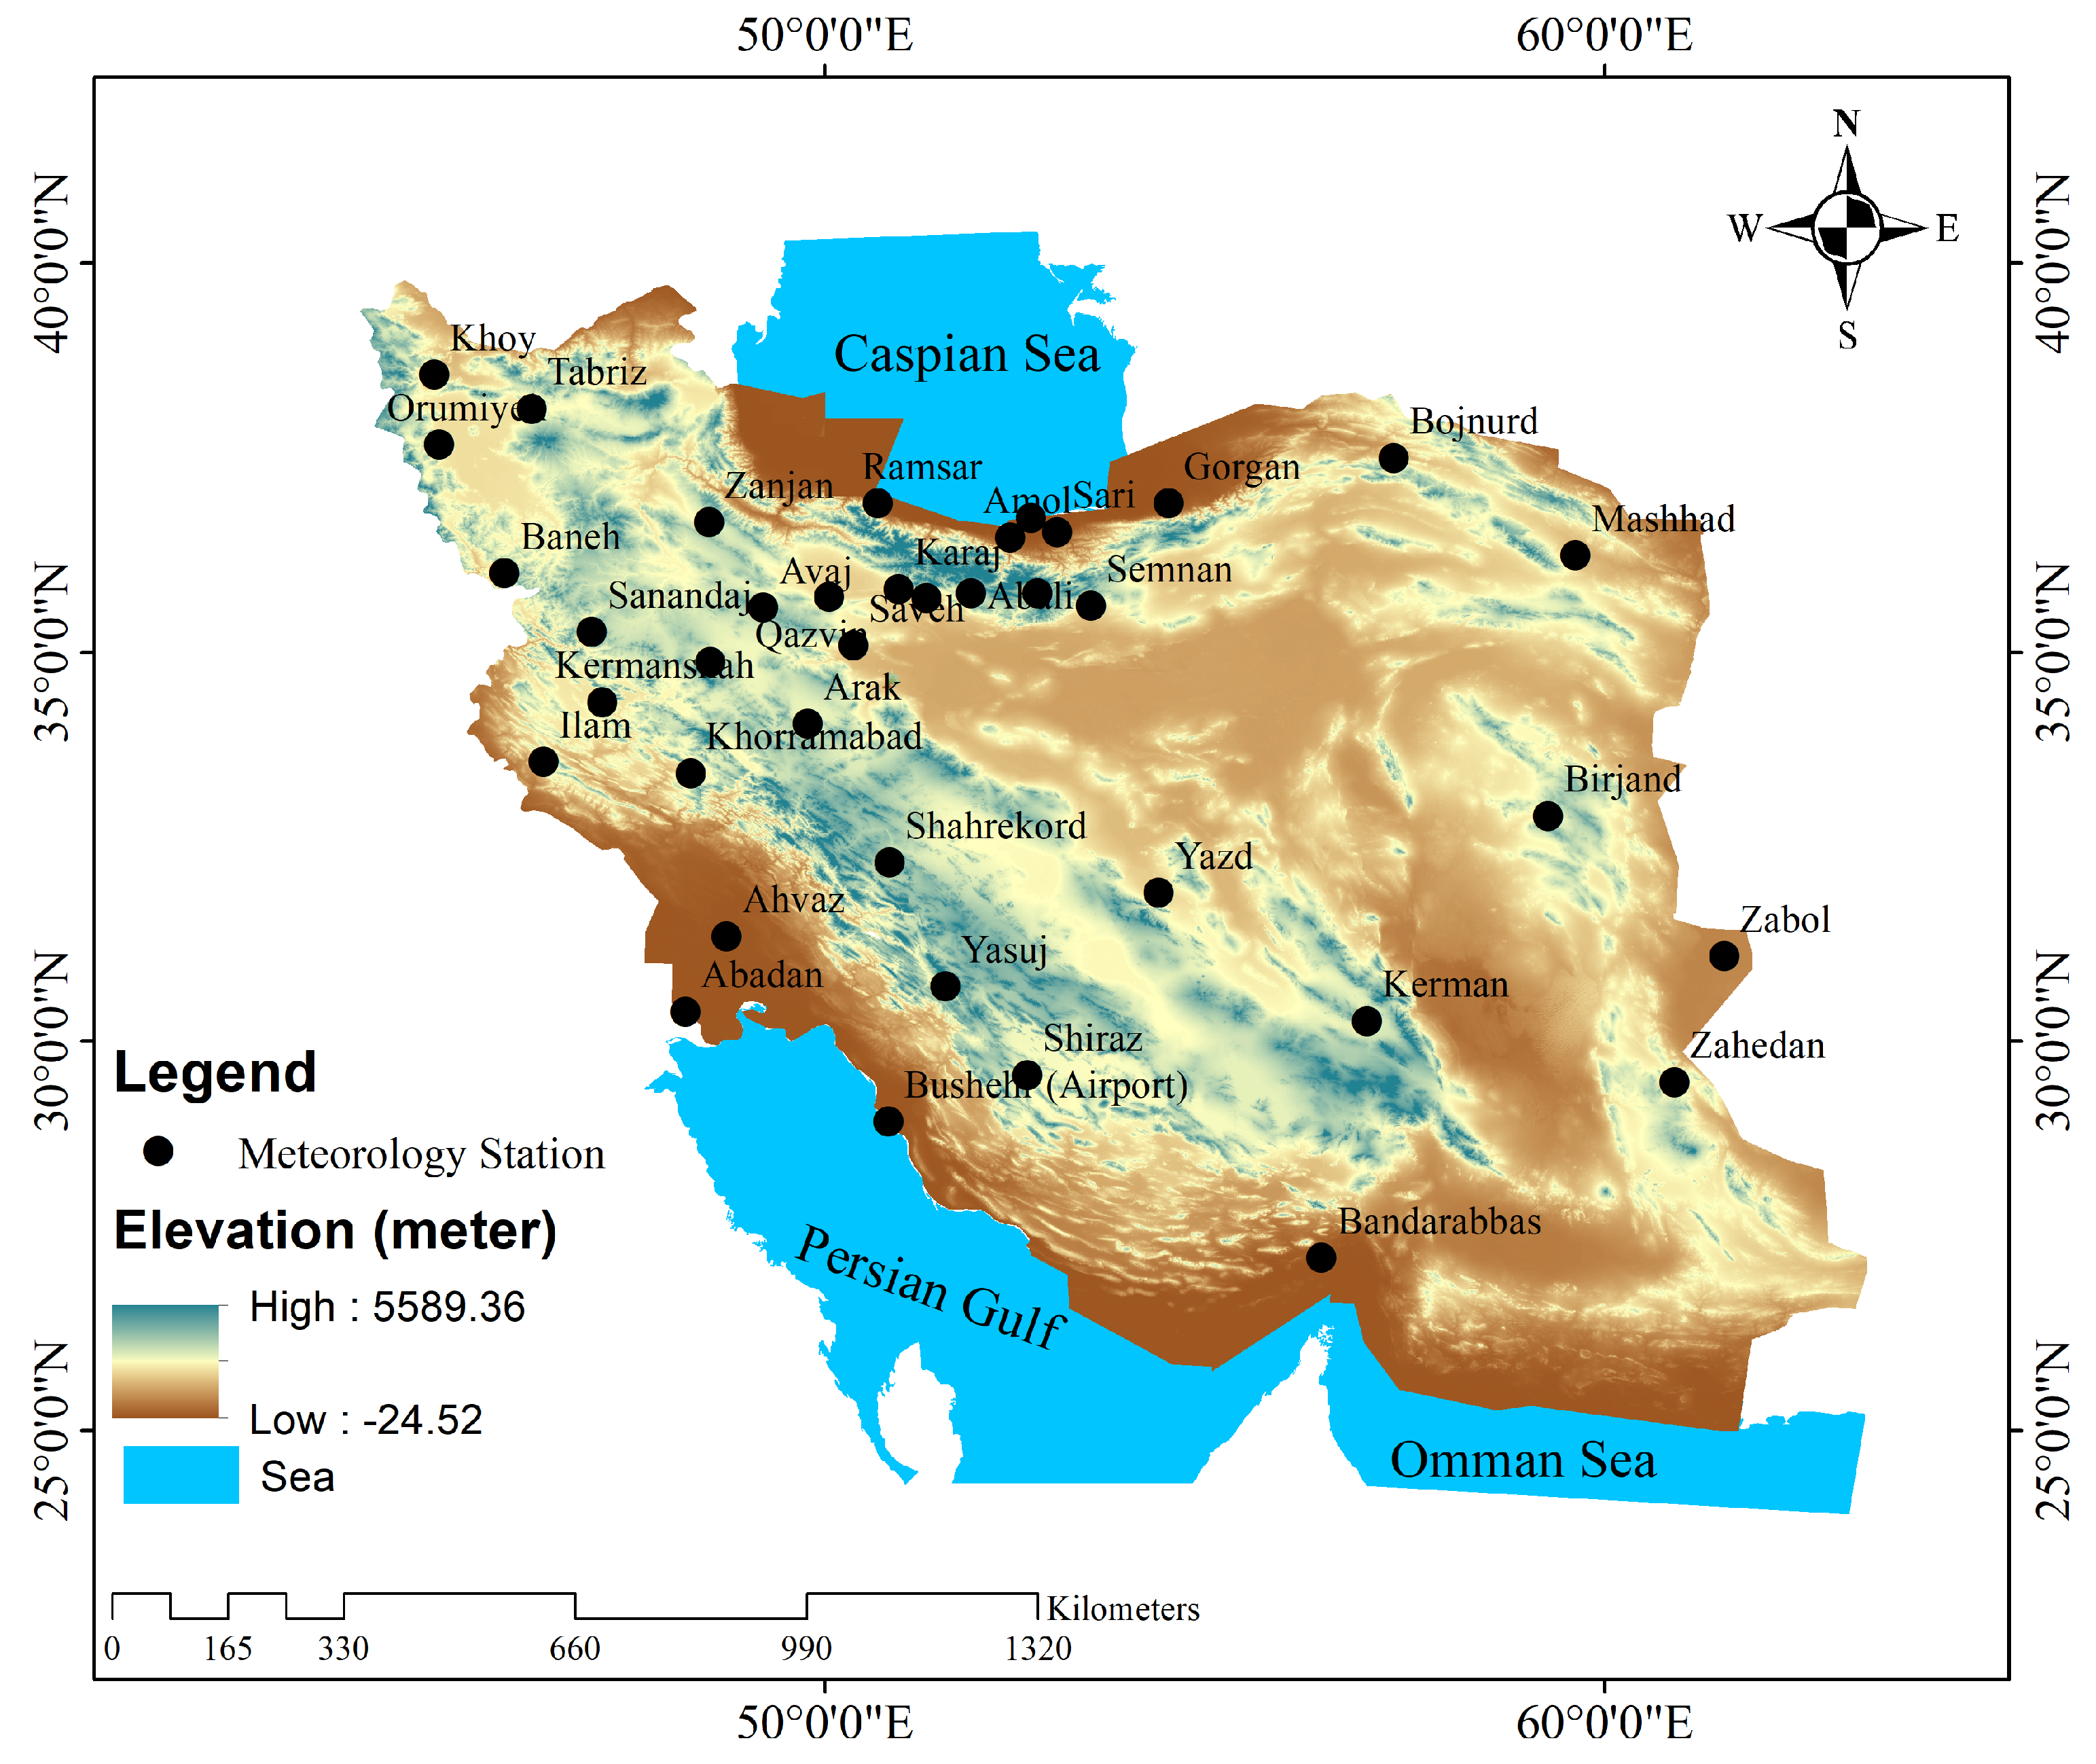
2.1. Study Area and Quality Check of Data
2.2. Data Processing Method
2.2.1. Mann–Kendall (MK) Trend Test
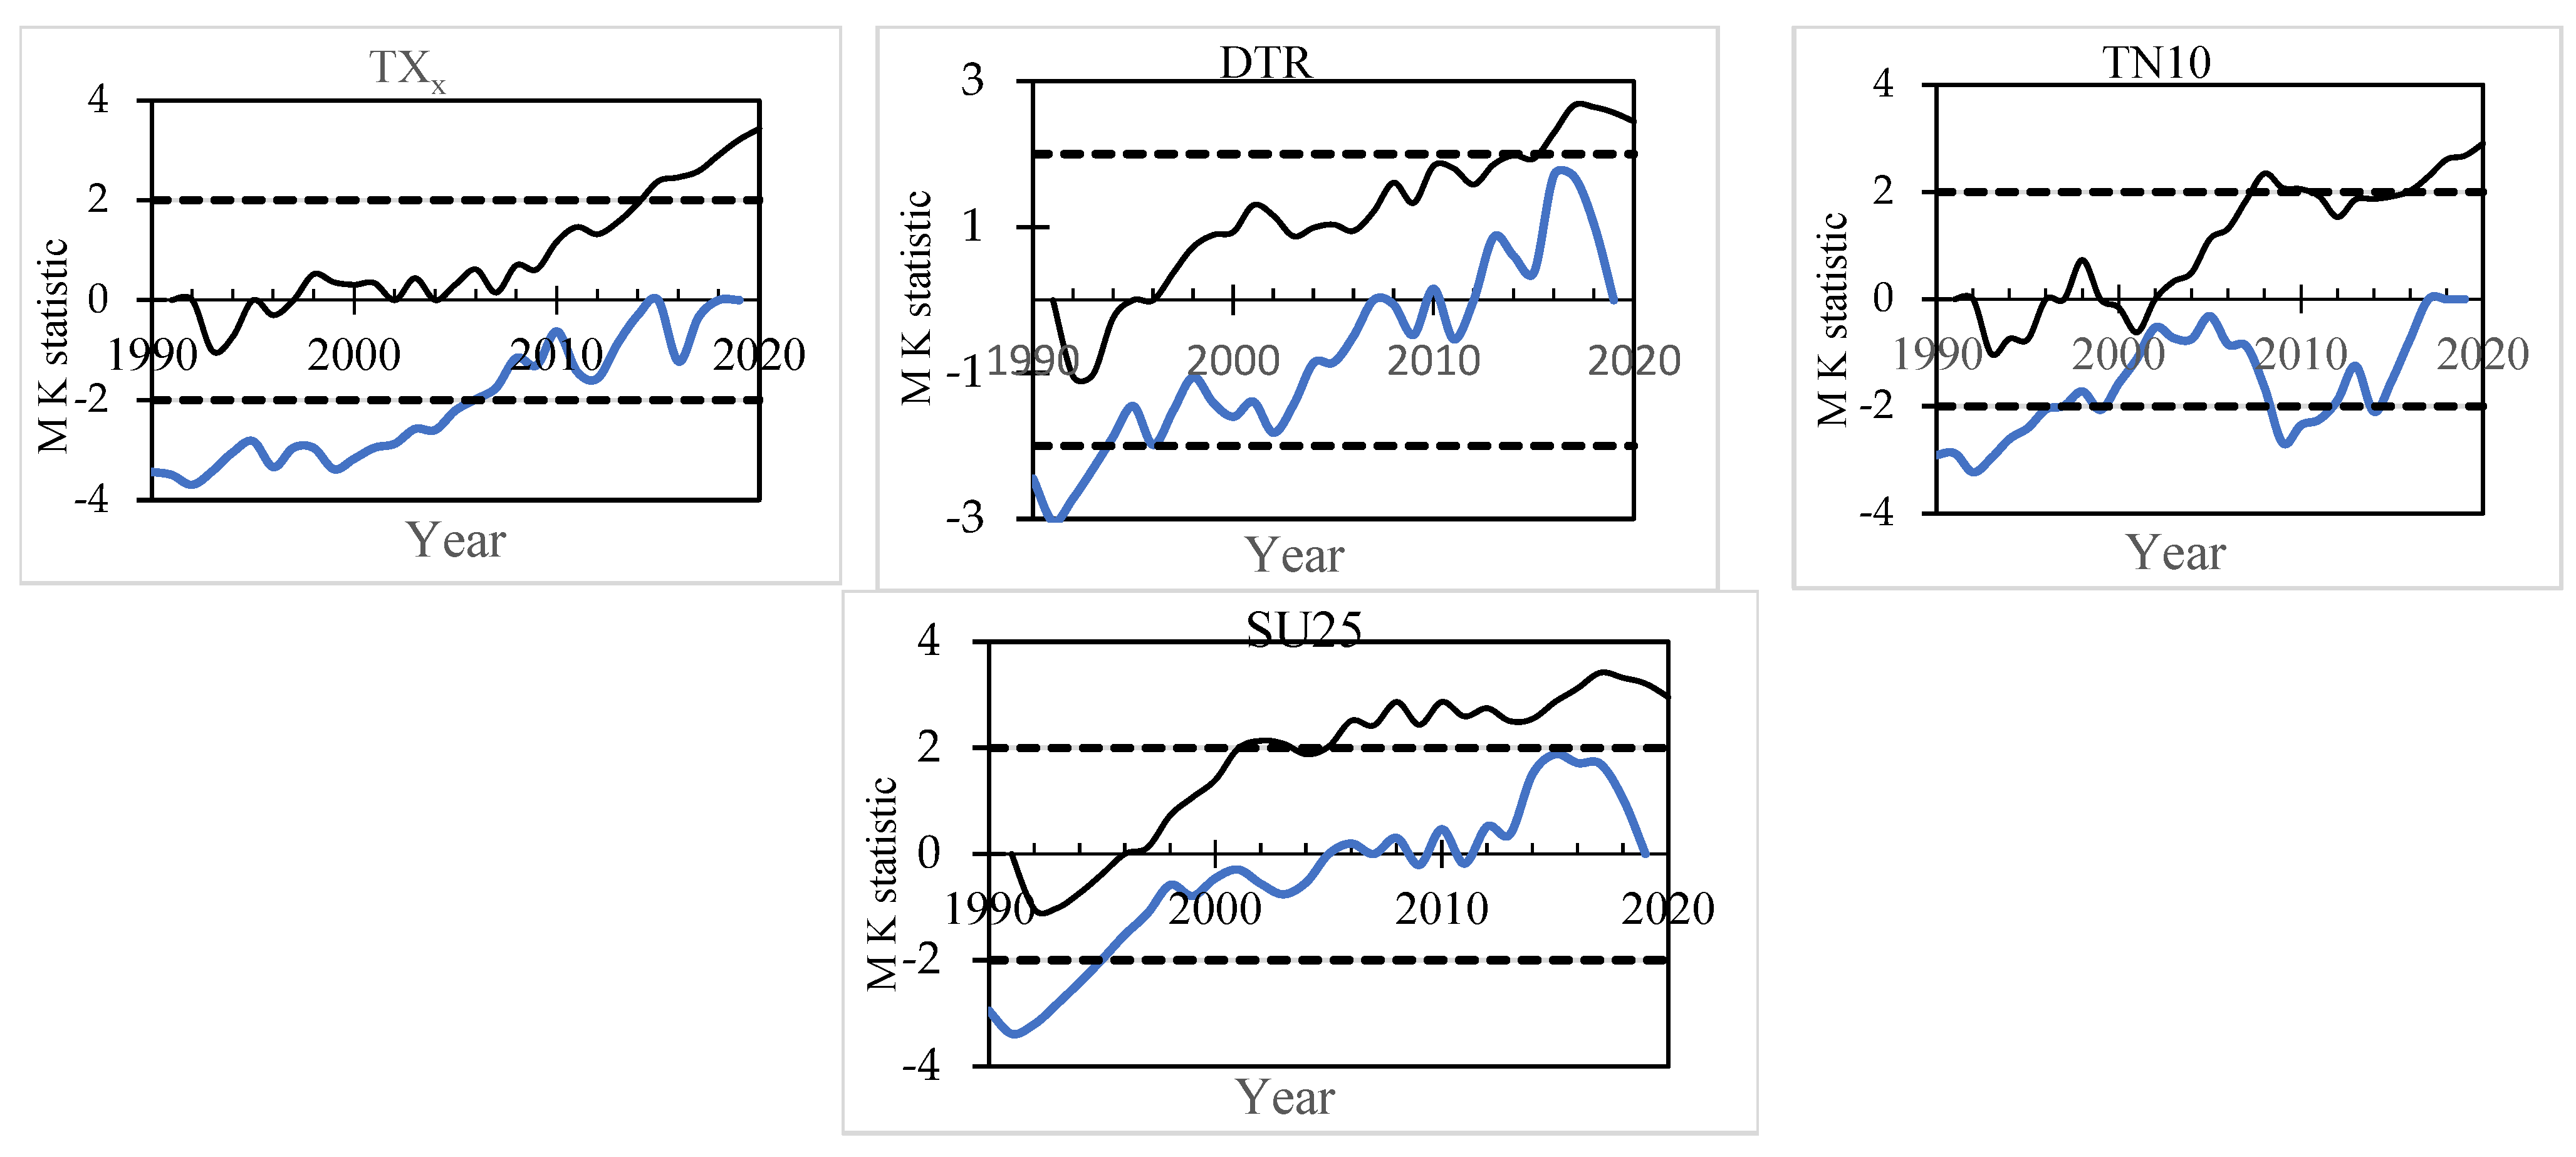
2.2.2. Detection of Mann–Kendall Mutation
2.2.3. Pearson Correlation Coefficient (r)
3. Results and Discussion
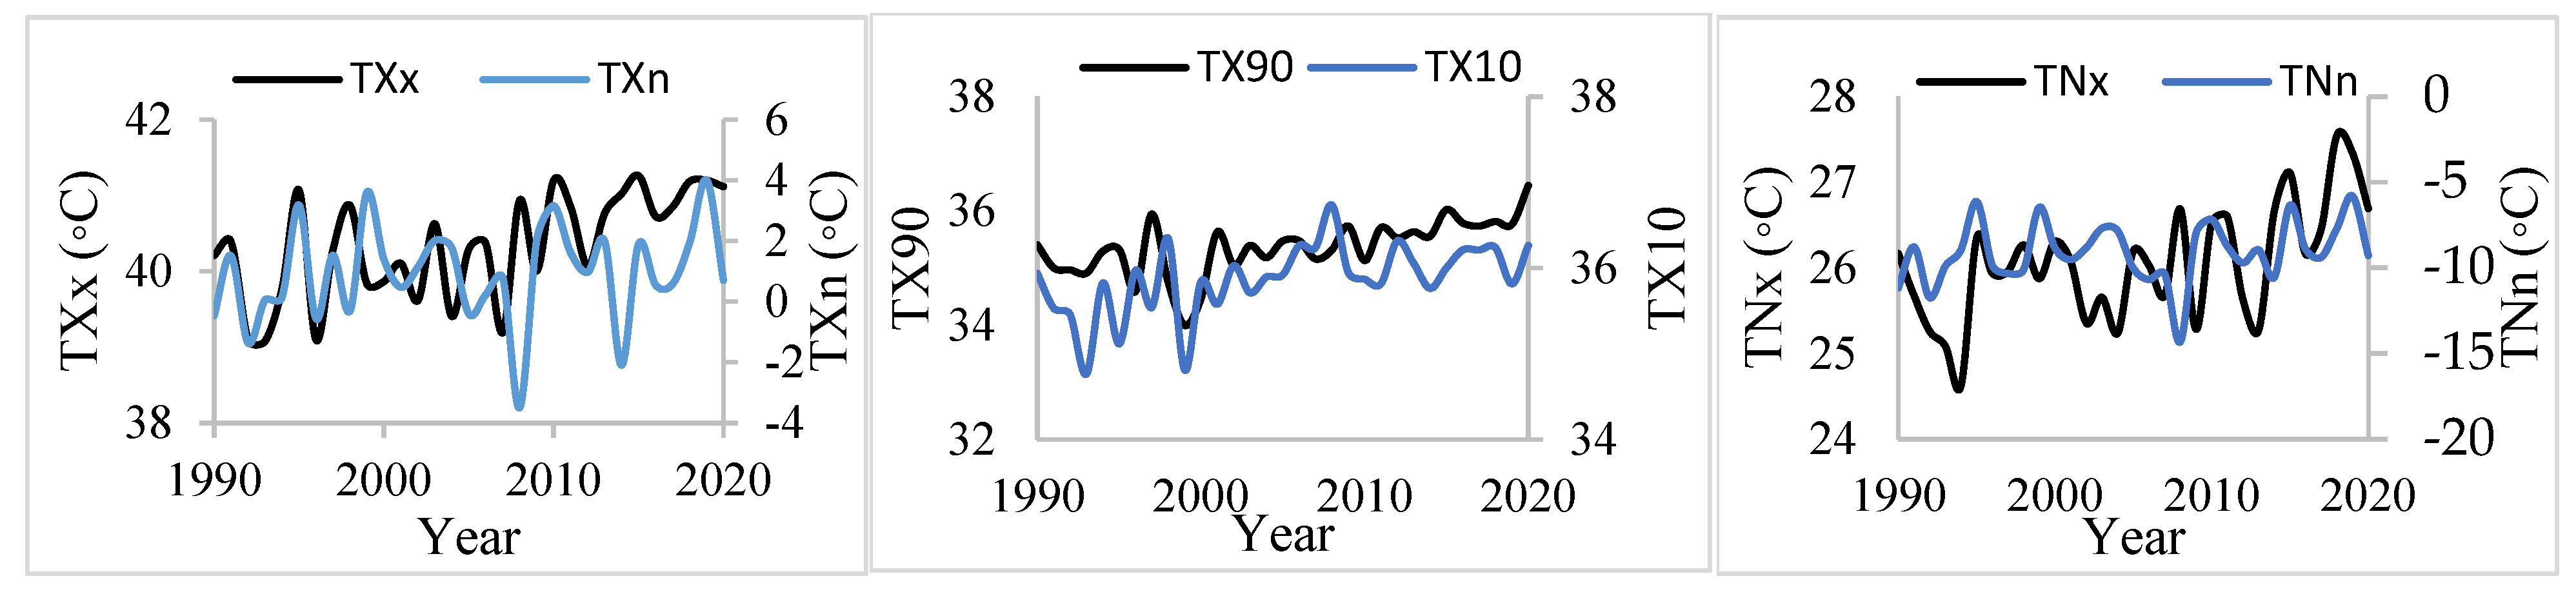
3.1. Analysis of Trend Change and Mutation Point
3.2. Correlation Coefficients of Temperature Indices
3.3. Decadal Change of Temperature Extreme Indices
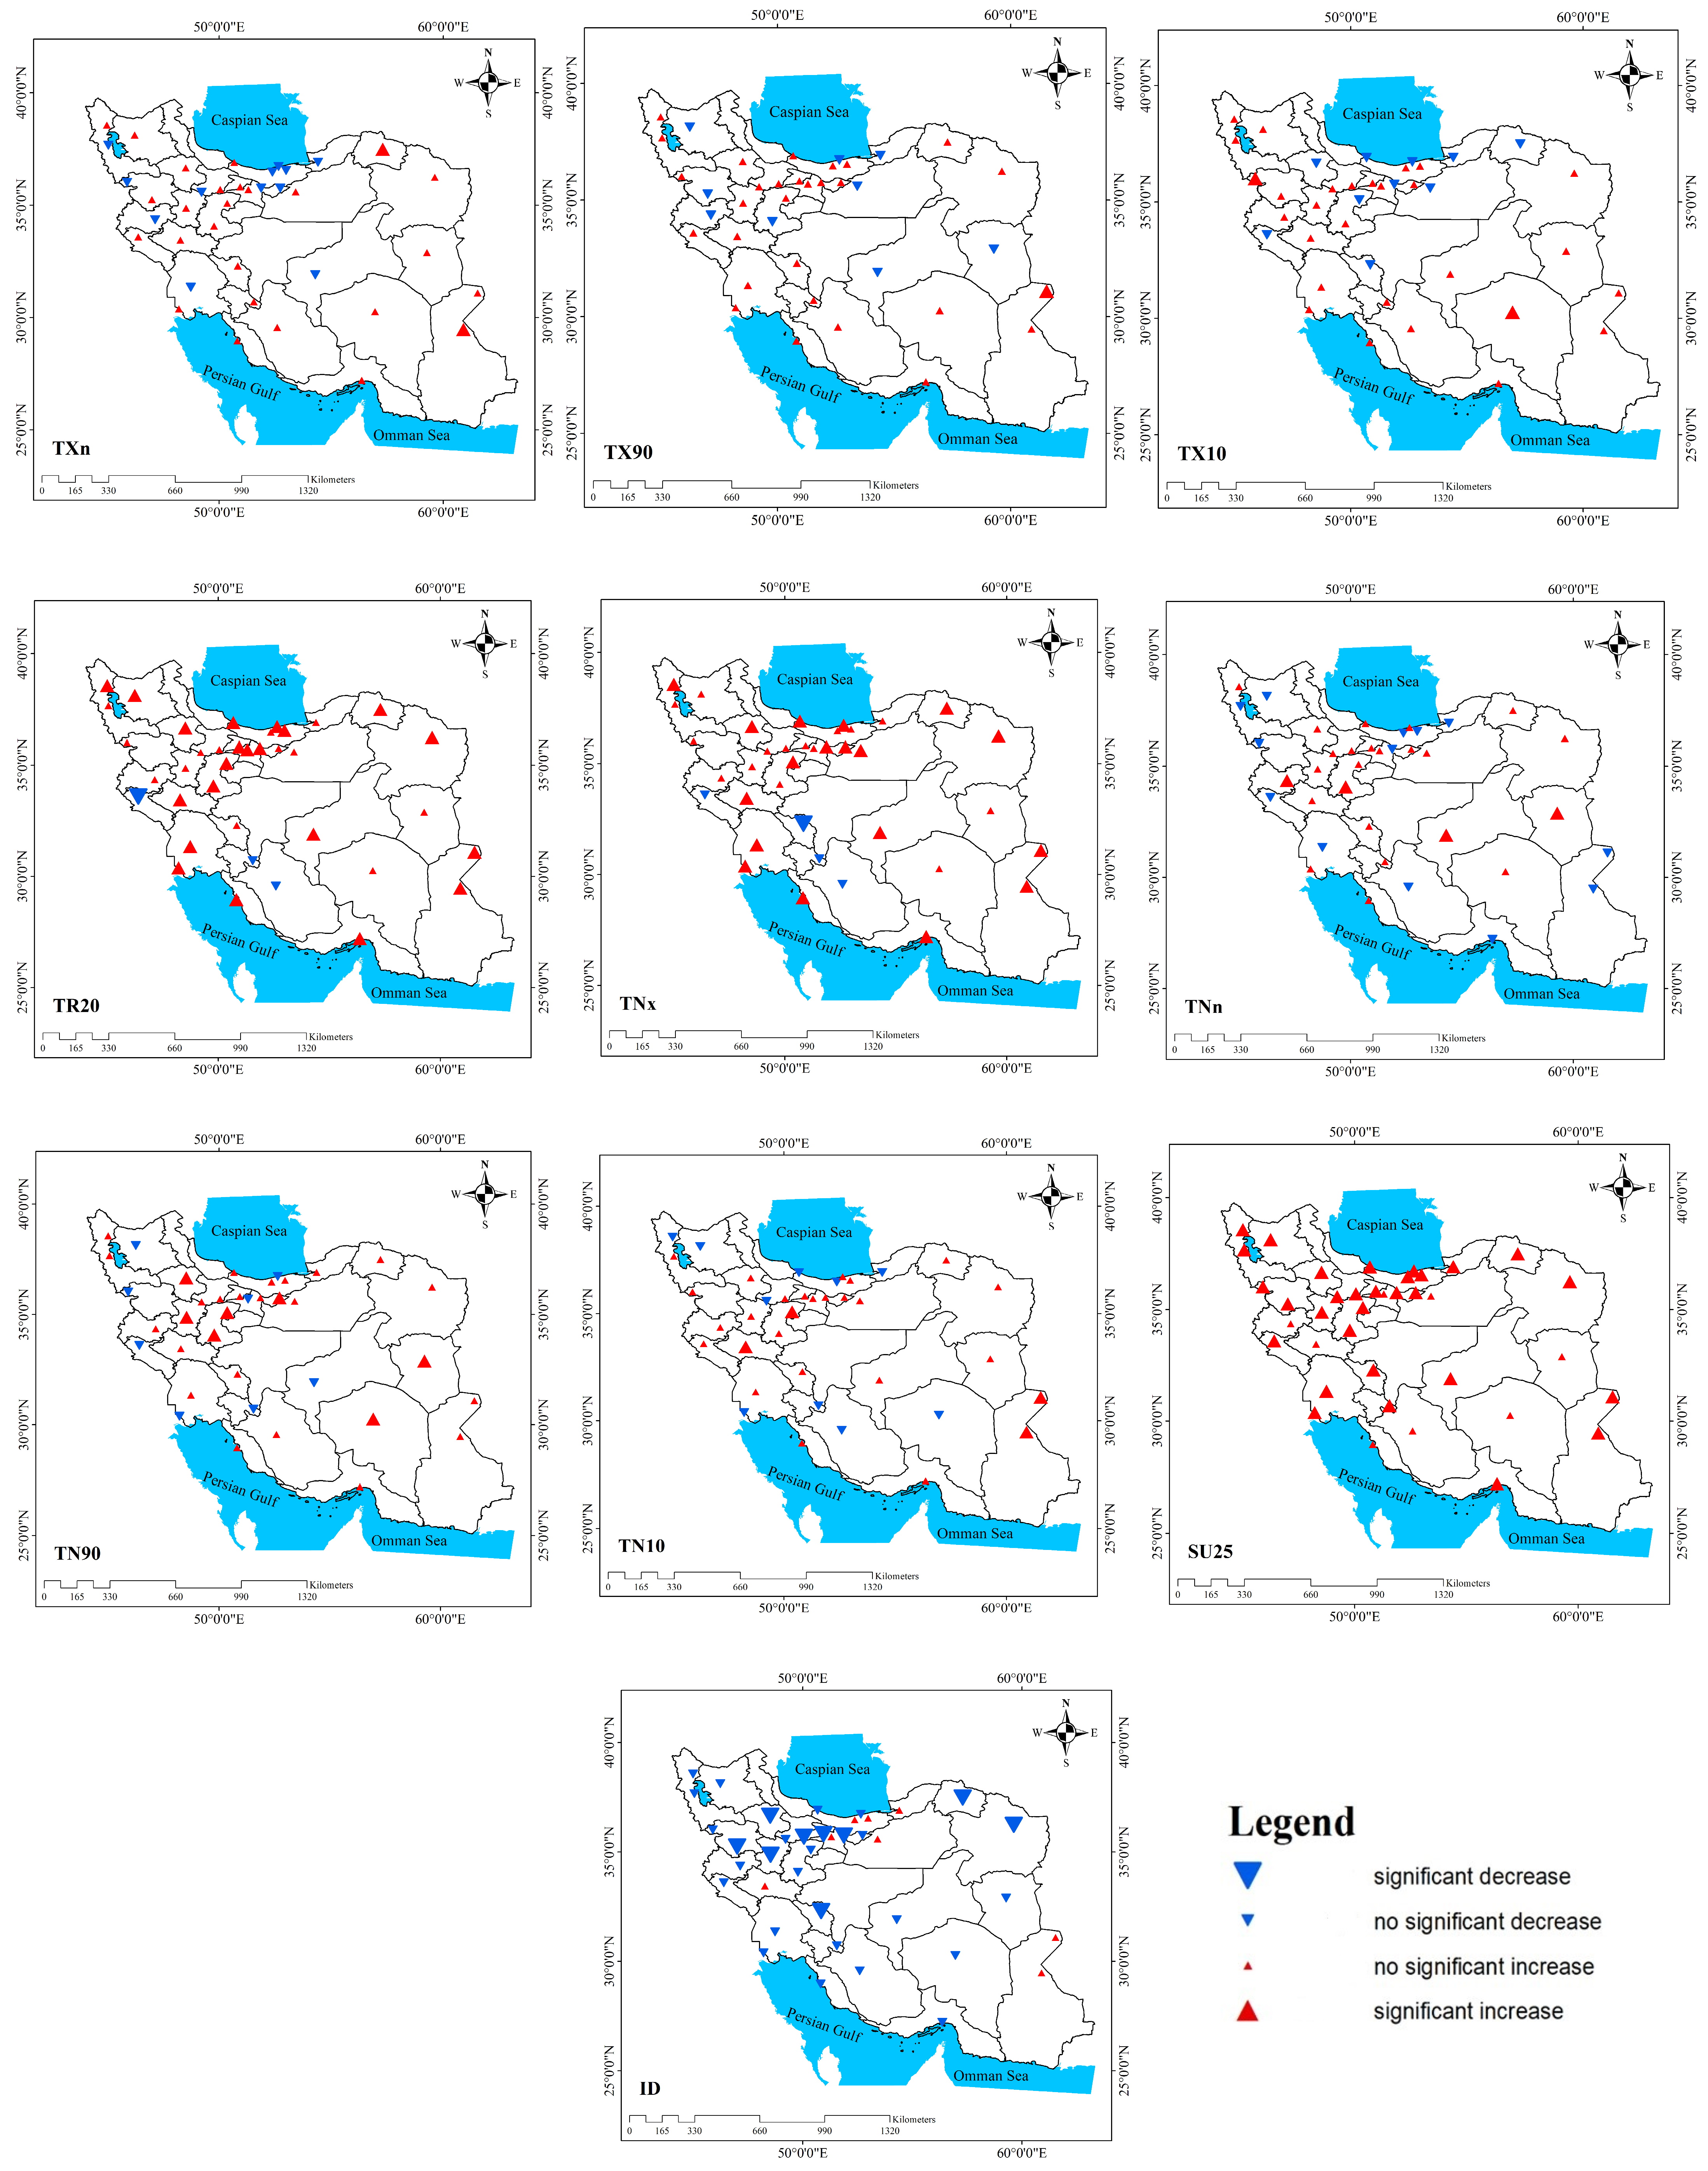
3.4. Analysis of Spatial Variation in the Trend of Temperature Extremes Indices
4. Conclusions
Author Contributions
Funding
Institutional Review Board Statement
Informed Consent Statement
Data Availability Statement
Acknowledgments
Conflicts of Interest
References
- Canadell, J.G.; Le Quer, E.C.; Raupach, M.R.; Field, C.B.; Buitenhuis, E.T.; Ciais, P.; Conway, T.J.; Gillett, N.P.; Houghton, R.A.; Marland, G. Contributions to accelerating atmospheric CO2 growth from economic activity, carbon intensity, and eDciency of natural sinks. Proc. Natl. Acad. Sci. USA 2007, 104, 18866–18870. [Google Scholar] [CrossRef] [PubMed]
- Falkowski, P.; Scholes, R.J.; Boyle, E.; Canadell, J.; CanBeld, D.; Elser, J.; Gruber, N.; Hibbard, K.; Hogberg, P.; Linder, S.; et al. The global carbon cycle: A test of our knowledge of Earth as a system. Science 2000, 290, 291–296. [Google Scholar] [CrossRef] [PubMed]
- IPCC. Climate Change. The Physical Science Basis. Available online: https://www.ipcc.ch/report/ar6/wg1/ (accessed on 6 May 2022).
- Arndt, D.S.; Baringer, M.O.; Johnson, M.R. State of the climate in 2009. Bull. Am. Meteorol. Soc. 2010, 91, 221–224. [Google Scholar] [CrossRef]
- Tabari, H. Climate change impact on flood and extreme precipitation increases with water availability. Sci. Rep. 2020, 10, 13768. [Google Scholar] [CrossRef]
- Li, J.; Wang, M.H.; Ho, Y.S. Trends in research on global climate change: A science citation index expanded-based analysis. Glob. Planet. Change 2011, 77, 13–20. [Google Scholar] [CrossRef]
- Zhang, X.B.; Alexander, L.; Hegerl, G.C. Indices for monitoring changes in extremes based on daily temperature and precipitation data. WIREs Clim. Change 2017, 2, 851–870. [Google Scholar] [CrossRef]
- Peterson, T.C.; Folland, C.; Gruza, G.; Hogg, W.I.; Mokssit, A.; Plummer, N. Report on the Activities of the Working Group on Climate Change Detection and Related Rapporteurs 1998–2001. Climate Change Detection, Number March 143; World Meteorological Organization: Geneva, Switzerland, 2001. [Google Scholar]
- Ruiz-Alvarez, O.; Singh, V.P.; Enciso-Medina, J.; Ontiveros-Capurata, R.E.; dos Santos, C.A.C. Observed trends in daily temperature extreme indices in Aguascalientes, Mexico. Theor. Appl. Climatol. 2020, 142, 1425–1445. [Google Scholar] [CrossRef]
- Kalita, R.; Kalita, D.; Saxena, A. Trends in extreme climate indices in Cherrapunji for the period 1979 to 2020. J. Earth Syst. Sci. 2023, 132, 74. [Google Scholar] [CrossRef]
- Dong, T.; Liu, J.; Liu, D.; He, P.; Li, Z.; Shi, M.; Xu, J. Spatiotemporal variability characteristics of extreme climate events in Xinjiang during 1960–2019. Environ. Sci. Pollut. Res. 2023, 30, 57316–57330. [Google Scholar] [CrossRef]
- Poudel, A.; Cuo, L.; Ding, J.; Gyawali, A.R. Spatio-temporal variability of the annual and monthly extreme temperature indices in Nepal. Int. J. Climatol. 2020, 40, 4956–4977. [Google Scholar] [CrossRef]
- Gedefaw, M. Assessment of changes in climate extremes of temperature over Ethiopia. Cogent Eng. 2023, 10, 2178117. [Google Scholar] [CrossRef]
- Guo, E.; Zhang, J.; Wang, Y.; Quan, L.; Zhang, R.; Zhang, F.; Zhou, M. Spatiotemporal variations of extreme climate events in Northeast China during 1960–2014. Ecol. Indic. 2019, 96, 669–683. [Google Scholar] [CrossRef]
- Ahmadi, M.; Lashkari, H.; Keykhosravi, G.; Azadi, M. Analysis of extreme temperature indicators in the detection of climate change in Greater Khorasan. Geography 2015, 13, 53–75. [Google Scholar]
- Fathian, F.; Ghadami, M.; Haghighi, P.; Amini, M.; Naderi, S.; Ghaedi, Z. Assessment of changes in climate extremes of temperature and precipitation over Iran. Theor. Appl. Climatol. 2020, 141, 1119–1133. [Google Scholar] [CrossRef]
- Soltani, M.; Laux, P.; Kunstmann, H.; Stan, K.; Sohrabi, M.M.; Molanejad, M.; Martin, M.V. Assessment of climate varia-tions in temperature and precipitation extreme events over Iran. Theor. Appl. Climatol. 2016, 126, 775–795. [Google Scholar] [CrossRef]
- Rahimi, M.; Hejabi, S. Spatial and temporal analysis of trends in extreme temperature indices in Iran over the period 1960–2014. Int. J. Climatol. 2018, 38, 272–282. [Google Scholar] [CrossRef]
- Rahimzade, F.; Hedayati Dezfouli, A.; Pourasgharian, A. Assessments of the process and mutation of extreme indices of temperature and precipitation in Hormozgan Province. Geogr. Dev. 2011, 9, 97–116. Available online: https://sid.ir/paper/77002/en (accessed on 15 April 2025).
- Abbaspour, K.C.; Faramarzi, M.; Ghasemi, S.S.; Yang, H. Assessing the impact of climate change on water resources in Iran. Water Resour. Res. 2009, 45, 10. [Google Scholar] [CrossRef]
- Kehl, M. Quaternary climate change in Iran—The state of knowledge. Erdkunde 2009, 1, 1–17. [Google Scholar] [CrossRef]
- Wang, X.L.; Wen, Q.H.; Wu, Y. Penalized maximal t test for detecting undocumented mean change in climate data series. J. Appl. Meteorol. Climatol. 2007, 46, 916–931. [Google Scholar] [CrossRef]
- Wang, X.L.; Feng, Y. RHtestsV4 User Manual. Climate Research Division, Atmospheric Science and Technology Directorate, Science and Technology Branch, Environment Canada. 2013; Volume 28, p. 780. Available online: https://etccdi.pacificclimate.org/RHtest/RHtestsV4_UserManual_10Dec2014.pdf (accessed on 15 April 2025).
- Mann, H.B. Nonparametric tests against trend. Econometrica 1945, 13, 245–259. [Google Scholar] [CrossRef]
- Gilbert, R.O. Statistical Methods for Environmental Pollution Monitoring; John Wiley & Sons: Hoboken, NJ, USA, 1987. [Google Scholar]
- Hirsch, R.M.; Slack, J.R.; Smith, R.A. Techniques of trend analysis for monthly water quality data. Water Resour. Res. 1982, 18, 107–121. [Google Scholar] [CrossRef]
- Gumus, V.; Yenigun, K. Evaluation of Lower Firat Basin streamflow by trend analysis. In Proceedings of the 7th International Advances in Civil Engineering Conference, Istanbul, Turkey, 11–13 October 2006. [Google Scholar]
- Lamchin, M.; Lee, W.K.; Jeon, S.W.; Wang, S.W.; Lim, C.H.; Song, C.; Sung, M. Long-term trend and correlation between vegetation greenness and climate variables in Asia based on satellite data. Sci. Total Environ. 2018, 618, 1089–1095. [Google Scholar] [CrossRef] [PubMed]
- Wang, J. Determining the most accurate program for the Mann-Kendall method in detecting climate mutation. Theor. Appl. Climatol. 2020, 142, 847–854. [Google Scholar] [CrossRef]


| Index | Index Name | Index Definition | Unit |
|---|---|---|---|
| TXx | Hottest day | Maximum of daily maximum temperature in period. | °C |
| TNx | Warmest night | Maximum of daily minimum temperature in the period. | °C |
| TXn | Coldest day | Minimum of daily maximum temperature in period. | °C |
| TNn | Coldest night | Minimum of daily minimum temperature in the period. | °C |
| FD | Frost days | Annual count of days when daily minimum temperature < 0 °C. | day |
| ID | Ice days | Annual count of days when daily maximum temperature < 0 °C. | day |
| DTR | Diurnal temperature range | Annual mean of the daily difference between minimum and maximum temperature. | °C |
| SU25 | Summer days | Annual count of days when daily maximum temperature > 25 °C. | day |
| TR20 | Tropical nights | Annual count of days when daily minimum temperature > 20 °C. | day |
| TX10p | Cold days | Percentage of time when daily max temperature <10th percentile. | % |
| TN10p | Cold nights | Percentage of time when daily max temperature <10th percentile. | % |
| TN90p | Warm nights | Percentage of time when daily min temperature >90th percentile. | % |
| TX90p | Warm days | Percentage of time when daily max temperature >90th percentile. | % |
| DTR | FD | TN10P | TN90P | TNN | TNX | TR | ID | SU | TX10 | TX90 | TXN | TXX | |
|---|---|---|---|---|---|---|---|---|---|---|---|---|---|
| DTR | 1 | ||||||||||||
| FD | 0.366 * | 1 | |||||||||||
| TN10P | 0.177 | 0.381 * | 1 | ||||||||||
| TN90P | −0.288 | −0.213 | 0.313 | 1 | |||||||||
| TNn | −0.407 * | −0.953 ** | −0.282 | 0.259 | 1 | ||||||||
| TNX | −0.152 | −0.874 ** | −0.386 * | 0.047 | 0.857 ** | 1 | |||||||
| TR | −0.303 | −0.860 ** | −0.322 | 0.087 | 0.905 ** | 0.903 ** | 1 | ||||||
| ID | −0.036 | 0.783 ** | 0.235 | −0.137 | −0.687 ** | −0.650 ** | −0.555 ** | 1 | |||||
| SU | 0.235 | −0.675 ** | −0.154 | −0.007 | 0.698 ** | 0.806 ** | 0.759 ** | −0.690 ** | 1 | ||||
| TX10 | 0.420 ** | 0.085 | 0.425 ** | 0.167 | −0.001 | 0.051 | 0.035 | −0.076 | 0.403 * | 1 | |||
| TX90 | −0.622 ** | −0.396 * | 0.259 | 0.734 ** | 0.430 ** | 0.165 | 0.304 | −0.119 | −0.022 | −0.098 | 1 | ||
| TXN | −0.154 | −0.855 ** | −0.187 | 0.21 | 0.928 ** | 0.812 ** | 0.878 ** | −0.720 ** | 0.858 ** | 0.204 | 0.289 | 1 | |
| TXX | 0.359* | −0.568 ** | −0.216 | −0.005 | 0.549 ** | 0.779 ** | 0.650 ** | −0.608 ** | 0.899 ** | 0.412 * | −0.121 | 0.670 ** | 1 |
| Index | 1990–2000 (Decade 1) | 2000–2010 (Decade 2) | 2010–2020 (Decade 3) | Decade Changes 1–2 | Decade Changes 2–3 | Unit |
|---|---|---|---|---|---|---|
| DTR | 12.8 | 13.0 | 13.1 | 0.0 | 0.0 | °C |
| FD | 67.0 | 63.0 | 63.0 | −4.0 | 0.0 | day |
| ID | 12.0 | 11.0 | 8.0 | −1.0 | −3.0 | day |
| SU | 163.0 | 173.0 | 174.0 | 10.0 | 1.0 | day |
| TN10 | 35.0 | 36.0 | 36.0 | 1.0 | 0.0 | day |
| TN90 | 35.0 | 35.0 | 36.0 | 0.0 | 1.0 | day |
| TNn | −9.3 | −9.4 | −8.5 | −0.1 | 0.9 | °C |
| TNx | 25.8 | 25.9 | 26.5 | 0.1 | 0.7 | °C |
| TR | 66.0 | 70.0 | 71.0 | 4.0 | 1.0 | day |
| TX10 | 36.0 | 36.0 | 36.0 | 0.0 | 0.0 | day |
| TX90 | 35.0 | 35.0 | 36.0 | 0.0 | 1.0 | day |
| TXn | 0.8 | 0.8 | 1.2 | 0.0 | 0.4 | °C |
| TXx | 40.0 | 40.2 | 40.9 | 0.20 | 0.7 | °C |
Disclaimer/Publisher’s Note: The statements, opinions and data contained in all publications are solely those of the individual author(s) and contributor(s) and not of MDPI and/or the editor(s). MDPI and/or the editor(s) disclaim responsibility for any injury to people or property resulting from any ideas, methods, instructions or products referred to in the content. |
© 2025 by the authors. Licensee MDPI, Basel, Switzerland. This article is an open access article distributed under the terms and conditions of the Creative Commons Attribution (CC BY) license (https://creativecommons.org/licenses/by/4.0/).
Share and Cite
Kamali, S.; Fattahi, E.; Habibi, M. Investigating the Trend Changes in Temperature Extreme Indices in Iran. Atmosphere 2025, 16, 483. https://doi.org/10.3390/atmos16040483
Kamali S, Fattahi E, Habibi M. Investigating the Trend Changes in Temperature Extreme Indices in Iran. Atmosphere. 2025; 16(4):483. https://doi.org/10.3390/atmos16040483
Chicago/Turabian StyleKamali, Saeedeh, Ebrahim Fattahi, and Maral Habibi. 2025. "Investigating the Trend Changes in Temperature Extreme Indices in Iran" Atmosphere 16, no. 4: 483. https://doi.org/10.3390/atmos16040483
APA StyleKamali, S., Fattahi, E., & Habibi, M. (2025). Investigating the Trend Changes in Temperature Extreme Indices in Iran. Atmosphere, 16(4), 483. https://doi.org/10.3390/atmos16040483