
Advancing Heat Health Risk Assessment: Hotspot Identification of Heat Stress and Risk Across Municipalities in Algiers, Algeria

 , , ,
, , , 
Abstract
:
1. Introduction
2. Materials and Methods

| Category | Indicator | Description | Formula | Impact | References |
|---|---|---|---|---|---|
| Hazard | H1: LST Land surface temperature | The temperature of the Earth’s surface is measured using satellite images of thermal bands | (+) | [17,20,37] | |
| H2: Hot days | Days with maximum air temperatures greater than 35 °C | Count of days with Tair Max > 35 °C | (+) | [9,13,16] | |
| H3: Heatwave frequency | The number of events where the max daily average temperature exceeds 35 °C for more than 3 days | Count of days with Tair max > 35 °C for more than 3 consecutive days | (+) | [9,13,38] | |
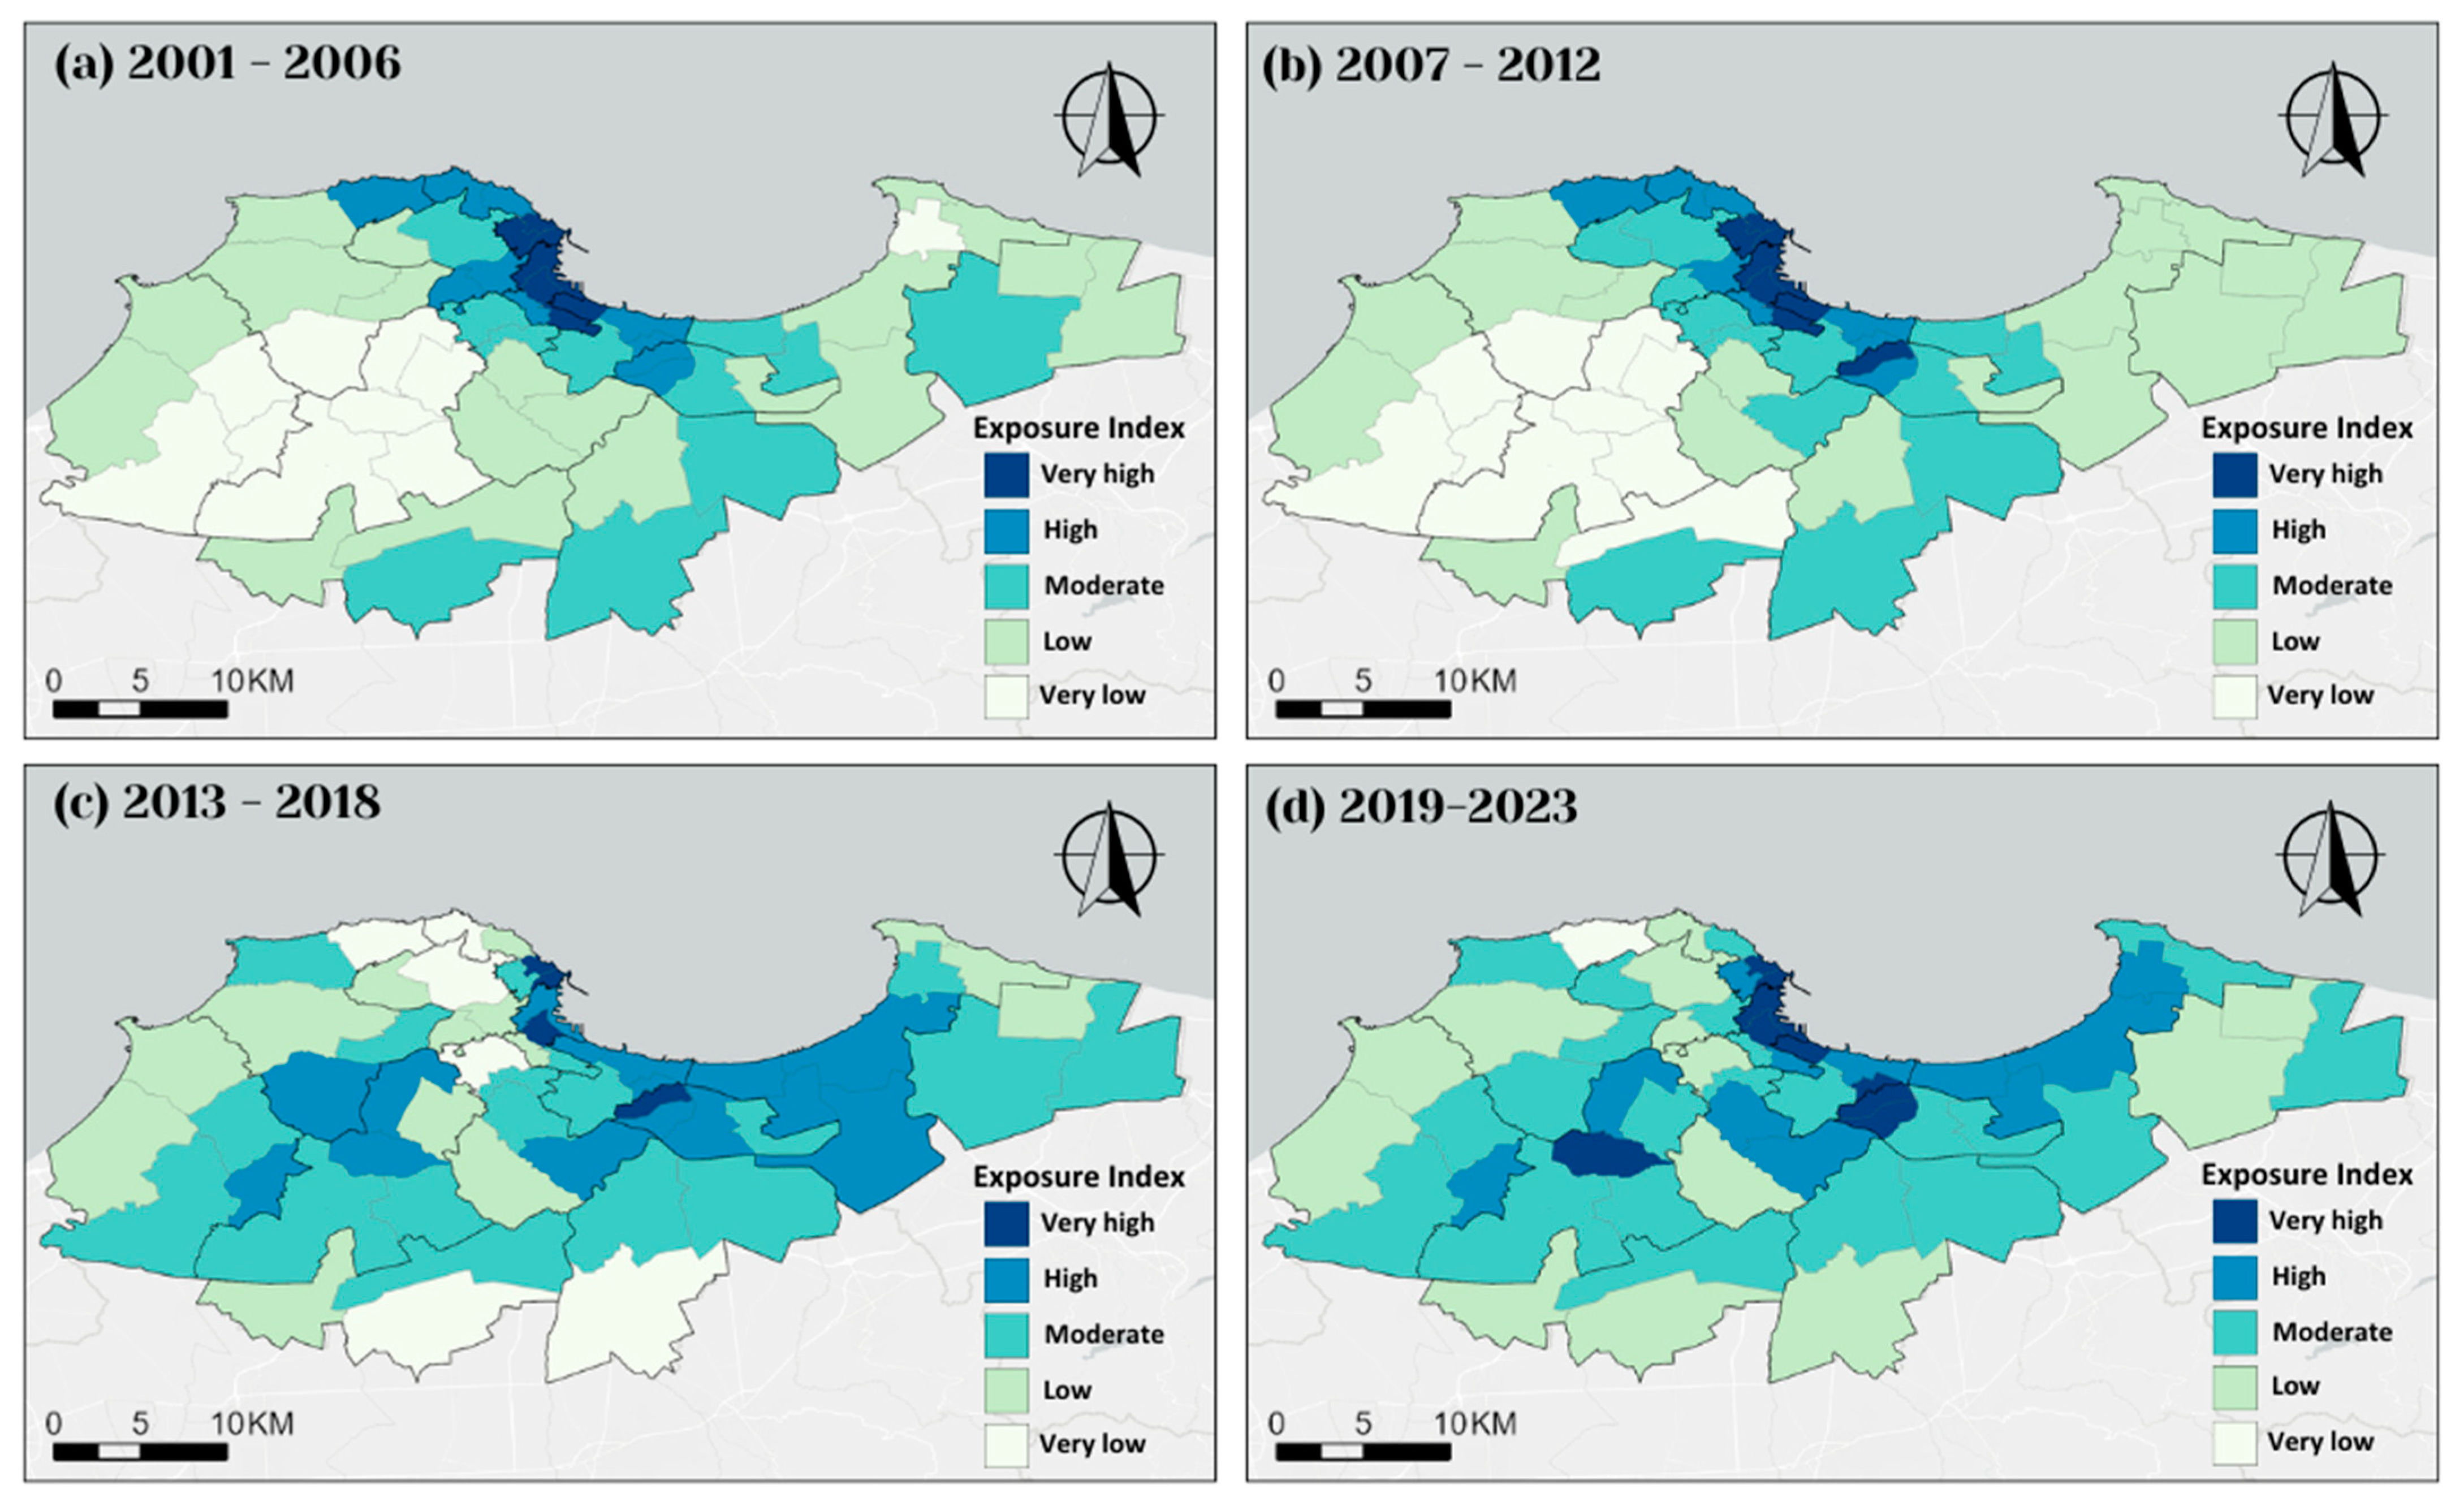
| Exposure | E1: (PD) Population density | Number of people per square kilometer | (+) | [15,37,38] | |
| E2: (NDBI) Normalized difference building index | An index used to measure built-up areas and urbanization | (+) | [39,40] | ||
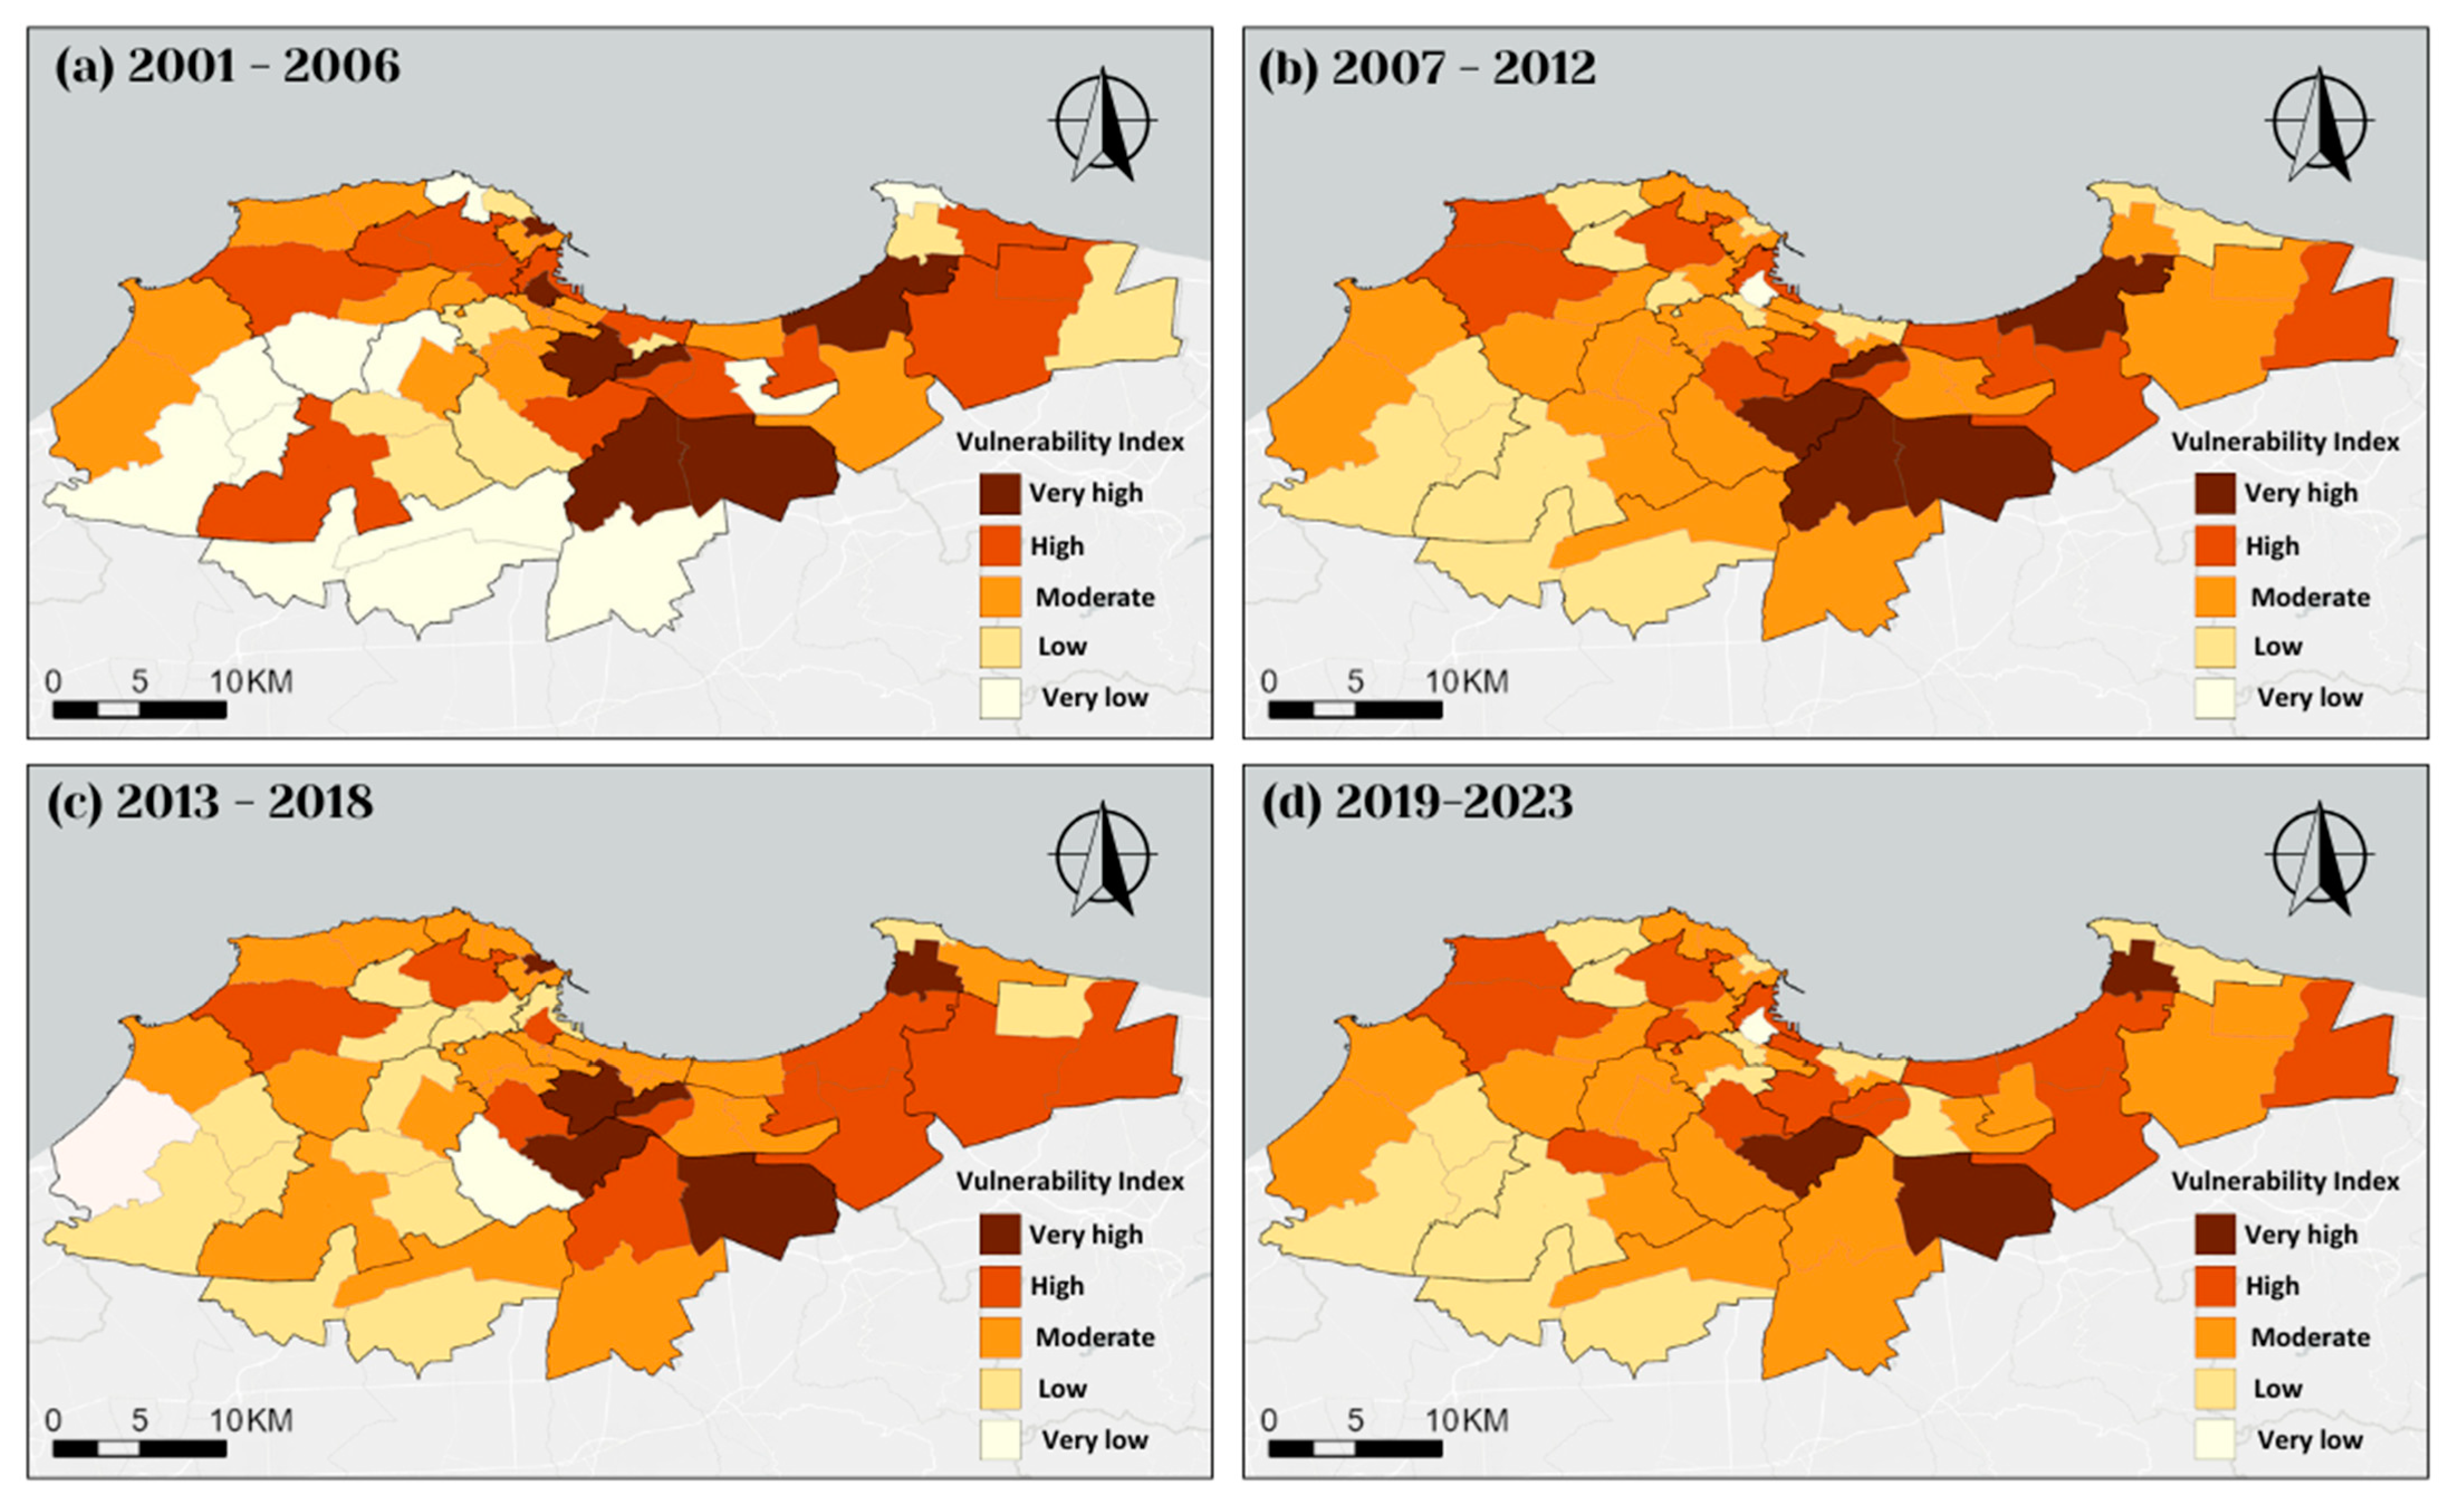
| Vulnerability | V1: (NDVI) Normalized difference vegetation index | An index used to measure the density of vegetation | (−) | [37,40] | |
| V2: (MNDWI) Modified normalized difference water index | An index used to identify water bodies | (−) | [16,37,39] | ||
| V3: (PD > 65 yo) Elderly population | The number of people aged 65 and older per square kilometer | (+) | [14,16,18] | ||
| V4: (PD < 15 yo) Young population | The number of people aged 15 and younger per square kilometer | (+) | [14,17,41] | ||
| V5: (FP) Female population | Number of females per square kilometer | (+) | [6,15,39,42] | ||
| V6: (CB) Care beds | The number of available care beds available per municipality | Total Care Beds per municipality | (−) | [6,9,15] |
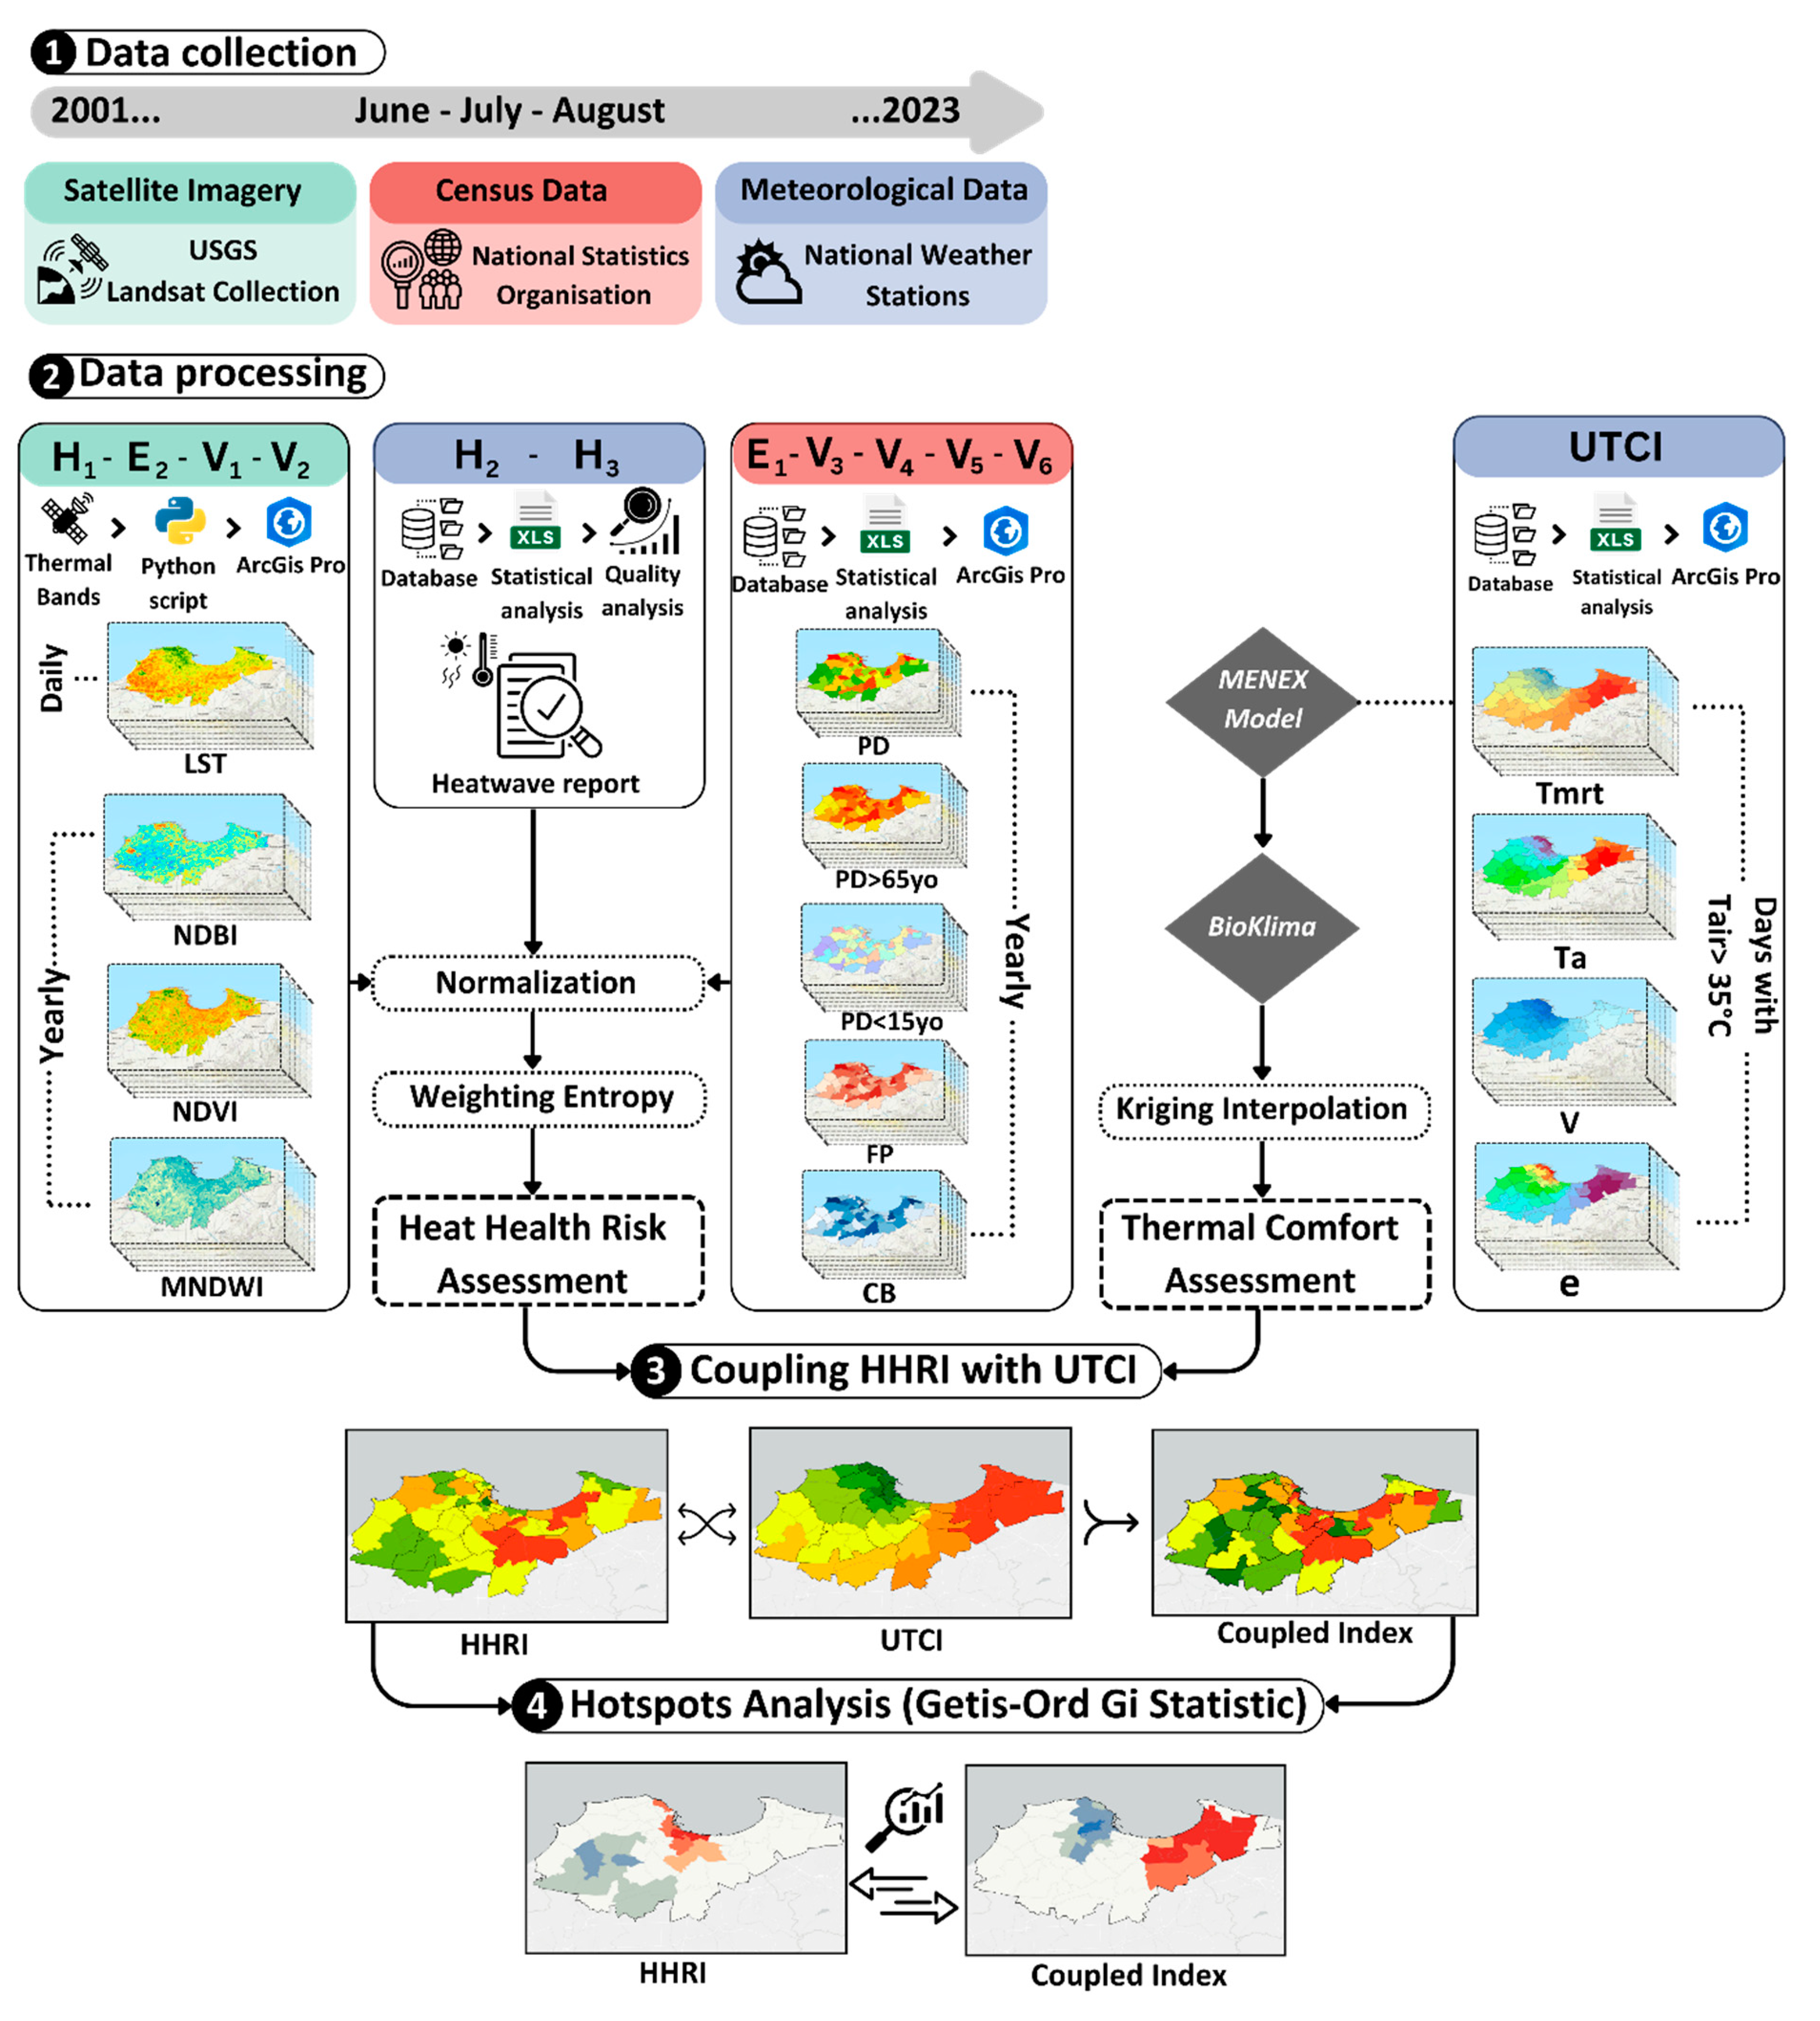
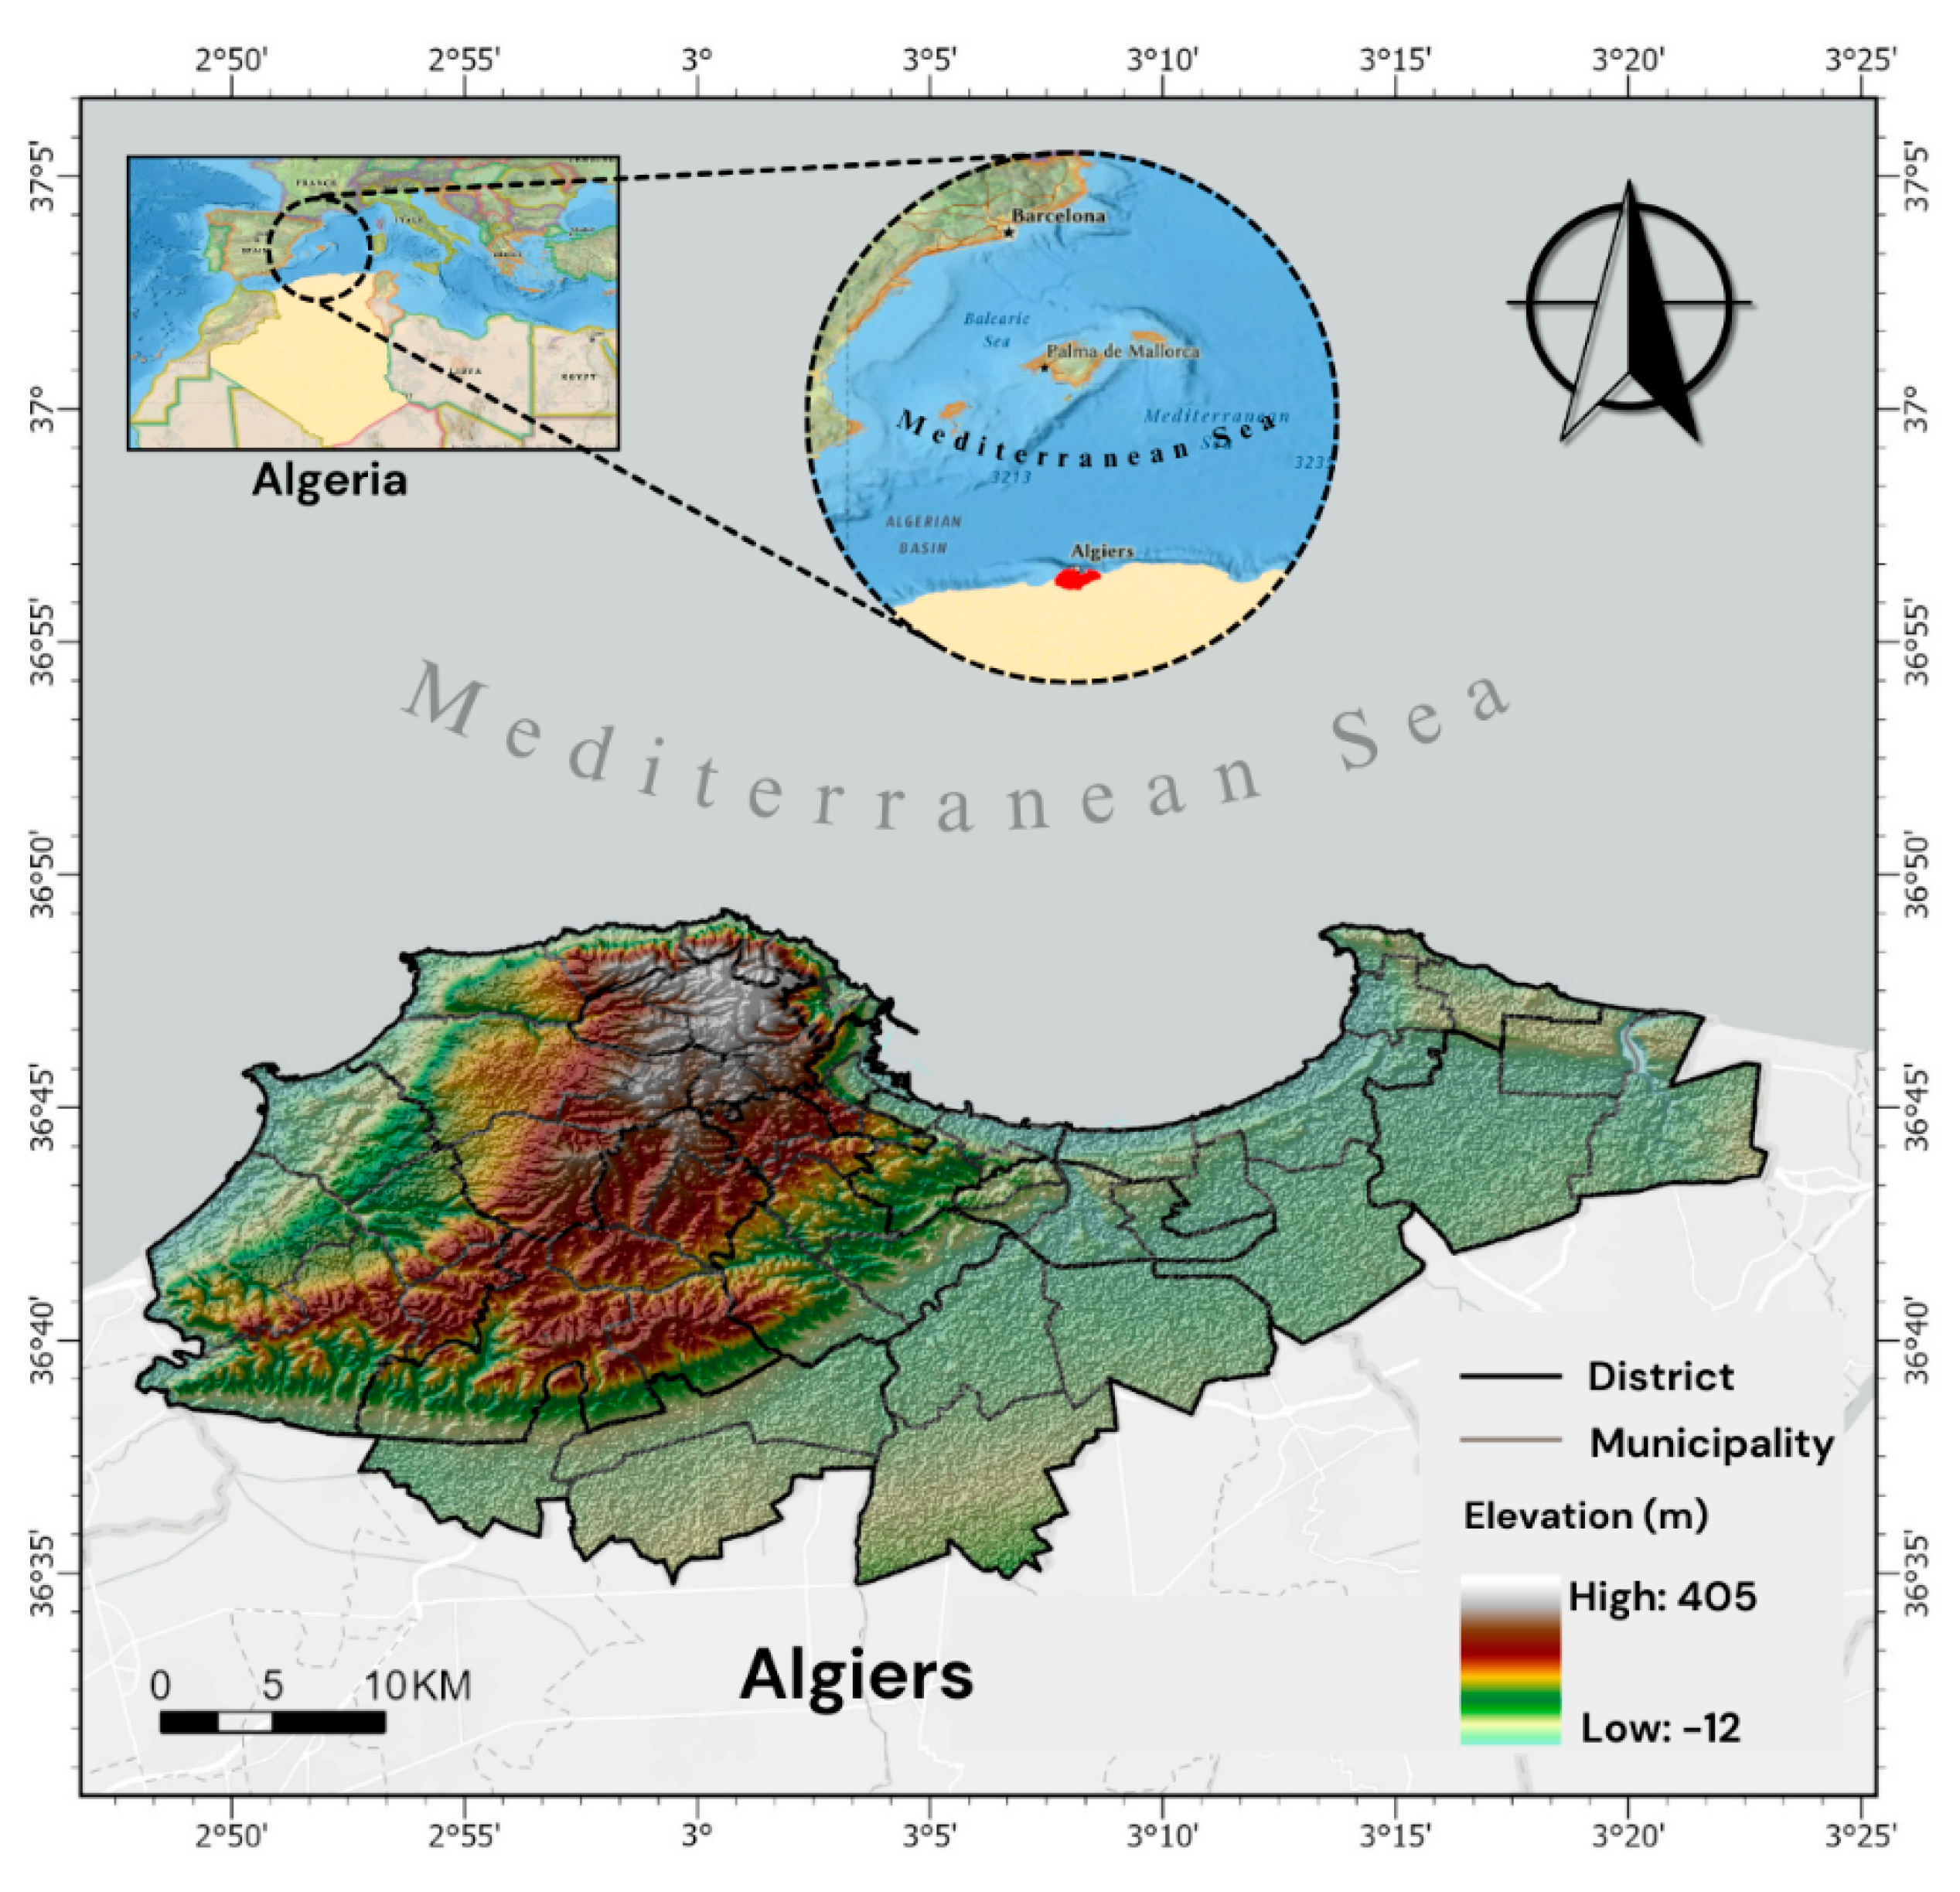
2.1. Data Collection
2.2. Data Processing
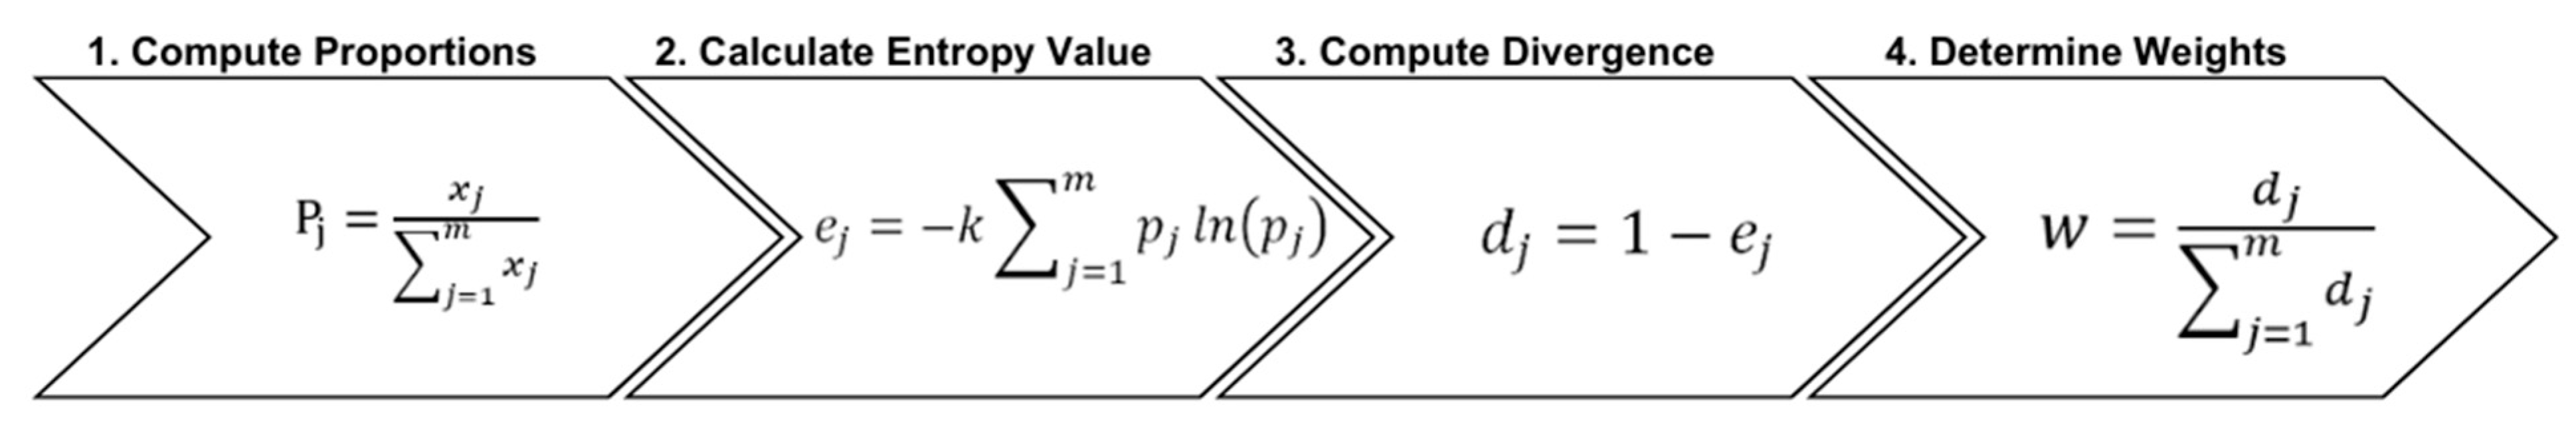
2.2.1. Heat Health Risk Assessment
2.2.2. Heat Stress Assessment
2.3. Coupling HHRI and UTCI
2.4. Hotspots Analysis (Getis-Ord Gi*)
3. Results
3.1. Heat Health Risk Assessment
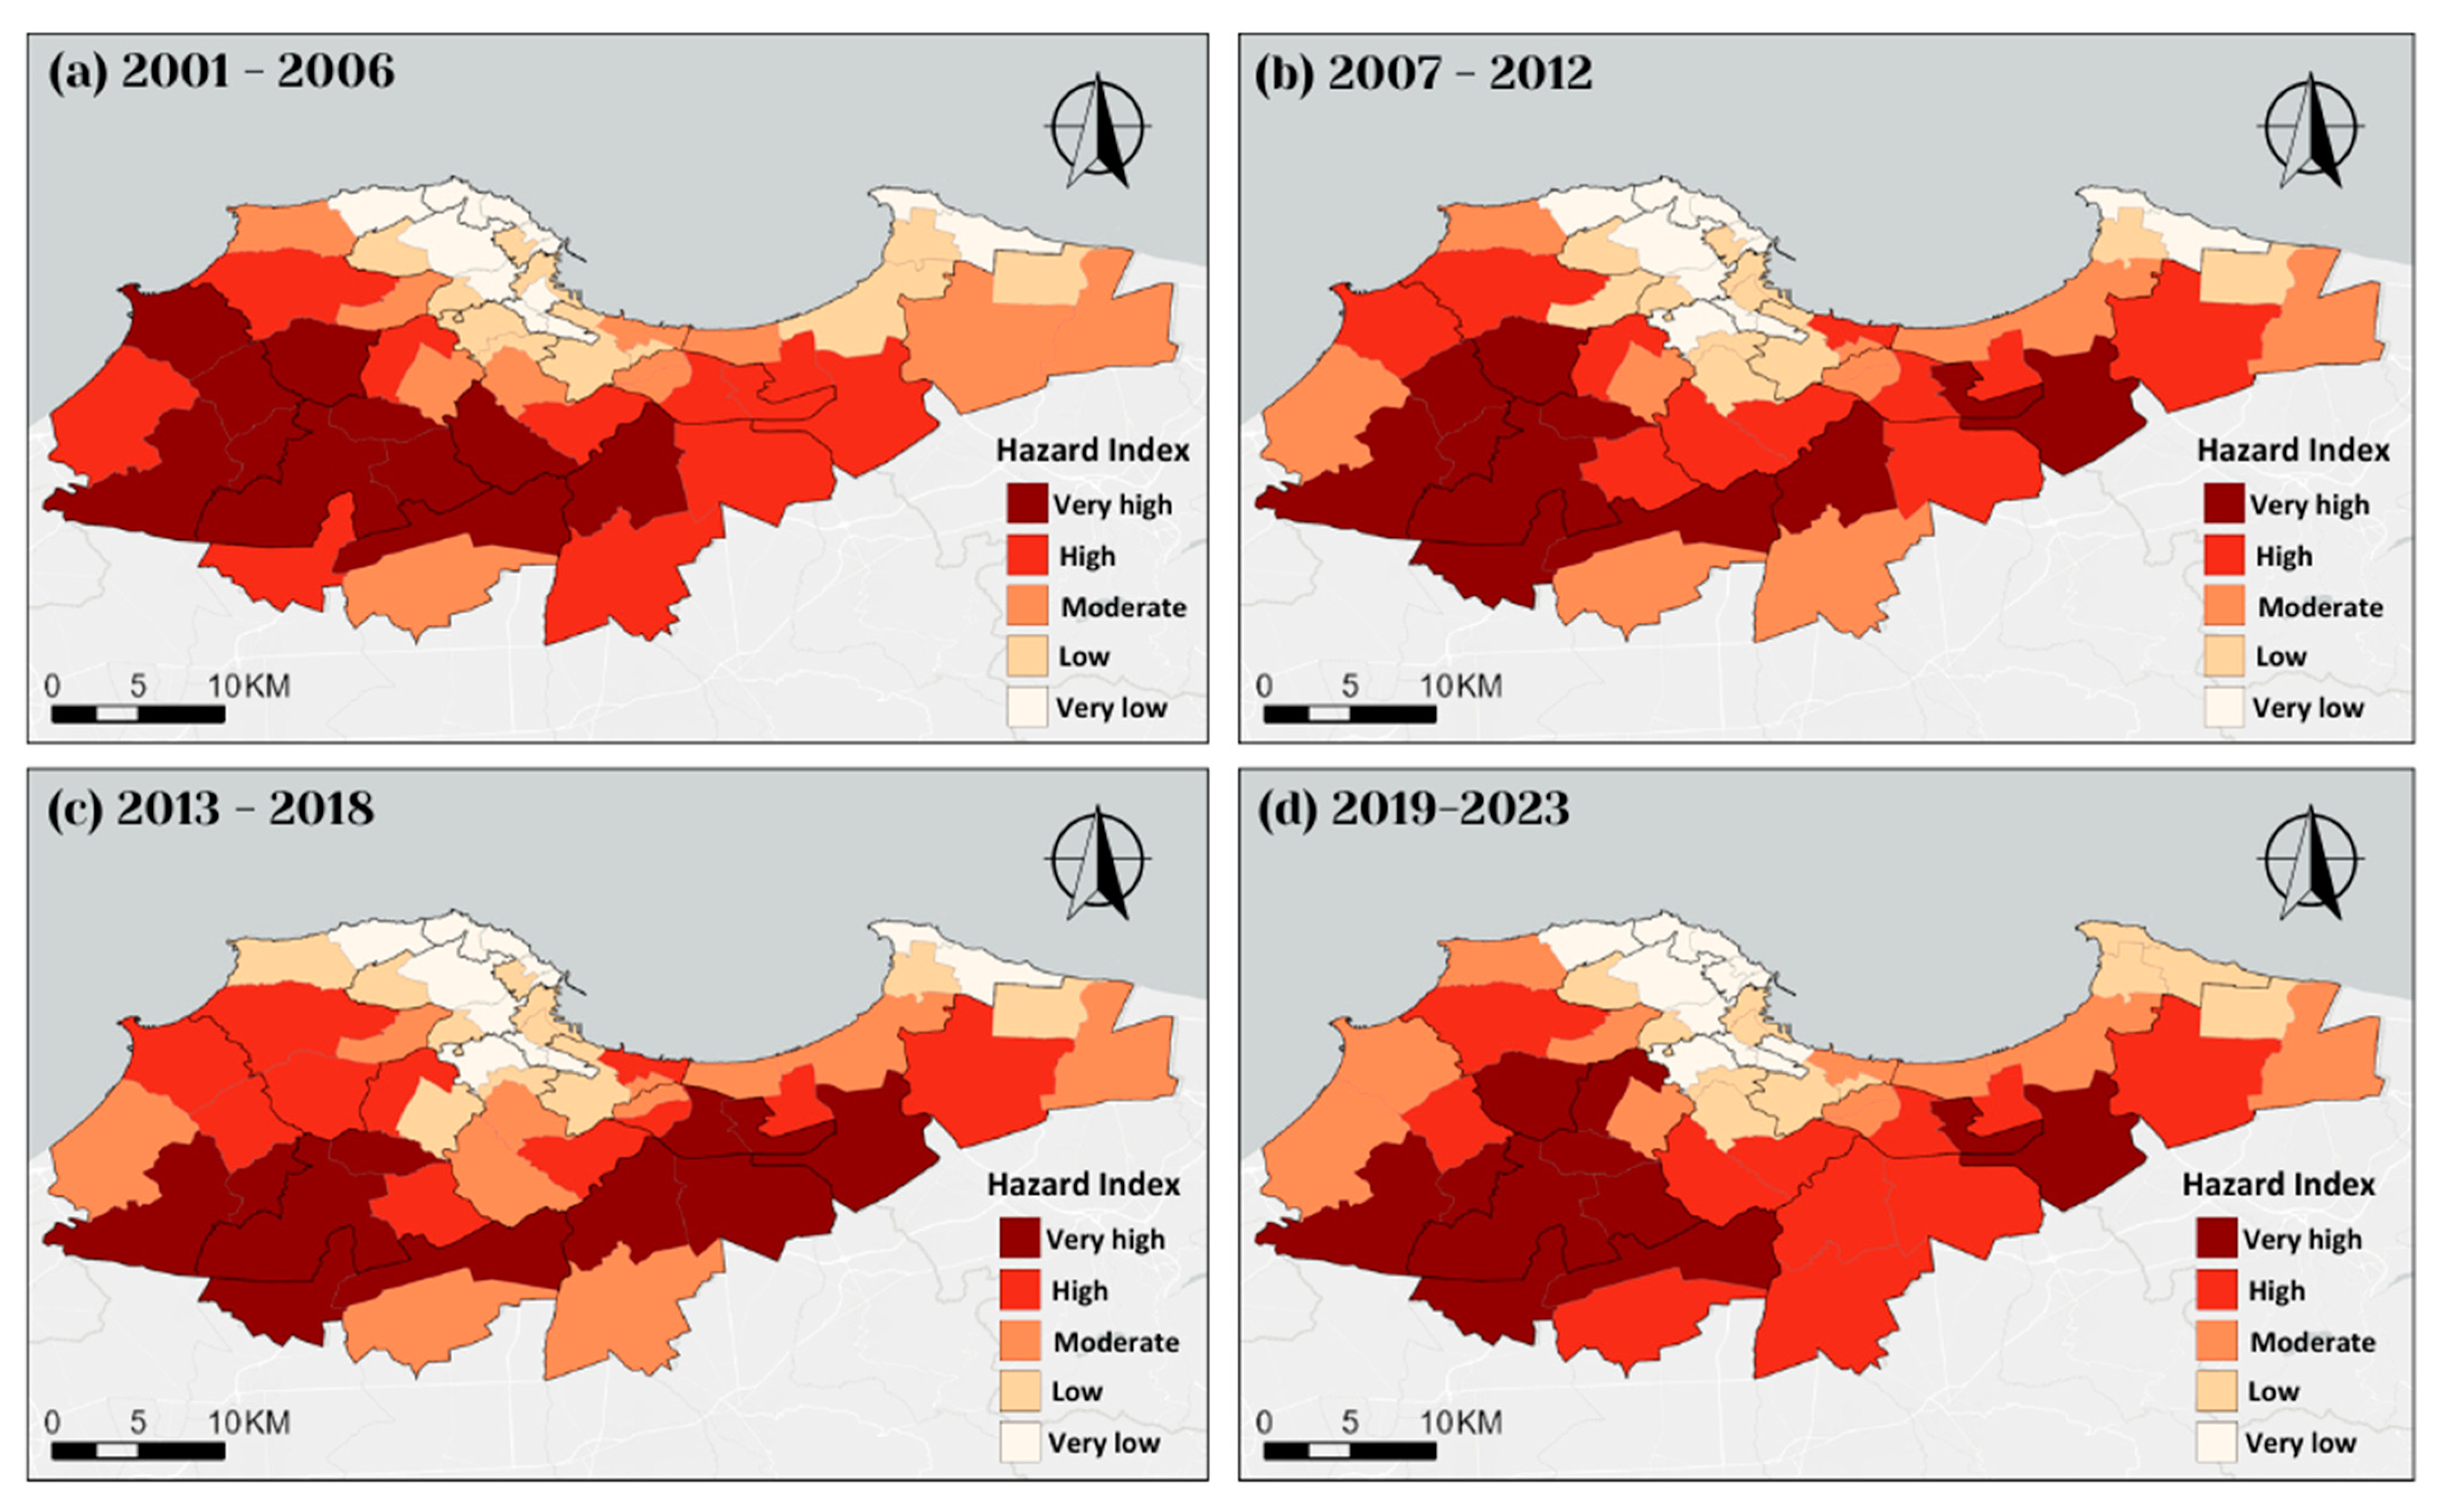
3.1.1. Hazard Index
3.1.2. Exposure Index
3.1.3. Vulnerability Index
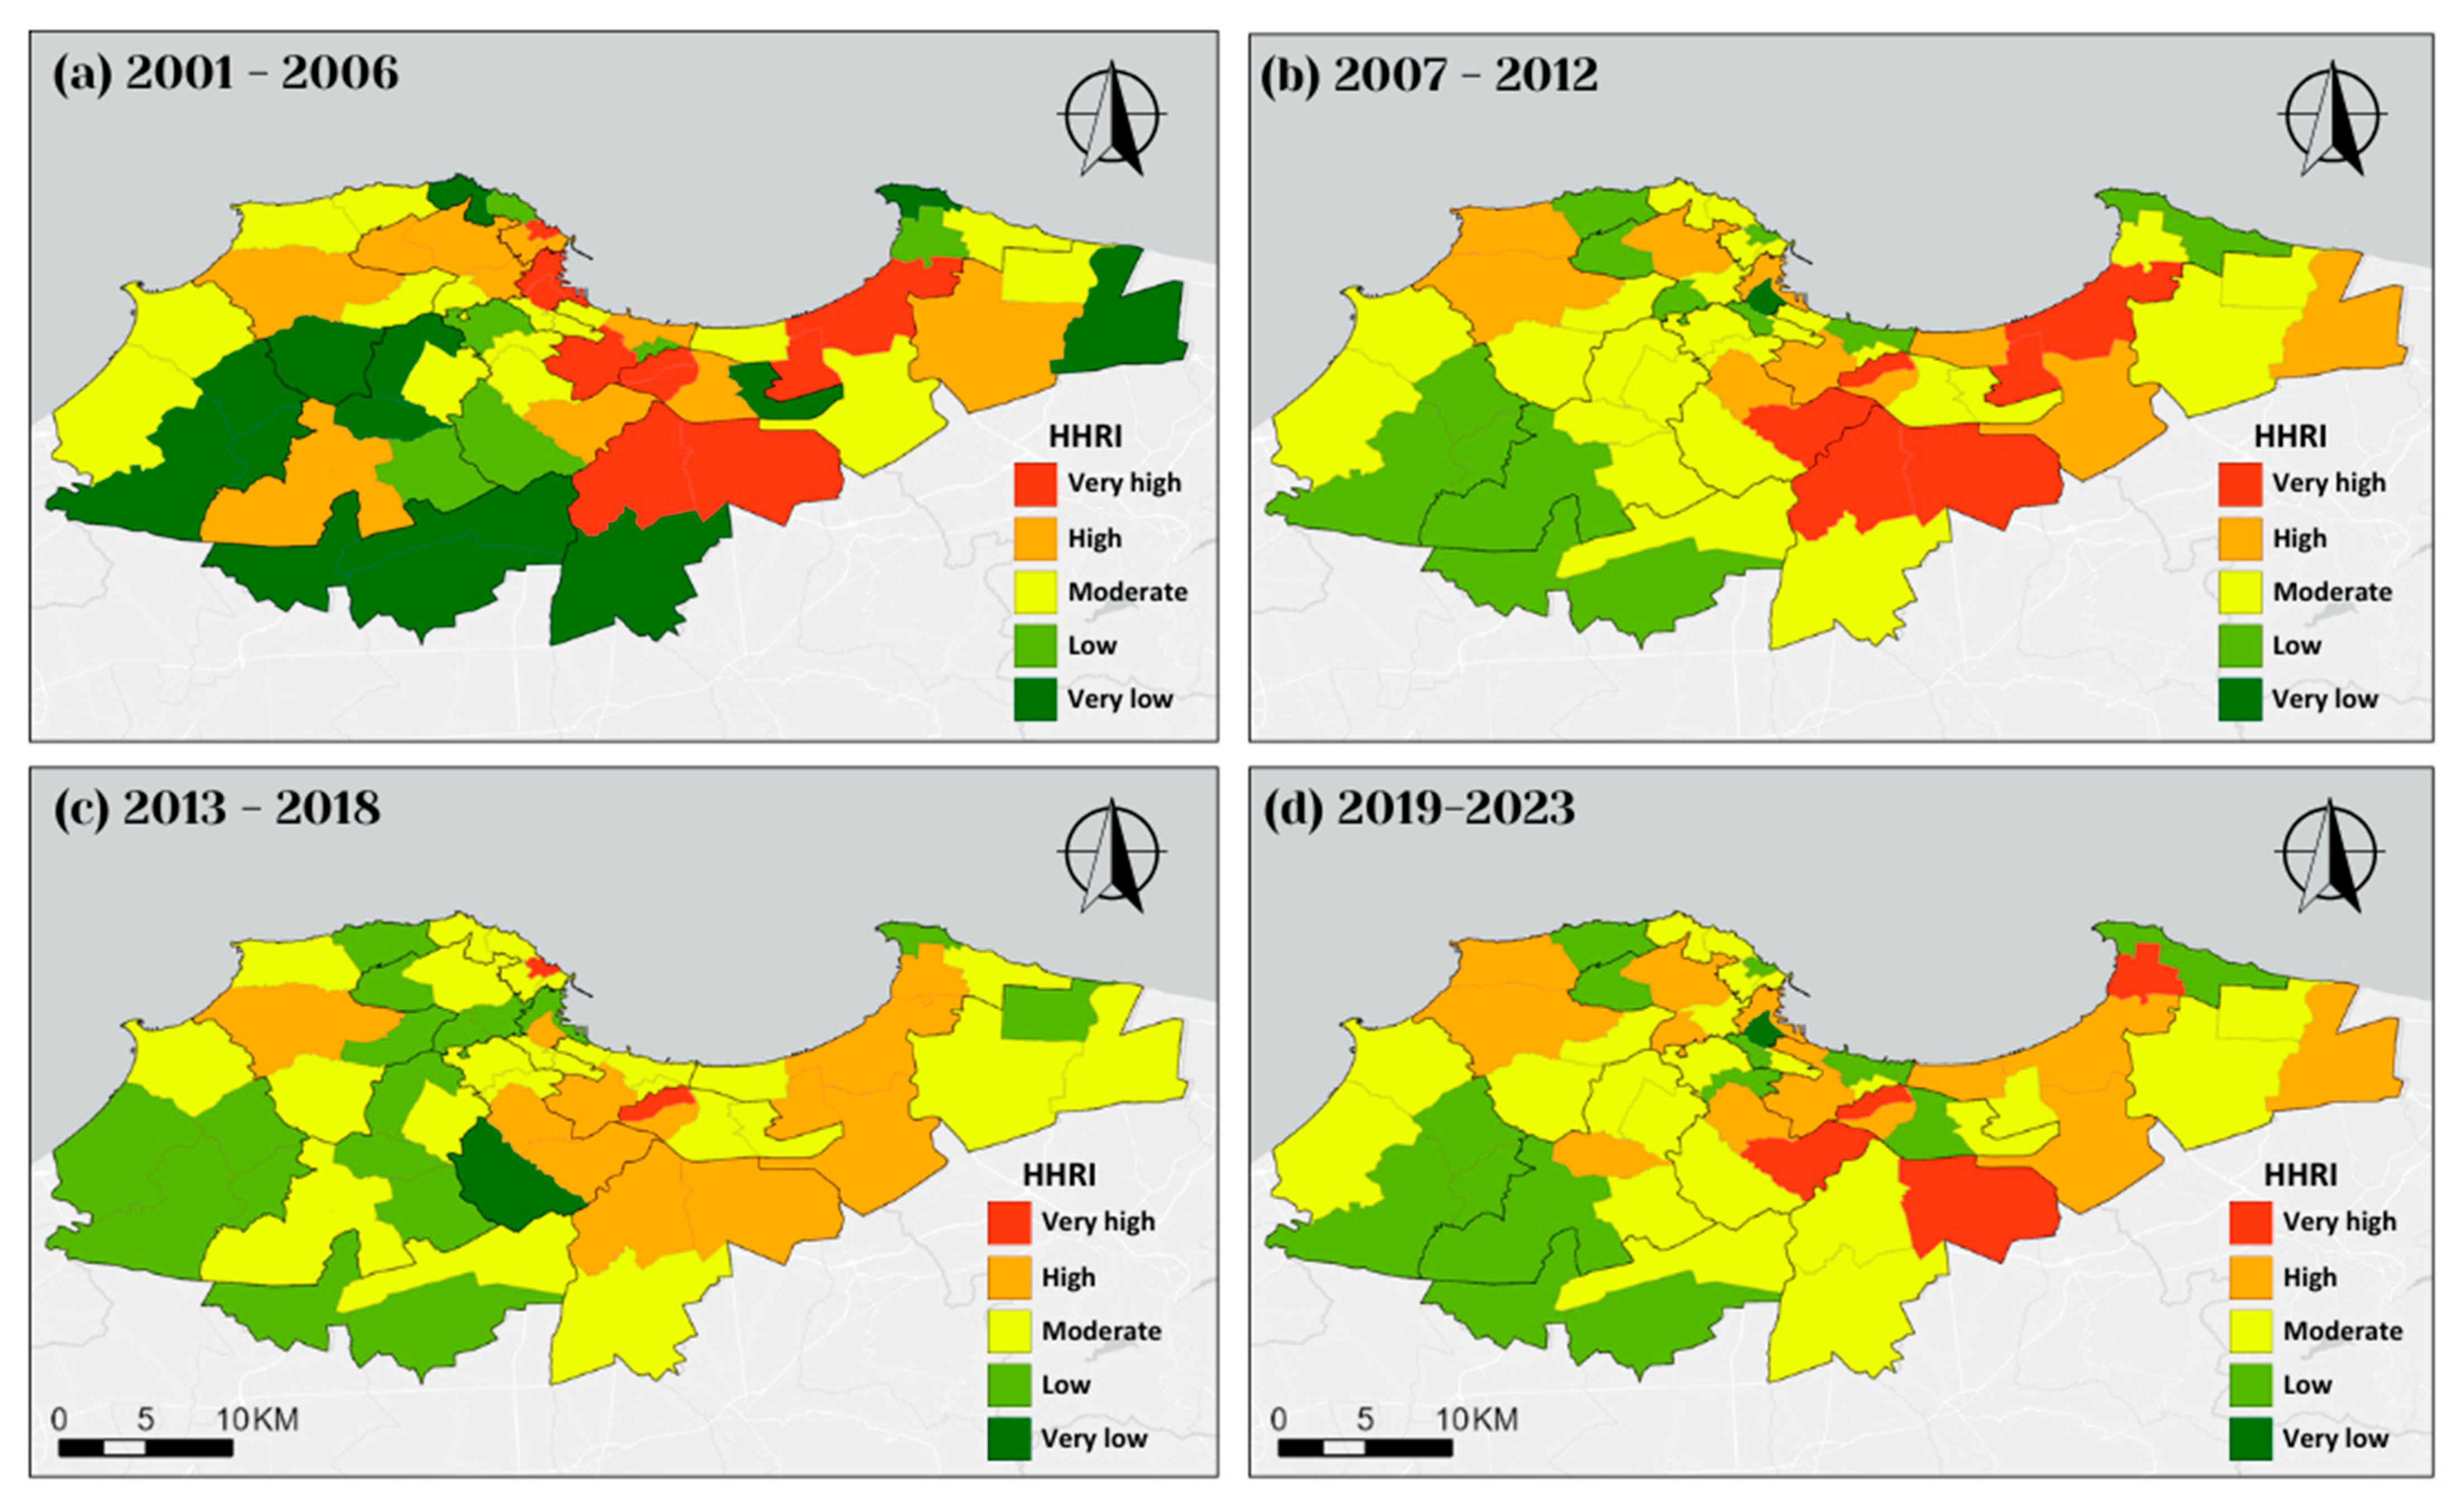
3.1.4. Heat Health Risk Index (HHRI)
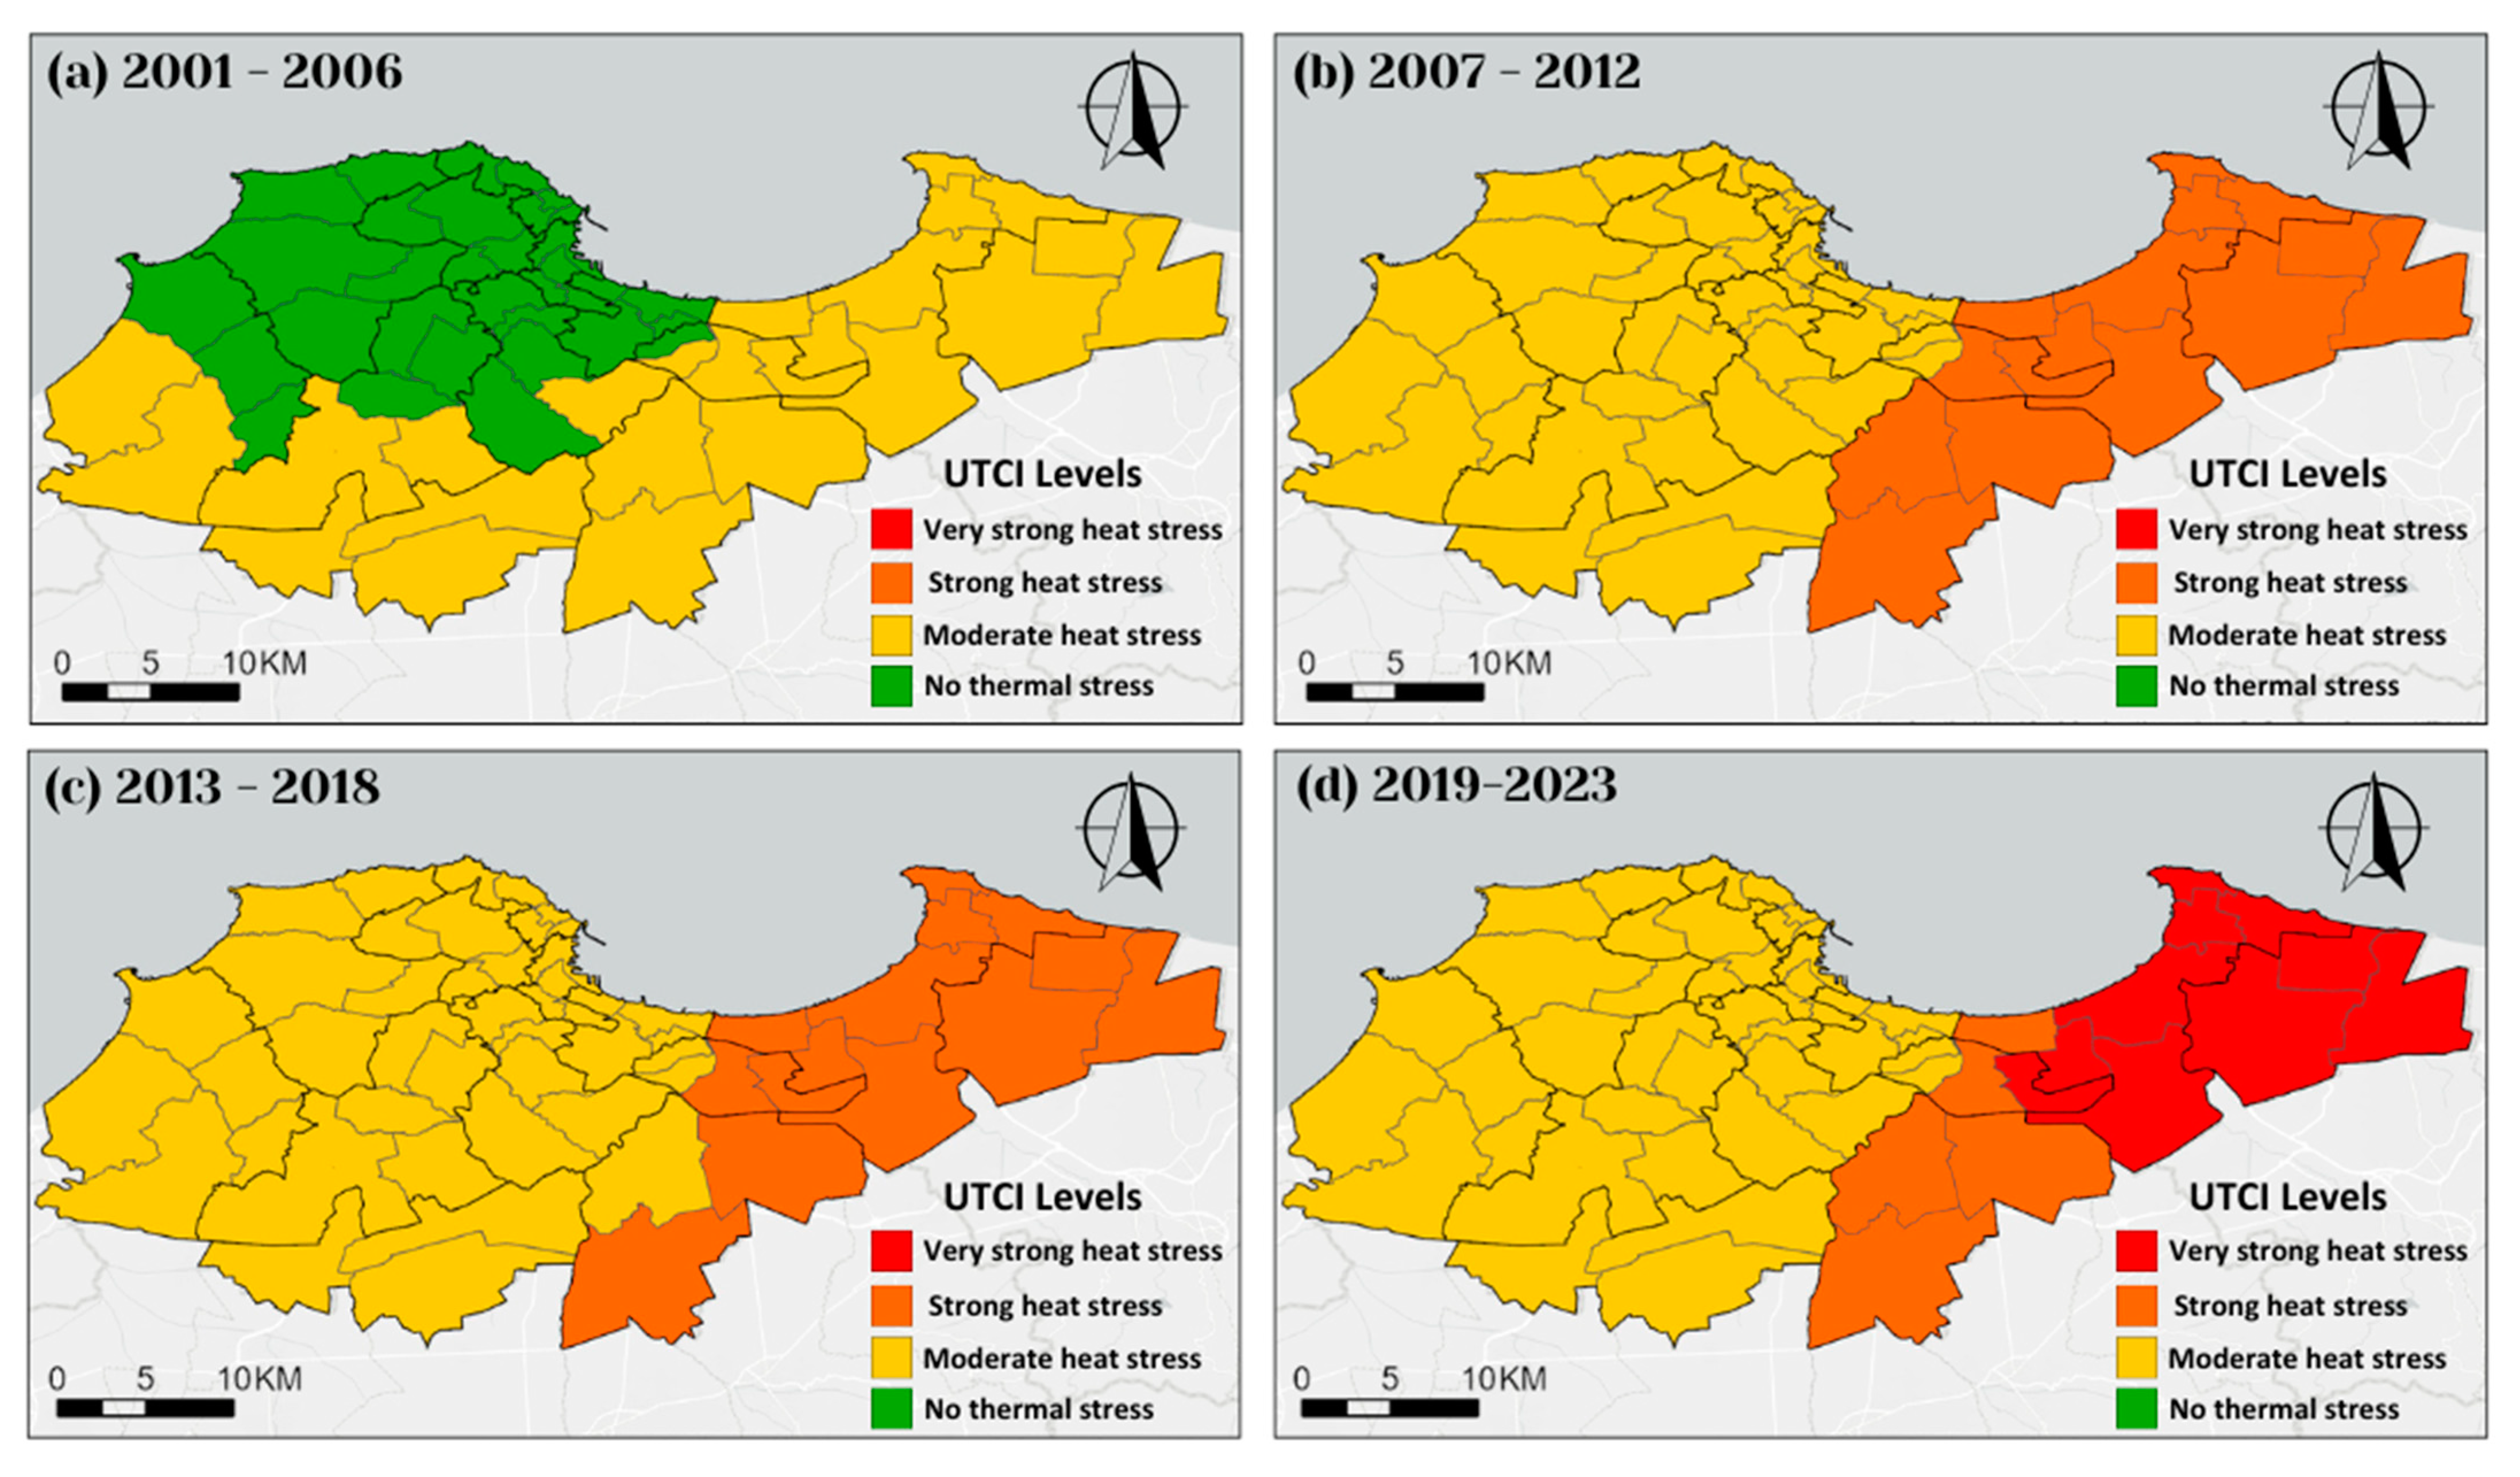
3.2. Universal Thermal Climate Index (UTCI)
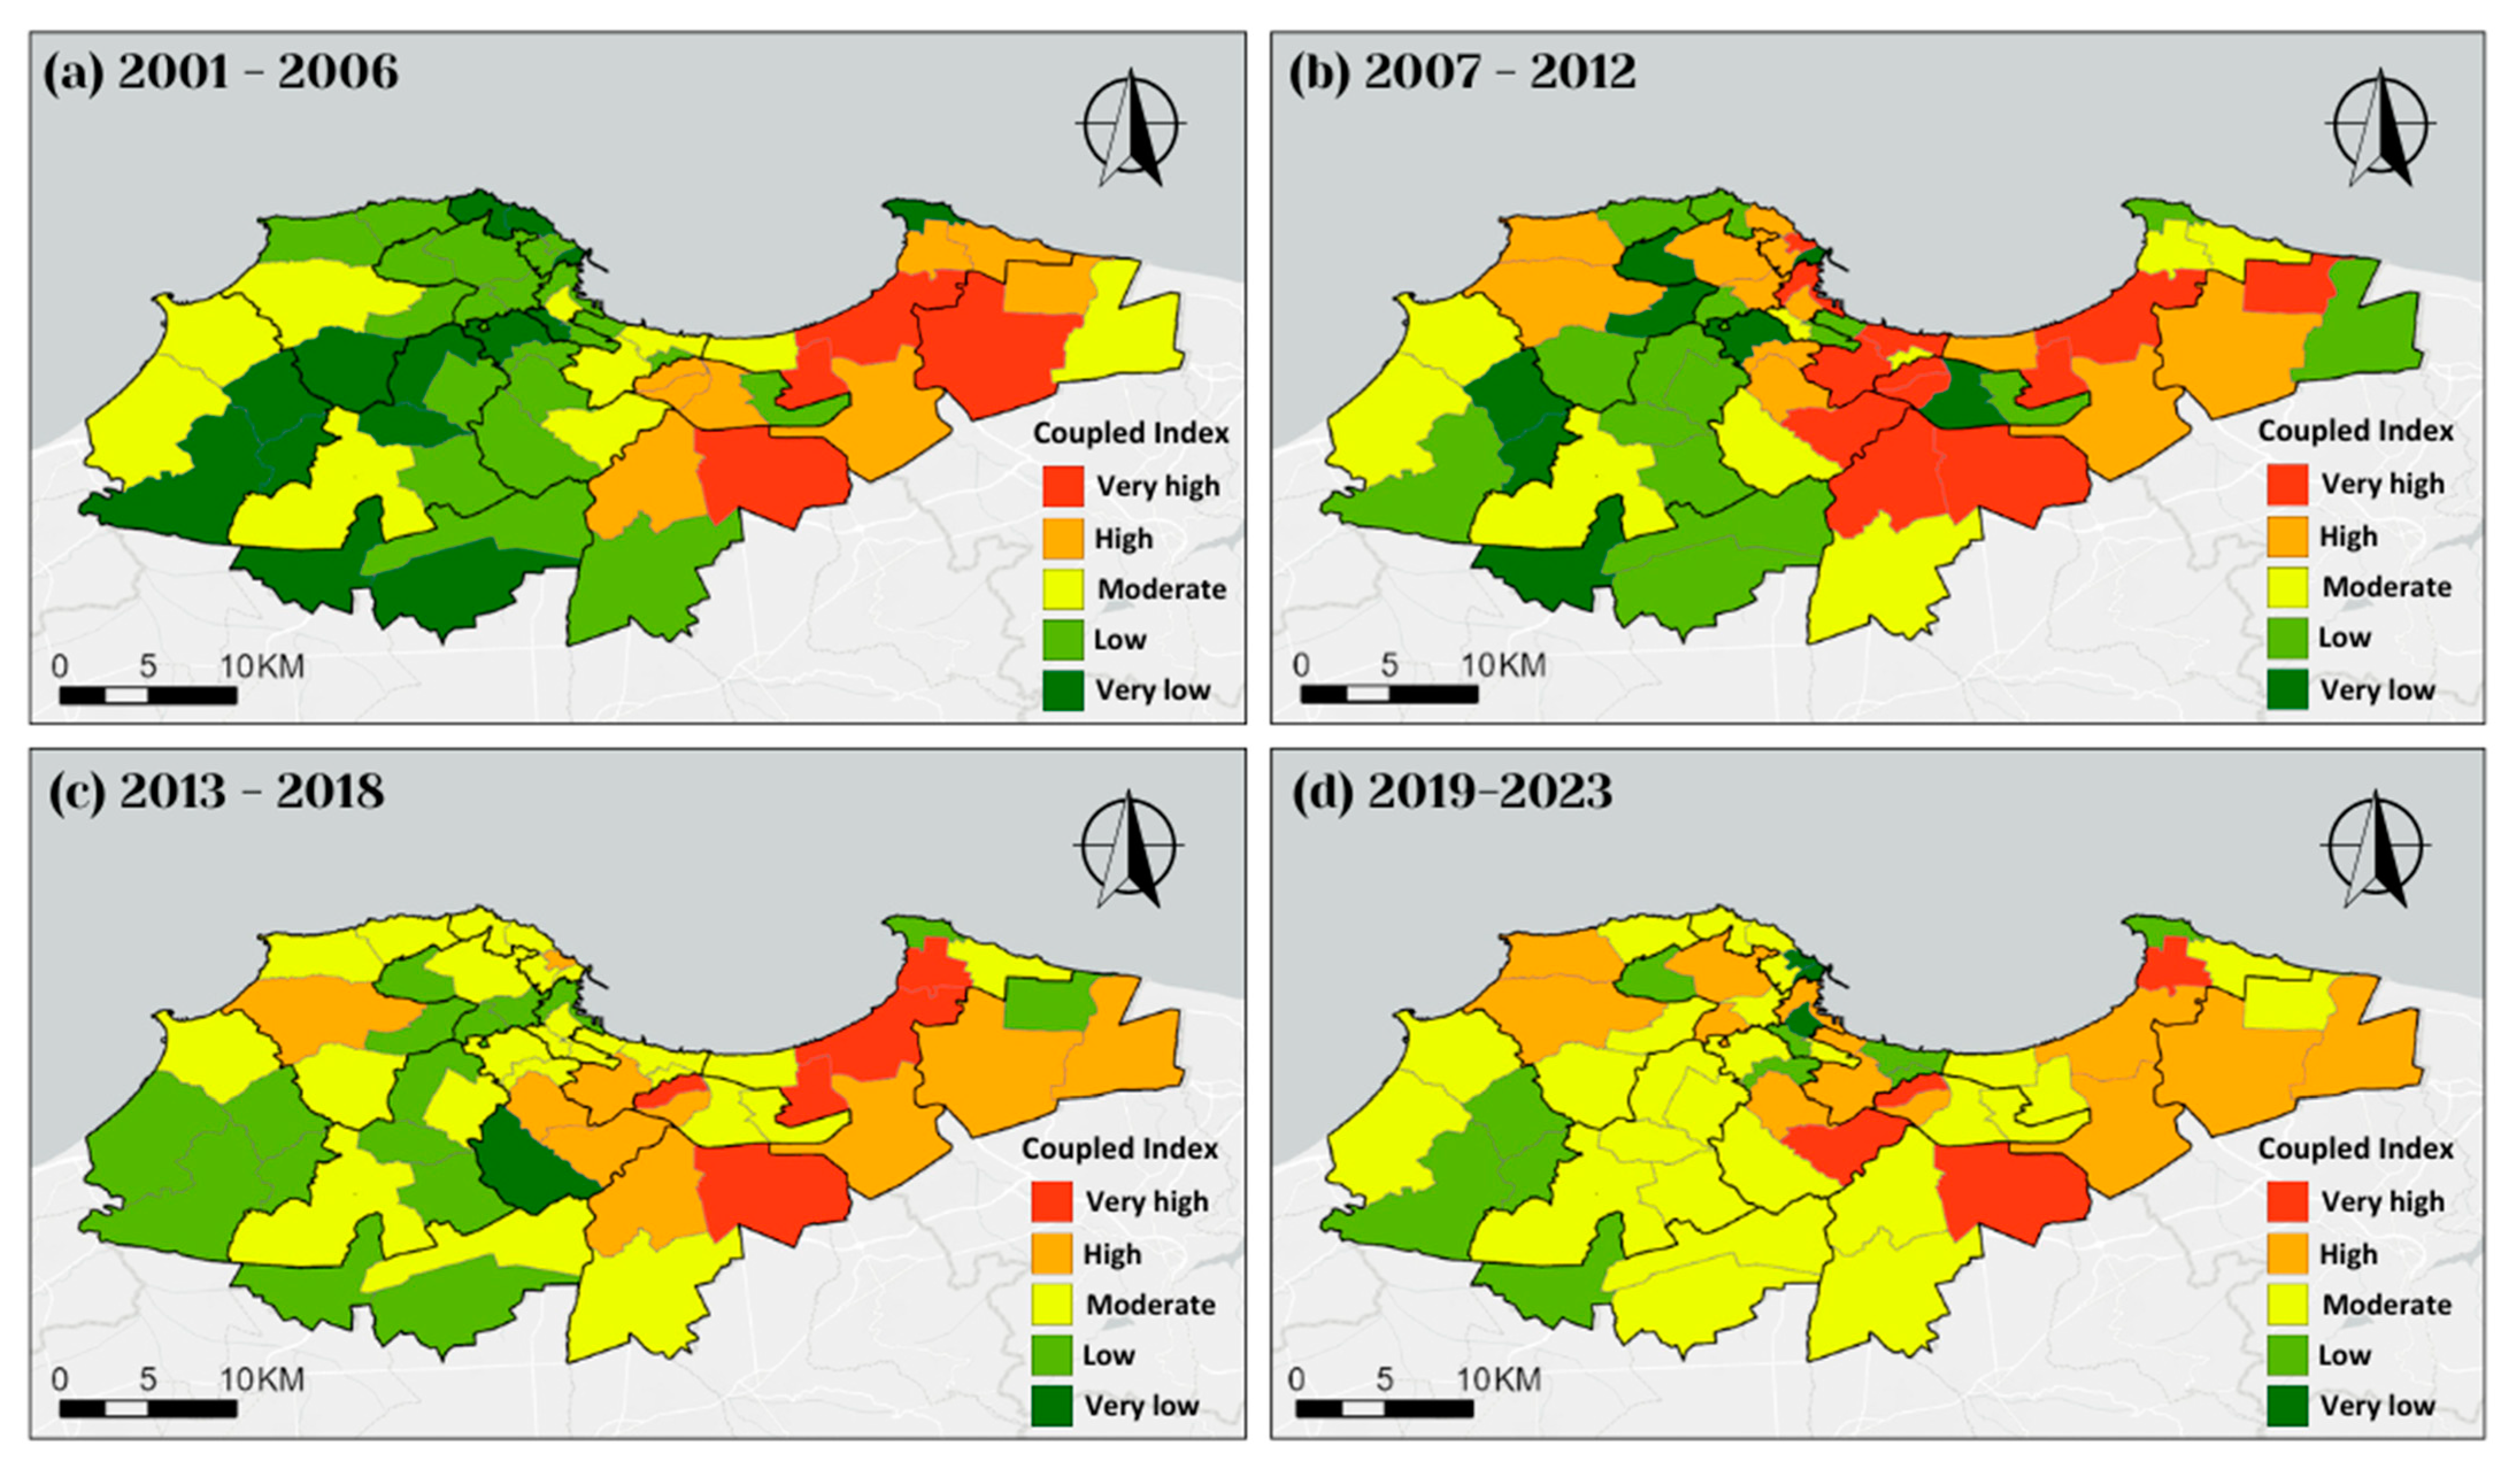
3.3. Coupled Index
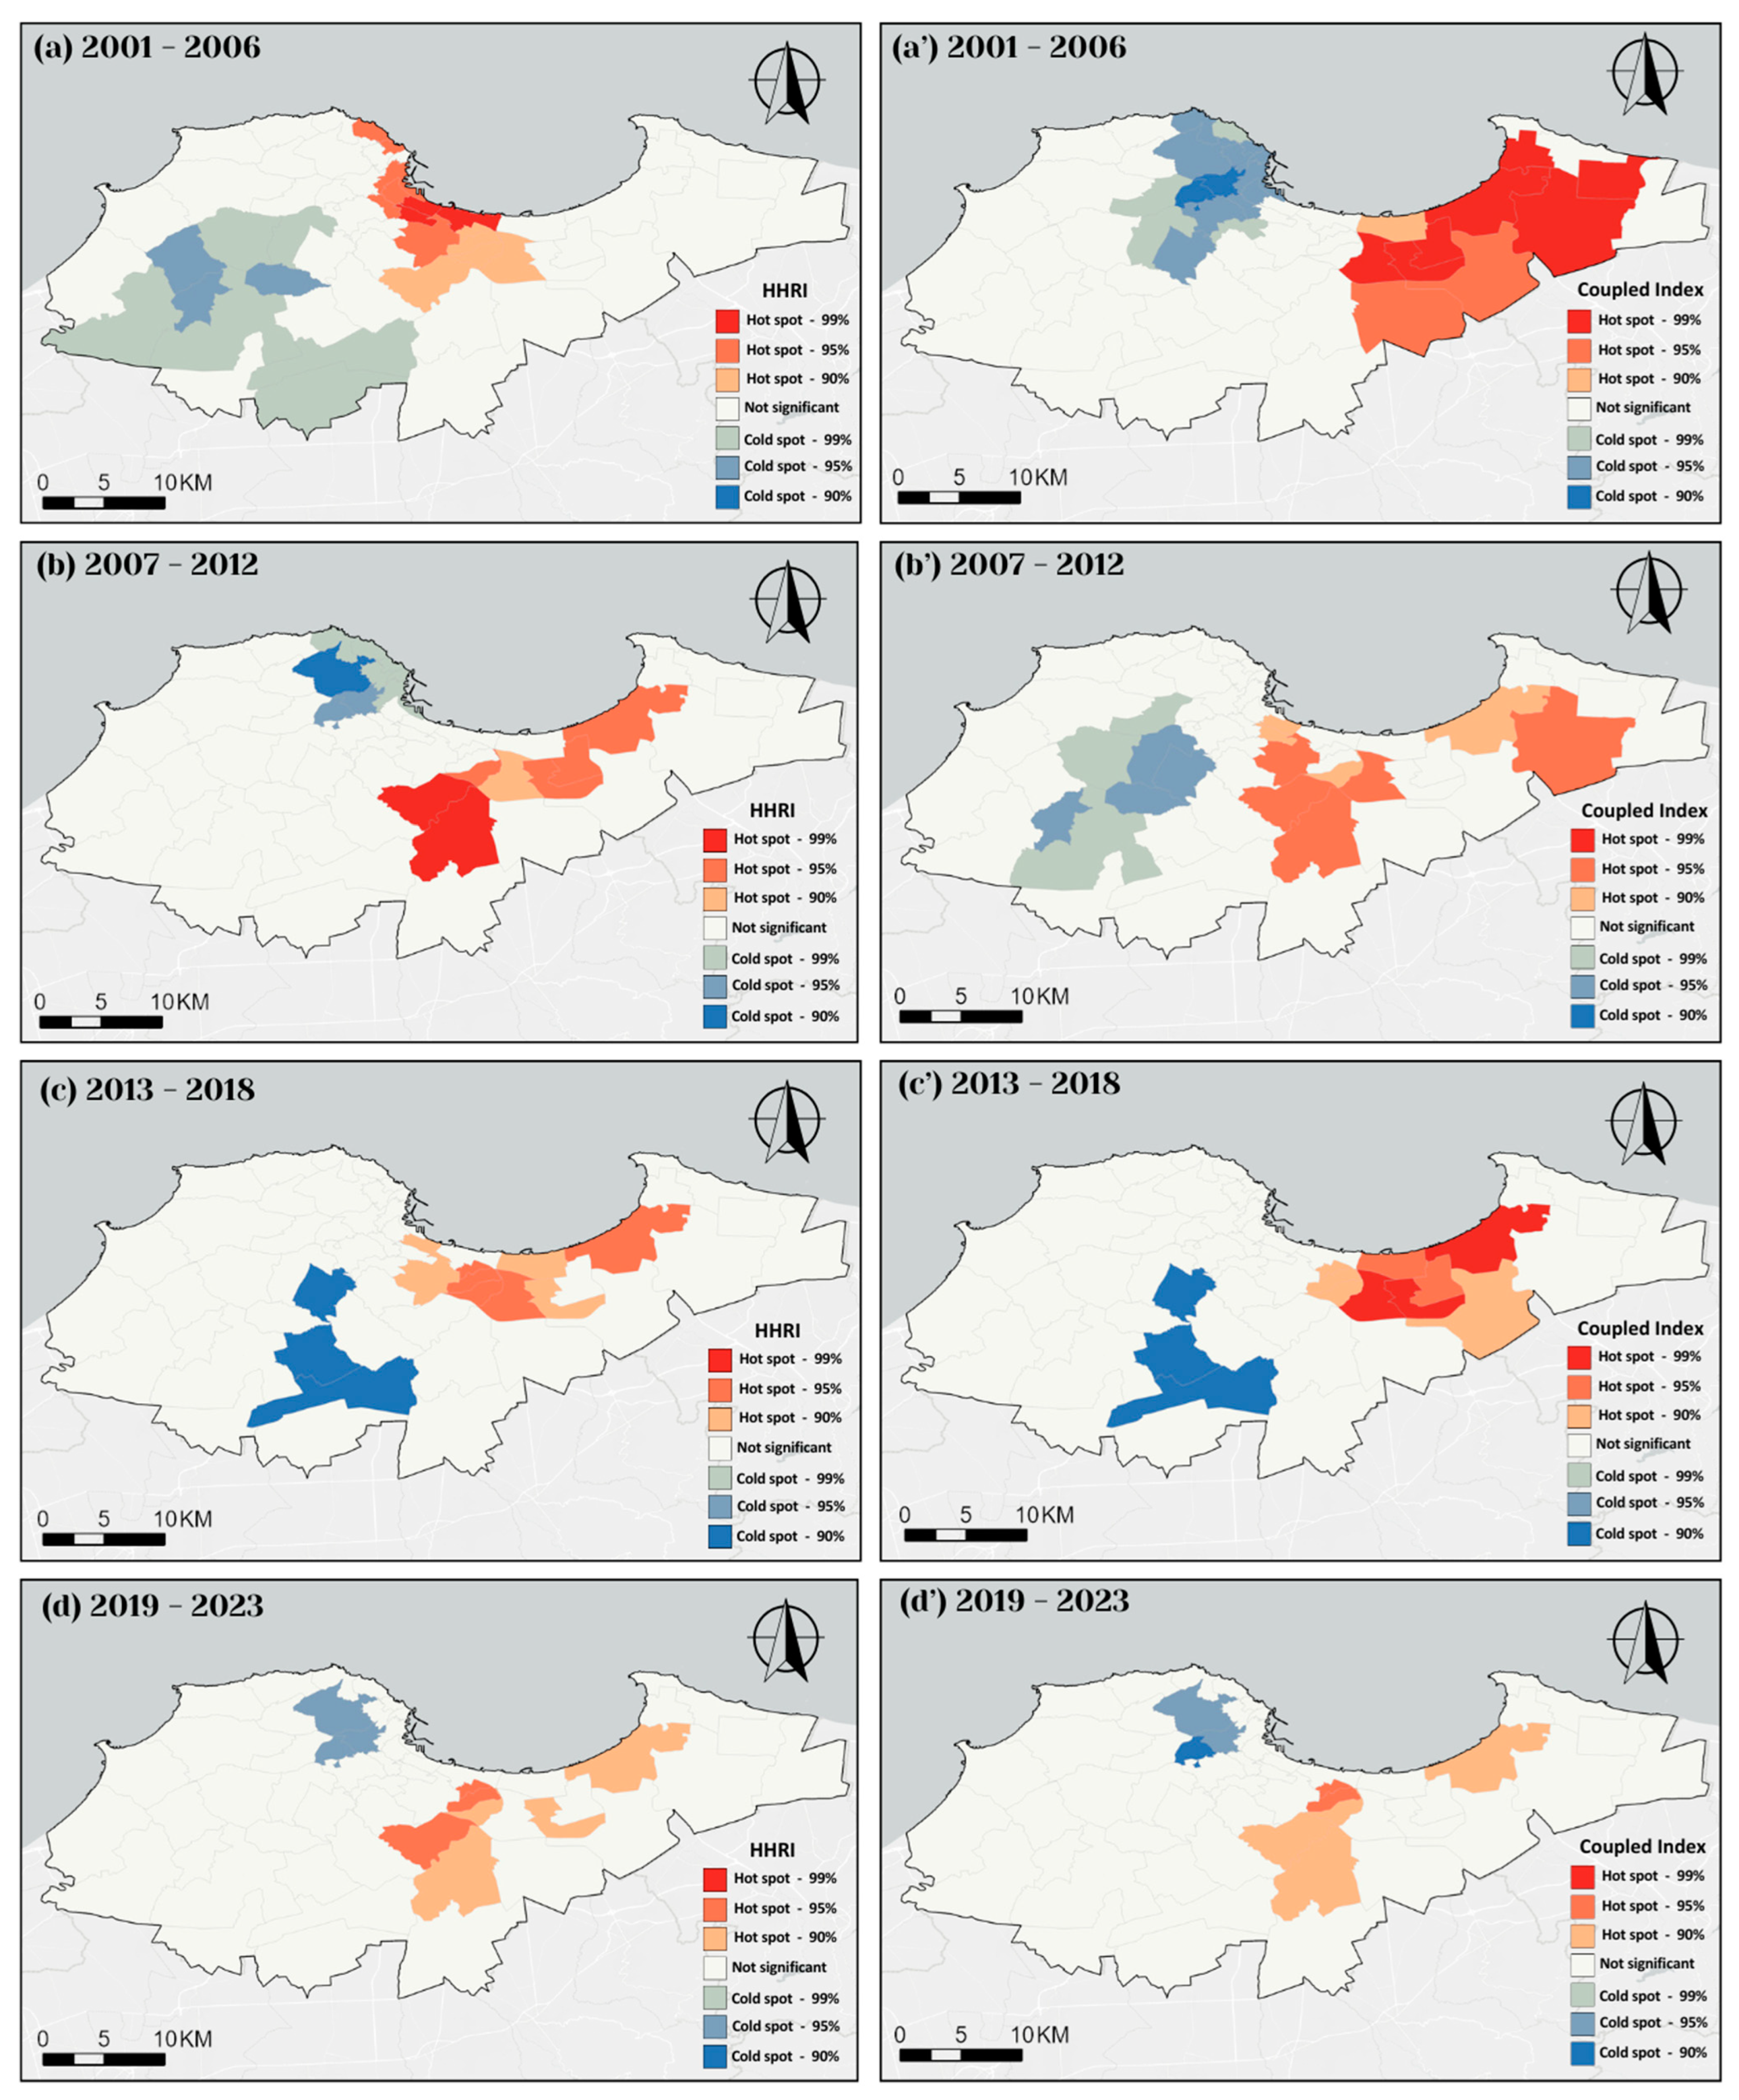
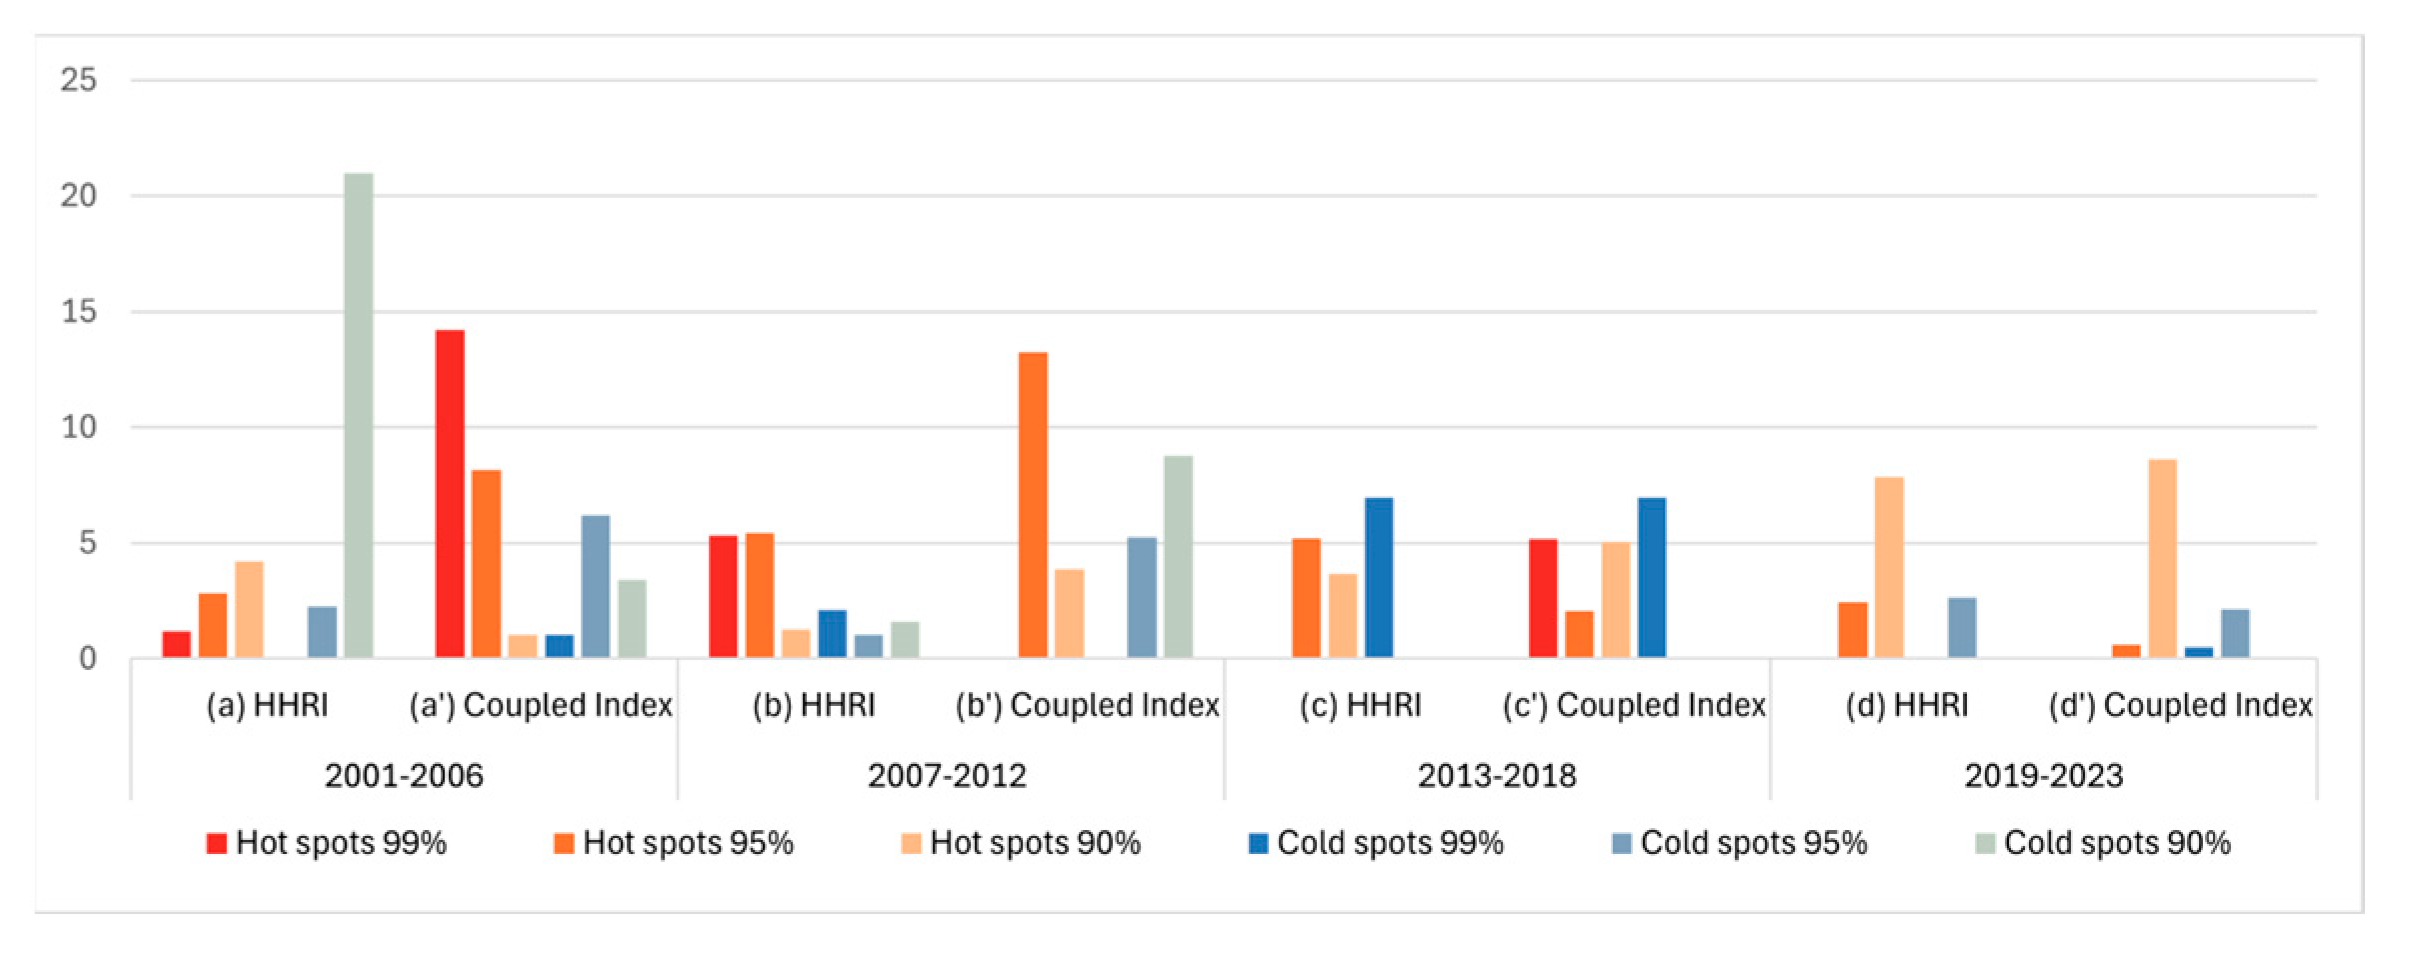
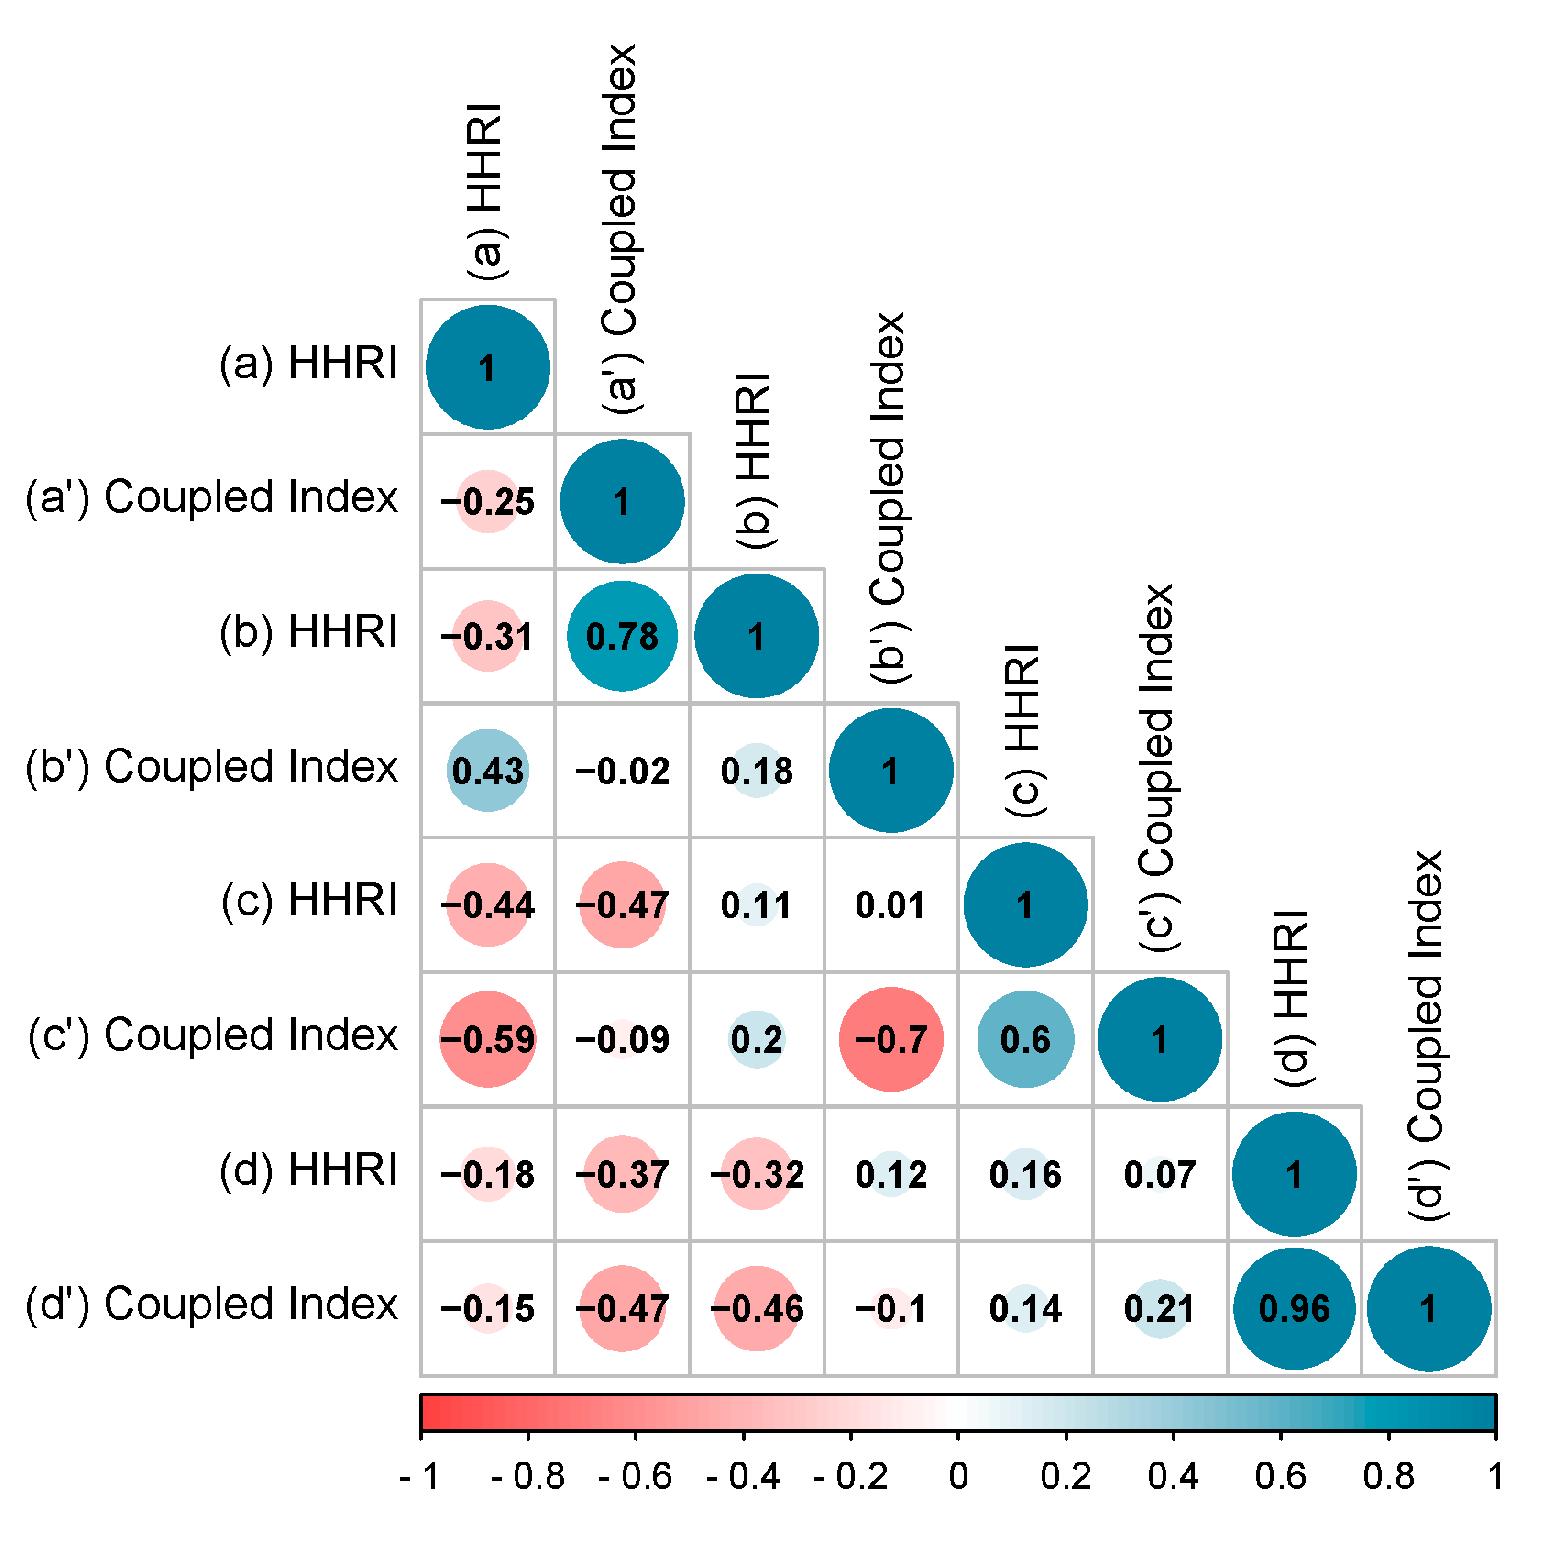
3.4. Hotspots Analysis
4. Discussion
4.1. HHR Assessment
4.2. UTCI Assessment
4.3. Coupled Index Hotspots
4.4. Implications and Recommendations
4.5. Limitations and Future Perspectives of the Study
5. Conclusions
- HHRI showed a significant increase over time, reflecting the growing vulnerability of Algiers to extreme heat events
- UTCI increased in Algiers between 2001 and 2023, reaching the strong heat stress category.
- Coupling HHRI with UTCI enhanced the sensitivity and accuracy of heat-related risk assessment.
- The identification of persistent hotspots and cold spots offers crucial insights for targeted climate resilience interventions in the most vulnerable areas.
Author Contributions
Funding
Institutional Review Board Statement
Informed Consent Statement
Data Availability Statement
Acknowledgments
Conflicts of Interest
Abbreviations
| E | Exposure |
| GIS | Geographic Information System |
| H | Hazard |
| HHRI | Heat Health Risk Index |
| IPCC | Intergovernmental Panel on Climate Change |
| LST | Land Surface Temperature |
| MENA | Middle East and North Africa Region |
| MNDWI | Modified Normalized Difference Water Index |
| MODIS | Moderate Resolution Imaging Spectroradiometer |
| NDBI | Normalized Difference Building Index |
| NDVI | Normalized Difference Vegetation Index |
| NIR | Near Infrared |
| RED | Red Visible Band |
| SWIR | Shortwave Infrared |
| UTCI | Universal Thermal Climate Index |
| V | Vulnerability |
References
- Semahi, S.; Benbouras, M.A.; Mahar, W.A.; Zemmouri, N.; Attia, S. Development of spatial distribution maps for energy demand and thermal comfort estimation in algeria. Sustainability 2020, 12, 6066. [Google Scholar] [CrossRef]
- Di Napoli, C.; McGushin, A.; Romanello, M.; Ayeb-Karlsson, S.; Cai, W.; Chambers, J.; Dasgupta, S.; Escobar, L.E.; Kelman, I.; Kjellstrom, T.; et al. Tracking the impacts of climate change on human health via indicators: Lessons from the Lancet Countdown. BMC Public Health 2022, 22, 1–8. [Google Scholar] [CrossRef] [PubMed]
- Crichton, D. The risk triangle. Nat. Disaster Manag. 1999, 102, 102–103. [Google Scholar]
- IPCC 6th Assessment Report. Available online: https://www.ipcc.ch/assessment-report/ar6/ (accessed on 28 August 2024).
- Di Napoli, C.; Romanello, M.; Minor, K.; Chambers, J.; Dasgupta, S.; Escobar, L.E.; Hang, Y.; Hänninen, R.; Liu, Y.; Batista, M.L.; et al. The role of global reanalyses in climate services for health: Insights from the Lancet Countdown. Meteorol. Appl. 2023, 30, e2122. [Google Scholar] [CrossRef]
- Dong, J.; Peng, J.; He, X.; Corcoran, J.; Qiu, S.; Wang, X. Heatwave-induced human health risk assessment in megacities based on heat stress-social vulnerability-human exposure framework. Landsc. Urban. Plan. 2020, 203, 103907. [Google Scholar] [CrossRef]
- Sun, H.; Chen, Y.; Li, K.; Gao, S. Spatio-temporal assessment of heat health risk in Chinese metropolitan cities based on the modified multi-indicators coupled risk framework. Sustain. Cities Soc. 2024, 108, 105451. [Google Scholar] [CrossRef]
- Wu, H.; Xu, Y.; Zhang, M.; Su, L.; Wang, Y.; Zhu, S. Spatially explicit assessment of the heat-related health risk in the Yangtze River Delta, China, using multisource remote sensing and socioeconomic data. Sustain. Cities Soc. 2024, 104, 105300. [Google Scholar] [CrossRef]
- Wu, H.; Zhao, C.; Zhu, Y.; Pan, Y. A multiscale examination of heat health risk inequality and its drivers in mega-urban agglomeration: A case study in the Yangtze River Delta, China. J. Clean. Prod. 2024, 458, 142528. [Google Scholar] [CrossRef]
- Ye, J.; Yang, F. Towards multi-scale and context-specific heat health risk assessment—A systematic review. Sustain. Cities Soc. 2025, 119, 106102. [Google Scholar] [CrossRef]
- Baqa, M.F.; Lu, L.; Guo, H.; Song, X.; Alavipanah, S.K.; Nawaz-Ul-Huda, S.; Li, Q.; Chen, F. Investigating heat-related health risks related to local climate zones using SDGSAT-1 high-resolution thermal infrared imagery in an arid megacity. Int. J. Appl. Earth Obs. Geoinf. 2025, 136, 104334. [Google Scholar] [CrossRef]
- Tomlinson, C.J.; Chapman, L.; E Thornes, J.; Baker, C.J. Including the urban heat island in spatial heat health risk assessment strategies: A case study for Birmingham, UK. Int. J. Health Geogr. 2011, 10, 42. [Google Scholar] [CrossRef] [PubMed]
- Hu, K.; Yang, X.; Zhong, J.; Fei, F.; Qi, J. Spatially Explicit Mapping of Heat Health Risk Utilizing Environmental and Socioeconomic Data. Environ. Sci. Technol. 2017, 51, 1498–1507. [Google Scholar] [CrossRef] [PubMed]
- Chen, Q.; Ding, M.; Yang, X.; Hu, K.; Qi, J. Spatially explicit assessment of heat health risk by using multi-sensor remote sensing images and socioeconomic data in Yangtze River Delta, China. Int. J. Health Geogr. 2018, 17, 1–15. [Google Scholar] [CrossRef]
- Zha, F.; Lu, L.; Wang, R.; Zhang, S.; Cao, S.; Baqa, M.F.; Li, Q.; Chen, F. Understanding fine-scale heat health risks and the role of green infrastructure based on remote sensing and socioeconomic data in the megacity of Beijing, China. Ecol. Indic. 2024, 160, 111847. [Google Scholar] [CrossRef]
- Zhang, W.; Zheng, C.; Chen, F. Mapping heat-related health risks of elderly citizens in mountainous area: A case study of Chongqing, China. Sci. Total. Environ. 2019, 663, 852–866. [Google Scholar] [CrossRef]
- Estoque, R.C.; Ooba, M.; Seposo, X.T.; Togawa, T.; Hijioka, Y.; Takahashi, K.; Nakamura, S. Heat health risk assessment in Philippine cities using remotely sensed data and social-ecological indicators. Nat. Commun. 2020, 11, 1581. [Google Scholar] [CrossRef] [PubMed]
- Zhu, W.; Yuan, C. Urban heat health risk assessment in Singapore to support resilient urban design—By integrating urban heat and the distribution of the elderly population. Cities 2023, 132, 104103. [Google Scholar] [CrossRef]
- Wang, S.; Sun, Q.C.; Huang, X.; Tao, Y.; Dong, C.; Das, S.; Liu, Y. Health-integrated heat risk assessment in Australian cities. Environ. Impact Assess. Rev. 2023, 102, 107176. [Google Scholar] [CrossRef]
- Wang, C.; Ren, Z.; Guo, Y.; Zhang, P.; Hong, S.; Ma, Z.; Hong, W.; Wang, X. Assessing urban population exposure risk to extreme heat: Patterns, trends, and implications for climate resilience in China (2000–2020). Sustain. Cities Soc. 2024, 103, 105260. [Google Scholar] [CrossRef]
- Zhang, C.; Yang, Y.; Yu, L. Assessing urban surface thermal environment and heat health risk in Chinese cities: A twenty-year study. Urban Clim. 2025, 59, 102304. [Google Scholar] [CrossRef]
- McGregor, G.R.; Vanos, J.K. Heat: A primer for public health researchers. Public Health 2018, 161, 138–146. [Google Scholar] [CrossRef] [PubMed]
- Crimmins, A.; Balbus, J.; Gamble, J.L.; Beard, C.B.; Bell, J.E.; Dodgen, D.; Eisen, R.J.; Fann, N.; Hawkins, M.D.; Herring, S.C. The Impacts of Climate Change on Human Health in the United States: A Scientific Assessment. 2016. Available online: http://www.preventionweb.net/publication/impacts-climate-change-human-health-united-states-scientific-assessment (accessed on 28 August 2024).
- Bröde, P.; Błazejczyk, K.; Fiala, D.; Havenith, G.; Holmér, I.; Jendritzky, G.; Kuklane, K.; Kampmann, B. The universal thermal climate index UTCI compared to ergonomics standards for assessing the thermal environment. Ind. Health 2013, 51, 16–24. [Google Scholar] [CrossRef] [PubMed]
- Hu, J.; Zhou, Y.; Yang, Y.; Chen, G.; Chen, W.; Hejazi, M. Multi-city assessments of human exposure to extreme heat during heat waves in the United States. Remote Sens. Environ. 2023, 295, 113700. [Google Scholar] [CrossRef]
- Mahia, L.; Berkouk, D.; Bouzir, T.A.K.; Pigliautile, I.; Pisello, A.L. Investigating the Relationship between Spatial Morphology, Meteorological Factors, and Elderly People Responses in a Traditional Algerian Village, Sustain. Cities Soc. 2025, 121, 106212. [Google Scholar] [CrossRef]
- Bröde, P.; Fiala, D.; Błażejczyk, K.; Holmér, I.; Jendritzky, G.; Kampmann, B.; Tinz, B.; Havenith, G. Deriving the operational procedure for the Universal Thermal Climate Index (UTCI). Int. J. Biometeorol. 2012, 56, 481–494. [Google Scholar] [CrossRef]
- Coccolo, S.; Kämpf, J.; Scartezzini, J.-L.; Pearlmutter, D. Outdoor human comfort and thermal stress: A comprehensive review on models and standards. Urban Clim. 2016, 18, 33–57. [Google Scholar] [CrossRef]
- Lewis, S.C.; King, A.D.; Perkins-Kirkpatrick, S.E.; Mitchell, D.M. Regional hotspots of temperature extremes under 1.5 °C and 2 °C of global mean warming. Weather. Clim. Extrem. 2019, 26, 100233. [Google Scholar] [CrossRef]
- Wedler, M.; Pinto, J.G.; Hochman, A. More frequent, persistent, and deadly heat waves in the 21st century over the Eastern Mediterranean. Sci. Total Environ. 2023, 870, 161883. [Google Scholar] [CrossRef]
- Ali, E.; Cramer, W.; Georgopoulou, E.; Hilmi, N.J.M.; Le Cozannet, G.; Lionello, P. Cross-Chapter Paper 4: Mediterranean Region. In Climate Change 2022: Impacts, Adaptation and Vulnerability. Contribution of Working Group II to the Sixth Assessment Report of the Intergovernmental Panel on Climate Change; Cambridge University Press: Cambridge, UK, 2022. [Google Scholar] [CrossRef]
- Hajat, S.; Proestos, Y.; Araya-Lopez, J.-L.; Economou, T.; Lelieveld, J. Current and future trends in heat-related mortality in the MENA region: A health impact assessment with bias-adjusted statistically downscaled CMIP6 (SSP-based) data and Bayesian inference. Lancet Planet. Health 2023, 7, e282–e290. [Google Scholar] [CrossRef]
- GFDRR. Global Facility for Disaster Reduction and Recovery (GFDRR). 2024. Available online: https://www.gfdrr.org/en (accessed on 11 September 2024).
- Philip, S.; Kew, S.; Vautard, R.; Vahlberg, M.; Singh, R.; Driouech, F.; Lguensat, R.; Barnes, C.; Otto, F. Extreme April Heat in Spain, Portugal, Morocco & Algeria Almost Impossible Without Climate Change. 2023 (pp. 1–11). Available online: http://hdl.handle.net/10044/1/103833 (accessed on 28 August 2024).
- Zitouni, D.C.; Berkouk, D.; Matallah, M.E.; Attia, S. Dataset for Heat Health Risk and Thermal Comfort Assessment in Algiers (2001–2023). Harv. Dataverse 2024. [Google Scholar] [CrossRef]
- Esri. ArcGis Pro. 2023. Available online: https://www.esri.com/fr-fr/arcgis/products/arcgis-pro/overview (accessed on 20 December 2024).
- Ma, L.; Huang, G.; Johnson, B.A.; Chen, Z.; Li, M.; Yan, Z.; Zhan, W.; Lu, H.; He, W.; Lian, D. Investigating urban heat-related health risks based on local climate zones: A case study of Changzhou in China. Sustain. Cities Soc. 2023, 91, 104402. [Google Scholar] [CrossRef]
- Dong, W.; Liu, Z.; Zhang, L.; Tang, Q.; Liao, H.; Li, X. Assessing Heat Health Risk for Sustainability in Beijing’s Urban Heat Island. Sustainability 2014, 6, 7334–7357. [Google Scholar] [CrossRef]
- Huang, H.; Ma, J.; Yang, Y. Spatial heterogeneity of driving factors for urban heat health risk in Chongqing, China: A new identification method and proposal of planning response framework. Ecol. Indic. 2023, 153, 110449. [Google Scholar] [CrossRef]
- Pramanik, S.; Punia, M.; Yu, H.; Chakraborty, S. Is dense or sprawl growth more prone to heat-related health risks? Spatial regression-based study in Delhi, India. Sustain. Cities Soc. 2022, 81, 103808. [Google Scholar] [CrossRef]
- Hua, J.; Zhang, X.; Ren, C.; Shi, Y.; Lee, T.-C. Spatiotemporal assessment of extreme heat risk for high-density cities: A case study of Hong Kong from 2006 to 2016. Sustain. Cities Soc. 2021, 64, 102507. [Google Scholar] [CrossRef]
- Mahia, L.; Berkouk, D.; Bouzir, T.A.K.; Pigliautile, I.; Pisello, A.L. Exploring the Relationship between Elderly Women Responses, Multi-domain Factors, and Street Geometry Indicators: A Case Study in a Mediterranean Context. Build. Environ. 2025, 273, 112647. [Google Scholar] [CrossRef]
- USGS. Earth Explorer. 2024. Available online: https://earthexplorer.usgs.gov (accessed on 1 March 2024).
- Kestens, Y.; Brand, A.; Fournier, M.; Goudreau, S.; Kosatsky, T.; Maloley, M.; Smargiassi, A. Modelling the variation of land surface temperature as determinant of risk of heat-related health events. Int. J. Health Geogr. 2011, 10, 7. [Google Scholar] [CrossRef]
- Huang, H.; Liu, X.; Ren, L. Analysis of the spatiotemporal mechanism of high temperature on residents’ irritability in Beijing based on multiscale geographically weighted regression model. Front. Ecol. Evol. 2022, 10, 973365. [Google Scholar] [CrossRef]
- Krüger, E.; Gobo, J.P.A.; Tejas, G.T.; Souza, R.M.d.S.d.; Neto, J.B.F.; Pereira, G.; Mendes, D.; Di Napoli, C. The impact of urbanization on heat stress in Brazil: A multi-city study. Urban Clim. 2024, 53, 101827. [Google Scholar] [CrossRef]
- Matallah, M.E.; Ahriz, A.; Zitouni, D.C.; Arrar, H.F.; Ben Ratmia, M.A.E.; Attia, S. A methodological approach to evaluate the passive cooling effect of Oasis palm groves. Sustain. Cities Soc. 2023, 99, 104887. [Google Scholar] [CrossRef]
- Khan, A.A. Heat related illnesses: Review of an ongoing challenge. Saudi Med. J. 2019, 40, 1195. [Google Scholar] [CrossRef] [PubMed]
- Aboubakri, O.; Khanjani, N.; Jahani, Y.; Bakhtiari, B. Thermal comfort and mortality in a dry region of Iran, Kerman; a 12-year time series analysis. Theor. Appl. Clim. 2020, 139, 403–413. [Google Scholar] [CrossRef]
- Wu, X.; Liu, Q.; Huang, C.; Li, H. Mapping heat-health vulnerability based on remote sensing: A case study in karachi. Remote Sens. 2022, 14, 1590. [Google Scholar] [CrossRef]
- Blazejczyk, K.; Epstein, Y.; Jendritzky, G.; Staiger, H.; Tinz, B. Comparison of UTCI to selected thermal indices. Int. J. Biometeorol. 2012, 56, 515–535. [Google Scholar] [CrossRef]
- Błażejczyk, K.; Jendritzky, G.; Bröde, P.; Fiala, D.; Havenith, G.; Epstein, Y.; Psikuta, A.; Kampmann, B. An introduction to the universal thermal climate index (UTCI). Geogr. Pol. 2013, 86, 5–10. [Google Scholar] [CrossRef]
- Błażejczyk, K.; Błażejczyk, M. BioKlima—Institute of Geography and Spatial Organization PAS. 2010. Available online: https://www.igipz.pan.pl/bioklima-crd.html (accessed on 11 September 2024).
- Blazejczyk, K. New climatological and physiological model of the Human Heat Balance outdoor (MENEX) and its applications in bioclimatological studies in different scales. Zeszyty Instytutu Geografii i Przestrzennego Zagospodarowania PAN 1994, 28, 27–58. [Google Scholar]
- Wang, C.; Zhan, W.; Liu, Z.; Li, J.; Li, L.; Fu, P.; Huang, F.; Lai, J.; Chen, J.; Hong, F.; et al. Satellite-based mapping of the Universal Thermal Climate Index over the Yangtze River Delta urban agglomeration. J. Clean. Prod. 2020, 277, 123830. [Google Scholar] [CrossRef]
- Manepalli, U.R.; Bham, G.H.; Kandada, S. Evaluation of hotspots identification using kernel density estimation (K) and Getis-Ord (Gi*) on I-630. In Proceedings of the 3rd International Conference on Road Safety and Simulation, National Academy of Sciences, Indianapolis, IN, USA, 14–16 September 2011; pp. 14–16. Available online: https://onlinepubs.trb.org/onlinepubs/conferences/2011/RSS/2/Manepalli,UR.pdf (accessed on 22 August 2024).
- Wang, Y.; Chan, A.; Lau, G.N.; Li, Q.; Yang, Y.; Yim, S.H.L. Effects of urbanization and global climate change on regional climate in the Pearl River Delta and thermal comfort implications. Int. J. Clim. 2019, 39, 2984–2997. [Google Scholar] [CrossRef]
- Alioua, N.E.H.; Kemmouche, A. Assessing Urban Expansion of Algiers with Random Forest-Based Multi-Index Using Landsat Imagery. In Proceedings of the 2024 IEEE Mediterranean and Middle-East Geoscience and Remote Sensing Symposium (M2GARSS), Oran, Algeria, 15–17 April 2024; pp. 139–143. [Google Scholar]
- Heidari, H.; Mohammadbeigi, A.; Khazaei, S.; Soltanzadeh, A.; Asgarian, A.; Saghafipour, A. Assessment of land use–land cover changes using GIS, remote sensing, and CA–Markov model: A case study of Algiers. Algeria Appl. Geomat 2020. [Google Scholar] [CrossRef]
- Talhi, A.; Barlet, A.; Bruneau, D.; Aichour, B. Towards a prediction of outdoor human thermal comfort adapted for designers of urban spaces: Examining UTCI and APCI in the context of Algiers (Algeria). Int. J. Biometeorol. 2020, 64, 651–662. [Google Scholar] [CrossRef] [PubMed]
- Arrar, F.H.; Kaoula, D.; Matallah, M.E.; Abdessemed-Foufa, A.; Taleghani, M.; Attia, S. Quantification of Outdoor Thermal Comfort Levels under Sea Breeze in the Historical City Fabric: The Case of Algiers Casbah. Atmosphere 2022, 13, 575. [Google Scholar] [CrossRef]
- Smail, S.A.; Zemmouri, N.; Djenane, M.; Nikolopoulou, M. Investigating the transient conditions of “Sabat” space and its influence on pedestrian sensations during thermal walks. Algiers’ Casbah case study. Build. Environ. 2024, 261, 111760. [Google Scholar] [CrossRef]
- Błażejczyk, K.; Twardosz, R. Secular changes (1826–2021) of human thermal stress according to UTCI in Kraków (southern Poland). Int. J. Clim. 2023, 43, 4220–4230. [Google Scholar] [CrossRef]
- Kuchcik, M.; Błażejczyk, K.; Halaś, A. Long-term changes in hazardous heat and cold stress in humans: Multi-city study in Poland. Int. J. Biometeorol. 2021, 65, 1567–1578. [Google Scholar] [CrossRef]
- Zheng, Z.; Lin, X.; Chen, L.; Yan, C.; Sun, T. Effects of urbanization and topography on thermal comfort during a heat wave event: A case study of Fuzhou, China. Sustain. Cities Soc. 2024, 102, 105233. [Google Scholar] [CrossRef]
- Zhou, D.; Zhao, S.; Liu, S.; Zhang, L.; Zhu, C. Surface urban heat island in China’s 32 major cities: Spatial patterns and drivers. Remote Sens. Environ. 2014, 152, 51–61. [Google Scholar] [CrossRef]
- Tonne, C.; Adair, L.; Adlakha, D.; Anguelovski, I.; Belesova, K.; Berger, M.; Brelsford, C.; Dadvand, P.; Dimitrova, A.; Giles-Corti, B.; et al. Defining pathways to healthy sustainable urban development. Environ. Int. 2021, 146, 106236. [Google Scholar] [CrossRef]
- Lowe, D.; Ebi, K.L.; Forsberg, B. Heatwave Early Warning Systems and Adaptation Advice to Reduce Human Health Consequences of Heatwaves. Int. J. Environ. Res. Public Health 2011, 8, 4623–4648. [Google Scholar] [CrossRef]
- Kien, N.D.; My, N.H.D.; Thu, D.T.A.; Tri, T.T.C.; Son, N.H.; Phong, T.K.; Tin, H.C.; Lan, N.H.; Thang, T.B.; The, B.D.; et al. Valuation of a Heatwave Early Warning System for Mitigating Risks Associated with Heat-Related Illness in Central Vietnam. Sustainability 2023, 15, 15342. [Google Scholar] [CrossRef]
- Trahan, A.; Walshe, R.; Mehta, V. Extreme heat, gender, and access to preparedness measures: An analysis of the heatwave early warning system in Ahmedabad, India. Int. J. Disaster Risk Reduct. 2023, 99, 104080. [Google Scholar] [CrossRef]
- Duan, Z.; de Wilde, P.; Attia, S.; Zuo, J. Prospect of energy conservation measures (ECMs) in buildings subject to climate change: A systematic review. Energy Build. 2024, 322, 114739. [Google Scholar] [CrossRef]
- Fahmy, M.; Mahdy, M.; Mahmoud, S.; Abdelalim, M.; Ezzeldin, S.; Attia, S. Influence of urban canopy green coverage and future climate change scenarios on energy consumption of new sub-urban residential developments using coupled simulation techniques: A case study in Alexandria, Egypt. Energy Rep. 2020, 6, 638–645. [Google Scholar] [CrossRef]
- Necira, H.; Matallah, M.E.; Bouzaher, S.; Mahar, W.A.; Ahriz, A. Effect of Street Asymmetry, Albedo, and Shading on Pedestrian Outdoor Thermal Comfort in Hot Desert Climates. Sustainability 2024, 16, 1291. [Google Scholar] [CrossRef]
- Arrar, H.F.; Kaoula, D.; Santamouris, M.; Foufa-Abdessemed, A.; Emmanuel, R.; Matallah, M.E.; Ahriz, A.; Attia, S. Coupling of different nature base solutions for pedestrian thermal comfort in a Mediterranean climate. Build. Environ. 2024, 256, 111480. [Google Scholar] [CrossRef]
- Ben Ratmia, F.Z.; Ahriz, A.; Santi, G.; Bouzaher, S.; Mahar, W.A.; Ben Ratmia, M.A.E.; Matallah, M.E. Street Design Strategies Based on Spatial Configurations and Building External Envelopes in Relation to Outdoor Thermal Comfort in Arid Climates. Sustainability 2024, 16, 221. [Google Scholar] [CrossRef]

| UTCI (°C) | Stress Category |
|---|---|
| UTCI ≥ 46 | Extreme heat stress |
| 38 ≤ UTCI < 46 | Very strong heat stress |
| 32 ≤ UTCI < 38 | Strong heat stress |
| 26 ≤ UTCI < 32 | Moderate heat stress |
| 9 ≤ UTCI < 26 | No thermal stress |
Disclaimer/Publisher’s Note: The statements, opinions and data contained in all publications are solely those of the individual author(s) and contributor(s) and not of MDPI and/or the editor(s). MDPI and/or the editor(s) disclaim responsibility for any injury to people or property resulting from any ideas, methods, instructions or products referred to in the content. |
© 2025 by the authors. Licensee MDPI, Basel, Switzerland. This article is an open access article distributed under the terms and conditions of the Creative Commons Attribution (CC BY) license (https://creativecommons.org/licenses/by/4.0/).
Share and Cite
Zitouni, D.C.; Berkouk, D.; Matallah, M.E.; Ben Ratmia, M.A.E.; Attia, S. Advancing Heat Health Risk Assessment: Hotspot Identification of Heat Stress and Risk Across Municipalities in Algiers, Algeria. Atmosphere 2025, 16, 484. https://doi.org/10.3390/atmos16040484
Zitouni DC, Berkouk D, Matallah ME, Ben Ratmia MAE, Attia S. Advancing Heat Health Risk Assessment: Hotspot Identification of Heat Stress and Risk Across Municipalities in Algiers, Algeria. Atmosphere. 2025; 16(4):484. https://doi.org/10.3390/atmos16040484
Chicago/Turabian StyleZitouni, Dyna Chourouk, Djihed Berkouk, Mohamed Elhadi Matallah, Mohamed Akram Eddine Ben Ratmia, and Shady Attia. 2025. "Advancing Heat Health Risk Assessment: Hotspot Identification of Heat Stress and Risk Across Municipalities in Algiers, Algeria" Atmosphere 16, no. 4: 484. https://doi.org/10.3390/atmos16040484
APA StyleZitouni, D. C., Berkouk, D., Matallah, M. E., Ben Ratmia, M. A. E., & Attia, S. (2025). Advancing Heat Health Risk Assessment: Hotspot Identification of Heat Stress and Risk Across Municipalities in Algiers, Algeria. Atmosphere, 16(4), 484. https://doi.org/10.3390/atmos16040484