Article

Impact of East Pacific La Niña on Caribbean Climate

1
Department of Physics, University of Puerto Rico Mayagüez, Mayagüez, PR 00681, USA
2
Department of Geography, University of Zululand, KwaDlangezwa 3886, South Africa
Atmosphere 2025, 16(4), 485; https://doi.org/10.3390/atmos16040485
Submission received: 16 March 2025 / Revised: 14 April 2025 / Accepted: 18 April 2025 / Published: 21 April 2025

Abstract

:
Statistical cluster analysis applied to monthly 1–100 m ocean temperatures reveals El Niño–Southern Oscillation (ENSO) dipole patterns with a leading mode having opposing centers of action across the dateline and tropical east Pacific. We focus on the La Niña cold phase and study its impact on the Caribbean climate over the period of 1980–2024. East dipole time scores are used to identify composite years, and anomaly patterns are calculated for Jan-Jun and Jul-Dec. Convective responses over the Caribbean exhibit seasonal contrasts: dry winter–spring and wet summer–autumn. Trade winds and currents across the southern Caribbean weaken and lead to anomalous warming of upper ocean temperatures. Sustained coastal upwelling off Peru and Ecuador during east La Niña is teleconnected with easterly wind shear and tropical cyclogenesis over the Caribbean during summer, leading to costly impacts. This ocean–atmosphere coupling is quite different from the more common central Pacific ENSO dipole.

1. Introduction

The El Niño–Southern Oscillation (ENSO) is modulated by zonal wind stress over the tropical Pacific [1]. During La Niña conditions, strong trade winds induce oceanic upwelling, lifting the thermocline in the east Pacific. Subsurface Rossby waves are generated, which travel westward and reflect as equatorial Kelvin waves, forming a delayed oscillator with an inter-annual rhythm [2,3,4,5,6,7,8]. The ‘see-saw’ amplifies in northern winter and creates tropical ocean temperature dipole patterns, atmospheric zonal overturning circulations, and convective heat sources, which anchor troughs that slant into higher latitudes [9,10,11,12].
Tropical Pacific dipole patterns have been distinguished by central and east modes [13,14,15], the former dominated by equatorial upwelling and the latter by coastal upwelling off Peru and Ecuador. In the opposing phase, a coastal El Nino is induced by downwelling Kelvin waves and strengthening of upper westerlies in the mid-latitudes [16,17,18]. Ref. [19] offers a comprehensive review of the drivers and impacts of these two modes. Pacific ENSO alters the wind shear and moist instability via secondary Walker cells over the Atlantic [20,21]. These have the effect of tripling the number of intense Caribbean hurricanes during La Niña compared with El Niño. Furthermore, these track westward and make landfall, whereas weaker storms during El Niño often recurve northward and remain at sea.
Thus, while we understand those contrasts, there is little distinction in hurricane risk forecasts between the central and east Pacific ENSO. Scientific messaging pays more attention to a warm- or cool-phase ENSO and less attention to which mode is prevalent. Seasonal warnings to coastal communities and service providers may be lacking. We propose that the central and east modes have distinct consequences for seasonal transitions and spatial extent. Hence, we are motivated to study how the regional impacts vary as the dipole shifts across the tropical Pacific Ocean.
This study examines how the east-mode ENSO affects the Caribbean climate (1980–2024), focusing on persistent La Niña conditions that drive anomalous convection and winds. An east Pacific dipole index is created to investigate regional ocean–atmosphere coupling. We postulate that a divergent high pressure blocks trade wind outflow from the Caribbean, with consequences for tropical cyclogenesis.

2. Data Analysis

The monthly datasets employed include the National Ocean Data Center (NODC) 1–100 m ocean temperature [22], satellite net outgoing longwave radiation (OLR) [23], NASA Merra 2 meteorological reanalysis [24] of wind and vertical motion, and Global ocean data assimilation (GODAS) reanalysis [25] of ocean temperature, currents, and vertical motion. Cyclostationary Empirical Orthogonal Function (EOF) decomposition cf. [26] is applied to standardized 1–100 m ocean temperatures in the tropical Pacific 17 S–17 N, 150 E–77 W, and the east-mode dipole loading pattern, representing 10% of variance, and the associated time score is extracted for 1980–2024. A 6-month centered polynomial low-pass filter is applied to suppress intra-seasonal noise, and the east-mode time score is correlated with the satellite net OLR field over the tropical Pacific. Linear regression is applied to quantify a trend in the time score, where R > |0.24| achieves 95% confidence. Auto-correlation and wavelet spectra are analyzed to determine the statistical persistence and cycling of the east-mode ENSO.
EOF time score values exceeding 1σ are identified by ranking to form an ‘east La Niña’ composite: 1994, 2003, 2004, 2005, 2007, 2016, 2017, 2019, 2020, and 2024. Anomalies are calculated by subtracting the 1990–2020 mean from the top 10 years over the Caribbean domain 5–24 N, 87–55 W. Composite anomaly height vs. longitude and depth vs. latitude sections are calculated to reveal the tropical zonal and meridional overturning circulations that link the east Pacific La Niña with the Caribbean climate. All composites are segregated into Jan–Jun and Jul–Dec to determine how responses vary across the seasonal transition. We analyze 925 hPa U winds over Nicaragua (11 N, 86 W) and V winds over Panama (8 N, 80 W), as a metric for Caribbean trade wind ‘outflow’. Statistically significant features are noted, where the objectively determined and ranked top-10 cases exhibit anomalies >10% of the total value. Lastly, the characteristics and impacts of tropical cyclones in composite years are quantified from annual reports of [27], which assimilate track and intensity information.

3. Results

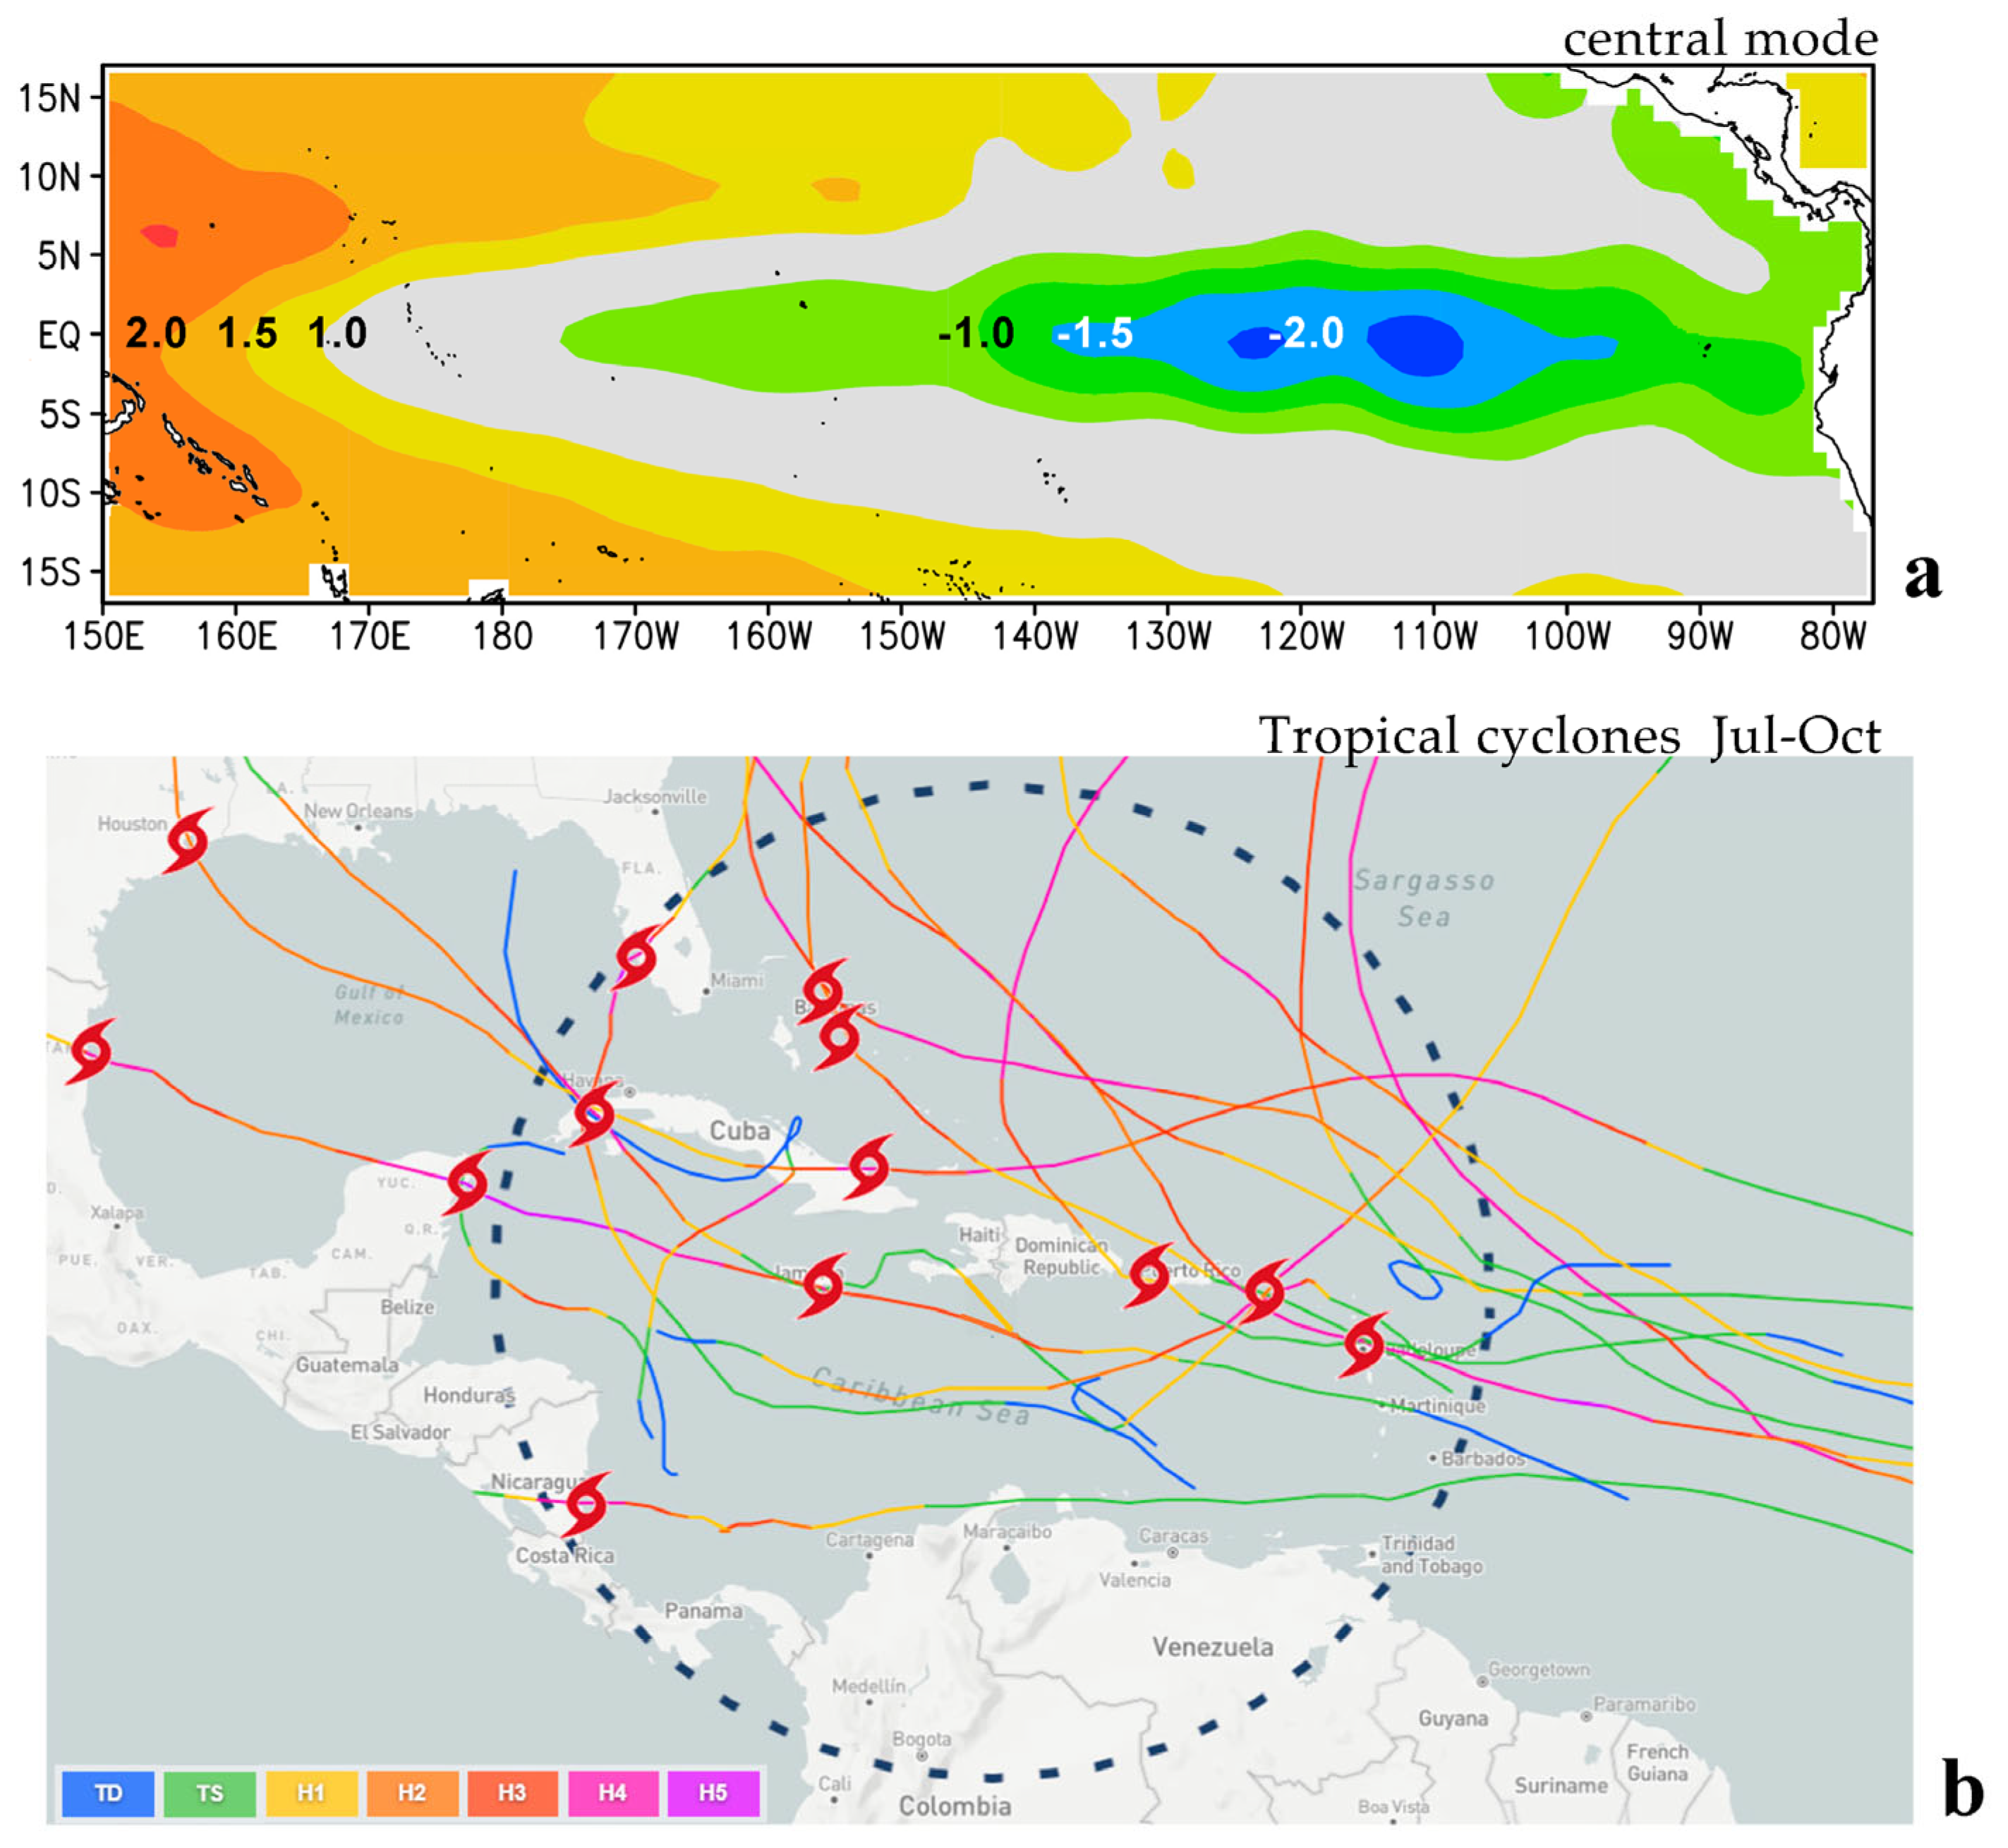
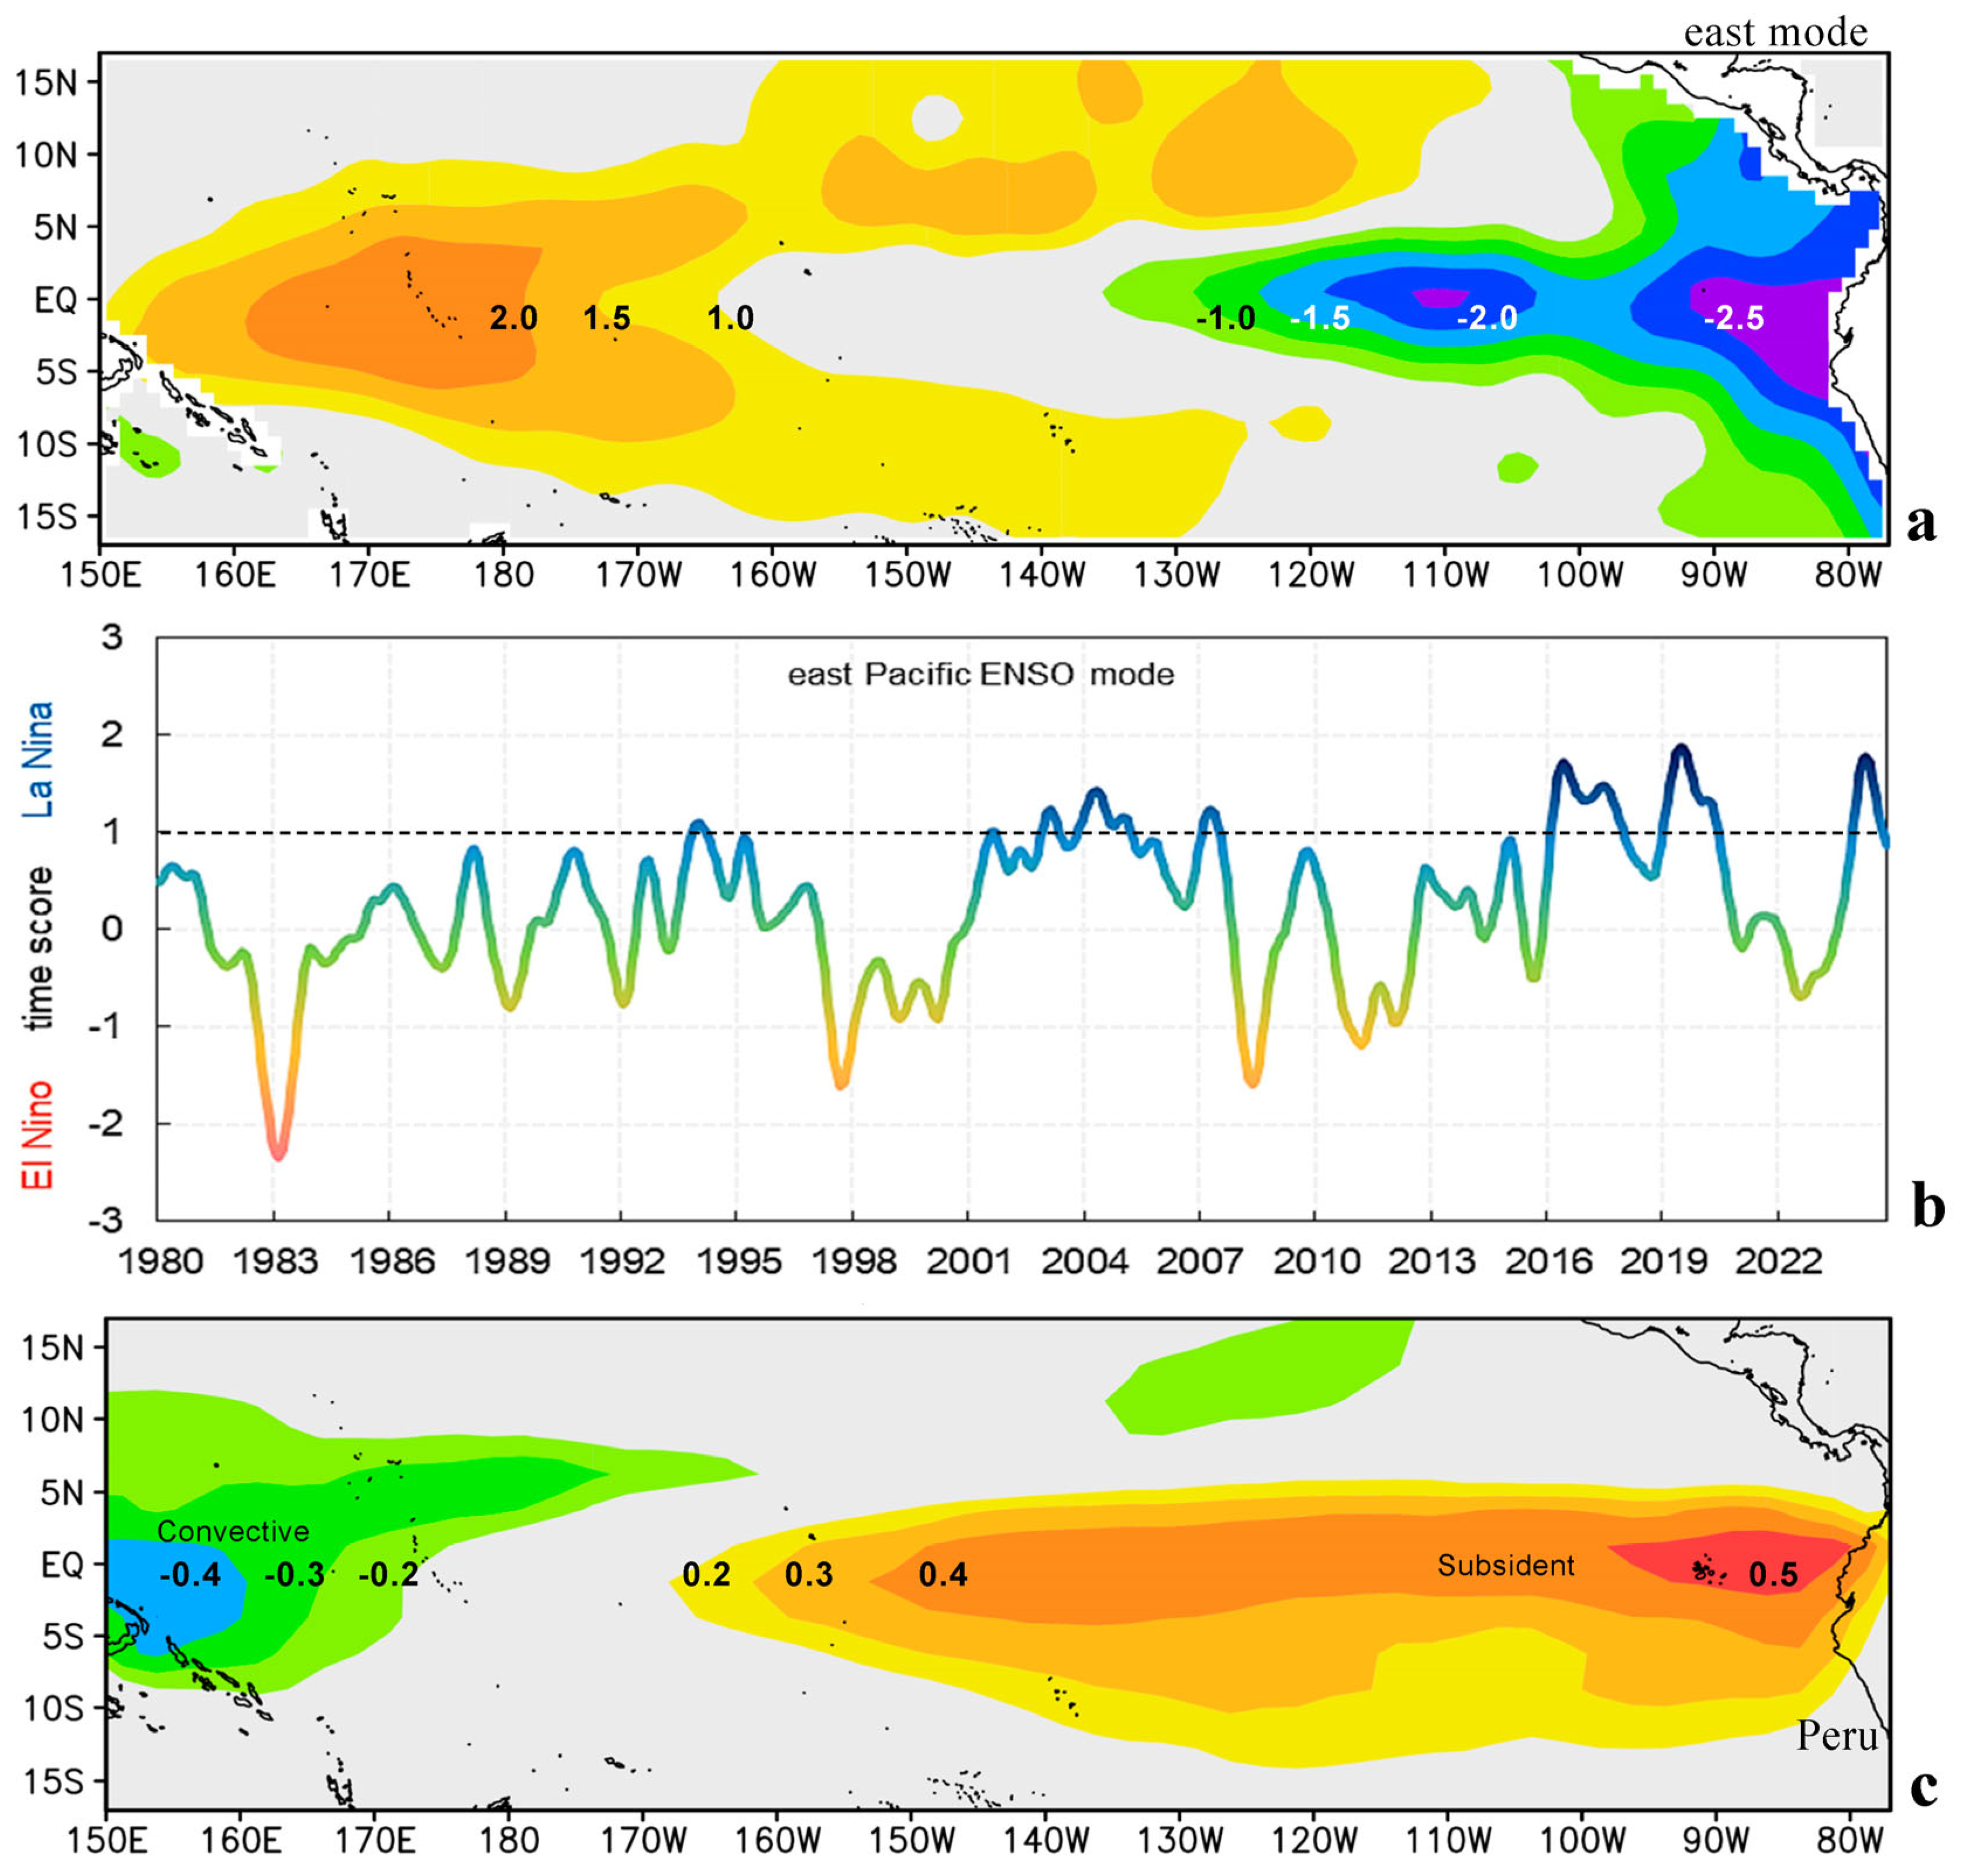
3.1. East Pacific Dipole Pattern and Time Score

The EOF decomposition of monthly upper ocean temperatures for 1980–2024 yields an east-mode loading map, forming a tropical Pacific dipole (Figure 1a) with a positive center of action at 180 W and negative center of action at 90 W. For comparison, the central-mode loading map is presented in Appendix A Figure A1a. Both loading maps take on a < - shape, consistent with the latitude-dependent phase speed of subtropical ocean Rossby waves [28] and coupled atmospheric trough–ridge patterns. The negative center of action reflects a coastal upwelling plume extending from Peru and Ecuador, spreading beyond the Galapagos Islands and toward Panama. Naturally, in the warm phase of the east mode, downwelling Kelvin waves push across the equatorial Pacific toward the coast of South America [29].
The time score in Figure 1b exhibits sharp dips for El Nino and gradual crests for La Niña. According to linear regression, there is a weak trend toward an east Pacific cold phase of 0.018 σ/yr with R = +0.30. Auto-correlation and spectral analysis suggest significant annual persistence and cycling at an ~8 yr interval, which allows for year-round influence. The monthly correlation map with respect to net OLR (Figure 1c) shows well-known convective responses to the tropical dipole: deep clouds (–OLR) over 7 S–10 N, 150–180 E, and subsidence and clear skies (+OLR) over 10 S–5 N, 80–120 W. In the following section, we analyze how this manifests in the Caribbean in the first and second halves of the year.

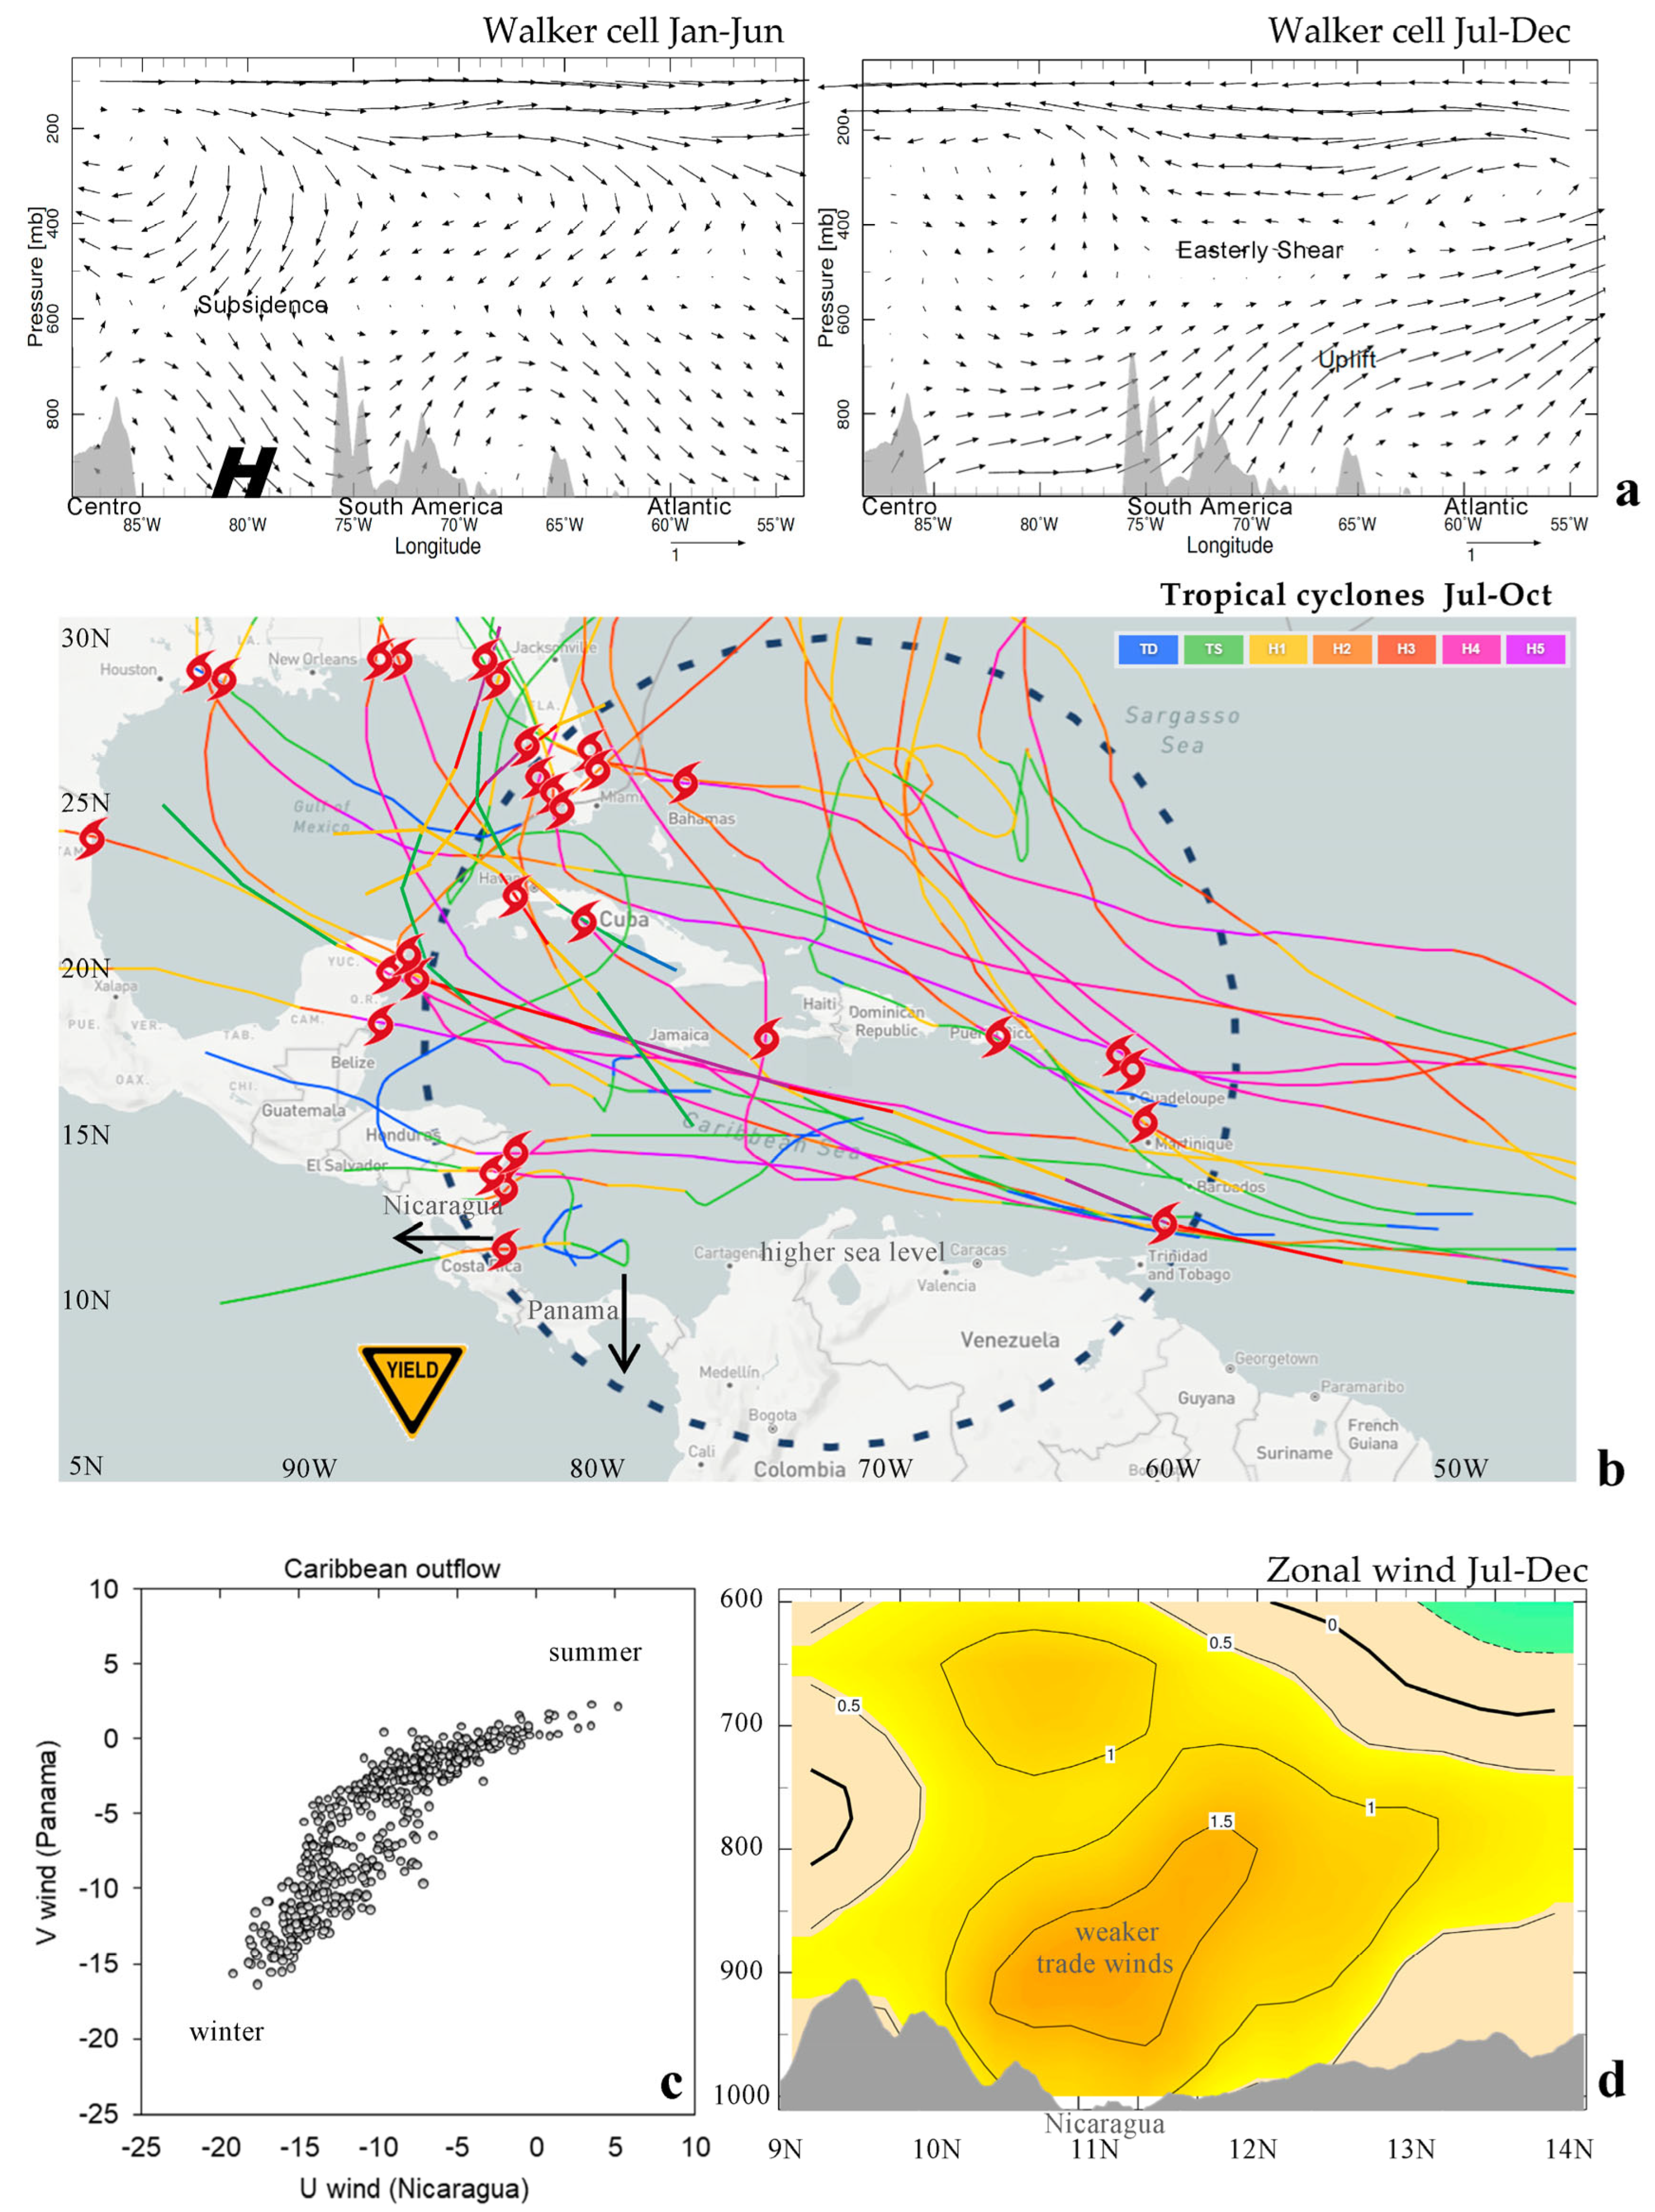
3.2. Composite Atmospheric Maps

The Jan–Jun and Jul–Dec top-10 composite anomaly maps are presented in Figure 2a–c. Low-level wind anomalies reflect a divergent high pressure over Panama in Jan–Jun, which acts to limit trade wind outflow. Anomalous westerlies spread across the Caribbean, so evaporation declines by ~3 W/m2. As the season progresses, Jul–Dec composite anomalies indicate a sustained relaxation of trade winds in the southwest Caribbean. In contrast, upper-level winds exhibit a seasonal transition from northwesterly in the first half-year to easterly in the second half-year. Similarly, the composite net OLR reveals seasonal contrasts, with widespread subsidence (+OLR) in the first half-year, especially in the southwestern Caribbean. Convective troughs are infrequent during the east Pacific La Niña, enabling surplus solar radiation. The top-10 composite net OLR in the second half-year reveals widespread convection (–OLR); a doubling of rainfall in the southwestern Caribbean is supported by convergent trade winds (dU/dx).

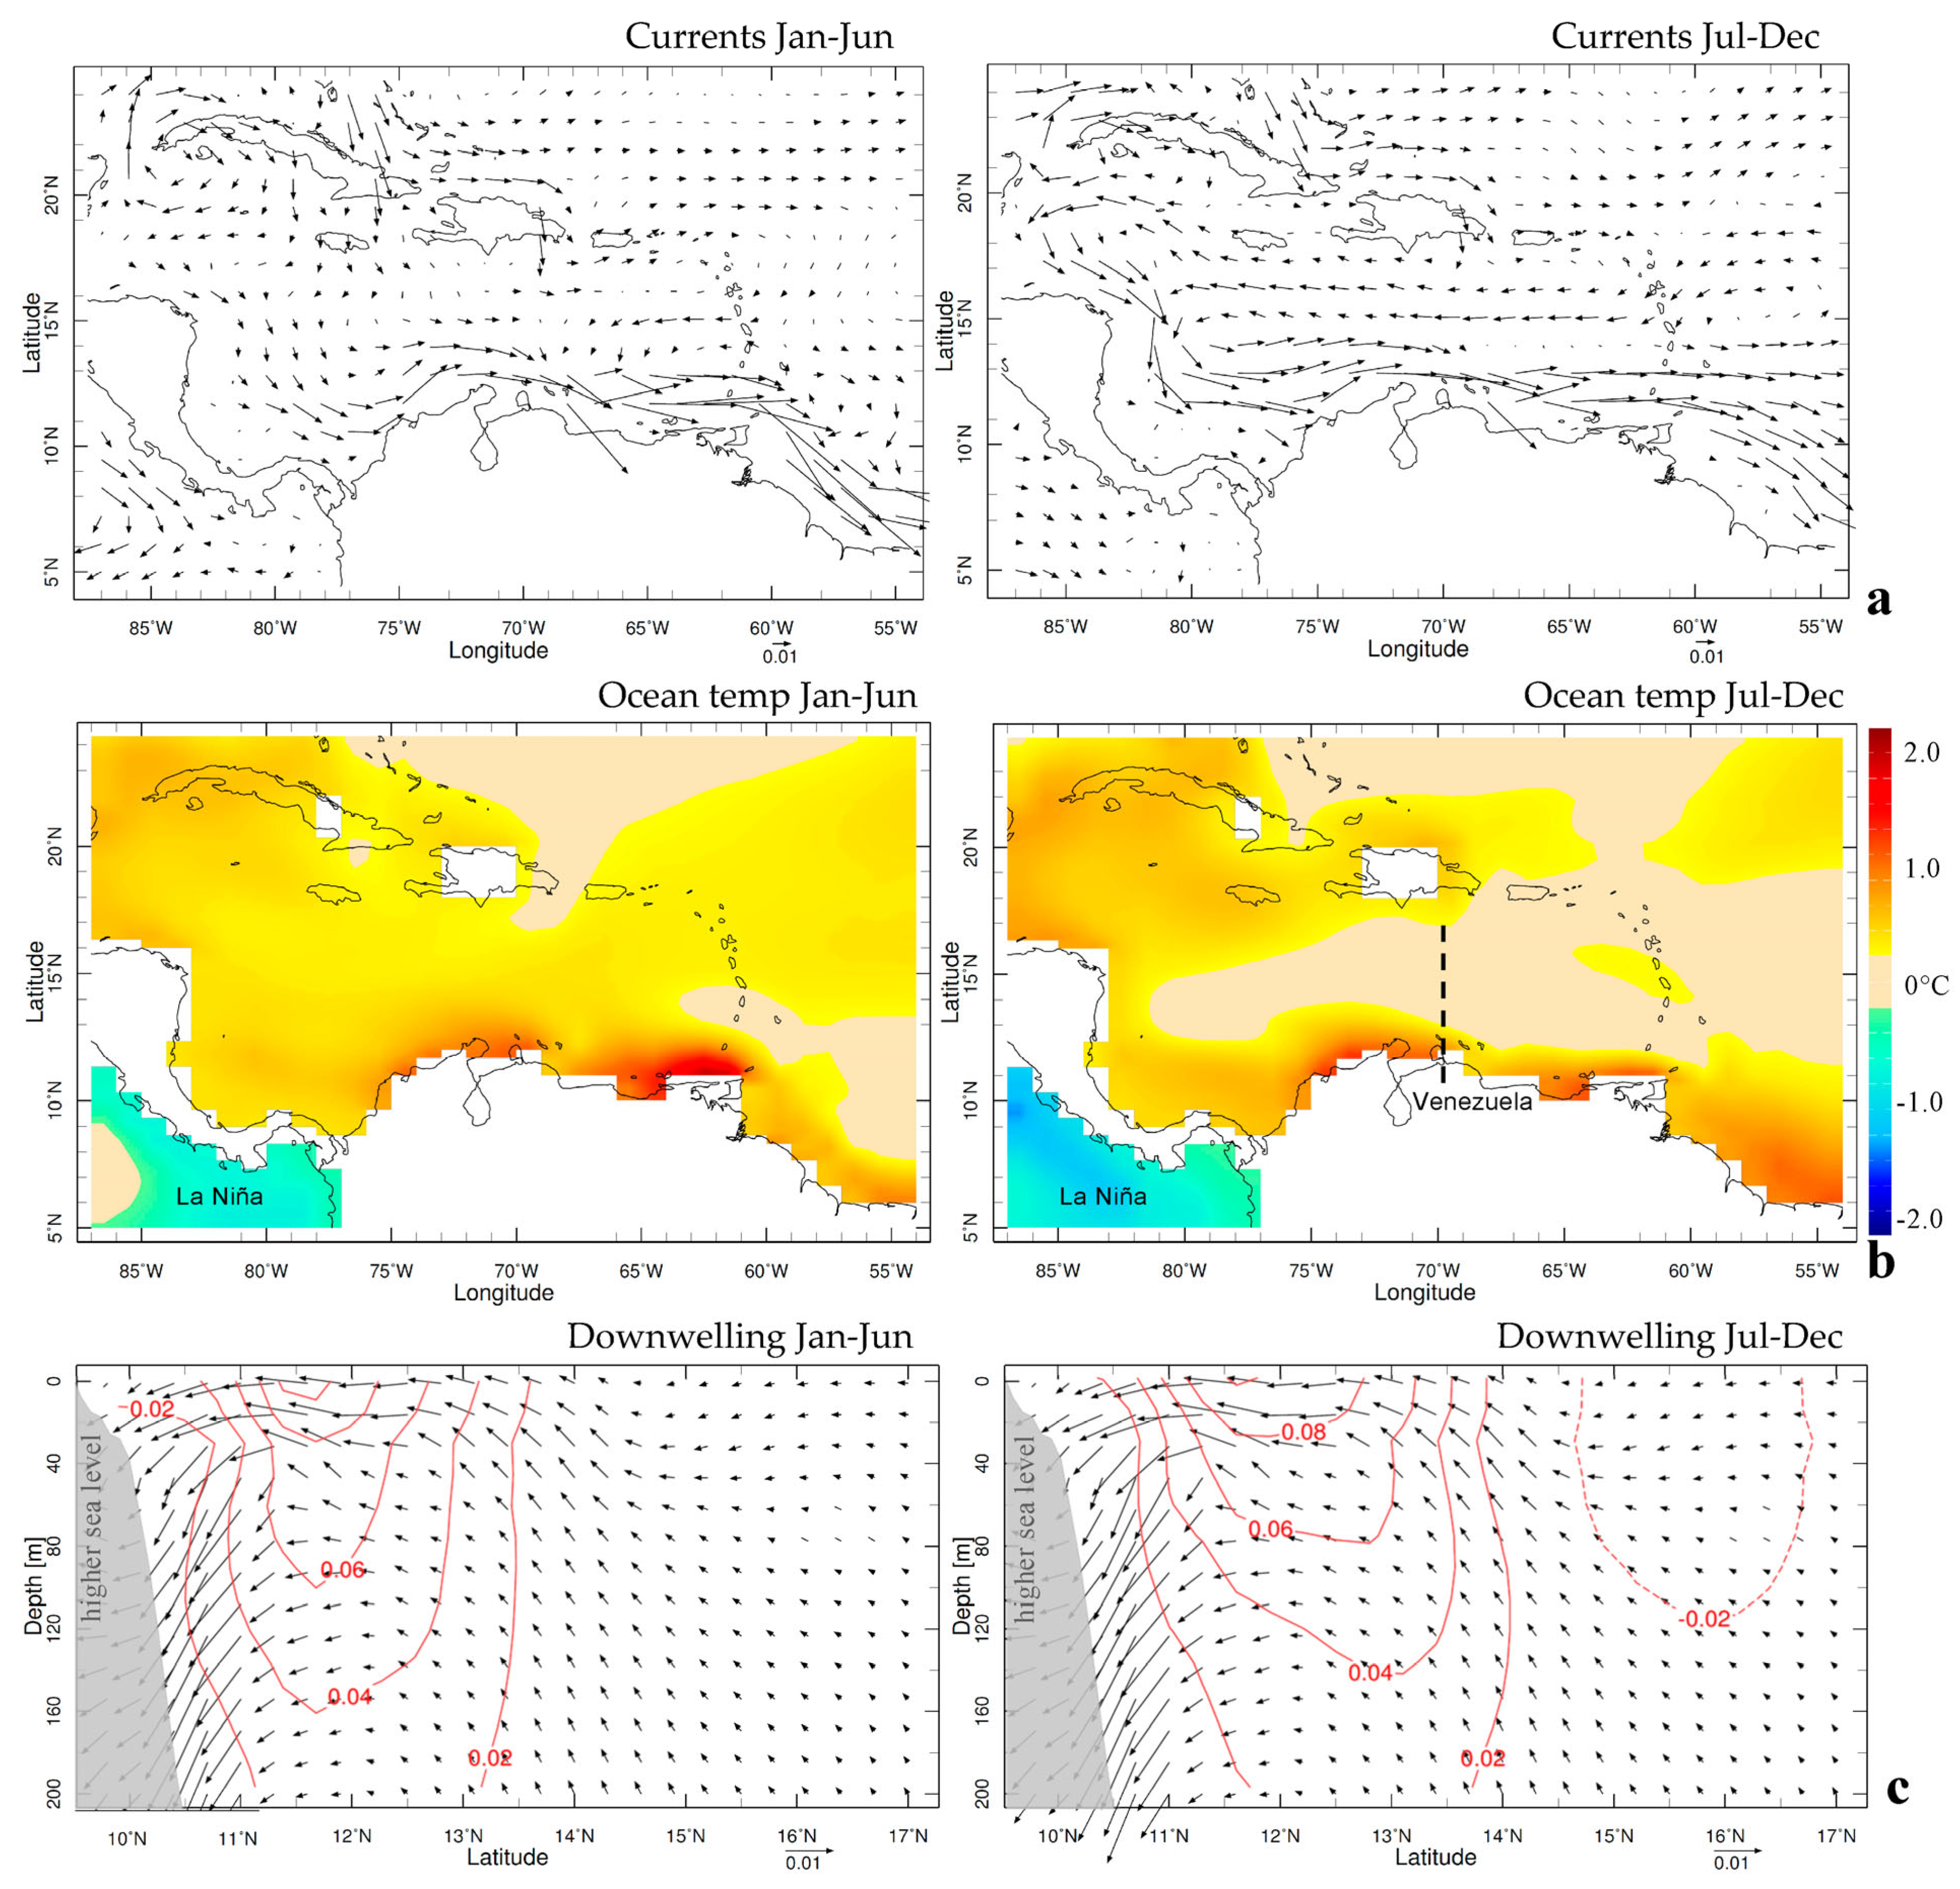
3.3. Composite Upper Ocean Conditions

Figure 3a–c describe the top-10 composite upper ocean responses to the east Pacific La Niña. Unlike the atmosphere, the marine response is steady across the year. The Caribbean current weakens due to warming to the northwest of Venezuela, where an anomalous downwelling circulation is sustained. The strongest signals follow the continental shelf from Nicaragua eastward along 11–13 N and reach a depth of 150 m. A weaker Caribbean current enables an accumulation of heat, while downwelling inhibits the entrainment of subsurface waters. Normally, trade wind upwelling extends northwest of Venezuela to suppress atmospheric convection [30]. But during east Pacific La Niña, these air–sea interactions fade away.

3.4. Caribbean Wind Shear and Tropical Cyclogenesis

Composite atmospheric height vs. longitude sections averaging 10–13 N describe the zonal circulation response in Figure 4a. Anomalous upper westerlies subside over the southern Caribbean in Jan–Jun as low-level trade winds relax. Later, upper easterlies combine with uplifted lower westerly anomalies to create wind shear favoring tropical cyclogenesis. The circulation reflects teleconnections with the east-mode La Niña. Composite hurricane tracks > category-2 are presented in Figure 4b and show #33. Most storms track westward from the tropical Atlantic through the Caribbean along 15 N; #30 storms intensified and made landfall, causing catastrophic damage amounting to USD 447 B [27]. The zonal atmospheric circulation is quite different under the central Pacific dipole, wherein global responses amplify during winter cf. [10,12], but Caribbean storm impacts are halved (cf. Figure A1, USD 199 B) during summer.
The trade wind outflow over Nicaragua and Panama is analyzed in Figure 4c,d. The low-level airflow tends to be stronger in winter (15 m/s) than summer. The scatterplot suggests that the two exit-points covary over the annual cycle and also with respect to the ENSO phase. The top-10 composite height section west of Nicaragua reveals anomalous weakening of trade winds during the east Pacific La Niña for 10–13 N, 950–800 hPa, Jul–Dec. The Caribbean outflow exhibits high intra-seasonal variability that is unresolved in our monthly datasets.

4. Concluding Discussion

Cyclostationary EOF analysis applied to monthly 1–100 m ocean temperatures 1980–2024 in the tropical Pacific 17 S–17 N, 150 E–77 W revealed a dipole with opposing centers of action at ~180 W and 90 W, and a time score with persistent multi-year oscillations. By applying a statistical threshold of 1σ, we identified the top 10 years with east Pacific La Niña conditions and formed composites for Jan–Jun and Jul–Dec to study anomalous climatic responses in the Caribbean.
ENSO teleconnections were assessed for ocean–atmosphere coupling. During the east-mode La Niña, trade wind outflow was stifled by a divergent high pressure to the north of Panama during springtime (cf. Figure 2a). Upwelling off Venezuela diminished and the Caribbean current slowed ~0.1 m/s cf. [31]. Composites for Ja–-Jun had reduced convection and upper westerlies, whereas Jul–Dec exhibited upper easterlies and increased convection favorable to tropical cyclogenesis (cf. Figure 2b,c and Figure 4a). These are consistent with the known influence of the Pacific ENSO in the cool phase, yet the amplitude of the Caribbean response is greater in the east mode.
An east Pacific La Niña suppresses Caribbean trade winds and evaporation ~3 W/m2 during winter and spring. Surplus heat (Q) accumulates over time (dt) according to scale analysis of the thermodynamic equation dT = Q dt/M Cp. Ocean temperatures in the mixed layer warm by +2 C from anomalous heat sustained over ~3 months divided by mass (M) and heat capacity (Cp) = +3 107/1.5 107 cf. [32]. A downwelling circulation northwest of Venezuela sustains the warming through summer and autumn.
During an east Pacific La Niña, transient easterly waves passing the Antilles Islands entrain warm moist air under favorable wind shear [33]. Diabatic heating is aligned with storm vorticity, so tropical cyclones intensify and make landfall across the Caribbean from July to October, imposing composite economic impacts of USD 447 B. In comparison, tropical cyclone damage during the central-mode La Niña (Figure A1) amounts to USD 199 B. A key feature of the east-mode ENSO is persistent coastal upwelling off Peru and Ecuador, which diffuses cool water towards Panama and Nicaragua, inhibiting trade wind outflow. An upward trend in the dipole time score suggests more frequent east Pacific La Niña conditions, perhaps related to the gradual intensification of the pressure gradient off Peru between the marine high and continental low. Further work will study how the ocean–atmosphere Rossby waves anchor to central and east Pacific dipoles and interact with global monsoon systems.

Funding

No funding was received for this work.

Institutional Review Board Statement

Not applicable.

Informed Consent Statement

Not applicable.

Data Availability Statement

The author can share the data analysis via email request.

Acknowledgments

Outcome-based support from the South African Dept. of Higher Education is acknowledged. This research benefited from collaboration with the National University of Trujillo Peru. Websites employed in the data analysis include </iridl.ldeo.columbia.edu/>, </climexp.knmi.nl/>, and </coast.noaa.gov/hurricanes/>. J. Lopez-Molina assisted the work at the University of Puerto Rico Mayaguez.

Conflicts of Interest

The author declares no conflict of interest.

Appendix A

Figure A1. EOF decomposition of tropical Pacific standardized 1–100 m ocean temperatures: (a) loading map of central mode, representing 50% variance, for comparison with Figure 1a. Its time score top-10 years are 1984, 1985, 1988, 1989, 1999, 2000, 2008, 2011, 2021, 2022. (b) Composite tropical cyclones in central mode, #17 above category-2 passing through the Caribbean (dashed circle), for comparison with Figure 4b. USD 1+ B landfalls are denoted by hurricane icons #13, total cost = USD 199 B [27], intensity color scale lower left.
Atmosphere 16 00485 g0a1

References

  1. Yang, X.; DelSole, T. Systematic comparison of ENSO teleconnection patterns between models and observations. J. Clim. 2012, 25, 425–446. [Google Scholar] [CrossRef]
  2. Jin, F.-F. An equatorial ocean recharge paradigm for ENSO, part I: Conceptual model. J. Atmos. Sci. 1997, 54, 811–829. [Google Scholar] [CrossRef]
  3. Picault, J.; Masia, F.; du Penhoat, Y. An advective-reflective conceptual model for the oscillatory nature of the ENSO. Science 1997, 277, 663–666. [Google Scholar] [CrossRef]
  4. Wang, C. A unified oscillator model for the El Niño–Southern Oscillation. J. Clim. 2001, 14, 98–115. [Google Scholar] [CrossRef]
  5. White, W.B.; Tourre, Y.M.; Barlow, M.; Dettinger, M. A delayed action oscillator shared by biennial, inter-annual, and decadal signals in the Pacific basin. J. Geophys. Res. 2003, 108, 3070. [Google Scholar] [CrossRef]
  6. MacMynowski, D.G.; Tziperman, E. Factors affecting ENSO’s period. J. Atmos. Sci. 2008, 65, 1570–1586. [Google Scholar] [CrossRef]
  7. Lin, J. Ocean-atmosphere interaction in the lifecycle of ENSO: The coupled wave oscillator. Chin. Ann. Math. Ser. B 2009, 30, 715–728. [Google Scholar] [CrossRef]
  8. Yang, G.Y.; Hoskins, B. ENSO impact on Kelvin waves and associated tropical convection. J. Atmos. Sci. 2013, 70, 3513–3532. [Google Scholar] [CrossRef]
  9. Gill, A.E. Some simple solutions for heat-induced tropical circulation. Q. J. R. Meteorol. Soc. 1980, 106, 447–462. [Google Scholar]
  10. Wang, C. Atmospheric circulation cells associated with the El Niño–Southern Oscillation. J. Clim. 2002, 15, 399–419. [Google Scholar] [CrossRef]
  11. Lee, S.-K.; Wang, C.; Mapes, B.E. A simple atmospheric model of the local and teleconnection responses to tropical heating anomalies. J. Clim. 2009, 22, 272–284. [Google Scholar] [CrossRef]
  12. Jury, M.R. Global wave-2 structure of ENSO-modulated convection. Int. J. Clim. 2019, 39, 2438–2448. [Google Scholar] [CrossRef]
  13. Yu, J.-Y.; Kao, H.-K. Decadal changes of ENSO persistence barrier in SST and ocean heat content indices: 1958–2001. J. Geophys. Res. 2007, 112, D13106. [Google Scholar] [CrossRef]
  14. Kao, H.; Yu, J. Contrasting eastern-Pacific and central-Pacific types of ENSO. J. Clim. 2009, 22, 615–632. [Google Scholar] [CrossRef]
  15. Xu, K.; Zhu, C.; He, J. Two types of El Niño-related Southern Oscillation and their different impacts on global land precipitation. Adv. Atmos. Sci. 2013, 30, 1743–1757. [Google Scholar] [CrossRef]
  16. Garreaud, R.D. A plausible atmospheric trigger for the 2017 coastal El Niño. Int. J. Clim. 2018, 38, e1296–e1302. [Google Scholar] [CrossRef]
  17. Hu, Z.Z.; Huang, B.; Zhu, J.S.; Kumar, A.; McPhaden, M.J. On the variety of coastal El Niño events. Clim. Dyn. 2019, 52, 7537–7552. [Google Scholar] [CrossRef]
  18. Peng, Q.H.; Xie, S.-P.; Wang, D.X.; Zheng, X.T.; Zhang, H. Coupled ocean-atmosphere dynamics of the 2017 extreme coastal El Niño. Nat. Comm. 2019, 10, 298. [Google Scholar] [CrossRef]
  19. Wang, C.; Deser, C.; Yu, J.-Y.; DiNezio, P.; Clement, A. El Niño-Southern Oscillation (ENSO): A review. In Coral Reefs of the Eastern Pacific; Glymn, P.W., Manzello, D.P., Enochs, I.C., Eds.; Springer: Berlin/Heidelberg, Germany, 2016; pp. 85–106. [Google Scholar]
  20. Patricola, C.M.; Chang, P.; Saravanan, R. Degree of simulated suppression of Atlantic tropical cyclones modulated by flavour of El Niño. Nat. Geosci. 2016, 9, 155–160. [Google Scholar] [CrossRef]
  21. Mueller, T.J.; Patricola, C.M.; Bercos-Hickey, E. The influence of ENSO diversity on future Atlantic tropical cyclone activity. J. Clim. 2024, 37, 3959–3975. [Google Scholar] [CrossRef]
  22. Levitus, S.; Antonov, J.L.; Boyer, T.P.; Baranova, O.K.; Garcia, H.E.; Locarnini, R.A.; Mishonov, A.V.; Reagan, J.R.; Seidov, D.; Yarosh, E.S.; et al. World Ocean heat content and thermosteric sea level change (0–2000 m) 1955–2010. Geophys. Res. Lett. 2012, 39, L10603. [Google Scholar] [CrossRef]
  23. Lee, H.-T. Climate Algorithm Theoretical Basis Document: Outgoing Longwave Radiation (OLR). NOAA’s Climate Data Record (CDR) Program, CDRP-ATBD-0526. 2014; p. 46. Available online: https://www.ncei.noaa.gov/pub/data/sds/cdr/CDRs/Outgoing%20Longwave%20Radiation%20-%20Daily/AlgorithmDescription_01B-21.pdf (accessed on 17 April 2025).
  24. Gelaro, R.; McCarty, W.; Suárez, M.J.; Todling, R.; Molod, A.; Takacs, L.; Randles, C.A.; Darmenov, A.; Bosilovich, M.G.; Reichle, R.; et al. The modern-era retrospective analysis for research and applications v2 (Merra2). J. Clim. 2017, 30, 5419–5454. [Google Scholar] [CrossRef]
  25. Penny, S.G.; Behringer, D.W.; Carton, J.A.; Kalnay, E. The hybrid global ocean data assimilation system at NCEP. Mon. Weather. Rev. 2015, 143, 4660–4677. [Google Scholar] [CrossRef]
  26. Kim, K.Y. Investigation of ENSO variability using cyclostationary EOFs of observational data. Meteorol. Atmos. Phys. 2002, 81, 149–168. [Google Scholar] [CrossRef]
  27. National Hurricane Center. 1980–2024: Annual Reports on Atlantic Hurricanes; NOAA: Miami, FL, USA, 2024. [Google Scholar]
  28. White, W.B. Tropical coupled Rossby waves in the Pacific ocean–atmosphere system. J. Phys. Oceanogr. 2000, 30, 1245–1264. [Google Scholar] [CrossRef]
  29. Peng, Q.; Xie, S.-P.; Passalacqua, G.A.; Miyamoto, A.; Deser, C. The 2023 extreme coastal El Niño: Atmospheric and air-sea coupling mechanisms. Sci. Adv. 2024, 10, eadk8646. [Google Scholar] [CrossRef] [PubMed]
  30. Chang, Y.-L.; Oey, L.-Y. Coupled response of the trade wind, SST gradient, and SST in the Caribbean Sea, and the potential impact on Loop Current inter-annual variability. J. Phys. Oceanogr. 2013, 43, 1325–1344. [Google Scholar] [CrossRef]
  31. Cherubin, L.M.; Richardson, P.L. Caribbean current variability and the influence of the Amazon and Orinoco freshwater plumes. Deep. Sea Res. 2007, 54, 1451–1473. [Google Scholar] [CrossRef]
  32. Torres, R.R.; Latandret, S.; Salon, J.; Dagua, C. Water masses in the Caribbean Sea and sub-annual variability in the Guajira upwelling region. Ocean. Dyn. 2023, 73, 39–57. [Google Scholar] [CrossRef]
  33. Tartaglione, C.A.; Smith, S.R.; O’Brien, J.J. ENSO impact on hurricane landfall probabilities for the Caribbean. J. Clim. 2003, 16, 2925–2931. [Google Scholar] [CrossRef]
Figure 1. EOF decomposition of tropical Pacific standardized 1–100 m ocean temperatures: (a) loading map of east mode representing 10% of variance (contoured at 0.5 σ interval as labeled), (b) intra-seasonal filtered time score, where dashed line is composite threshold, (c) temporal correlation of the EOF time score with field of satellite net OLR anomalies, where R > |0.24| achieves 95% confidence, where cool colors are negative, warm colors are positive, as labelled.
Atmosphere 16 00485 g001
Figure 2. Composite anomalies of top 10: (a) 925 hPa wind, (b) 200 hPa wind, and (c) satellite net OLR (left Jan–Jun, right Jul–Dec). East La Niña years: 1994, 2003, 2004, 2005, 2007, 2016, 2017, 2019, 2020, 2024. Sun icon near the east Antilles is Jan–Jun heat surplus > 3 W/m2, cloud icon near Central America is Jul–Dec rainfall anomaly >6 mm/day. Note that small vectors and neutral shading are insignificant.
Atmosphere 16 00485 g002
Figure 3. Composite anomalies of top 10: (a) 1–100 m currents, (b) 1–100 m ocean temperature, (c) depth section of top-10 meridional ocean circulation (vectors) and zonal current (red contours, m/s) in the southern Caribbean averaging 60–80 W (left Jan–Jun, right Jul–Dec). Note that small vectors and neutral shading are insignificant.
Atmosphere 16 00485 g003
Figure 4. (a): Composite anomaly of top-10 atmospheric zonal circulation averaged 10–13 N with lower topography. (b) Composite top-10 tropical cyclones, # 33 above category-2 passing through the Caribbean (dashed circle). Yield sign reflects slowing of the Caribbean trade wind outflow. USD 1+B hurricane landfalls are denoted by hurricane icons #30, total cost = USD 447 B. (c) Scatterplot of monthly 925 hPa U wind in Nicaragua versus V wind in Panama over 1980-2024 (arrows in (b)). (d) Composite top-10 height section of zonal wind anomalies (m/s) west of Nicaragua during east La Niña. Note that small vectors and neutral shading are insignificant.
Atmosphere 16 00485 g004
Disclaimer/Publisher’s Note: The statements, opinions and data contained in all publications are solely those of the individual author(s) and contributor(s) and not of MDPI and/or the editor(s). MDPI and/or the editor(s) disclaim responsibility for any injury to people or property resulting from any ideas, methods, instructions or products referred to in the content.

