Article

The Spatiotemporal Variation Trends of Major Air Pollutants in Beijing from 2014 to 2023

Department of Building Environment and Energy Engineering, School of Future Cities, University of Science and Technology Beijing, Beijing 100083, China
*
Author to whom correspondence should be addressed.
Atmosphere 2025, 16(5), 494; https://doi.org/10.3390/atmos16050494
Submission received: 17 March 2025 / Revised: 19 April 2025 / Accepted: 22 April 2025 / Published: 24 April 2025
(This article belongs to the Section Air Quality)

Abstract

:
Based on the hourly concentration data of PM2.5, PM10, SO2, NO2, CO, and O3 from 35 environmental monitoring sites in Beijing between 1 January 2014 and 31 December 2023, this paper investigated the annual average concentration variation of these pollutants, the differences between regions, and the factors influencing these changes and differences. Seasonal variations in the pollutants are examined through monthly average concentrations, and Pearson correlation coefficients are used to study their relationships. The results are as follows: (1) Over the past decade, the concentrations of PM2.5, PM10, SO2, NO2, and CO have decreased by −67.5%, −58.6%, −81.4%, −51.9%, and −59.3%, respectively, indicating significant progress in controlling these pollutants. However, O3 fluctuates significantly between 57 μg/m3 and 66 μg/m3, suggesting the need to improve O3 management. (2) Air pollution levels exhibit distinct spatial variations, with better air quality in mountainous and suburban areas compared to more heavily trafficked urban zones, emphasizing the need for localized control strategies. (3) The correlation coefficients between PM2.5, PM10, SO2, NO2, and CO all exceeded 0.90, indicating strong positive correlations. In contrast, O3 showed negative correlations with these five pollutants, with its most pronounced negative correlation being NO2.

1. Introduction

With the continuous advancement of urbanization and industrialization, the rapid economic development of Beijing has improved residents’ quality of life while also leading to substantial fossil fuel consumption and severe environmental pollution [1,2,3]. Among these issues, air pollution has become particularly prominent and is a major concern for society [4,5,6,7,8]. Major air pollutants include fine particles (PM2.5), inhalable particles (PM10), sulfur dioxide (SO2), nitrogen dioxide (NO2), carbon monoxide (CO), and ozone (O3). Pollution sources can be categorized into natural and anthropogenic sources, with the latter primarily including industrial production, transportation, combustion activities, and waste disposal [9,10,11,12,13]. Numerous studies have shown that air pollutants can negatively impact human health. PM2.5 and PM10 can penetrate the respiratory system, causing inflammation, worsening conditions like asthma and chronic obstructive pulmonary disease (COPD), and increasing the risk of heart disease and lung cancer [14,15,16,17]. SO2, NO2, and O3 irritate the respiratory system, reduce lung function, and contribute to chronic diseases like bronchitis, asthma, and cardiovascular problems [18,19,20,21]. CO reduces oxygen transport in the blood, leading to symptoms like headaches and fatigue, as well as poisoning that affects the heart and brain in severe cases [22,23]. Additionally, air pollution can have significant adverse effects on economic development. Increased healthcare expenditures arise from the treatment of pollution-related illnesses, placing a burden on public health systems and diverting resources from other sectors [24,25]. Moreover, reduced labor productivity due to health issues and rising costs for environmental management and pollution mitigation efforts further hinder economic growth and stability [26,27,28].
As the core region of the Beijing–Tianjin–Hebei economic zone, Beijing faces a complex and severe air pollution problem, attracting extensive academic research [29,30,31]. One paper analyzed the daily average concentrations of six major pollutants in Beijing over ten days before, during, and after the APEC summit [29]. The results indicated that air quality significantly improved during the summit due to strict control measures such as alternating odd–even vehicle restrictions, industrial shutdowns, construction halts, and environmental supervision. However, pollution levels rebounded after these measures were lifted. Additionally, researchers have examined the evolution trends and pollution characteristics of PM2.5 and O3 in Beijing from 2013 to 2020 [30]. The study found that due to energy restructuring and the removal of heavily polluting industries in the Beijing–Tianjin–Hebei region, both local emissions and external inputs declined, leading to a yearly decrease in the frequency, duration, and peak concentration of PM2.5 pollution, especially in autumn and winter. In contrast, O3 pollution showed no clear interannual trend but exhibited marked seasonal differences, with summer conditions favoring its formation and winter conditions inhibiting it. Another study analyzed PM2.5 pollution characteristics and improvement factors in Beijing from 2018 to 2020 [31], showing a substantial decline in PM2.5 concentrations over the three years. By 2017, the Beijing government had gradually shut down a large number of polluting enterprises, most of which were located in the southern part of the city. This led to a shift from the original pollution pattern, characterized by higher concentrations in the south and lower concentrations in the north, toward a more regionally balanced distribution. However, heavy pollution events still mainly occurred during the heating season in autumn and winter, and continued emission reduction efforts were identified as the key driver behind the annual decline in PM2.5 concentrations. Despite these findings, existing studies still have limitations in terms of data time span, pollutant coverage, and exploration of correlations between pollutants. Therefore, it is necessary to further investigate the spatiotemporal evolution trends and influencing factors of major air pollutants in Beijing in recent years, particularly with the implementation of the Air Pollution Prevention and Control Action Plan. Moreover, exploring the potential interrelationships among these six key pollutants is of significant importance.
Based on hourly air pollutant monitoring data from 1 January 2014 to 31 December 2023, this study systematically analyzed the concentration trends of major air pollutants in Beijing over the past decade. This study examined the annual and monthly variations, as well as regional differences of each pollutant, and investigated the driving factors behind these changes and disparities, considering policy measures, seasonal variations, and heating methods. Additionally, the Pearson correlation coefficient analysis is employed to quantitatively assess the relationships among the six major air pollutants, aiming to achieve a comprehensive understanding of their interconnections. This study contributes to a deeper understanding of air quality trends in Beijing and provides scientific evidence and decision-making support for future air pollution control policies and environmental quality improvement.

2. Materials and Methods

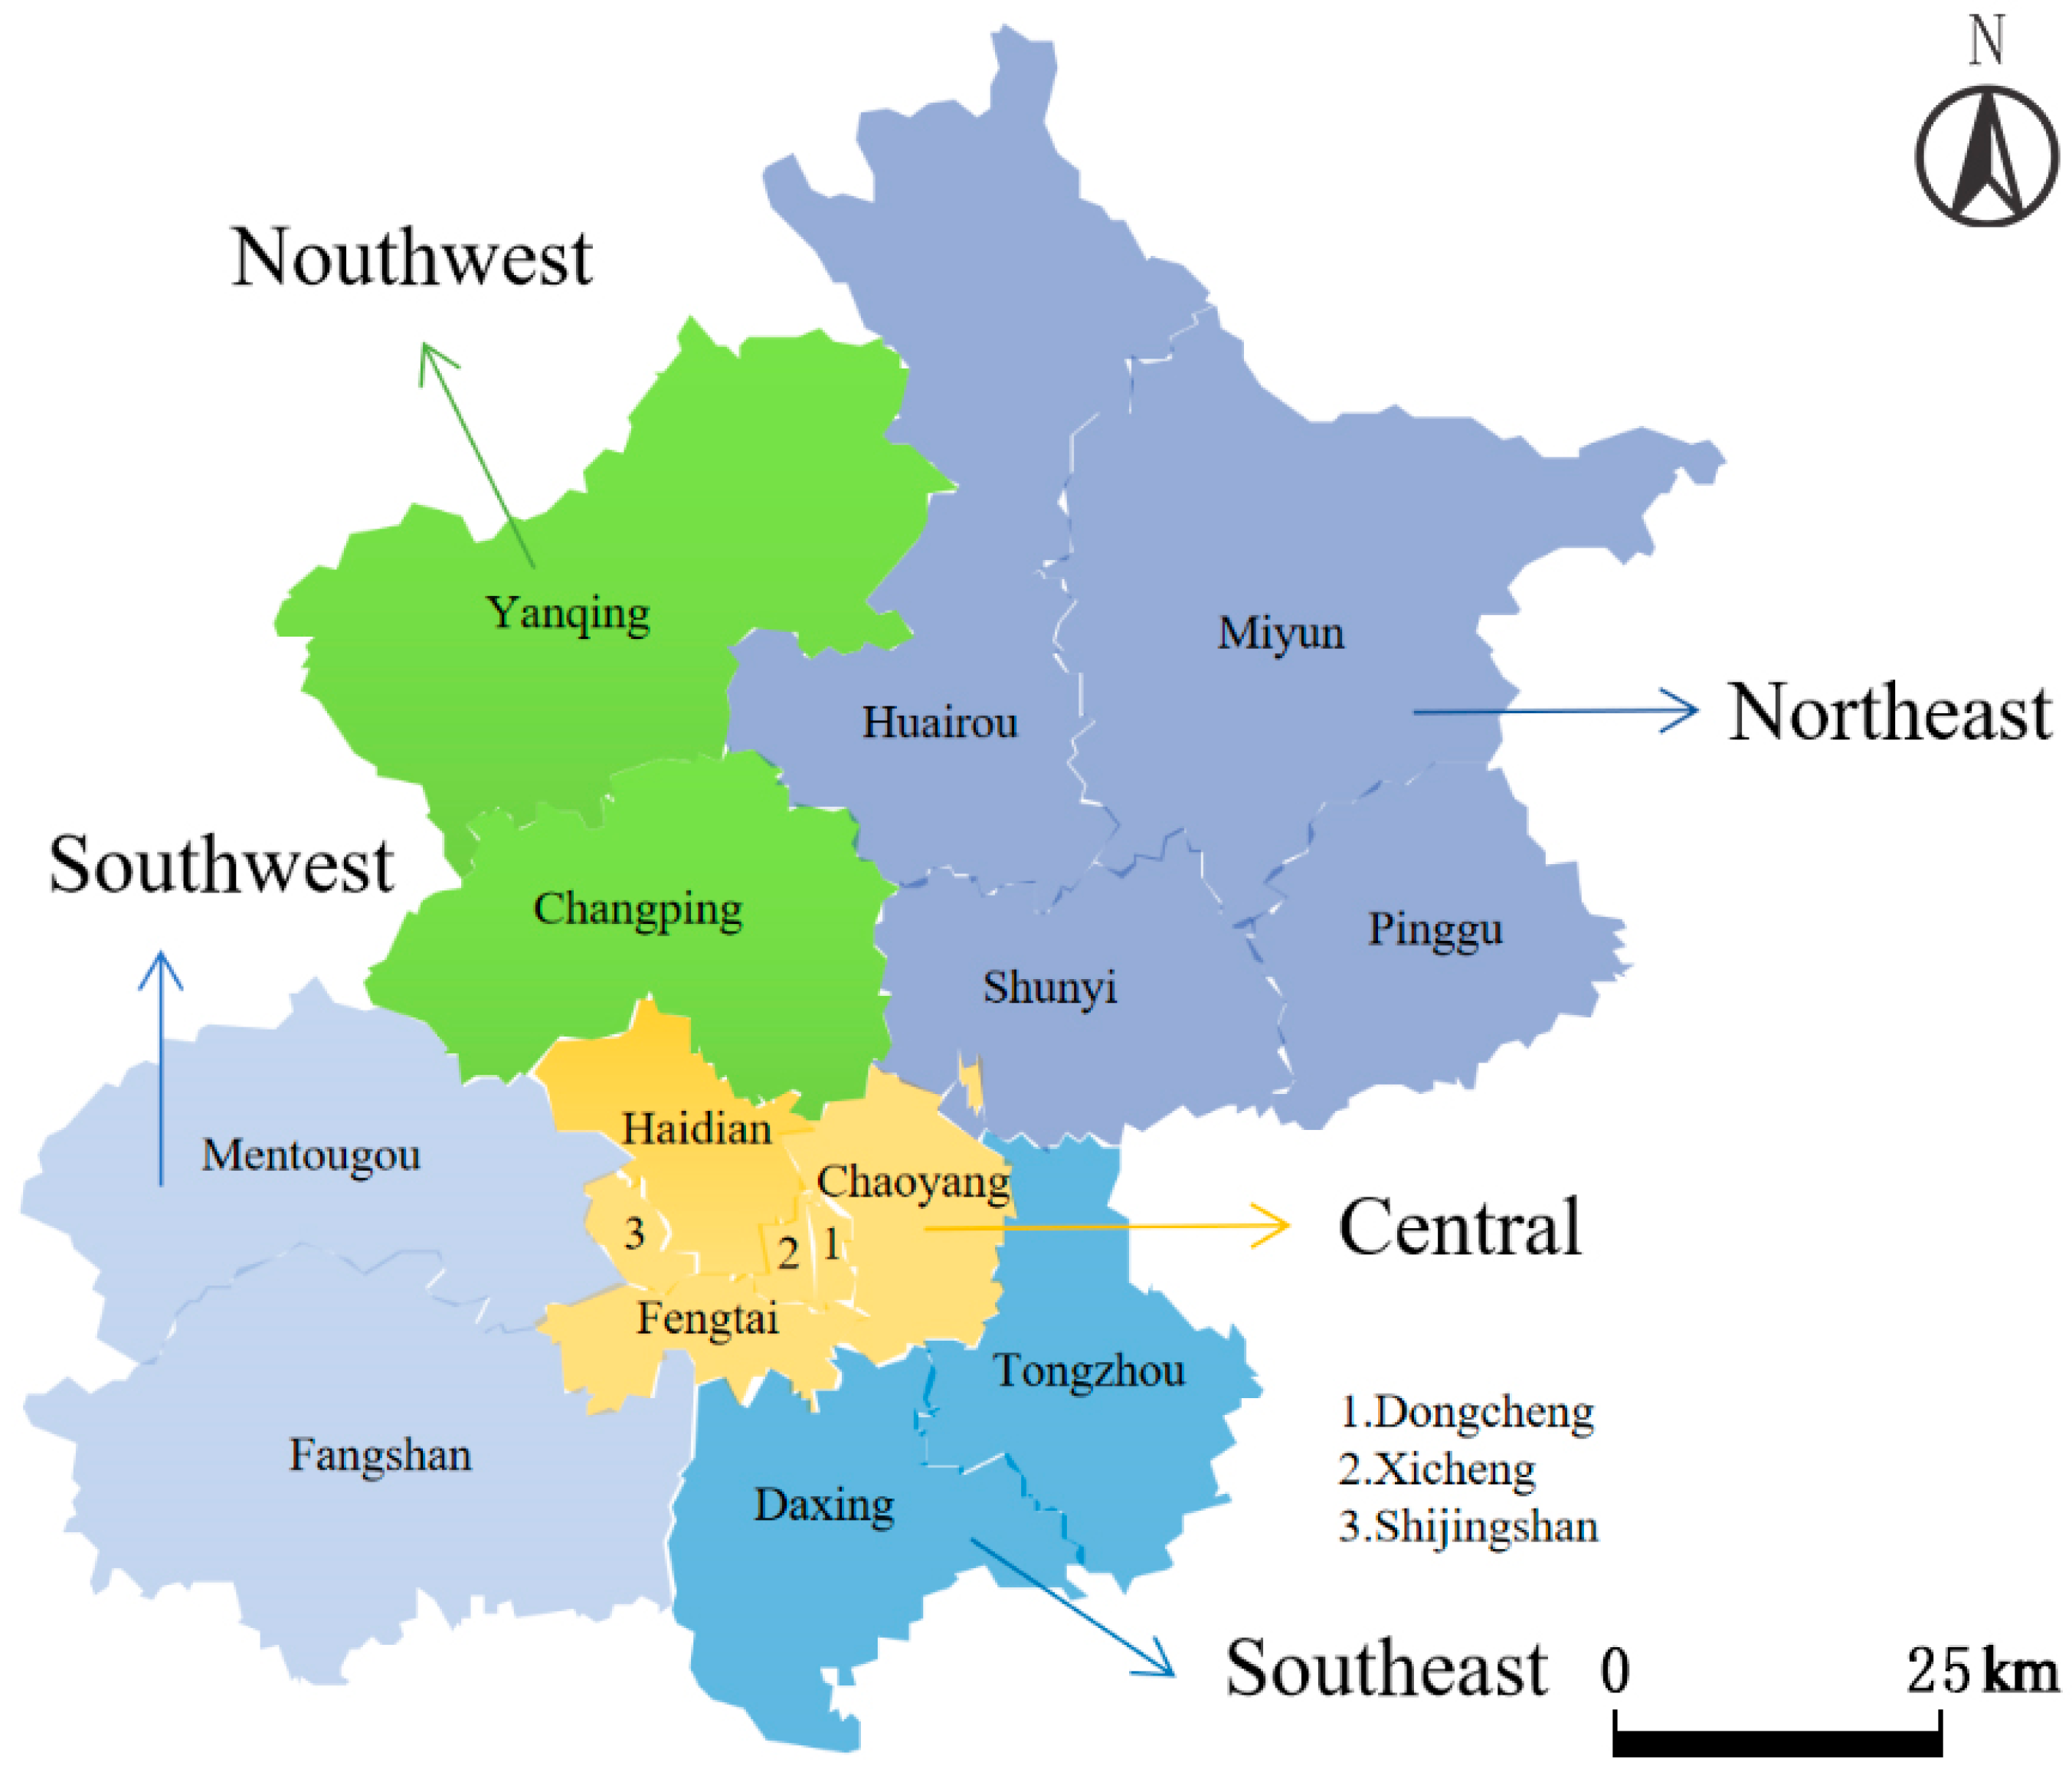
2.1. Overview of Beijing

Beijing, the capital of China and its political and cultural center, is located in the northern part of the North China Plain. The city’s terrain is higher in the northwest and lower in the southeast, forming a semi-basin with an overall tilt from northwest to southeast. The landforms of the city are primarily composed of two major units, the northwest mountainous area and the southeast plain, covering a total area of approximately 16,410 square kilometers. Beijing has distinct seasons, with cold and dry winters and hot and humid summers.

2.2. Data Sources

The data for this study were sourced from the Beijing Municipal Ecology and Environment Bureau and the Beijing Municipal Environmental Monitoring Center. It includes air quality data from 35 monitoring stations before the site adjustment (1 January 2014–19 January 2021), which comprised 12 urban monitoring stations, 11 suburban monitoring stations, 7 background and regional monitoring stations, and 5 traffic pollution monitoring stations. Additionally, it includes data from the 35 monitoring stations after the site adjustment (23 January 2021–31 December 2023), which were distributed across 6 urban districts (12 stations), the northwest region (5 stations), the northeast region (8 stations), the southeast region (6 stations), and the southwest region (4 stations). The monitoring data from each station covered six key air pollutant indicators: PM2.5, PM10, SO2, NO2, CO, and O3. The spatial distribution of the monitoring stations is shown in Figure 1.

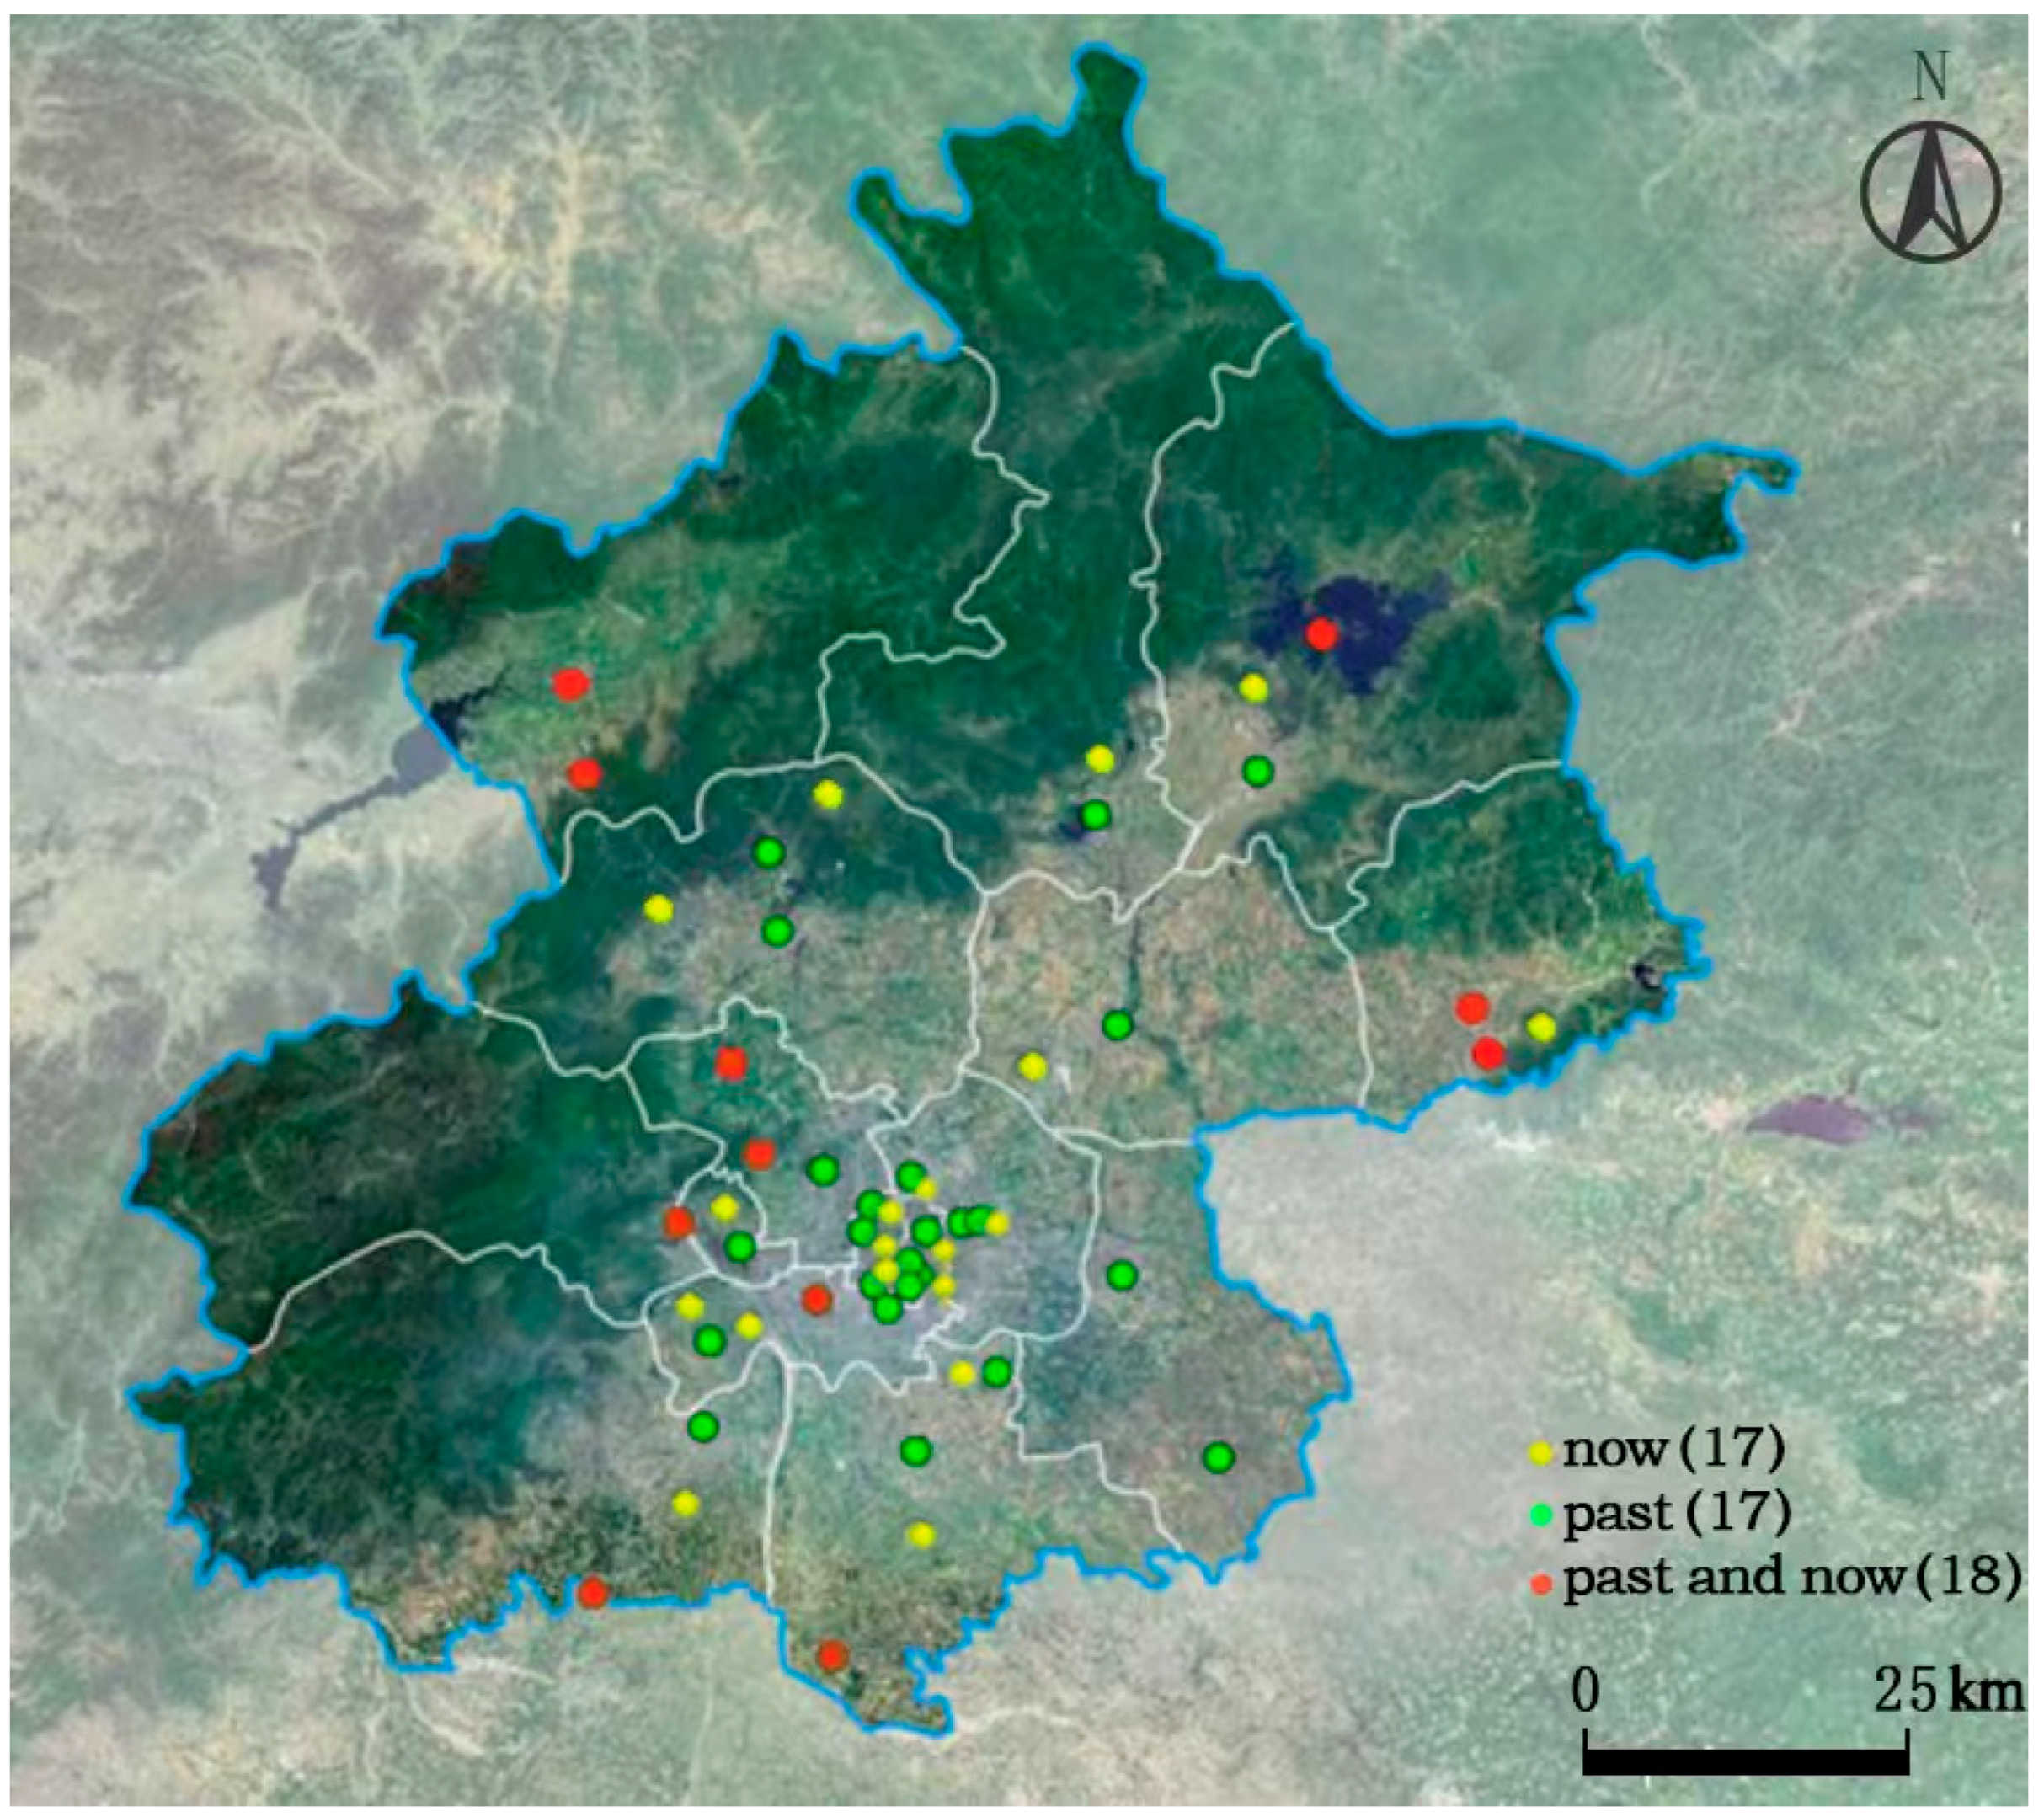
2.3. Measurement Method and Monitoring Points

According to the Ambient Air Quality Standards (GB 3095-2012) [32], the concentration of the six pollutants was recorded using the following methods: PM2.5 and PM10 were measured using the micro-oscillating balance method and the β-ray attenuation method; SO2 was measured using the ultraviolet fluorescence method and the differential optical absorption spectroscopy (DOAS) method; NO2 was measured using the chemiluminescence method and the DOAS method; CO was measured using the gas filter correlation infrared absorption method and the non-dispersive infrared absorption method; and O3 was measured using the ultraviolet fluorescence method and the DOAS method.
The setup of each monitoring substation complies with the site selection principles and technical requirements outlined in the Technical Specifications for the Technical Regulation for Selection of Ambient Air Quality Monitoring Stations (on trial) [33] (HJ 664-2013). The geographical locations of the monitoring stations cover urban built-up areas, suburban areas, traffic pollution sites, industrial pollution sites, and background sites, ensuring a comprehensive representation of air pollutant sources related to population density, traffic emissions, and industrial pollution.

2.4. Evaluation Analysis

Based on Beijing’s administrative divisions, the city can be divided into five main regions: the Six Central Districts, the Northwest, the Northeast, the Southwest, and the Southeast (see Figure 2). The Six Central Districts are located in the city center, with flat terrain and extremely high population density, serving as the political, economic, and cultural core. The climate has distinct four seasons, with hot summers and cold winters. The Northwest, including Yanqing and Changping, has mountainous terrain and lower population density. The climate is cool, with more snowfall in winter. The Northeast, including Huairou, Miyun, Shunyi, and Pinggu, consists of mainly plains and hills, with lower population density. The climate has distinct four seasons, with cold winters, making it suitable for agricultural development. The Southwest, including Mentougou and Fangshan, is mountainous with fewer residents. The climate is cold, and summers are cool. The Southeast, including Daxing and Tongzhou, has flat terrain and a gradually increasing population. The climate is humid, with cold winters, making it suitable for urban expansion.
This article first explores the annual average concentration changes of major air pollutants in the city from 2014 to 2023 and the factors influencing these trends. Next, it analyzes the monthly average concentration changes of the major air pollutants over the past decade and identifies their seasonal differences. Finally, SPSS Statistics 26 software is used to evaluate the Pearson correlation between the six pollutants.
Pearson Correlation Analysis is a statistical method used to measure the linear correlation between two variables. The key metric is the Pearson correlation coefficient, calculated using the following formula:
r = ( X i X ¯ ) ( Y i Y ¯ ) ( X i X ¯ ) 2 · ( Y i Y ¯ ) 2
In this formula, X i and Y i represent the observed values of the variables, and X ¯ and Y ¯ are their respective means.

3. Results

3.1. Annual Variation Trends and Analysis of Major Air Pollutant Concentrations in Beijing

The annual average concentrations of major air pollutants in Beijing during 2014–2023 are summarized in Table 1. All particulate and gaseous pollutants exhibited statistically significant declining trends, with PM2.5 showing the steepest reduction at −9.3% per year (95% CI: −10.0 to −8.6), decreasing from 92.9 μg/m3 to 35.1 μg/m3 (−67.5% total change). Notably, PM2.5 concentrations reached their lowest level in 2022 (30.2 μg/m3) before a slight rebound to 35.1 μg/m3 in 2023. PM10 concentrations declined by −6.2% annually (95% CI: −7.1 to −5.3), showing accelerated reduction after 2019 with annual decreases exceeding 10 μg/m3, reaching 73.4 μg/m3 in 2023 from 130.9 μg/m3 in 2014. Gaseous pollutants demonstrated varying reduction rates: SO2 decreased most rapidly at −15.4% per year (95% CI: −17.5 to −13.3), maintaining consistent downward progression despite a temporary increase from 14.3 to 14.5 μg/m3 between 2014 and 2015, falling from 14.3 μg/m3 to 2.7 μg/m3 (−81.4% total). NO2 declined by −7.8% annually (95% CI: −8.4 to −7.2), with particularly sharp drops observed from 2019 (36.7 μg/m3) to 2021 (25.5 μg/m3), reducing from 51.8 μg/m3 to 24.9 μg/m3 (−51.9% total), while CO decreased −8.1% per year (95% CI: −8.9 to −7.3) throughout the decade without interannual increases, from 1.18 mg/m3 to 0.48 mg/m3 (−59.3% total). In contrast, ozone (O3) showed no statistically significant trend (+0.5% per year), peaking at 65.3 μg/m3 in both 2022 and 2023 after reaching a decade-low concentration of 57.1 μg/m3 in 2021, with concentrations fluctuating between 57.1 μg/m3 (2021) and 65.3 μg/m3 (2022–2023).

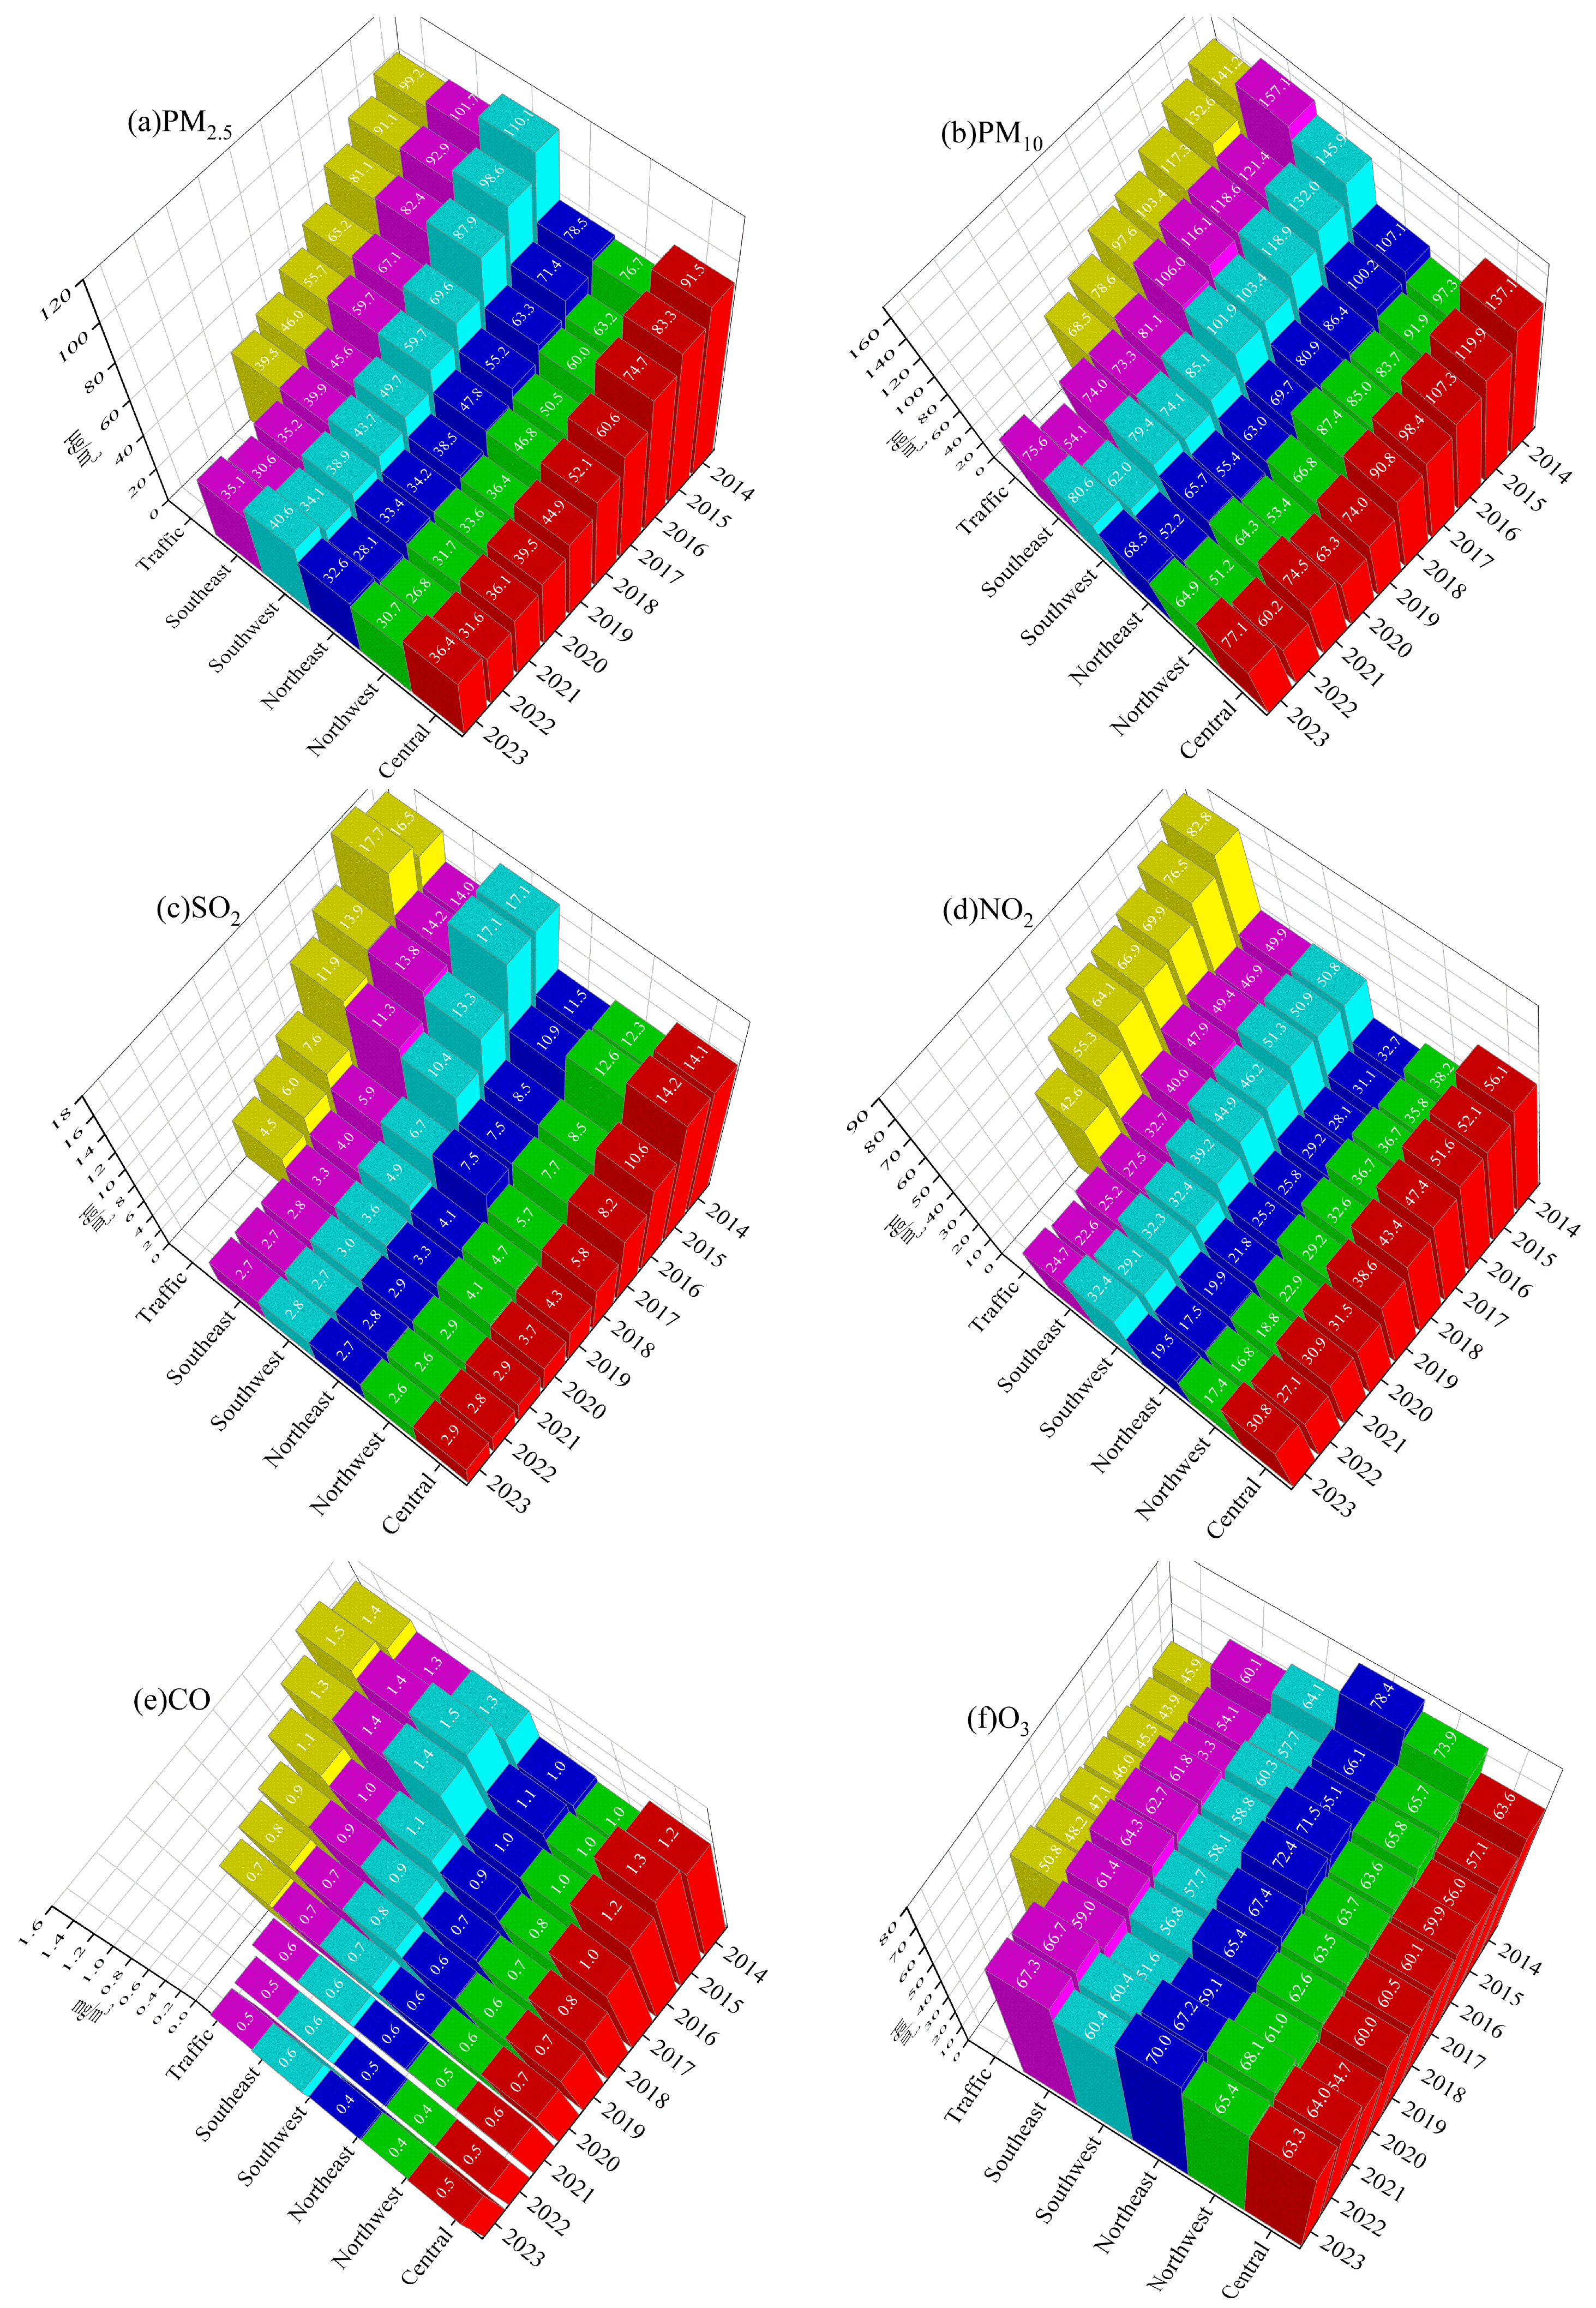
3.2. The Annual Average Concentrations of Major Air Pollutants in the Five Study Regions and One Traffic Monitoring Area

To visually examine the differences in the annual average concentrations of major air pollutants across the five study regions of Beijing, the concentrations of the six pollutants are presented in a three-dimensional graph shown in Figure 3. A detailed analysis is provided in the following section.
In the six central urban districts from 2014 to 2019, the annual average concentrations of PM2.5 and PM10 decreased by 46.6 μg/m3 and 63.1 μg/m3, with reduction rates of 50.9% and 46.0%, respectively. Notably, during the COVID-19 pandemic (2020–2022), PM2.5 and PM10 concentrations remained around the secondary limit values stipulated in the Ambient Air Quality Standards (GB 3095-2012) (35 μg/m3 and 70 μg/m3, respectively), which apply to residential, commercial–traffic mixed, cultural, industrial, and rural areas. Additionally, the annual average concentrations of SO2 and NO2 in the six central urban districts significantly declined. SO2 levels remained well below the more stringent primary limit (20 μg/m3), while NO2 concentrations fell below the secondary limit (40 μg/m3) starting in 2019 (38.6 μg/m3). The annual average CO concentration exhibited a general downward trend, decreasing by approximately 0.1 mg/m3 per year from 2015 to 2022. Although the annual average O3 concentration fluctuated around 60 μg/m3, it reached a low point in 2021.
The regions in the northwest and in the northeast share similar topographical features and exhibited similar trends in pollutant variations. From 2014 to 2019, the annual average concentrations of PM2.5 in these two regions decreased by 40.1 μg/m3 and 40.0 μg/m3, with reduction rates of 52.3% and 51.0%, respectively. The annual average concentrations of PM10 in these regions decreased by 30.5 μg/m3 and 44.1 μg/m3, with reduction rates of 31.3% and 41.2%. From 2020 to 2023, the annual average concentrations of PM2.5 and PM10 in these regions remained below the secondary limit values. Furthermore, during this ten-year period, the annual average concentrations of SO2 in these regions generally declined, with reductions of 9.7 μg/m3 and 8.8 μg/m3, and reduction rates of 78.9% and 76.5%, respectively. The annual average concentrations of SO2 in these regions peaked in 2015, followed by a significant decline in 2016, after which the concentrations remained at single-digit levels. The annual average concentrations of NO2 in these regions decreased slowly during the same period, with reductions of 20.8 μg/m3 and 13.2 μg/m3, corresponding to reduction rates of 54.5% and 40.4%. From 2014 to 2023, the annual average CO concentrations in these regions showed a slow downward trend, decreasing by approximately 0.6 μg/m3, with a reduction rate of around 60.0%. The annual average concentrations of O3 in these regions were relatively high, especially between 2014 and 2020, fluctuating around 60 μg/m3 for most of the time. These data suggest that, despite the geographic and demographic differences of these two regions, significant progress has been made in improving air quality. Except for O3, the concentrations of the other five major pollutants are notably lower in these regions compared to others.
The areas in the southwest and in the southeast exhibited similar air quality characteristics. From 2014 to 2019, both regions showed a significant and steady decline in the annual average concentrations of PM2.5 and PM10. Specifically, the annual average PM2.5 concentrations decreased by 60.4 μg/m3 and 56.1 μg/m3, with reductions of 54.9% and 55.2%, respectively. The annual average PM10 concentrations decreased by 60.8 μg/m3 and 76.0 μg/m3, with reductions of 48.4% and 55.2%, respectively. From 2020 to 2022, the annual average concentrations of PM2.5 and PM10 in these two regions remained around the secondary limit values. However, in 2023, they showed a significant upward trend and exceeded the secondary limit values. Notably, the annual average concentrations of PM2.5 and PM10 in these two regions are relatively higher compared to other regions. Between 2014 and 2019, the annual average SO2 concentrations in both regions saw a significant decline, dropping by 12.2 μg/m3 and 10.0 μg/m3, with reductions of 71.3% and 71.4%, respectively, and then remained low, around 3 μg/m3, in the subsequent four years. In contrast, the decline in NO2 annual concentrations was more gradual, with reductions of 11.6 μg/m3 and 17.2 μg/m3, or 22.8% and 34.5%, respectively. Notably, after 2019, the annual average NO2 concentrations in both regions remained below the secondary limit values. The annual average CO concentrations in both regions peaked in 2015, at 1.5 mg/m3 and 1.4 mg/m3, respectively. However, the CO annual concentrations were controlled below 0.7 mg/m3 by 2020 and beyond. Like other regions, the annual average O3 concentrations in the southwest and southeast regions did not show significant changes, fluctuating around 60 μg/m3.
The traffic pollution monitoring points are located in areas of the main urban districts with high traffic flow, dense transportation, and where pollutants are prone to accumulation. From 2014 to 2020, the annual average concentrations of PM2.5 and PM10 in the traffic pollution monitoring area decreased by 59.7 μg/m3 and 72.7 μg/m3, respectively, representing reductions of 60.2% and 51.5%. Additionally, the annual average concentration of SO2 decreased from 17.7 μg/m3 in 2015 to 4.5 μg/m3 in 2020, a decline of 13.2 μg/m3, or 74.6%. Compared to the six central urban districts, the traffic pollution monitoring area saw a notable difference in the annual average concentrations of NO2 and CO from 2014 to 2020, with this difference gradually decreasing over the years. Specifically, the difference in the annual average NO2 concentrations between the two areas decreased from 26.7 μg/m3 in 2014 to 11.1 μg/m3 in 2020, while the difference in CO concentrations decreased from 0.2 mg/m3 in 2014 to below 0.1 mg/m3 in 2020. However, in recent years, the O3 concentration in the traffic pollution monitoring area has remained around 47 μg/m3, which is lower than in the six central urban districts and other regions.

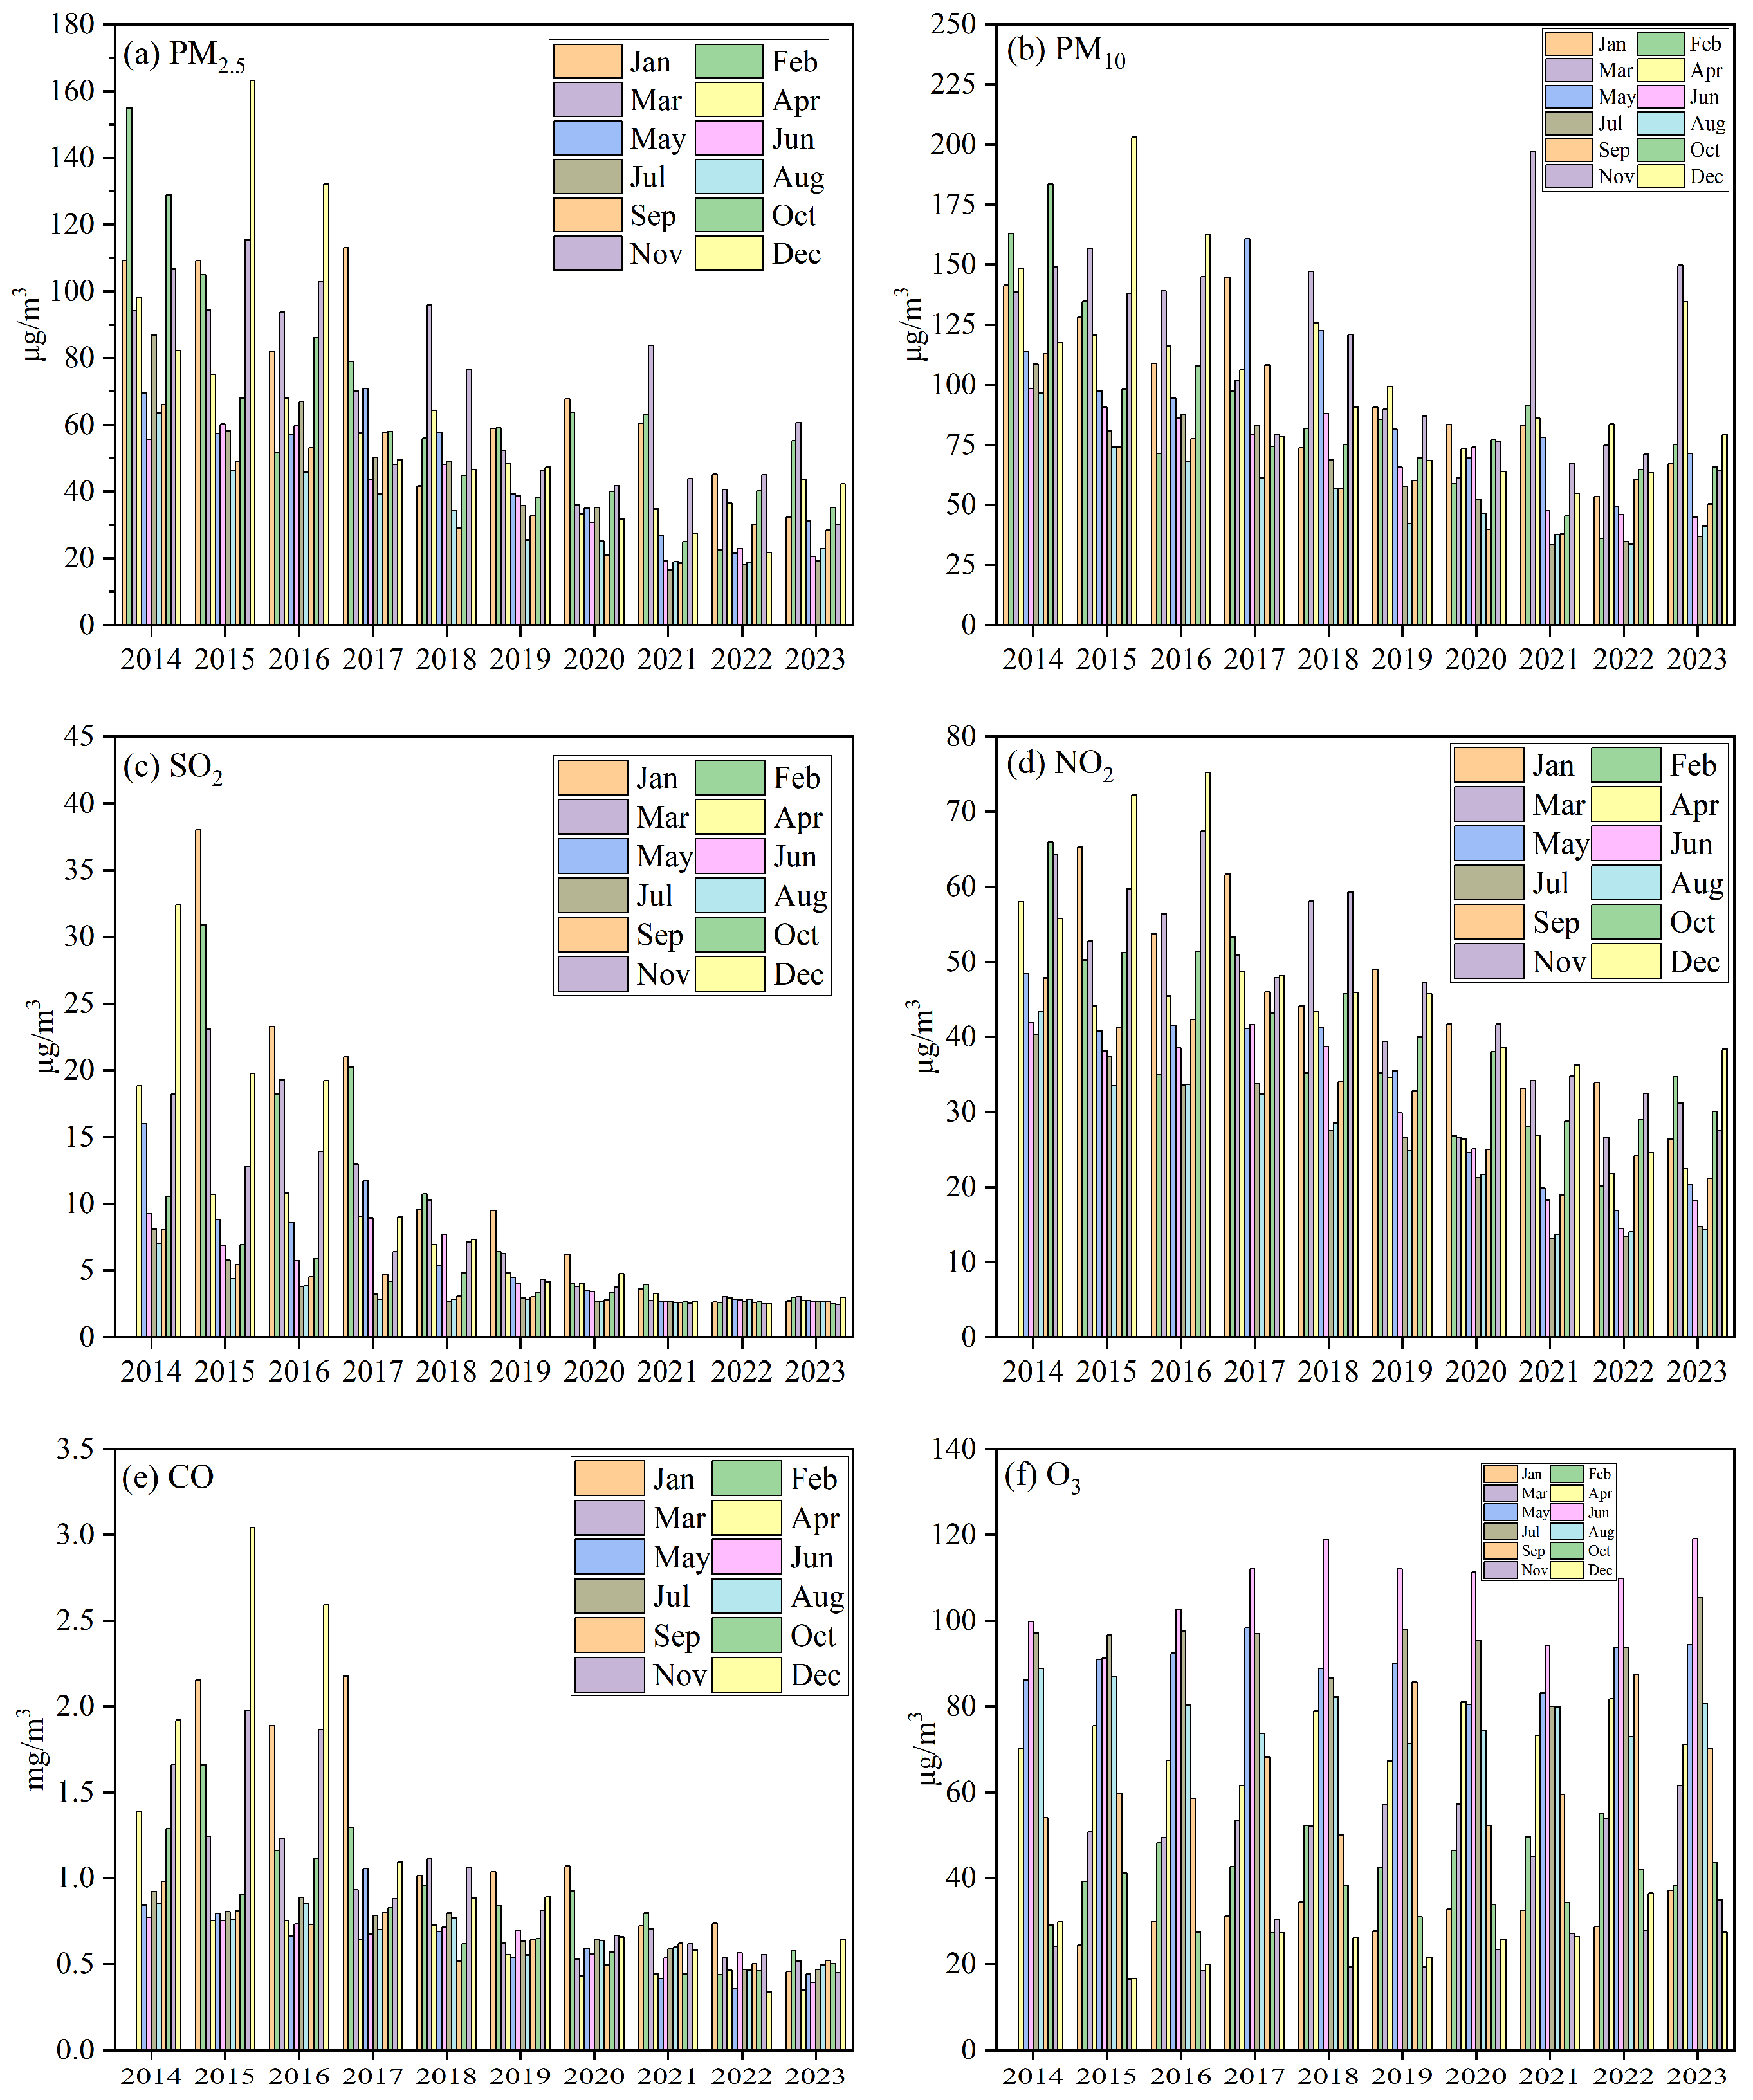
3.3. The Monthly Average Concentration Trends and Analysis of Major Air Pollutants in the Whole City

The monthly average concentrations of major air pollutants in Beijing from 2014 to 2023 are shown in Figure 4, with the analysis as follows:
The monthly average concentration of PM2.5 exhibits a clear seasonal pattern characterized by “high in spring and winter, low in summer and autumn”. Specifically, concentrations tend to peak during spring (March–April) and winter (December–February), with monthly averages often exceeding 60 μg/m3. However, the peak values have shown a generally declining trend over the years. In contrast, during summer (May–September) and autumn (October–November), PM2.5 concentrations typically fall below 70 μg/m3, forming annual troughs that have also declined year by year. Nevertheless, abnormally high monthly averages of PM2.5 are occasionally observed in certain months. The variation trend of PM10 concentrations is generally consistent with that of PM2.5. However, PM10 exhibits more pronounced fluctuations in spring. March or December is often the peak month of the year, with monthly averages approaching 150 μg/m3. The lowest concentrations occur in summer, generally ranging between 30 and 100 μg/m3. Notably, in December 2015, March 2021, as well as March and April 2023, PM10 levels were significantly higher than in other months.
The monthly average concentration of SO2 showed a distinct “high in winter, low in other seasons” pattern between 2014 and 2020. During winter, monthly averages frequently exceeded 15 μg/m3, with individual months (e.g., January 2015) approaching 40 μg/m3. In contrast, monthly averages in other seasons typically ranged from 5 to 10 μg/m3. However, from 2021 to 2023, monthly variations became minimal and concentrations across all months, including winter, were generally below 5 μg/m3. The monthly average concentration of CO followed a similar trend to that of SO2. Prior to 2020, peak monthly averages commonly exceeded 1.0 mg/m3, with certain months (e.g., January and December 2015, December 2016, and January 2017) surpassing 2.0 mg/m3. Throughout the decade, summer and autumn concentrations generally ranged between 0.5 and 1.0 mg/m3. The monthly average concentration of NO2 was highest in winter and spring, particularly in January and December, with peak values exceeding 70 μg/m3 in some years. In contrast, concentrations significantly decreased in summer, especially in July and August, sometimes dropping to as low as 20–30 μg/m3, with notable fluctuations.
Unlike the other pollutants, O3 displayed a distinct seasonal pattern of “high in summer and autumn, low in winter and spring” each year. June or July was typically the peak month, with monthly averages between 90 and 120 μg/m3. In contrast, January and December were the lowest months, generally falling below 40 μg/m3. The high-concentration period of O3 was mainly concentrated between May and August, characterized by both long duration and high intensity.

3.4. Pearson Correlation Analysis Between the Six Major Pollutants

In order to further investigate the correlations between various pollutants, this section performs Pearson correlation analysis on the annual average concentrations (see Table 2) and monthly average concentrations (see Table 3) of the main air pollutants in Beijing, to reveal the degree of association between the six pollutants. Based on the correlation coefficients, the correlations are categorized into six different levels: strong positive correlation (1.000–0.500), moderate positive correlation (0.499–0.300), weak positive correlation (0.299–0.000), weak negative correlation (−0.001 to −0.300), moderate negative correlation (−0.301 to −0.500), and strong negative correlation (−0.501 to −1.000). The detailed analysis is as follows:
PM2.5 shows a strong positive correlation with PM10, SO2, NO2, and CO. In the annual average concentration analysis, the correlation coefficients between PM2.5 and PM10, SO2, NO2, and CO are 0.974, 0.990, 0.943, and 0.965, respectively, while in the monthly average concentration analysis, the correlation coefficients are 0.974, 0.961, 0.947, and 0.921, respectively. SO2 also shows a strong correlation with PM2.5, PM10, NO2, and CO—especially with PM2.5—with correlation coefficients of 0.990 and 0.961 in the annual and monthly concentration analyses, respectively. NO2 also demonstrates a strong correlation with other pollutants, particularly with SO2, with correlation coefficients of 0.941 in both the annual and monthly analyses. CO shows a strong correlation with PM2.5, PM10, SO2, and NO2—especially with SO2—with correlation coefficients of 0.981 and 0.953 in the annual and monthly analyses, respectively. O3, in contrast, exhibits weaker correlations with other pollutants, particularly with PM2.5, PM10, SO2, NO2, and CO, with relatively low correlation coefficients. In both the annual and monthly analyses, O3 shows a weak negative correlation with these pollutants, especially with PM2.5, with correlation coefficients of −0.207 (annual) and −0.237 (monthly).

4. Discussion

4.1. Effectiveness of Air Pollutant Control in Beijing

From 2014 to 2023, the overall air quality in Beijing has shown a continuous improvement trend, reflecting the significant effectiveness of environmental governance policies and measures. The concentrations of PM2.5, PM10, SO2, NO2, and CO have decreased by 62.7 μg/m3 (−67.5%), 76.7 μg/m3 (−58.6%), 11.8 μg/m3 (−81.4%), 26.9 μg/m3 (−51.9%), and 0.70 mg/m3 (−59.3%), respectively, indicating substantial progress in controlling these pollutants. In particular, the sharp decline in coal-related pollutants such as SO2 and CO highlights the effectiveness of measures like clean heating, coal-to-electricity and coal-to-gas transitions, and industrial emission controls [34,35,36,37]. However, the concentrations of PM2.5 and PM10 began to rebound in 2023 and 2022, respectively. Notably, the increase in PM10 in 2023 was more pronounced, which may be closely related to Beijing’s economic recovery in the post-pandemic era [38]. In addition, the seasonal fluctuations of pollutant concentrations, as observed from monthly averages, have gradually weakened over the years, and peak values have declined, further demonstrating the effectiveness of air pollution control in Beijing. However, the concentration of O3 has not decreased, and its harmful effects have not received sufficient attention [39].

4.2. Influencing Factors on Changes in Pollutant Concentrations

The spatial and temporal variations of pollutant concentrations in Beijing are influenced by a combination of natural and anthropogenic factors. Located in the northern part of the North China Plain, Beijing is surrounded by mountains on three sides and open to the southeast, forming a “semi-enclosed” terrain that is unfavorable for pollutant dispersion. This is particularly evident during winter and spring, when stagnant weather conditions and temperature inversions lead to the accumulation of particulate matter such as PM2.5 and PM10 [38]. Low wind speeds hinder pollutant dispersion, while high humidity can promote the formation of secondary aerosols [40]. The central urban areas and major traffic corridors, characterized by high population density and heavy traffic, are major emission sources of NO2 and CO. However, in recent years, the implementation of stricter vehicle emission standards, the elimination of bulk coal usage, and industrial restructuring have contributed to the continuous decline in SO2, NO2 [41,42,43,44], and particulate matter concentrations, highlighting the effectiveness of air quality control measures.
O3 is a typical secondary pollutant, primarily formed through complex photochemical reactions between nitrogen oxides (NOx) and volatile organic compounds (VOCs) under intense sunlight during summer [45]. Additionally, during high-pollution days under photochemical smog conditions, CO can indirectly promote O3 formation by reacting with hydroxyl radicals (OH). Although CO generally tends to deplete O3 under typical conditions, its role in promoting O3 formation under conditions of high temperature, strong sunlight, and elevated precursor concentrations should not be overlooked [46,47].

4.3. Analysis of Interrelationships Among Pollutants

Pearson correlation analysis indicates significant interrelationships among major air pollutants in Beijing. PM2.5 shows a strong positive correlation with PM10, SO2, NO2, and CO, suggesting that these pollutants may originate from common sources such as vehicle emissions, coal combustion, and industrial activities [48]. Notably, the annual correlation coefficient between PM2.5 and SO2 reaches as high as 0.990, indicating that both are similarly affected by changes in energy structure and clean heating policies. The strong correlations between NO2 and both SO2 and CO further confirm the role of complex pollution sources, such as vehicular traffic and coal burning, in the co-emission of air pollutants [49,50]. In particular, the annual correlation coefficient between CO and SO2 reaches 0.981, highlighting their close association with inefficient combustion processes [51].
In contrast, O3 exhibits a weak negative correlation with other pollutants, especially with PM2.5, where the annual correlation coefficient is −0.207. This is because the formation mechanism of O3 differs from that of other primary pollutants, relying primarily on photochemical reactions between VOCs and NOx under strong sunlight [52]. As PM2.5 can absorb or block ultraviolet rays, it affects the intensity of the photochemical reaction and indirectly inhibits O3 formation, leading to a negative correlation during certain periods.

5. Conclusions

This study analyzed the temporal and spatial variations, seasonal characteristics, and interrelationships of six major air pollutants in Beijing from 2014 to 2023. The main conclusions are as follows:
  • Significant decline in primary pollutant concentrations: Concentrations of PM2.5, PM10, SO2, NO2, and CO have generally declined year by year. This reflects the effectiveness of Beijing’s pollution control strategies, including stricter emission standards, industrial transformation, and clean energy initiatives.
  • Clear seasonal patterns: PM2.5, PM10, SO2, NO2, and CO exhibit a “high in winter and spring, low in summer and autumn” pattern due to heating emissions and poor dispersion conditions. O3, in contrast, peaks in summer due to strong solar radiation and high temperatures, forming a “summer-high, winter-low” trend.
  • Multiple influencing factors contribute to pollutant variation: Pollution levels are influenced by a combination of topography, meteorological conditions (such as wind speed, temperature, and solar radiation), population density, and traffic emissions. For instance, the basin-like terrain of Beijing restricts pollutant dispersion, while summer weather promotes O3 formation.
  • Strong correlations among primary pollutants; weak negative correlation with O3: PM2.5, PM10, SO2, NO2, and CO are strongly positively correlated, indicating similar sources or co-evolution. O3, however, shows weak negative correlations with these pollutants, highlighting its complex photochemical origin. Although typically anticorrelated with CO, under photochemical smog conditions, CO can contribute to O3 production via oxidation in the presence of NOx and sunlight.

Author Contributions

Conceptualization, Y.X.; Methodology, Y.X.; Formal analysis, J.Z.; Investigation, Y.X. and J.Z.; Writing—original draft, Y.X. and J.Z.; Writing—review & editing, Y.X. and J.Z.; Supervision, Y.X.; Funding acquisition, Y.X. All authors have read and agreed to the published version of the manuscript.

Funding

This research was funded by the National Key Research and Development Plan from the Ministry of Science and Technology of China grant number 2022YFC3702604.

Institutional Review Board Statement

Not applicable.

Informed Consent Statement

Not applicable.

Data Availability Statement

The original contributions presented in this study are included in the article. Further inquiries can be directed to the corresponding author.

Conflicts of Interest

The authors declare no conflict of interest.

References

  1. Li, S.; Feng, K.; Li, M. Identifying the main contributors of air pollution in Beijing. J. Clean. Prod. 2017, 163, S359–S365. [Google Scholar] [CrossRef]
  2. Zhang, W.; Zhang, J.; Wang, F.; Jiang, H.; Wang, J.; Jiang, L. Spatial Agglomeration of Industrial Air Pollutant Emission in Beijing-Tianjin-Hebei Region. Urban Stud. 2017, 24, 81–87. [Google Scholar]
  3. Han, X.; Guo, Q.; Lang, Y.; Li, S.; Li, Y.; Guo, Z.; Hu, J.; Wei, R.; Tian, L.; Wan, Y. Seasonal and long-term trends of sulfate, nitrate, and ammonium in PM2.5 in Beijing: Implication for air pollution control. Environ. Sci. Pollut. Res. 2020, 27, 23730–23741. [Google Scholar] [CrossRef]
  4. Chai, W.; Wang, S.; You, Y.; Hou, Y.; Zhang, T.; Wang, J. Analysis of a typical air pollution process in Beijing based on lidar detection. Chin. J. Quantum Electron. 2019, 36, 93–100. [Google Scholar]
  5. Zhou, X.; Santana Jimenez, Y.; Perez Rodriguez, J.V.; Maria Hernandez, J. Air pollution and tourism demand: A case study of Beijing, China. Int. J. Tour. Res. 2019, 21, 747–757. [Google Scholar] [CrossRef]
  6. Panagi, M.; Fleming, Z.L.; Monks, P.S.; Ashfold, M.J.; Wild, O.; Holaway, M.; Zhang, Q.; Squires, F.A.; Vande Hey, J. Investigating the regional contributions to air pollution in Beijing: A dispersion modelling study using CO as a tracer. Atmos. Chem. Phys. 2020, 20, 2825–2838. [Google Scholar] [CrossRef]
  7. Yang, H.; Lam, J.C.; Victor, O.L.; Reiner, D. A Bayesian LSTM model to evaluate the effects of air pollution control regulations in Beijing, China. Environ. Sci. Policy 2021, 115, 26–34. [Google Scholar]
  8. Zhang, F.; Xu, N.; Wang, L.; Tan, Q. The Effect of Air Pollution on the Healthy Growth of Cities: An Empirical Study of the Beijing-Tianjin-Hebei Region. Appl. Sci. 2020, 10, 3699. [Google Scholar] [CrossRef]
  9. Battista, G.; Vollaro, E.L.; Vollaro, R.L. Analysis of the Main Anthropogenic Sources’ Contribution to Pollutant Emissions in the Lazio Region, Italy. Appl. Sci. 2021, 11, 7936. [Google Scholar] [CrossRef]
  10. Cichowicz, R.; Dobrzanski, M. Analysis of Air Pollution around a CHP Plant: Real Measurements vs. Computer Simulations. Energies 2022, 15, 553. [Google Scholar] [CrossRef]
  11. Lin, J.C.; Fasoli, B.; Mitchell, L.; Bares, R.; Hopkins, F.; Thompson, T.M.; Alvarez, R.A. Towards hyperlocal source identification of pollutants in cities by combining mobile measurements with atmospheric modeling. Atmos. Environ. 2023, 311, 119995. [Google Scholar] [CrossRef]
  12. Luo, Y.; Xu, L.; Li, Z.; Zhou, X.; Zhang, X.; Wang, F.; Peng, J.; Cao, C.; Chen, Z.; Yu, H. Air pollution in heavy industrial cities along the northern slope of the Tianshan Mountains, Xinjiang: Characteristics, meteorological influence, and sources. Environ. Sci. Pollut. Res. 2023, 30, 55092–55111. [Google Scholar] [CrossRef] [PubMed]
  13. Ali-Taleshi, M.S.; Bakhtiari, A.R.; Masiol, M. The possible emission sources and atmospheric photochemical processes of air pollutants in Tehran, Iran: The role of micrometeorological factors on the air quality. Air Qual. Atmos. Health 2024, 17, 525–539. [Google Scholar] [CrossRef]
  14. Kumari, S.; Jain, M.K.; Elumalai, S.P. Assessment of Pollution and Health Risks of Heavy Metals in Particulate Matter and Road Dust Along the Road Network of Dhanbad, India. J. Health Pollut. 2021, 11, 210305. [Google Scholar] [CrossRef]
  15. Kim, J.H.; Lee, S.; Hong, Y. Modification Effect of PARP4 and ERCC1 Gene Polymorphisms on the Relationship between Particulate Matter Exposure and Fasting Glucose Level. Int. J. Environ. Res. Public Health 2022, 19, 6241. [Google Scholar] [CrossRef]
  16. Gou, A.; Tan, G.; Ding, X.; Wang, J.; Lv, X.; Gou, C. Urban-rural difference in the lagged effects of PM2.5 and PM10 on COPD mortality in Chongqing, China. BMC Public Health 2023, 23, 1270. [Google Scholar]
  17. Xie, Y.; Gou, Y.; Ge, A. Effect of Source Emission Control Measures on Source of Atmospheric PM2.5 during “Parade Blue” Period. Atmosphere 2023, 14, 1639. [Google Scholar] [CrossRef]
  18. Xie, Y.; Gao, Y. The health impact of PM2.5 and O3 in Beijing modified by infiltration factors from 2014 to 2022. Environ. Monit. Assess. 2024, 196, 1143. [Google Scholar] [CrossRef]
  19. Hossain, M.S.; Frey, H.C.; Louie, P.K.; Lau, A.K. Combined effects of increased O3 and reduced NO2 concentrations on short-term air pollution health risks in Hong Kong. Environ. Pollut. 2021, 270, 116280. [Google Scholar] [CrossRef]
  20. Lei, R.; Nie, D.; Zhang, S.; Yu, Y.; Ge, X.; Song, N. Spatial and temporal characteristics of air pollutants and their health effects in China during 2019–2020. J. Environ. Manag. 2022, 317, 115460. [Google Scholar] [CrossRef]
  21. Azimi, F.; Hafezi, F.; Ghaderpoori, M.; Kamarehie, B.; Karami, M.A.; Sorooshian, A.; Baghani, A.N. Temporal characteristics and health effects related to NO2, O3, and SO2 in an urban area of Iran. Environ. Pollut. 2024, 349, 123975. [Google Scholar] [CrossRef] [PubMed]
  22. Jadoon, S.; Nawazish, S.; Mahmood, Q.; Rafique, A.; Sohail, S.; Zaidi, A. Exploring Health Impacts of Occupational Exposure to Carbon Monoxide in the Labour Community of Hattar Industrial Estate. Atmosphere 2022, 13, 406. [Google Scholar] [CrossRef]
  23. Hampson, N.B. Carbon monoxide poisoning mortality in the United States from 2015–2021. Clin. Toxicol. 2023, 61, 483–491. [Google Scholar] [CrossRef] [PubMed]
  24. Li, X.; Li, Y. The impact of perceived air pollution on labour supply: Evidence from China. J. Environ. Manag. 2022, 306, 114455. [Google Scholar] [CrossRef]
  25. Zhao, R.; Liang, D.; Pam, Y.; Du, Q. Air Pollution and Employee Protection: The Moderating Effect of Public Attention and Environmental Regulations. Sustainability 2022, 14, 11529. [Google Scholar] [CrossRef]
  26. Zhang, X.; Ma, C.; Li, X.; Xiong, L.; Nie, S. Assessing the Impact of Air Pollution on Inbound Tourism along the Yangtze River across Space and Time. Int. J. Environ. Res. Public Health 2022, 19, 10944. [Google Scholar] [CrossRef]
  27. Niu, Y.; Chen, R.; Kan, H. Air Pollution, Disease Burden, and Health Economic Loss in China. Adv. Exp. Med. Biol. 2017, 1017, 233–242. [Google Scholar]
  28. Hu, Y.; Shen, Y.; Zhou, J.; Gong, J. Air pollution and urban economic growth: A study based on dynamic models. Glob. Nest J. 2024, 26, 06549. [Google Scholar]
  29. Lu, S.; Jiang, Y.; Zhao, Y.; Li, S.; Chen, B. Variation Characteristics of Air Pollutants in Urban Area of Beijing before, during and after 2014 Meeting of APEC. Environ. Sci. Technol. 2017, 40, 40–47. [Google Scholar]
  30. Chen, J.; Peng, J.; Xu, Y. Spatiotemporal Distribution and Health Impacts of PM2.5 and O3 in Beijing, from 2014 to 2020. Chin. J. Environ. Sci. 2021, 42, 4071–4082. [Google Scholar]
  31. Liu, B.; Li, Q.; Sun, R.; Dong, R.; Wang, S.; Hao, J. Pollution Characteristics and Factors Influencing the Reduction in Ambient PM2.5 in Beijing from 2018 to 2020. Chin. J. Environ. Sci. 2023, 44, 2409–2420. [Google Scholar]
  32. GB 3095-2012; Ambient Air Quality Standards. The Ministry of Environmental Protection of the People’s Republic of China: Bejing, China, 2012.
  33. HJ 664-2013; Technical Regulation for Selection of Ambient Air Quality Monitoring Stations (on Trial). The Ministry of Environmental Protection of the People’s Republic of China: Bejing, China, 2013.
  34. Wang, P.; Wang, M.; Zhou, M.; He, J.; Feng, X.; Du, X.; Wang, Y.; Wang, Y. The Benefits of the Clean Heating Plan on Air Quality in the Beijing-Tianjin-Hebei Region. Atmosphere 2022, 13, 555. [Google Scholar] [CrossRef]
  35. Li, B.; Sun, Y.; Zheng, W.; Zhang, H.; Jurasz, J.; Du, T.; Wang, Y. Evaluating the role of clean heating technologies in rural areas in improving the air quality. Appl. Energy 2021, 289, 116693. [Google Scholar] [CrossRef]
  36. Li, F.; Gu, J.; Xin, J.; Schnelle-Kreis, J.; Wang, Y.; Liu, Z.; Shen, R.; Michalke, B.; Abbaszade, G.; Zimmermann, R. Characteristics of chemical profile, sources and PAH toxicity of PM2.5 in beijing in autumn-winter transit season with regard to domestic heating, pollution control measures and meteorology. Chemosphere 2021, 276, 130143. [Google Scholar] [CrossRef]
  37. Niu, Y.; Yan, Y.; Chai, J.; Zhang, X.; Xu, Y.; Duan, X.; Wu, J.; Peng, L. Effects of regional transport from different potential pollution areas on volatile organic compounds (VOCs) in Northern Beijing during non-heating and heating periods. Sci. Total Environ. 2022, 836, 155465. [Google Scholar] [CrossRef]
  38. Wang, Q.; Liu, L. Study on the air pollution and economic growth in the work resumption of the COVID-19. Environ. Dev. Sustain. 2025, 27, 5339–5367. [Google Scholar] [CrossRef]
  39. Li, Y.; Wu, Z.; Ji, Y.; Chen, T.; Li, H.; Gao, R.; Xue, L.; Wang, Y.; Zhao, Y.; Yang, X. Comparison of the ozone formation mechanisms and VOCs apportionment in different ozone pollution episodes in urban Beijing in 2019 and 2020: Insights for ozone pollution control strategies. Sci. Total Environ. 2024, 908, 168332. [Google Scholar] [CrossRef]
  40. Golitsyn, G.S.; Grechko, E.I.; Wang, G.; Wang, P.; Dzhola, A.V.; Emilenko, A.S.; Kopeikin, V.M.; Rakitin, V.S.; Safronov, A.N.; Fokeeva, E.V. Studying the pollution of Moscow and Beijing atmospheres with carbon monoxide and aerosol. Izv. Atmos. Ocean. Phys. 2015, 51, 1–11. [Google Scholar] [CrossRef]
  41. Wang, C.; Miao, X.; Fang, M.; Chen, Y.; Jin, T. The improvement of Beijing ambient air quality resulting from the upgrade of vehicle emission standards. Arch. Environ. Prot. 2024, 50, 109–121. [Google Scholar] [CrossRef]
  42. Shen, Y.; Wu, T.; Jing, Y.; Li, R.; Cui, Y.; Liu, X.; Fan, S.; Zhai, J.; Cao, X.; Wan, Y.; et al. Investigation on air pollutants and carbon dioxide emissions from motor vehicles in Beijing based on COPERT model. J. Environ. Eng. Technol. 2021, 11, 1075–1082. [Google Scholar]
  43. Wang, W.; He, Y.; Gao, J.; Cao, L.; Ding, H.; Liu, C.; Tang, H.; Chen, Y.; Zhang, Y. Spatial and temporal variations, and socioeconomic drivers of air quality: Case study of the Beijing-Tianjin-Hebei urban agglomeration. Environ. Res. Commun. 2024, 6, 125026. [Google Scholar] [CrossRef]
  44. Wen, W.; Deng, Z.; Ma, X.; Xing, Y.; Pan, C.; Liu, Y.; Zhang, H.; Tharaka, W.; Hua, T.; Shen, L. Analysis of the synergistic benefits of typical technologies for pollution reduction and carbon reduction in the iron and steel industry in the Beijing-Tianjin-Hebei region. Sci. Rep. 2024, 14, 12413. [Google Scholar] [CrossRef] [PubMed]
  45. Liu, X.; Guo, H.; Zeng, L.; Lyu, X.; Wang, Y.; Zeren, Y.; Yang, J.; Zhang, L.; Zhao, S.; Li, J.; et al. Photochemical ozone pollution in five Chinese megacities in summer 2018. Sci. Total Environ. 2021, 801, 149603. [Google Scholar] [CrossRef]
  46. Tang, Y.; Yao, Q.; Cai, Z.; Ding, J.; Fan, W.; Yang, X.; Han, S. Exploring Formation of Ozone in Typical Cities in Beijing-Tianjin-Hebei Region Using Process Analysis. Chin. J. Environ. Sci. 2022, 43, 2917–2927. [Google Scholar]
  47. Zhang, L.; Wang, L.; Liu, B.; Tang, G.; Liu, B.; Li, X.; Sun, Y.; Li, M.; Chen, X.; Wang, Y.; et al. Contrasting effects of clean air actions on surface ozone concentrations in different regions over Beijing from May to September 2013–2020. Sci. Total Environ. 2023, 903, 166182. [Google Scholar] [CrossRef]
  48. Yang, Z.; Qin, T.; Wang, J.; Tang, J. Analysis of Pollution Characteristics and Influencing Factors of Air Pollutants in Beijing and Tianjin, China. J. Environ. Prot. Ecol. 2021, 22, 933–945. [Google Scholar]
  49. Yin, X.; Pu, W.; Wang, J.; Liu, X.; Qiao, L. Characteristics of Two Pollution Episodes Before and After City Heating in Beijing from February to March of 2019. Chin. J. Environ. Sci. 2021, 42, 2110–2120. [Google Scholar]
  50. Yang, Z.; Yang, X.; Xu, C.; Wang, Q. The Effect of Meteorological Features on Pollution Characteristics of PM2.5 in the South Area of Beijing, China. Atmosphere 2023, 14, 1753. [Google Scholar] [CrossRef]
  51. Qin, L.; Zhai, M.; Cheng, H. Indoor air pollution from the household combustion of coal: Tempo-spatial distribution of gaseous pollutants and semi-quantification of source contribution. Sci. Total Environ. 2023, 882, 163502. [Google Scholar] [CrossRef]
  52. Li, Y.; Tang, J.; Ji, Y.; Wang, Y.; Li, H.; Gao, R. Comparative Analysis of Ambient Ozone and Its Background Concentration in Beijing in Recent Years. Chin. J. Environ. Sci. 2025, 46, 1275–1284. [Google Scholar]
Figure 1. Distribution of environmental monitoring points in Beijing.
Atmosphere 16 00494 g001
Figure 2. The administrative districts included in the five research areas.
Atmosphere 16 00494 g002
Figure 3. The annual average concentrations of air pollutants in the five study regions and one traffic monitoring area in Beijing from 2014 to 2023.
Atmosphere 16 00494 g003
Figure 4. The monthly average concentrations of major air pollutants in Beijing from 2014 to 2023.
Atmosphere 16 00494 g004
Table 1. The annual average concentrations of major air pollutants in Beijing from 2014 to 2023.
Time2014201520162017201820192020202120222023Trend (%·yr−1)95% CI
PM2.5 (μg/m3)92.983.474.961.453.643.538.436.530.235.1−9.3 ± 0.7 *(−10.0, −8.6)
PM10 (μg/m3)130.9116.3105.397.892.274.864.754.755.973.4−6.2 ± 0.9 *(−7.1, −5.3)
SO2 (μg/m3)14.314.511.49.56.54.73.82.92.72.7−15.4 ± 2.1 *(−17.5, −13.3)
NO2 (μg/m3)51.848.947.845.741.836.729.825.522.624.9−7.8 ± 0.6 *(−8.4, −7.2)
CO (mg/m3)1.181.301.210.990.820.700.650.590.490.48−8.1 ± 0.8 *(−8.9, −7.3)
O3 (μg/m3)64.357.457.660.360.760.359.557.165.365.3+0.5 ± 0.4(−0.3, +1.3)
* p < 0.05 (two-tailed).
Table 2. The Pearson correlation coefficients of the annual average concentrations of the main air pollutants in Beijing.
PM2.5PM10SO2NO2COO3
PM2.51
PM100.974 **1
SO20.990 **0.961 **1
NO20.943 **0.947 **0.941 **1
CO0.965 **0.921 **0.981 **0.953 **1
O3−0.207−0.07−0.237−0.295−0.3971
** Significant at the 0.01 level (two-tailed).
Table 3. The Pearson correlation coefficients of the monthly average concentrations of the main air pollutants in Beijing.
PM2.5PM10SO2NO2COO3
PM2.51
PM100.892 **1
SO20.740 **0.618 **1
NO20.877 **0.779 **0.717 **1
CO0.873 **0.675 **0.816 **0.806 **1
O3−0.395 **−0.280 **−0.299 **−0.532 **−0.444 **1
** Significant at the 0.01 level (two-tailed).
Disclaimer/Publisher’s Note: The statements, opinions and data contained in all publications are solely those of the individual author(s) and contributor(s) and not of MDPI and/or the editor(s). MDPI and/or the editor(s) disclaim responsibility for any injury to people or property resulting from any ideas, methods, instructions or products referred to in the content.

