Article

Exploration of the Reasons for the Decreases in O3 Concentrations in Tai’an City Based on the Control of O3 Precursor Emissions

1
Research Center for Air Pollution and Health, Key Laboratory of Environmental Remediation and Ecological Health, Ministry of Education, College of Environment and Resource Sciences, Zhejiang University, Hangzhou 310058, China
2
Zhejiang Province Key Laboratory of Solid Waste Treatment and Recycling, School of Environmental Sciences and Engineering, Zhejiang Gongshang University, Hangzhou 310018, China
3
Collaborative Innovation Center for Statistical Data Engineering Technology and Application, School of Statistics and Mathematics, Zhejiang Gongshang University, Hangzhou 310018, China
4
Tai’an Ecological Environment Protection and Control Center, Tai’an Ecological Environment Bureau, Tai’an 271000, China
5
Shandong Academy of Environmental Sciences Co., Ltd., Jinan 250013, China
6
School of Environmental Science and Engineering, Research Institute of Environment, Shandong University, Qingdao 266237, China
7
Shanghai Key Laboratory of Atmospheric Particle Pollution and Prevention (LAP3), Department of Environmental Science & Engineering, Institute of Atmospheric Sciences, Fudan University, Shanghai 200438, China
8
State Key Laboratory of Infrared Physics, Shanghai Institute of Technical Physics, Chinese Academy of Sciences, Shanghai 200031, China
*
Authors to whom correspondence should be addressed.
Atmosphere 2025, 16(5), 505; https://doi.org/10.3390/atmos16050505 (registering DOI)
Submission received: 21 March 2025 / Revised: 18 April 2025 / Accepted: 24 April 2025 / Published: 27 April 2025
(This article belongs to the Section Air Quality)

Abstract

:
Due to the “One City, One Policy” for air pollution prevention and control measures, Tai’an City was the only city in Shandong Province with a year-on-year decrease in O3 concentrations in 2022. In this study, the WRF-CMAQ model was used to simulate the O3 concentrations in Tai’an and other inland cities in Shandong Province in September 2022, and the model evaluation method was applied to discover the differences in the O3 concentrations between Tai’an and other cities. During the periods of high maximum daily 8 h average O3 (MDA8 O3), the model only overestimated the O3 concentrations in Tai’an by 3.4% and underestimated those in other inland cities by −11.0% to −2.2%. Dozens of O3 simulation scenarios were designed on the basis of the control of O3 precursor emissions, and the results indicate that the O3 precursor emissions in Tai’an were at a lower level. On this basis, the impacts of meteorological conditions and O3 precursor emission changes on O3 concentrations in Tai’an were quantified. Adverse meteorological conditions and changes in emissions from other inland cities led to a 49.5 µg/m3 increase in the mean MDA8 O3 in Tai’an during the study period. However, the local emission reduction measures in Tai’an, to some extent, offset these adverse effects, reducing the mean MDA8 O3 by 5.8 µg/m3. In summary, the Tai’an City might implement effective emission reduction measures during periods of high MDA8 O3, thereby achieving a reduction in overall O3 concentrations. This effort secured its leading position in Shandong Province’s O3–8h-90per ranking in 2022.

1. Introduction

Surface ozone (O3) is an oxidizing secondary pollutant gas generated by human activities, primarily through the photochemical oxidation process of nitrogen oxides (NOx) and volatile organic compounds (VOCs) [1]. High concentrations of O3 are harmful to human health and increase the risk of cardiovascular and respiratory diseases [2,3]. In addition, tropospheric O3 can also cause climate change, reduce plant productivity, and accelerate leaf aging [4,5]. With the continuous improvements in urbanization and industrialization, China’s air pollution problem is becoming increasingly serious. In recent years, the problem of urban O3 pollution has become particularly prominent [6,7,8]. For example, in 2022, the average O3 concentrations in 339 prefecture levels and above cities nationwide was 145 µg/m3 (73.9 ppbv), increased by 5.8% compared to 2021 [9]. Between 2013 and 2017, the average 90th percentiles in maximum daily 8 h average O3 (MDA8 O3) concentrations in 74 key cities in China increased by 20.1% [10]. Recently, cities in the Beijing-Tianjin-Hebei region, the Fenwei Plain, the Yangtze River Delta, and the Pearl River Delta have frequently experienced serious incidents of excessive O3 levels [11,12,13]. In addition, studies show that compared to Japan, South Korea, the European Union, and the United States, China has a larger scale and higher frequency of high O3 events [14].
Given the differences between cities, in order to coordinate the prevention and control of fine particulate matter (PM2.5) and O3 pollution, the Chinese Ministry of Ecology and Environment implemented the “One City, One Policy” work plan in 2021 (https://www.mee.gov.cn/xxgk2018/xxgk/xxgk04/202104/t20210428_831139.html, accessed on 23 April 2025). Subsequently, nine cities in Shandong Province adopted this plan (http://sthj.shandong.gov.cn/dtxx/mykhb/202105/t20210524_3609359.html, accessed on 23 April 2025). Among those efforts, Tai’an City achieved significant progress. In 2022, it ranked eighth in air quality improvement among the 168 key cities in China. The annual average O3 concentration showed a 3.3% year-on-year decline, marking the highest reduction rate among all cities in Shandong Province (http://sthj.shandong.gov.cn/dtxx/zhbsdxw/202303/t20230314_4263764.html, accessed on 23 April 2025). Although many researchers proposed recommendations for the policy from the perspectives of reducing NOx emissions and developing plans to deal with heavy winter pollution weather [15,16], there is relatively little research on the results of O3 governance achievements in the “One City, One Policy”. Therefore, this study provides a detailed analysis of the variation patterns and characteristics of O3 in Tai’an City. On this basis, this study deeply explores the driving factors for O3 concentration decline in Tai’an City in 2022, and quantified the contributions of different O3 precursor emission reduction schemes.
Favorable meteorological conditions, such as high wind speeds and low sunlight, along with controlling the emissions of O3 precursors, can contribute to reducing urban O3 concentrations to a certain extent [17,18,19,20,21]. The environmental protection department of Tai’an City tended to improve urban O3 concentrations by reducing the emissions of precursor substances (NOx, VOCs) throughout the day or during the day. The measures they put in place include the substitution of VOCs raw and auxiliary materials, rectification of oil and gas recovery, staggered production by enterprises, and price reduction promotions at night gas stations. During the “One City, One Policy” work period, Tai’an City would forecast O3 concentration 3~7 days in advance. When there was a risk of excessive O3, the environmental protection department would take stricter emission reduction measures in advance to cope with possible O3 exceeding events, such as closing or rectifying some factories, limiting the number of motor vehicles [8,22,23]. This series of measures aimed to improve air quality and reduce the harm of air pollution to the health of citizens. However, due to the highly nonlinear response of O3 to NOx and VOCs emissions, improper emission reduction ratios may actually lead to an increase in O3 concentration [24,25,26]. For example, Li et al. [27] analyzed the sensitivity of atmospheric O3 in Tai’an City and found that during the study period, the photochemical generations of O3 tended towards both NOx-limited and VOCs-NOx-co-limited conditions. However, Zhang et al. [28] proposed the opposite view, suggesting that the O3 in Tai’an City may be limited by VOCs in the other periods. This difference can be attributed to different research periods. CMAQ has good simulation performance for atmospheric pollutants and can accurately simulate pollutant concentrations under different emission reduction scales, industries, species, and ratios [29,30,31,32]. In this study, we use the WRF-CMAQ model based on different O3 precursor emission control schemes to simulate the O3 concentrations in Tai’an City and Shandong Province in Septembers of 2021 and 2022. We also investigate the impacts of differences in precursor emission levels between Tai’an City and other cities in Shandong Province on O3 concentrations, in order to quantify the contributions of precursor emission changes to the improvement in Tai’an City’s O3 ranking. The results explain the significant role of the “One City, One Policy” in improving O3 in Tai’an City and were of great reference significance for other cities to carry out “One City, One Policy” and control air pollution.

2. Materials and Methods

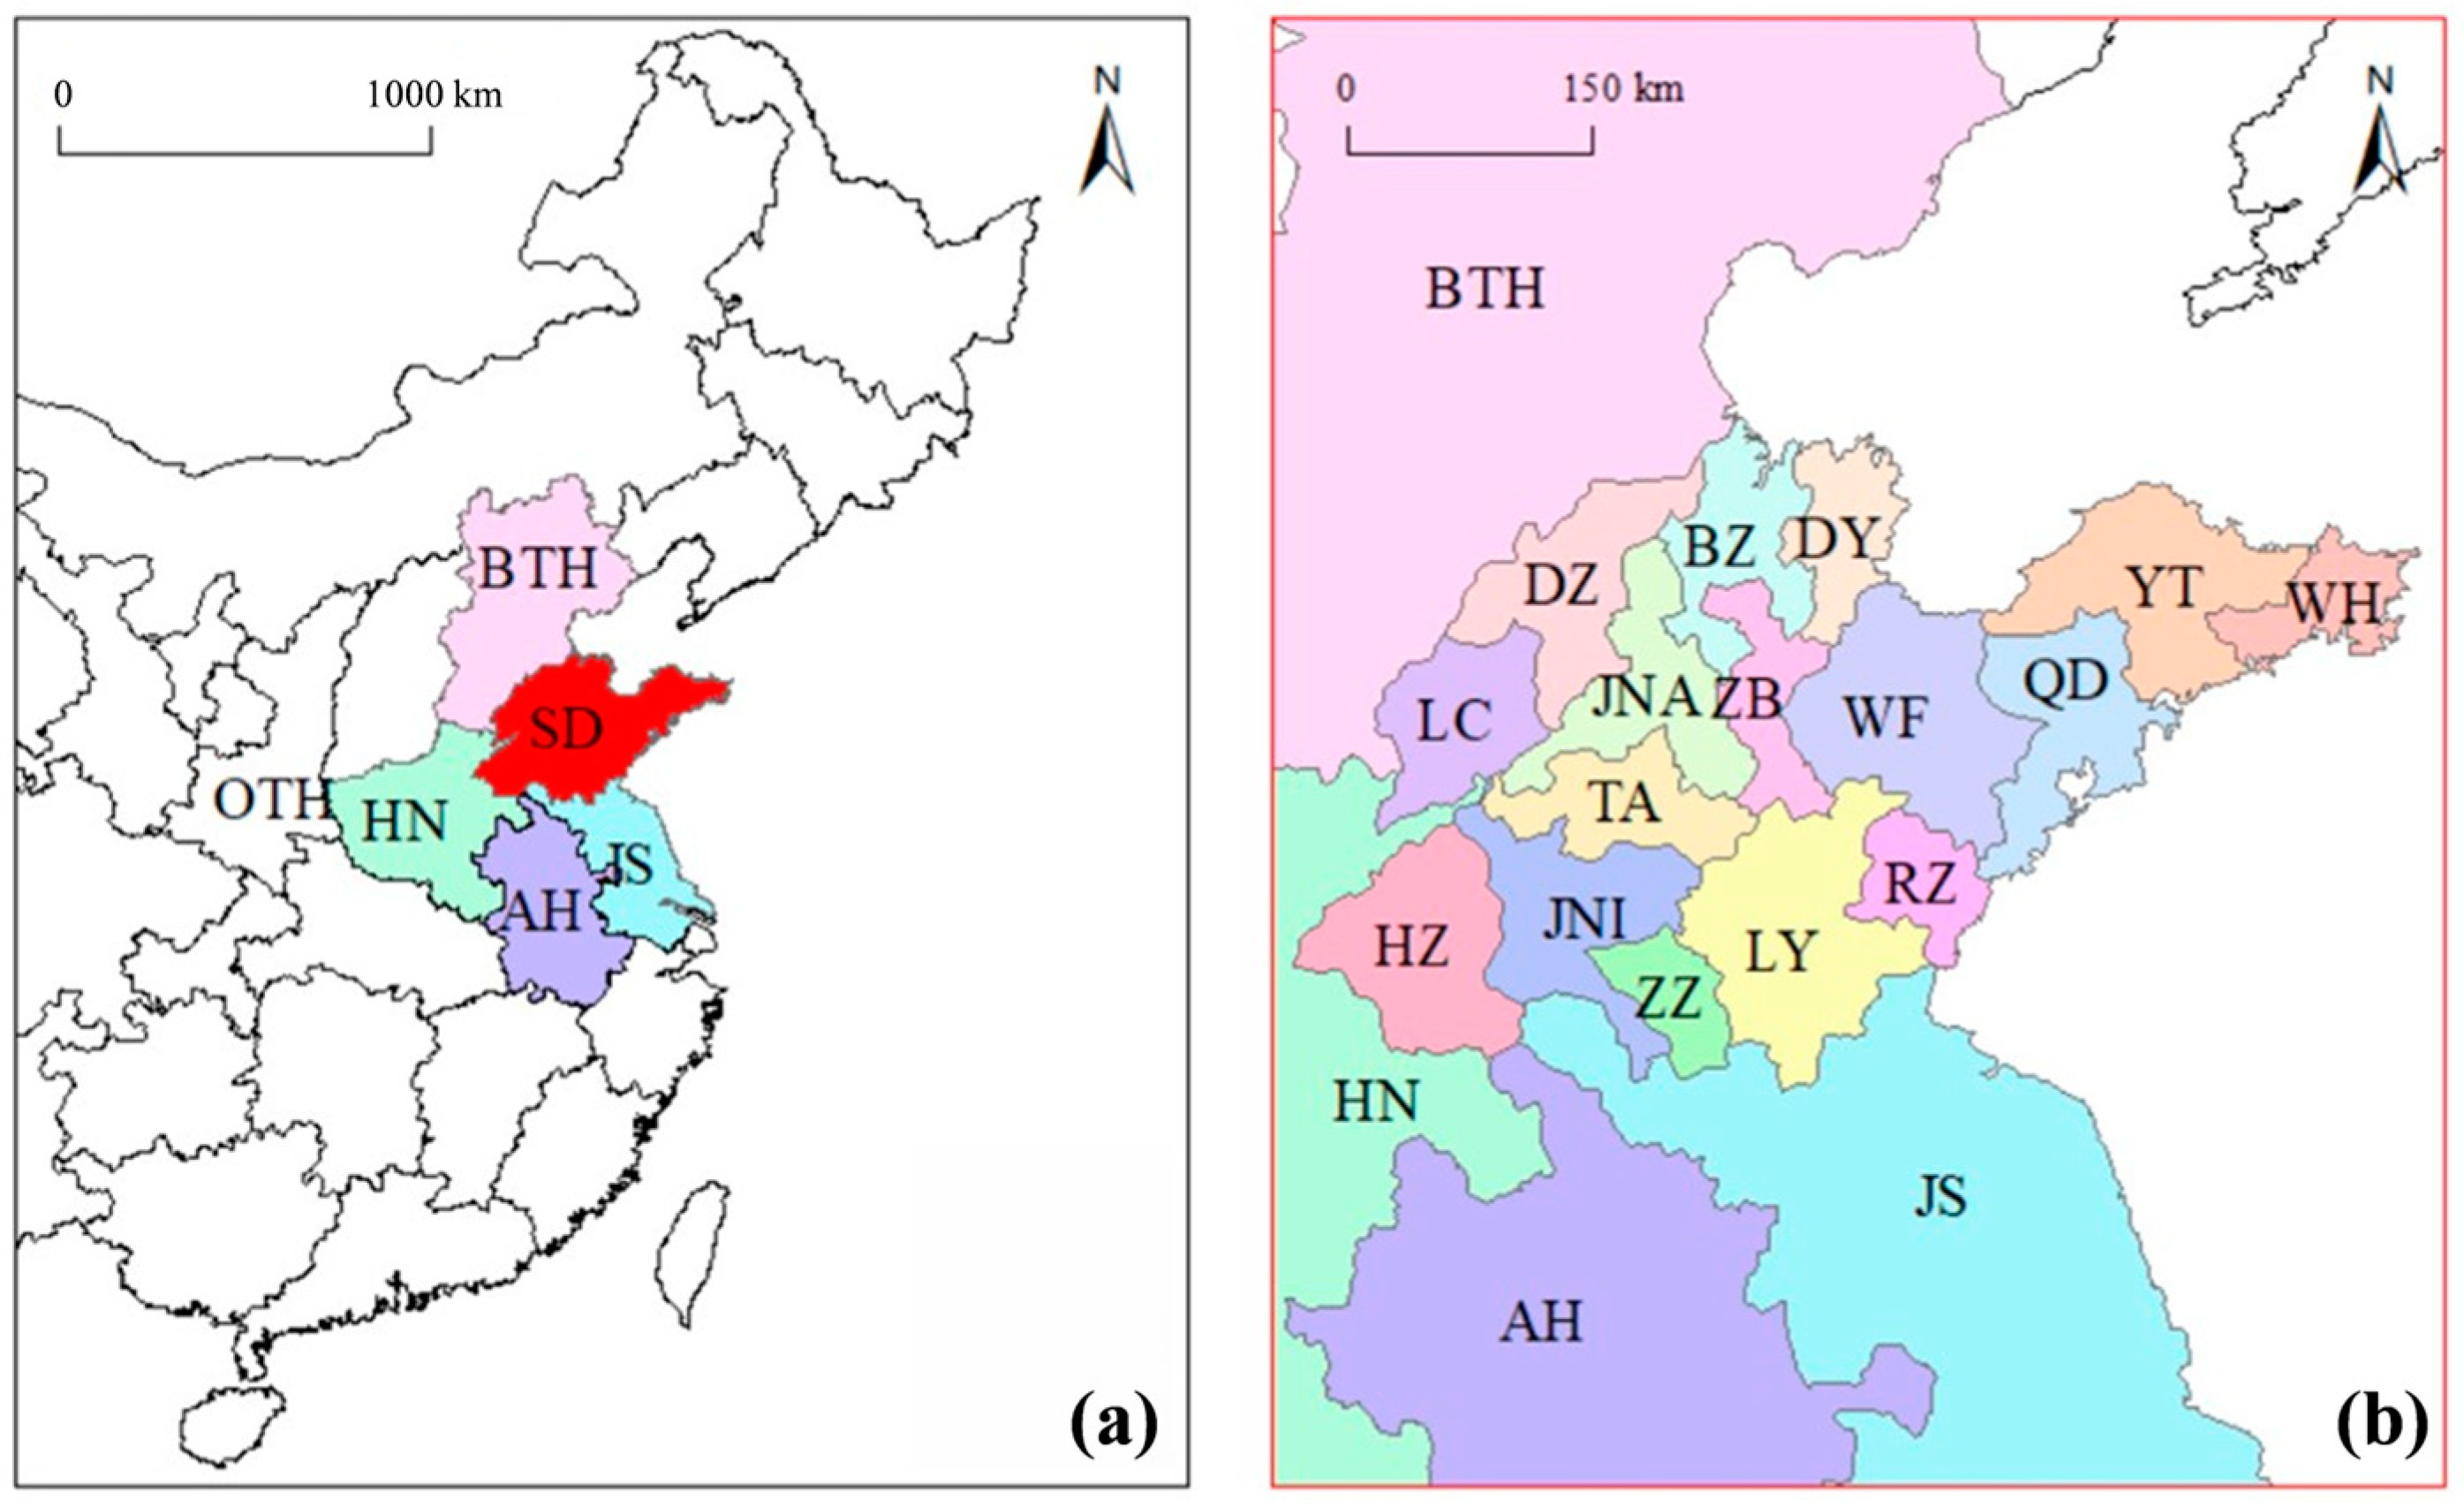
2.1. Model Configurations and Emission Inventory

The WRF-CMAQ model was used to simulate O3 concentrations with the configurations specified by Yu et al. [33] The WRFv3.7 model utilized the asymmetric convective model (ACM2) for the planetary boundary layer scheme [34], RRTMG longwave and shortwave radiation schemes, Kain–Fritsch (KF2) cumulus cloud parameterization, Morrison double-moment cloud microphysics scheme [35], and the Pleim-Xiu (PX) land-surface scheme. Meteorological initial and boundary conditions, with a spatial resolution of 1° × 1° and a temporal resolution of 6 h, were obtained from the National Center for Environmental Prediction (NCEP) final analysis dataset. CMAQv5.0.2 has proven to be reliable and effective in simulating O3 pollution [36]. In this study, the CMAQv5.0.2 model, incorporating the carbon-bond chemical mechanism (CB05) and the AERO6 aerosol module, was used to simulate pollutant concentrations. The simulation domain, as illustrated in Figure 1, covered a significant portion of China with a horizontal resolution of 12 km × 12 km. Anthropogenic emissions from the Multi-resolution Emission Inventory for China (MEIC) (http://www.meicmodel.org, accessed on 23 April 2025) were developed by Tsinghua University and included five emission sectors. The model adopted default initial and boundary chemical conditions by excluding the first five days as the spin-up period to mitigate the impact of initial chemical conditions [37]. Subsequently, the initial and boundary conditions for the scenario cases were based on the base case outputs generated on the day before the implementation of control measures.

2.2. Observational Data

There was a total of 16 cities participating in the O3 index (the 90th percentiles in MDA8 O3 (O3–8h-90per)) ranking in Shandong Province. We compared the observed and simulated values of twelve inland cities (IN_12) including Tai’an, Jinan, Jining, Linyi, Liaocheng, Zibo, Heze, Zaozhuang, Dezhou, Binzhou, Dongying, and Weifang to comprehensively evaluate the performance of the model. The national control observation stations in the four coastal cities (CO_4) of Rizhao, Qingdao, Yantai, and Weihai are mostly concentrated at the seaside. The meteorological and diffusion conditions in these cities are significantly different from those in Tai’an, so their observation data were excluded from the evaluation scope. The hourly concentration data of O3 in the IN_12 cities came from the China Environmental Monitoring Center (http://www.cnemc.cn, accessed on 23 April 2025). The hourly meteorological data, including planetary boundary layer height (PBLH), air pressure (P), wind speed (WS), and wind direction (WD), were obtained from the reanalysis data (ERA5) of the 5th generation European Centre for Medium-Range Weather Forecasts (ECMWF) (https://cds.climate.copernicus.eu, accessed on 23 April 2025). Temperature (T) and relative humidity (RH) were collected from the website (http://www.envicloud.cn/, accessed on 23 April 2025).

2.3. Description of Simulation Scenarios

Due to the fact that only Tai’an City’s O3–8h-90per in Shandong Province improved year-on-year in September 2022, while other cities deteriorated, the O3 comparisons in September 2022 were very representative. This is because this result was very similar to the annual O3–8h-90per pattern in various cities in Shandong Province (as mentioned in Section 3.1 below). Therefore, we first designed two basic simulation scenarios (Base 1 and Base 2, see Table 1) to find the differences in O3 simulation values between Tai’an City and other eleven inland cities (IN_11 cities, including Jinan, Jining, Linyi, Liaocheng, Zibo, Heze, Zaozhuang, Dezhou, Binzhou, Dongying, and Weifang) in September without changing emissions, and we evaluated the simulation performance of the model. However, due to the strict reduction and regulation measures for O3 precursors taken by Tai’an City during the “One City, One Policy” period, the emission levels in Tai’an City had changed. In addition, due to the impact of the COVID-19 epidemic, other cities in Shandong Province might also change their monthly emissions of O3 precursors [38]. Therefore, we tried to adjust the ratios of NOx and VOCs emissions in Case 1.1~Case 2.12 (as listed in Table 1), so that the simulated values would be closer to the observed values. The actual emissions of O3 precursors in cities of Shandong Province could be also estimated.
In this study, we only focus on the eleven days with the highest MDA8 O3 concentration in September of Tai’an City, namely 5, 8~12, 18, and 26~29 September in 2022 (HM_2022) and 8~16, 22, and 30 September in 2021 (HM_2021). It is highly likely that relevant government departments in Tai’an City have taken emission reduction measures to prevent the MDA8 O3 levels from rising even higher. Moreover, the MDA8 O3 values during these days would significantly affect O3–8h-90per mean values in both September and entire year to some extent. At the same time, in order to ensure effectiveness, we started emission reduction at least one day in advance (UTC time) during the simulations, so the actual emission control times were 4~12, 17, 18, and 25~29 September in 2022 (HMS_2022), and 7~16, 21, 22, and 29, 30 September in 2021 (HMS_2021). In Case 1.1~Case 1.6, we did not change the VOCs emissions in Tai’an City and IN_11 cities, while their NOx emissions were adjusted in proportions of 150%, 125%, 110%, 90%, 75%, and 50%, respectively. The emissions in CO_4 and six neighboring provinces and cities (NPC_6) remained unchanged. In Case 1.7~Case 1.12, the NOx emissions were kept constant, and VOCs were adjusted according to the same proportions. We adopted the same emission adjustment plan for the HMS_2021 case (Table 1, Case 2.1~Case 2.12).
After determining the emission levels of the IN_11 cities in Shandong Province, we further designed emission control scenarios for Case 3.1~Case 3.9 (Table 2). In these scenarios, the VOCs in the IN_11 cities increased by 50%, while the emissions in CO_4, NPC_6 and other regions in the domain (OTH) remained unchanged. In Case 3.1~Case 3.5, the emission reductions were implemented in Tai’an City with a VOCs:NOx ratio of 1:1 (no reduction in Case 1.1), aiming to offset the impact of increased external emissions on Tai’an’s O3 levels and determine the actual emissions in Tai’an. The difference between Case 3.4 and Case 3.8 can reflect the comprehensive impacts of emissions reductions in Tai’an City and the increases in emissions in the IN_11 cities on the O3 concentrations in Tai’an City, as they had the same meteorological conditions [39]. On this basis, we designed Case 3.6 and Case 3.7, and the difference between their respective results and Case 3.8 can separate the contributions of Tai’an City and IN_11 cities to the changes of O3 concentration. Similarly, we compared the results of Case 3.6 with Case 3.9 to determine the impacts of changes in meteorological conditions.
In addition, we selected 2 August 2022 as the day for the case study (Table 3). On this day, there was an unexpected low value of MDA8 O3 in Tai’an (134 µg/m3), lower than or equal to the surrounding areas (i.e., Jinan, Liaocheng, Linyi, Zibo, and Jining with 138, 134, 150, 184, and 139 µg/m3, respectively). Case 4.1 did not implement emission control, while Cases 4.2~4.4 reset the emissions of Tai’an City, 15 other cities in Shandong Province, and neighboring provinces to zero, respectively. Case 4.5 aimed to zero out the emissions of the entire Shandong province. In this way, we could roughly estimate the impacts of changes in emission levels in different regions on the O3 concentration in Tai’an City. Case 4.6 reduced VOCs and NOx in Tai’an City by 50%, while the other 15 cities in Shandong Province reduced them by 90% to ensure that the simulated values were close to the observed values. Case 4.7 further adjusted the emissions of individual cities based on Case 4.6 to ensure that almost all simulated values in Shandong Province were close to the observed values, in order to demonstrate the rationality of emission control ratios.

3. Results and Discussion

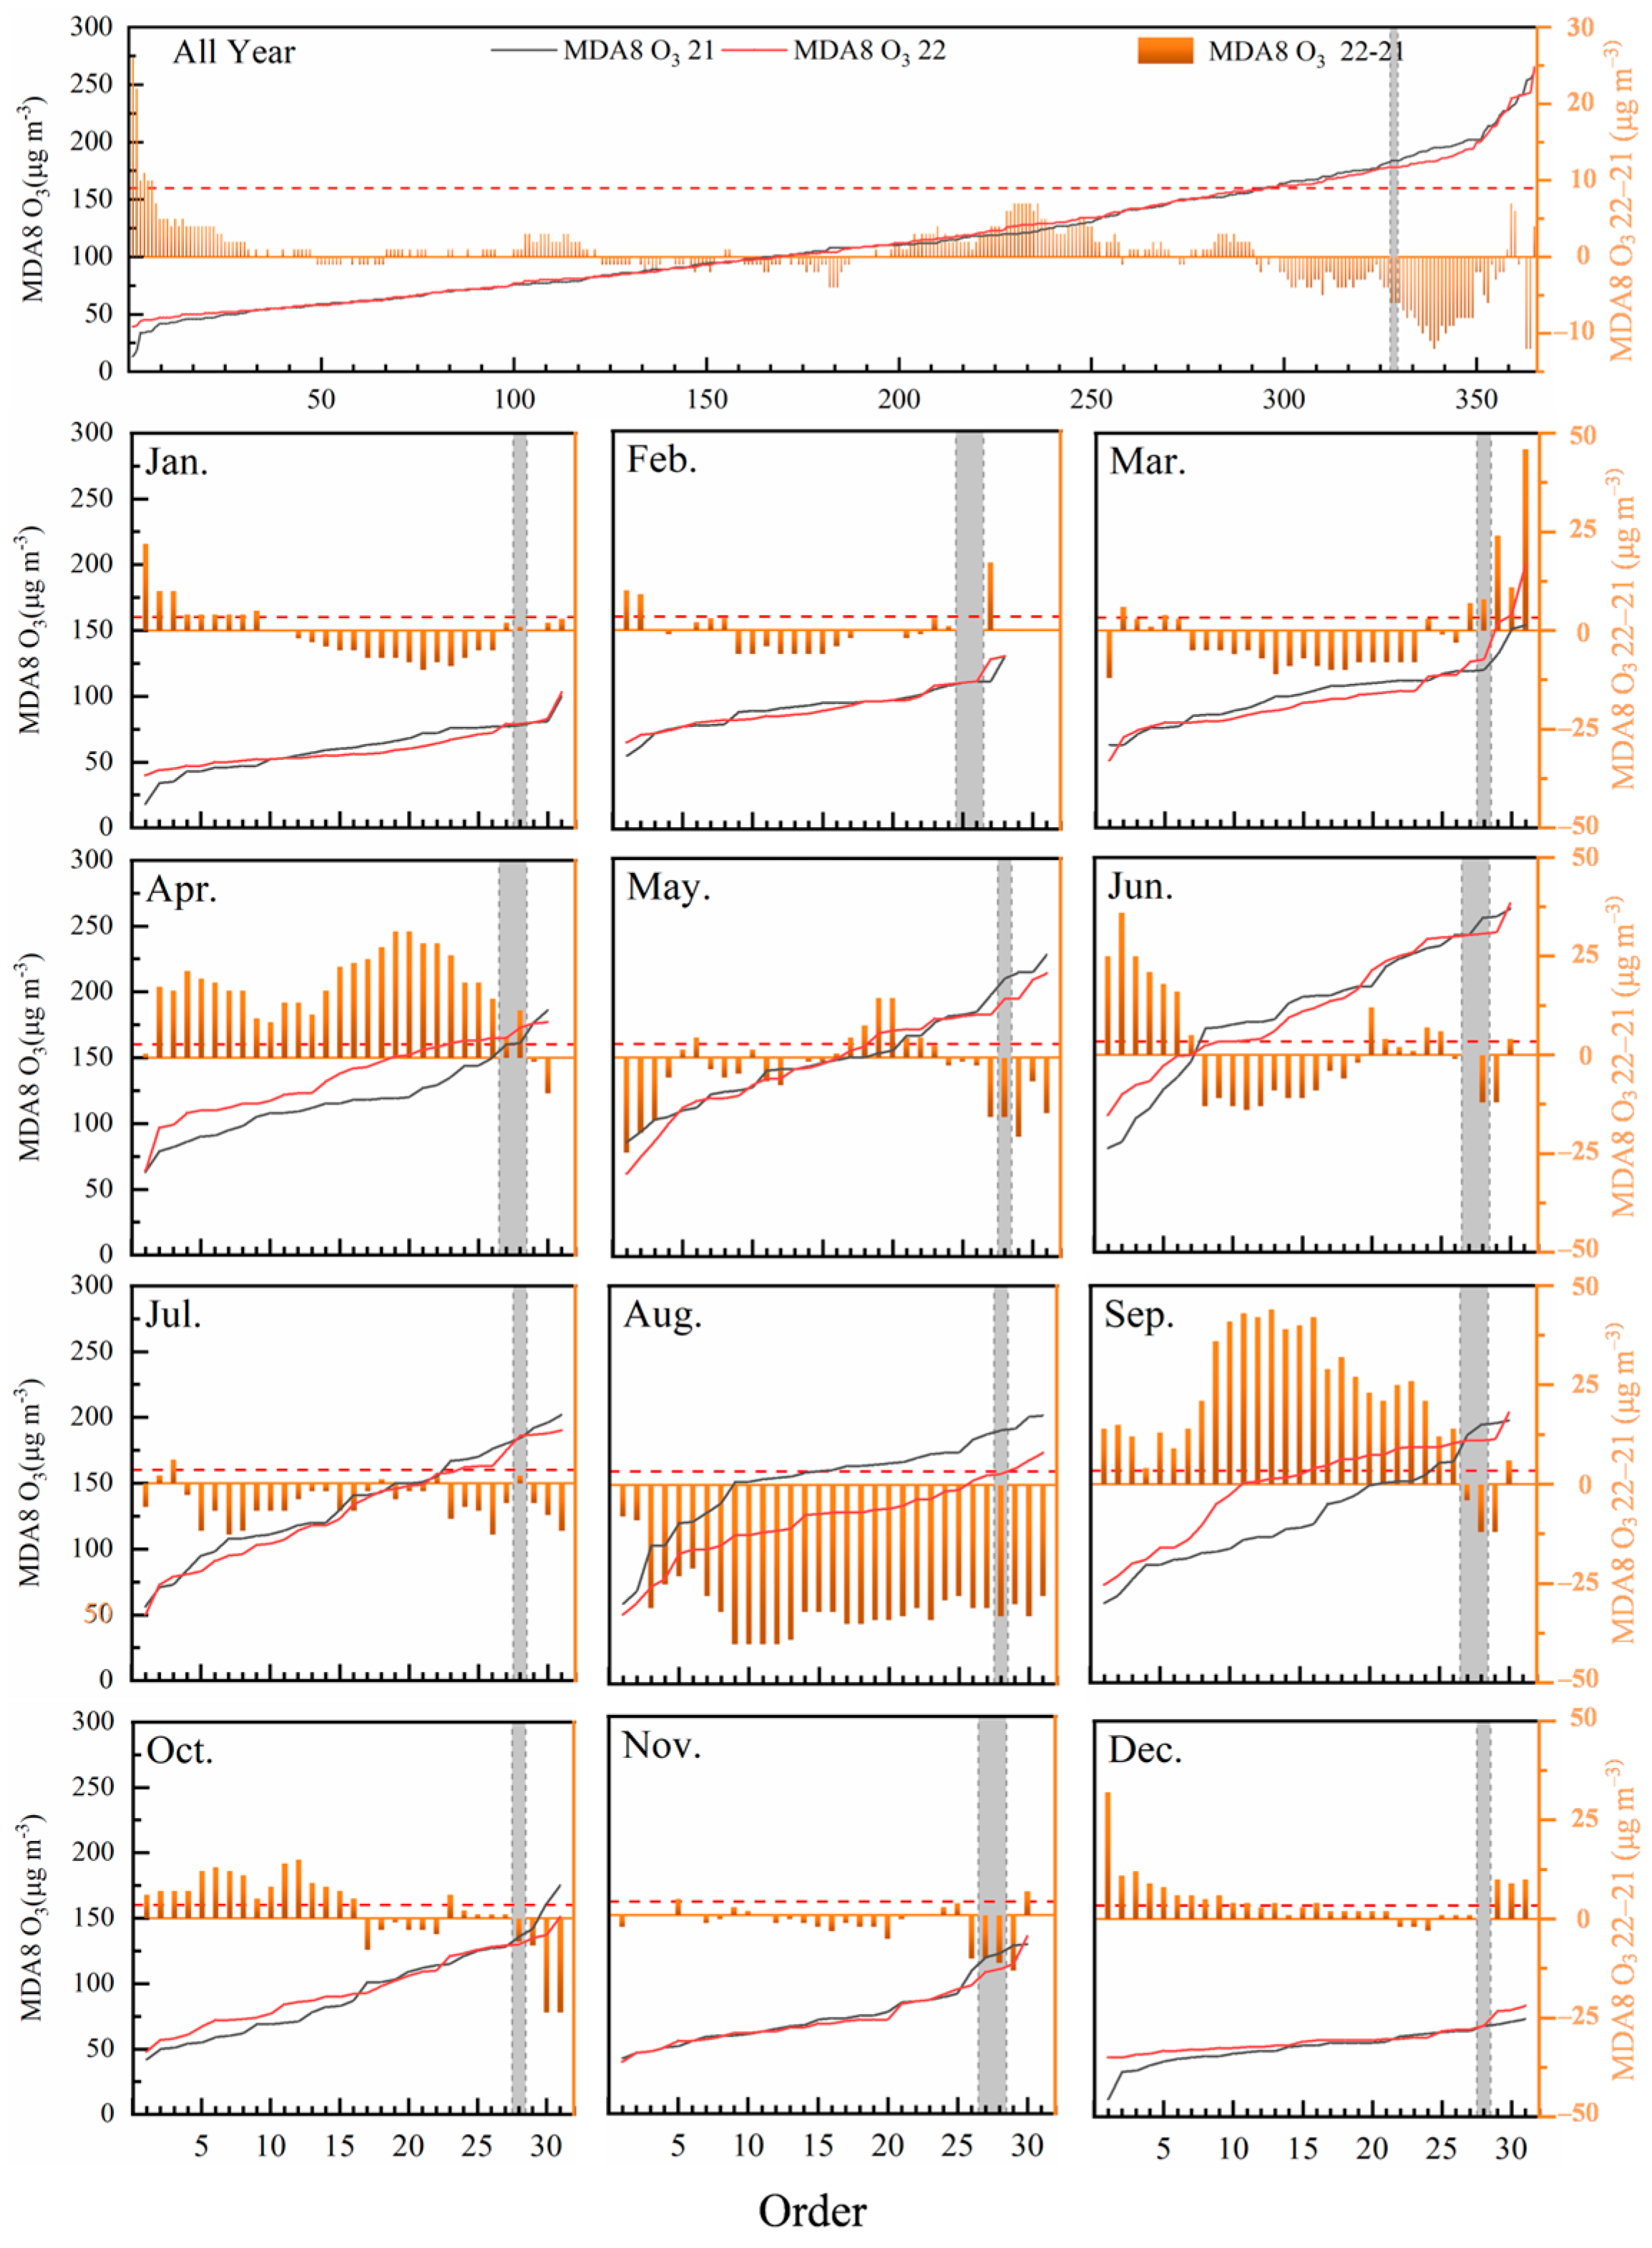
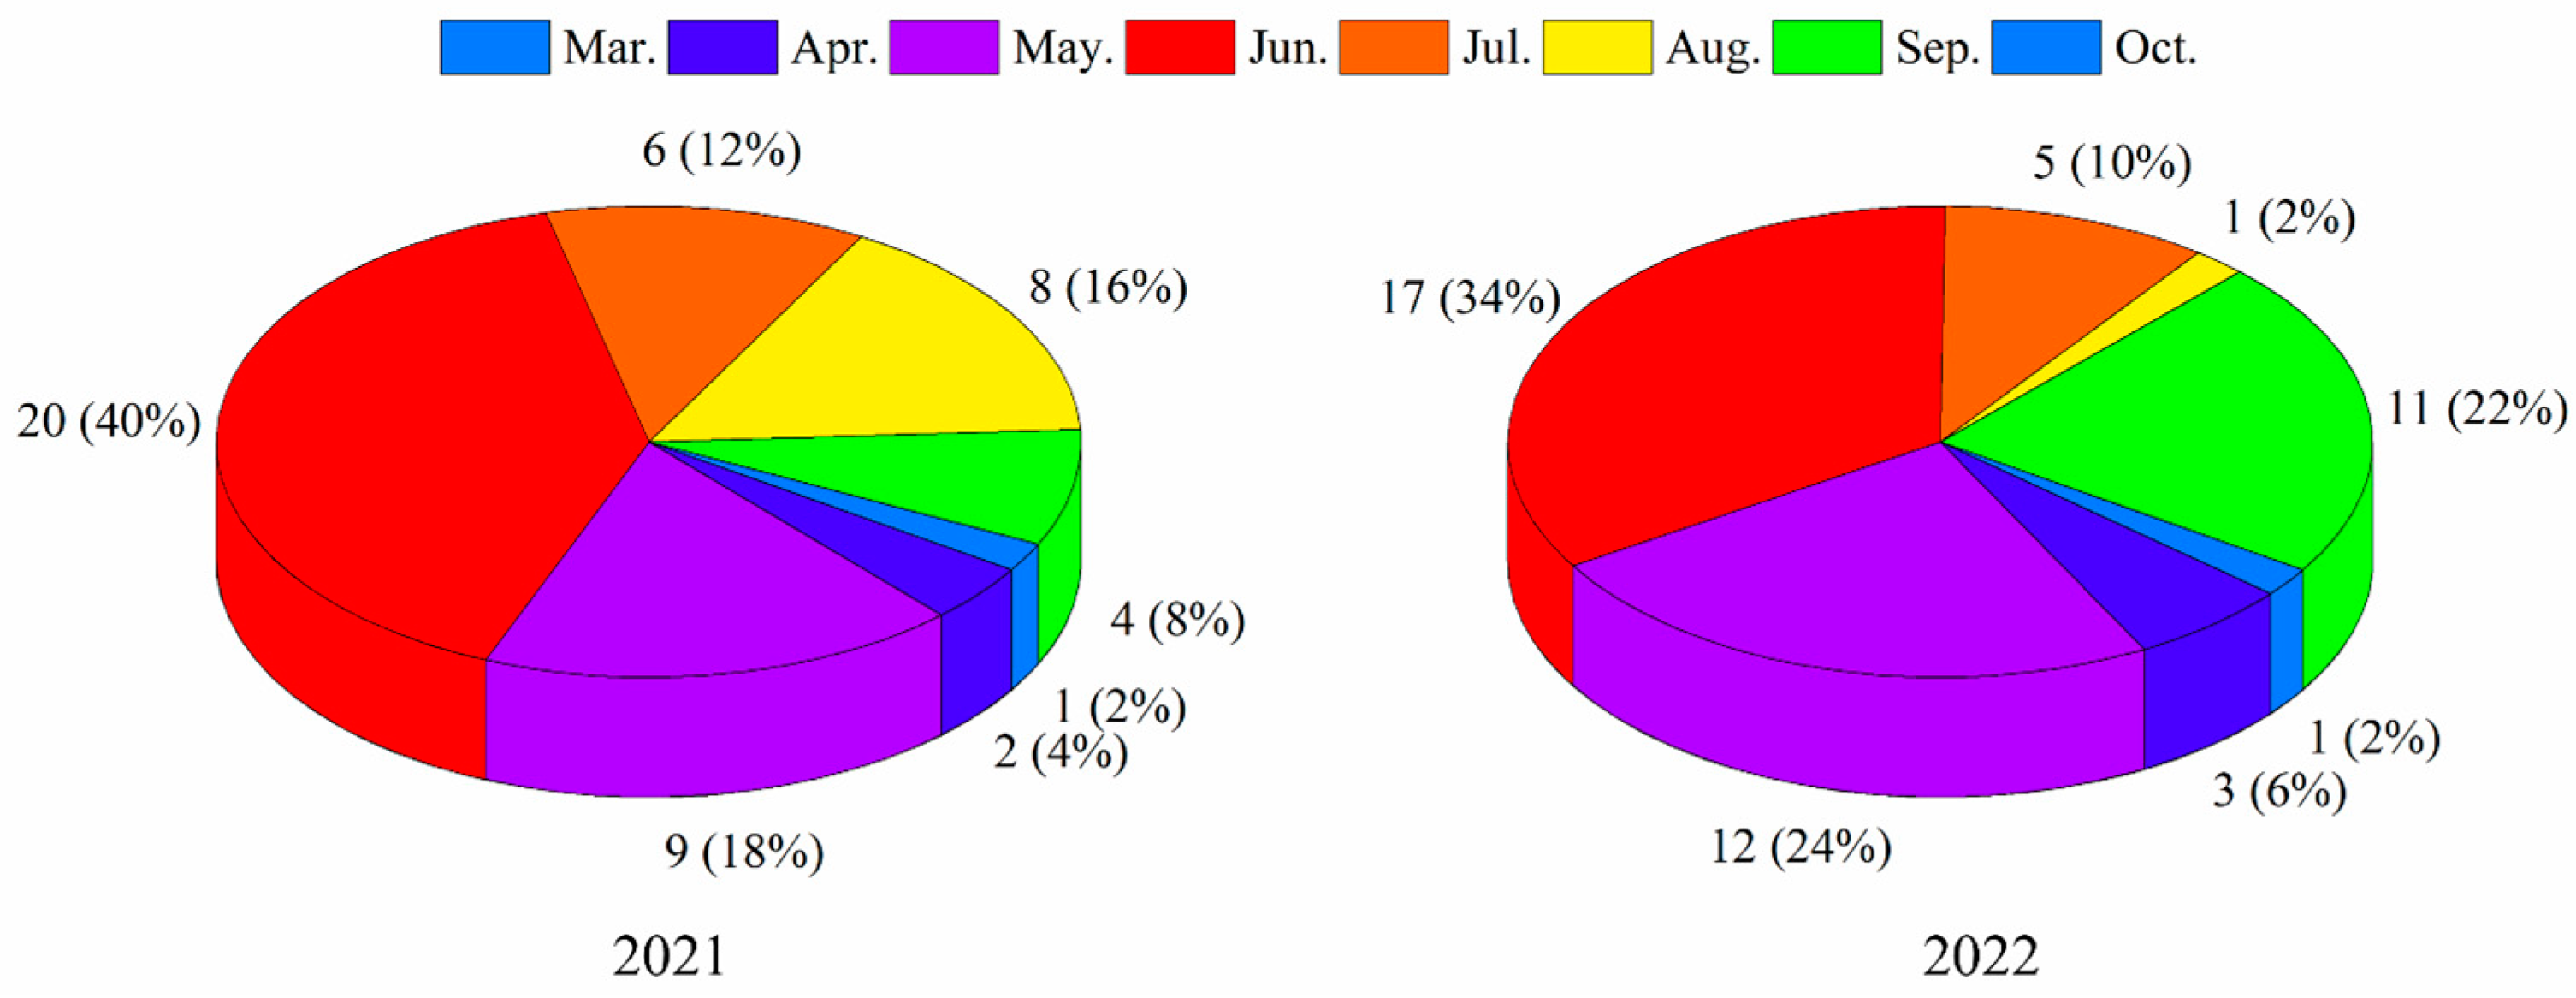
3.1. Analysis of Observational Results

As shown in Figure S1, compared with 2021, various air quality indicators in Tai’an City achieved varying degrees of improvements in 2022. The air quality index had decreased by 0.37, the average concentrations of PM10 and PM2.5, and the O3–8h-90per had decreased by 9, 2, and 4 µg/m3, respectively. The proportion of excellent days increased by 6.6% (http://fb.sdem.org.cn:8801/AirDeploy.Web/, accessed on 23 April 2025).
As shown in Table 4, in 2022, the improvement rate of O3–8h-90per (−3.3%) in Tai’an City ranked first in the province, and it was the only inland city with a decrease (−6 µg/m3) in O3–8h-90per. In order to avoid the randomness caused by using O3–8h-90per as the O3 evaluation indicator, we introduced “the average value of MDA8 O3 for the highest 50 days of MDA8 O3 throughout the year” (Ave_MDA8 O3 (the highest 50)) as the evaluation indicator. We found that this indicator in Tai’an City was still decreasing (−6.3 µg/m3), and the improvement rate (−3.7%) was more advantageous than using O3–8h-90per as the evaluation indicator. This indicates that the overall O3 level in Tai’an City improved in 2022, and this improvement is highly likely not caused by weather conditions. In neighboring cities with similar meteorological conditions and even all other inland cities in Shandong Province, the O3 index (O3–8h-90per) increased to varying degrees (0.8~11.6%). Among the 16 cities in the province, the O3–8h-90per concentrations in coastal cities (143.6~156.6 µg/m3) were significantly lower than those of inland cities (155.0~191.6 µg/m3). This may be due to the fact that almost all observation stations in these four coastal cities were concentrated at the seaside, where sea and land winds were prevalent and O3 has better diffusion conditions. In addition, rainy weather in coastal cities led to insufficient light, which limited the production of O3 [40,41,42].
The MDA8 O3 exceeded the standard for 69 days in 2022, the same as in 2021 (http://123.232.114.95:8001/, accessed on 23 April 2025; the data come from the Shandong Provincial Ecological Environment Monitoring Center). We arranged the MDA8 O3 levels for 365 days per year in ascending order (Figure 2). Among the concentrations of MDA8 O3 in the 295–365th positions (≥160 µg/m3), 94.4% of values in 2022 were lower or equal to those in 2021, which clearly greatly promoted the improvement of O3–8h-90per. However, for the MDA8 O3 concentrations ranked 1–275th (≤150 µg/m3), this proportion plummeted to 46.2%. But this decline had almost no impact on the evaluation index of O3–8h-90per for the whole year, because in 2022, the O3–8h-90per was 178 µg/m3, much higher than 150 µg/m3. The above results indicate that the improvement in the O3–8h-90per index throughout the year in Tai’an City may be related to the reduction in O3 concentrations on days ranked 295th to 365th in MDA8 O3, with this reduction potentially linked to the implementation of stricter control measures.
Similarly, we arranged the monthly MDA8 O3 in ascending order and found that the O3–8h-90per concentrations were lower in January, February, March, October, November, and December (69~136 µg/m3 in 2021 and 69~130 µg/m3 in 2022), with a relatively low improvement rate (9.4~6.7%). In contrast, O3–8h-90per from April to September was relatively high (160~242 µg/m3 in 2021 and 158~241 µg/m3 in 2022), with a high improvement rate (17.3~3.6%). The highest improvement rate was in August. Moreover, the MDA8 O3 values of the same rank in August 2022 were lower than those in August 2021. Unlike this, although the majority of MDA8 O3 in September 2022 were higher than in 2021, the O3–8h-90per in September 2022 in Tai’an City still improved due to the lower levels of MDA8 O3 in the 27th and 28th positions that determined O3–8h-90per. This indicates that there was a certain degree of error when using O3–8h-90per values as the O3 evaluation indicator to reflect the overall level of O3, especially when the sample size was small. We further conducted a monthly distribution map of the highest 50 days of MDA8 O3 in these two years (Figure 3) and found that these high values of MDA8 O3 were concentrated in April to September (49 days, 98%). June has the highest proportion, with 40% (20 days) and 34% (17 days) in 2021 and 2022, respectively. However, the proportions of August and September changed significantly, with a decrease of 14% (7 days) and an increase of 14% (7 days), respectively.

3.2. Model Evaluation

We selected the periods of Septembers in 2022 (SEP_2022) and 2021 (SEP_2021) for performance evaluation of model simulations. The evaluation indicators include the mean bias (MB), the mean error (ME), the normalized mean bias (NMB), the normalized mean error (NME), and the correlation coefficient (R) [43]. Considering the high correlation between MDA8 O3 and high hourly O3 concentrations, we added an evaluation of the 11days with the highest MDA8 O3 in Tai’an City in September 2022 and 2021 (HM_2022, HM_2021, respectively) and the O3 hourly concentrations from 10:00 to 18:00 (HMH_2022, HMH_2021) on these 11 days. Table S1 summarizes the comparisons between simulated and observed values. Overall, the model had good simulation performance, with NMB and NME values of −20.3~13.1% and 9.4~31.3% for all cities, respectively, all within the standard range (|NMB| ≤ 25%, NME ≤ 35%) [43]. For the entire month, there was a strong correlation between simulated and observed values, with R ranging from 0.76 to 0.89. In SEP_2022, compared to other cities, the model had overestimations in Tai’an City with NMB of 7.7% (−17.7~4.8% for IN_11 cities) and had the lowest R value of 0.77 (0.82~0.89 for IN_11 cities). When we further compared the evaluation results during the HM_2022 period, this difference was more pronounced, with the NMB values of 9.2%, −20.3~3.7% in Tai’an City and IN_11 cities, respectively. The evaluation of O3 hourly concentrations during the HMH_2022 period best reflected the uniqueness of Tai’an City: only Tai’an City had overestimations (NMB = 3.4%), while the model underestimated the hourly O3 concentrations in IN_11 cities (NMB = −11.0~−2.2%). This indicates that Tai’an City was likely to have taken control measures in advance in September 2022, especially when the O3 hourly values were high, resulting in decreases in O3 levels. Unlike this, the evaluation of O3 hourly concentrations during the HMH_2021 period showed that the model had only slight underestimations in Zibo (NMB = −1.4%) but overestimations in other cities (NMB = 1.6~13.7%). Figures S2 and S3 shows the time series of hourly concentrations observed and simulated O3 in Tai’an City and IN_11 cities (excluding Zibo) in Shandong Province, without implementing emission control measures. Overall, the simulated values of the model were quite close to the observed values reasonably. Through careful evaluation, the differences in O3 levels between Tai’an City and IN_11 cities in September 2022 were captured, although these differences were very small (Table S1). Case 1.1~Case 2.12 were designed in this context to explore the reasons behind these differences.

3.3. Impacts of Emission Control and Meteorological Conditions
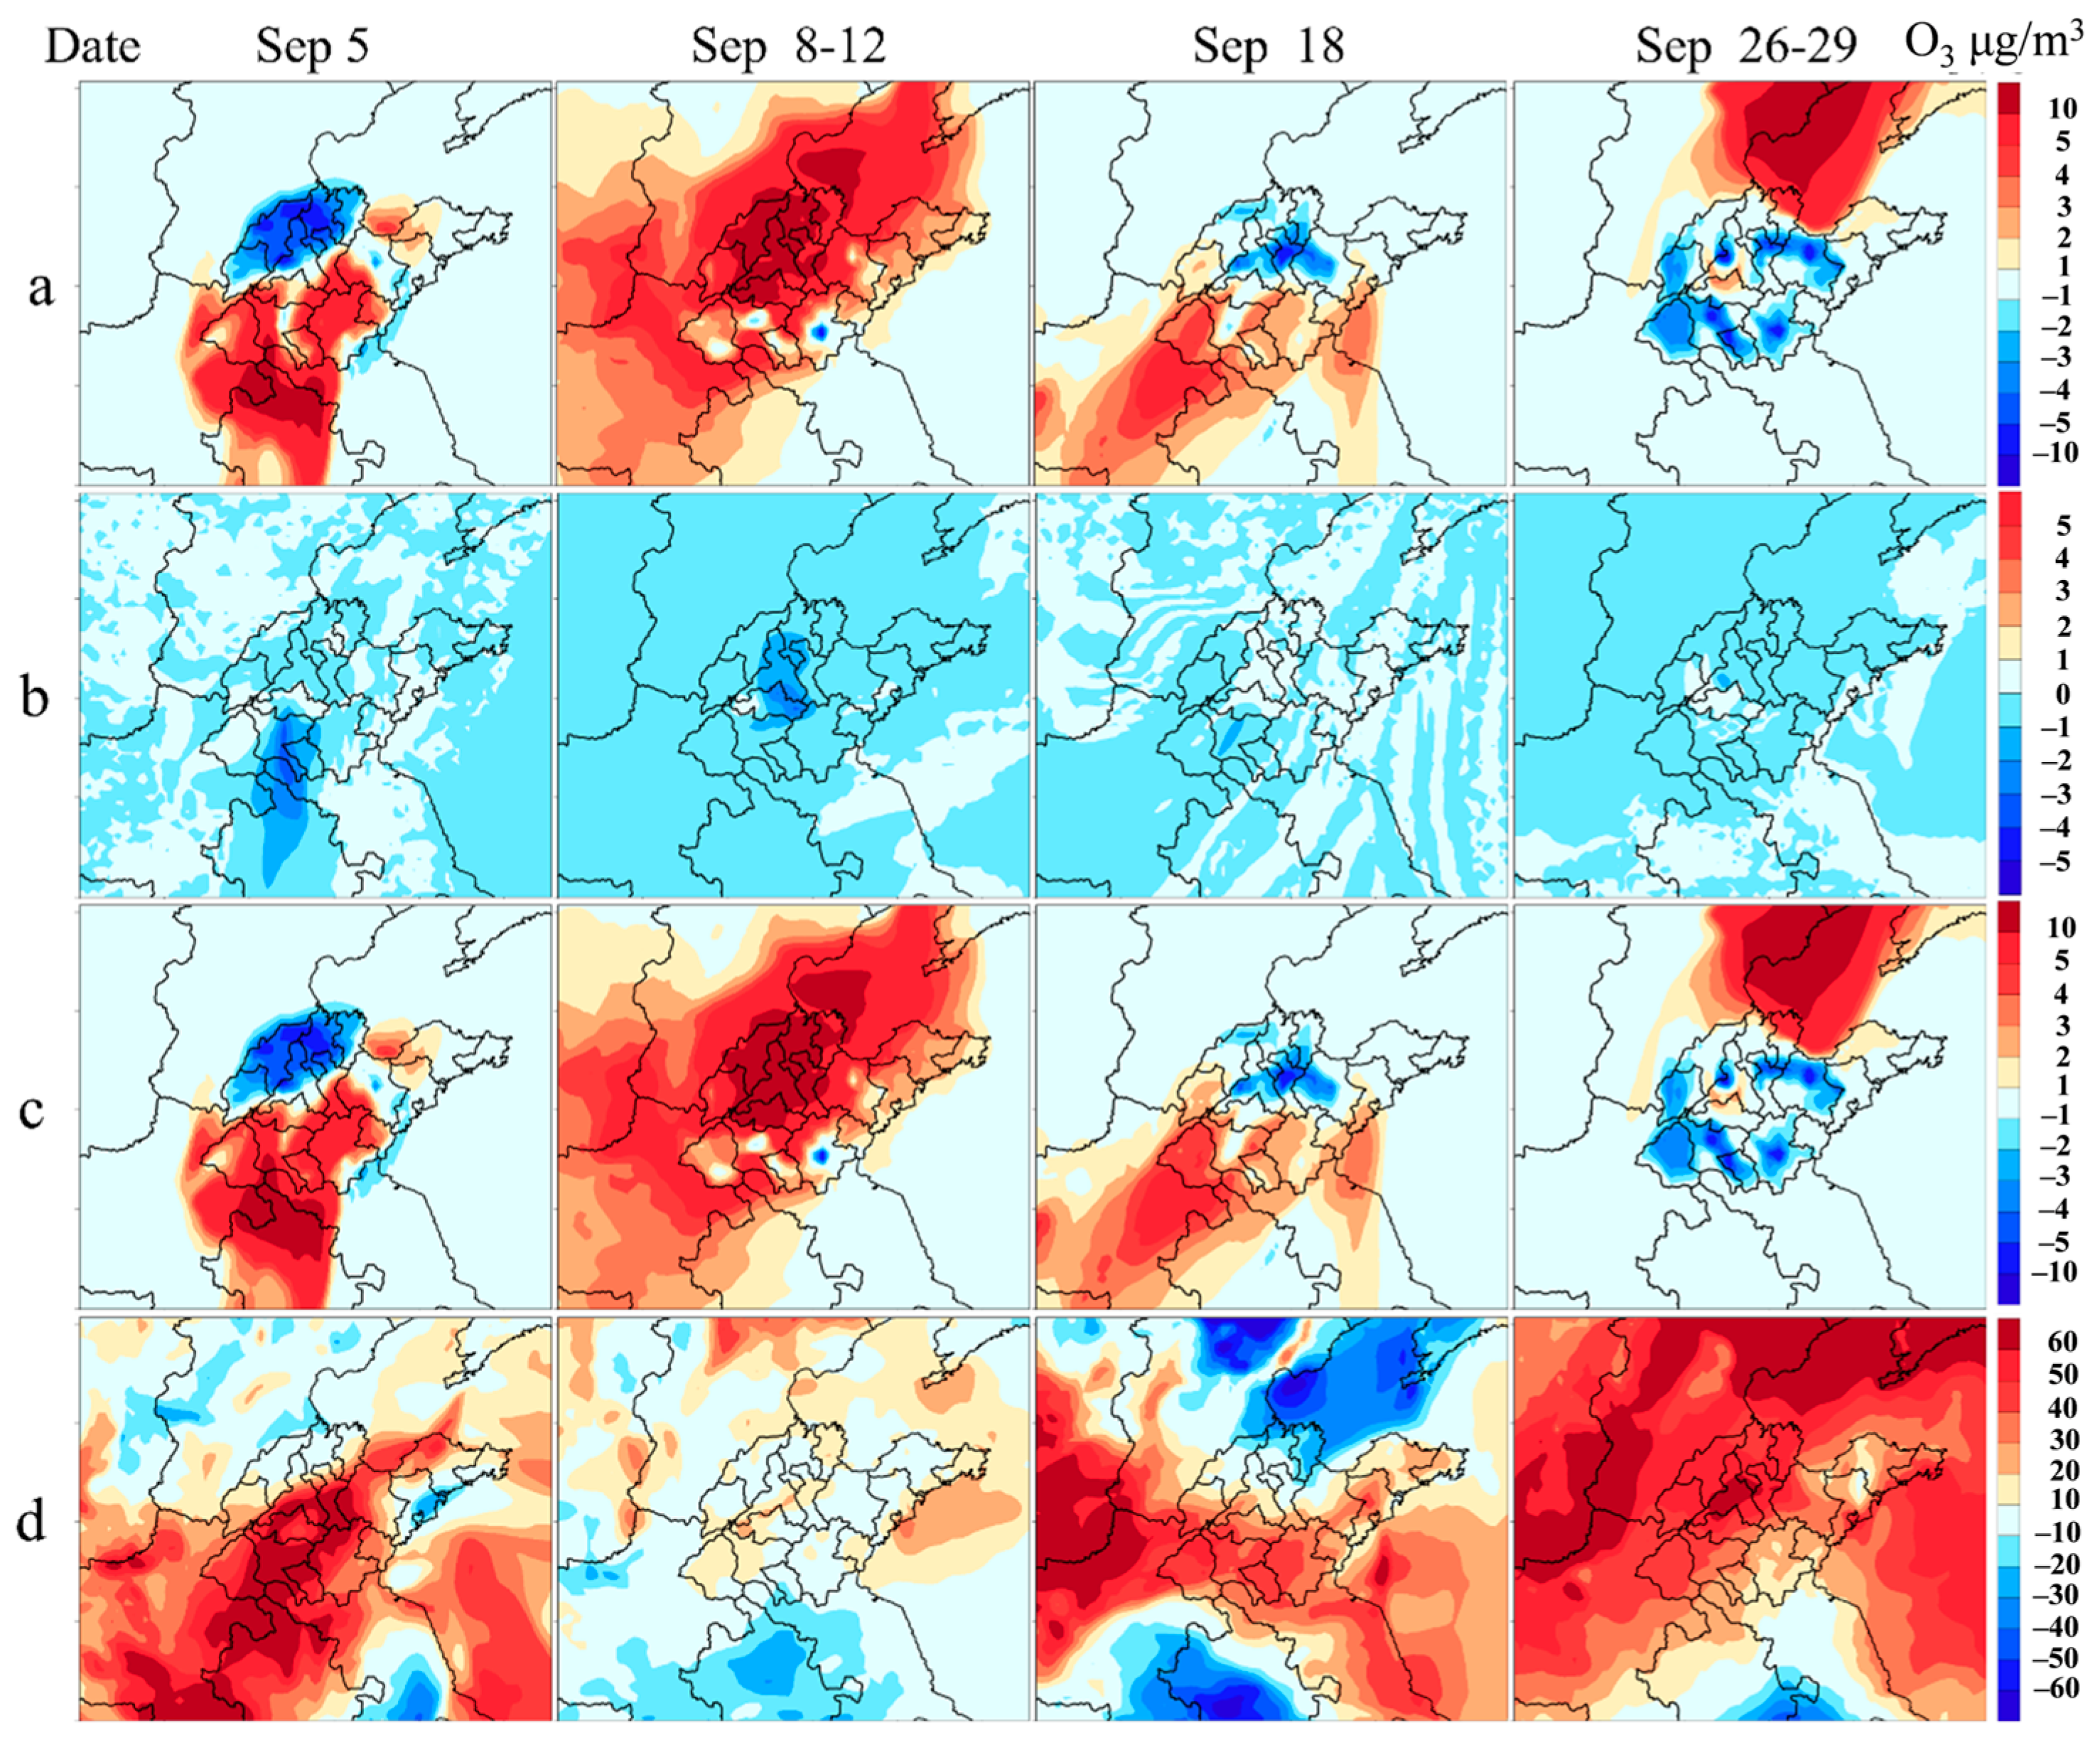
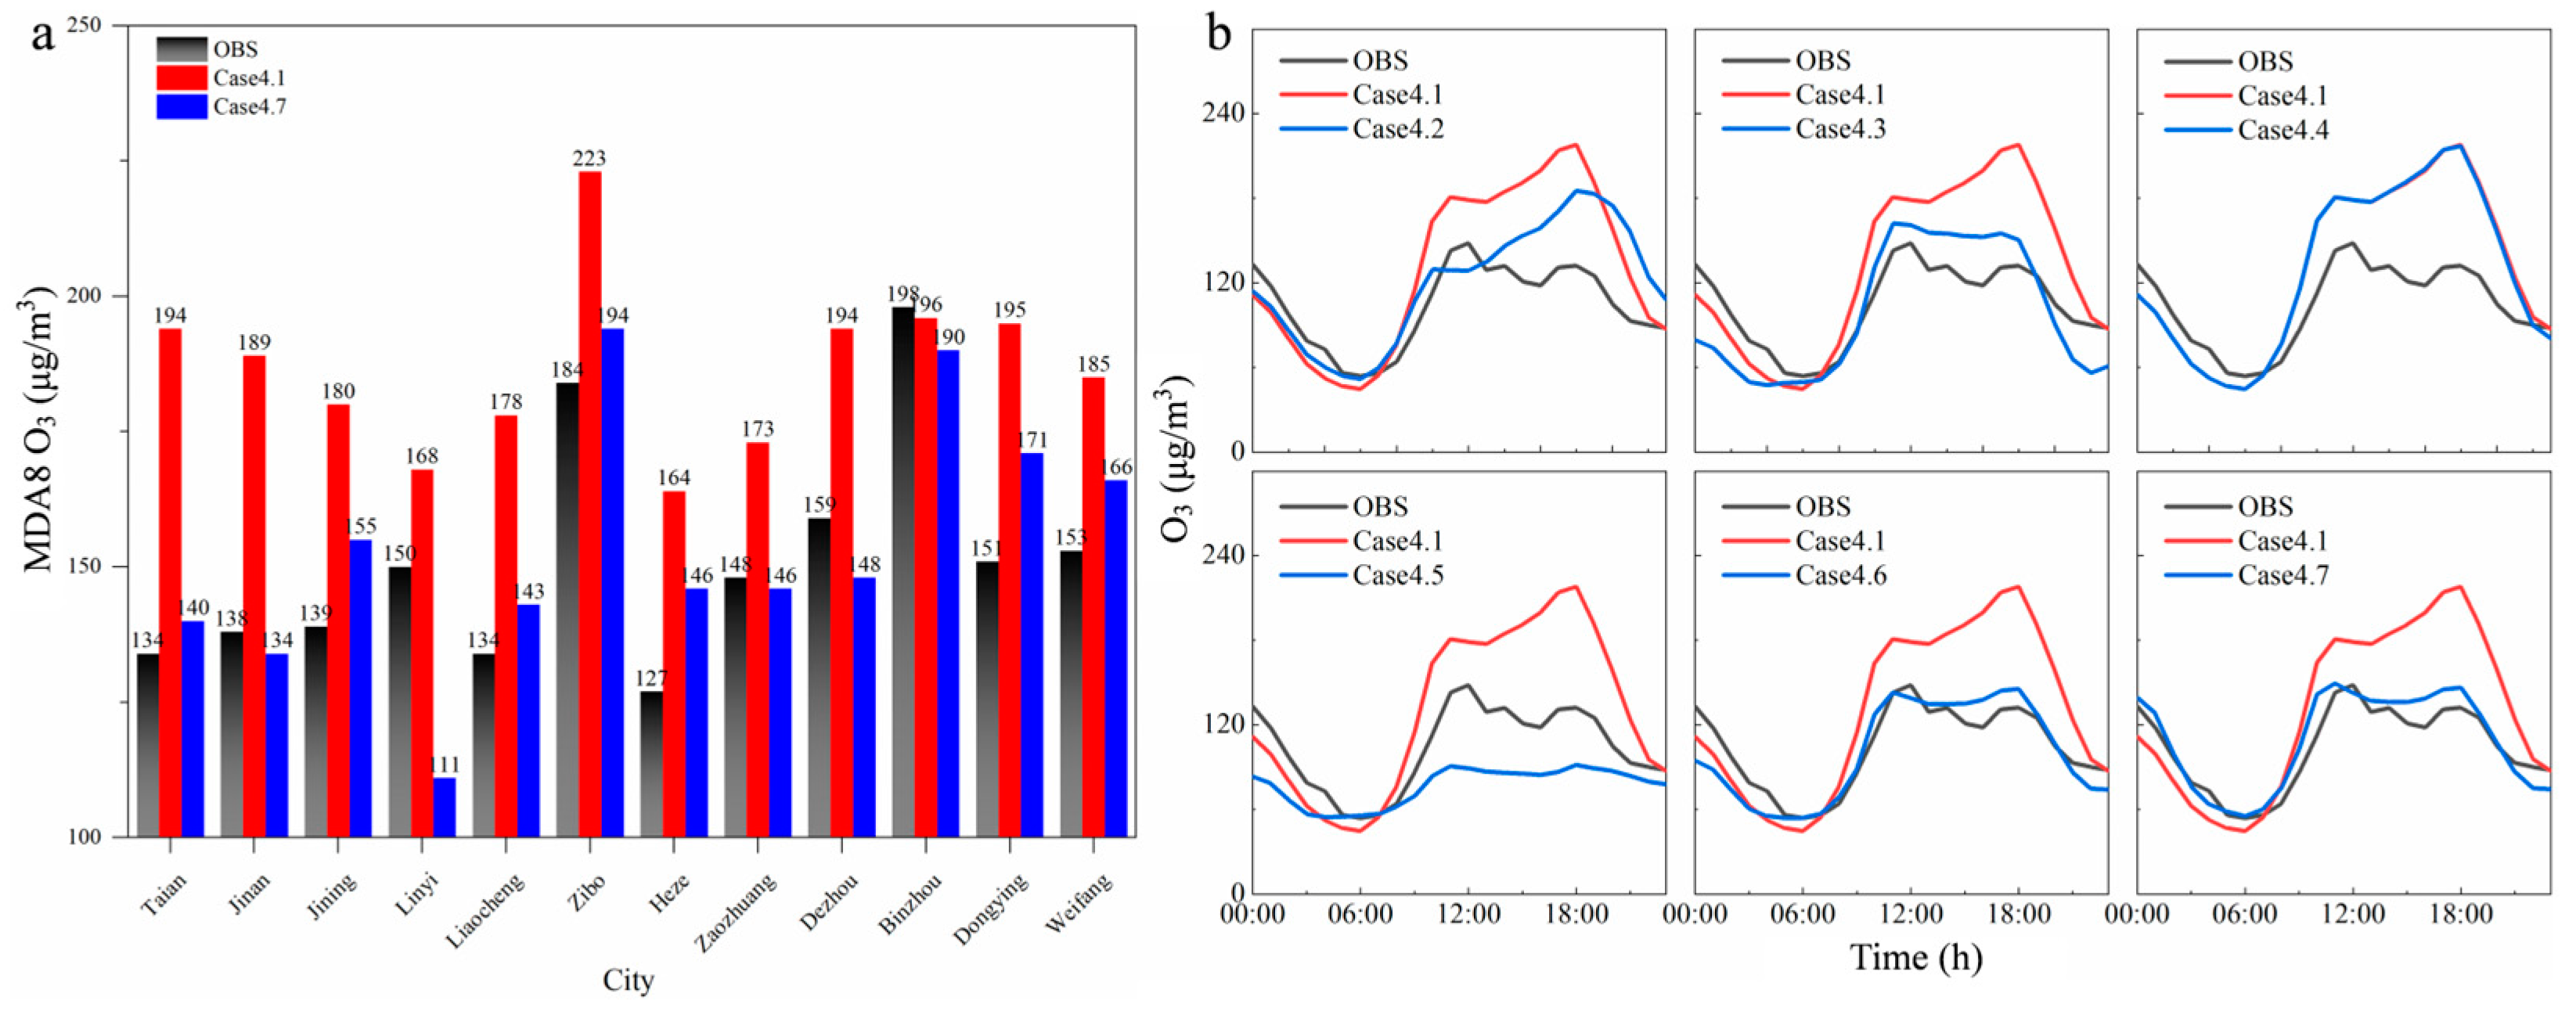
As shown in Figure S4, during the period of HM_2022, we observed partial improvement in NMB (0.10~4.12%) in IN_11 cities under the scenarios of increasing or decreasing NOx emissions while keeping VOCs emissions unchanged (Cases 1.1~1.12). However, this improvement was very negligible, as the model still underestimated the overall O3 concentrations in IN_11 cities (NMB = −2.3~−28.4%). Even when NOx increased by 50%, the model’s underestimation in IN_11 cities (excluding Heze) further intensified (0.82~17.41%). Only when NOx increased or decreased by 50%, the model’s simulated O3 concentrations in Tai’an changed from overestimations (NMB = 3.4%) to underestimations (NMB = −5.2~−2.2%). If NOx emissions remained unchanged, the NMB values in both Tai’an City and IN_11 cities increase (0.16~10.55%) with the increase in VOCs, and vice versa (−15.16~0.17%). When VOCs increased by 50%, the model’s O3 simulation values in Jinan, Weifang, Dongying, Dezhou, and Binzhou changed from underestimations to overestimations, and were very close to the observed values (NMB = 1.0~2.4%). Although the O3 simulation values in Liaocheng, Linyi, Zibo, Jining, Heze, and Zaozhuang were still underestimated, they also closely aligned with the observed values (NMB = −6.9~−0.8%). As expected, a 50% increase in VOCs would exacerbate the model’s overestimation of O3 in Tai’an City. The above evidence indicates that during the 11 days with the high MDA8 O3 in Tai’an City in September 2022, the VOCs emissions in IN_11 cities might have increased by 50% compared to the original inventory, and in some cities, this proportion might even be higher. The main sources of VOCs in the autumn atmosphere of Tai’an are industrial and other anthropogenic sources, with biogenic emissions accounting for a very small proportion (5.4%) [44]. This may be related to the increases in production of VOCs emission products in Shandong province in September 2022. The productions of civil steel ships, ethylene, chemical fibers, machine made paper, and cardboard in Shandong Province increased by 111.2%, 15.9%, 14.7%, and 5.4% year-on-year, respectively (https://data.stats.gov.cn/easyquery.htm?cn=E0101, accessed on 23 April 2025). These products released VOCs during the manufacturing processes, leading to increases in VOCs emissions [45].
We used the same method to control emissions for the highest 11 days of MDA 8 O3 in September 2021. Unlike in 2022, when NOx decreased by 50%, Tai’an City and IN_11 cities (excluding Binzhou, Zibo) showed varying degrees of improvement in NMB (1.45~7.29%), with only Binzhou, Zibo showing minimal deterioration in NMB (−1.50~−3.15%). According to the Shandong Provincial Yearbook [46], the NOx emissions in Shandong Province decreased by 53.5% in 2021 compared to 2016. Therefore, we chose Shandong Province to reduce NOx emissions by 50% and designed the experimental Case 3.8. An increase of 50% in VOCs in the IN_11 cities would lead to an increase of 7.8 µg/m3 in the average MDA8 O3 of HM_2022 in Tai’an City (Case 3.1). However, the individual emission reduction in Tai’an City could to some extent offset the impact of increased external emissions. For example, when VOCs and NOx in Tai’an City were reduced by 25%, 50%, 75%, and 100% in the same proportion (Case 3.2~Case 3.5), the average MDA8 O3 in Tai’an City decreased by 1.5, 3.7, 7.6, and 11.5 µg/m3, respectively. If the emission levels during the HM_2021 period were applied to HM_2022 (Case 3.8), the average MDA8 O3 in Tai’an City was 171.9 µg/m3, even lower than the average MDA8 O3 of the case without emission controls (Base 2, 183.3 µg/m3). In Case 3.6, we maintained the emission level of IN_11 cities at the same level as during HM_2021. Under this condition, the average MDA8 O3 in Tai’an City was 166.1 µg/m3, a decrease of 5.8 µg/m3 compared to Case 3.8, demonstrating the outstanding role of Tai’an City’s individual emission reductions in reducing O3 concentration. However, the increases in emissions in the IN_11 cities (Case 3.7) would lead to an average increase of 16.9 µg/m3 in MDA8 O3 in Tai’an City. Under the combined impacts of strict control measures in Tai’an City and the increases in emissions in the IN_11 cities (Case 3.4), the average MDA8 O3 in Tai’an City would still increase by 11.6 µg/m3, indicating a deteriorating state.
The emission levels of Case 3.4 and Case 3.9 were the same, but the meteorological conditions for Case 3.9 were in September 2021. The MDA8 O3 in Tai’an City was only 134.0 µg/m3, far lower (49.5 µg/m3) than the average MDA8 O3 in Case 3.4 using meteorological conditions in September 2022 (Figure 4). The above results indicated that meteorological conditions had an extremely adverse impact on the O3 level in Tai’an City, being the main reason for the higher average MDA8 O3 during HM_2022 compared to the same period in 2021.
As shown in Figure S5, in order to better understand the meteorological changes in Tai’an City, we compared the meteorological observation data for September. The average temperature in Tai’an City in 2022 is 22.0 °C, slightly lower than 22.5 °C in the same period of 2021. The relationship between O3 and temperature is largely driven by the chemical properties of ethyl peroxide (PAN) [47]. The rise in temperature enhances chemical reaction rates, expedites the generation of O3, and results in an elevated surface O3 concentration [48,49]. Moreover, elevated temperatures contribute to heightened natural emissions, consequently increasing the concentrations of VOCs, thereby favoring O3 formation [50,51]. Since the proportion of VOCs emissions from biological sources is very small [44], so their contribution to O3 formation will be smaller. The higher relative humidity environment can reduce the chain length of peroxides and NO2, lower the ambient temperature, and thus inhibit the generation of O3 [20]. Furthermore, relative humidity significantly affects O3 dry deposition. In areas with high vegetation coverage, plants will close their stomata under drought conditions or in lower relative humidity environments, thereby slowing down O3 absorption [52,53]. There were 12 rainy days in September 2021 in Tai’an City, while there was only one day in September 2022 (http://tianqi.2345.com/wea_history/54827.htm, accessed on 23 April 2025). The decreases in rainfall in Tai’an City resulted in an average relative humidity of only 64.0%, significantly lower than 82.4% in the same period of 2021, which was conducive to the generation of O3. Compared with 2021, in September 2022, the surface pressure (from 986.0 hPa to 987.8 hPa) and boundary layer height (from 396.8 m to 448.9 m) in Tai’an City slightly increased. However, wind speeds (from 2.4 m/s to 2.1 m/s) slightly decreased, indicating that diffusion conditions did not have a significant advantage. Figure S6 shows the spatial distributions of simulated meteorological parameter differences (2022–2021) in Tai’an and surrounding areas in September, which is consistent with the observation results.

3.4. Case Studies

As shown in Figure 5, without changing emissions, the model overestimated the average MDA8 O3 in both Tai’an City and IN_11 cities by 35 µg/m3 (only slightly underestimated 2 µg/m3 for Binzhou). If the NOx and VOCs emissions in Tai’an (Case 4.3) and other cities in Shandong province (Case 4.4) were completely reduced, the MDA8 O3 in Tai’an City decreased by 28 and 38 µg/m3 respectively, indicating that the decreases in O3 concentrations in Tai’an City on that day were caused by the joint emission reductions in Tai’an City and other cities. To reduce the O3 concentrations in cities, regional joint arrangements were more effective. Completely reducing precursor emissions in the surrounding provinces and cities of Shandong (Case 4.4) had almost no impact on the O3 level in Tai’an City, while completely reducing emissions in Shandong province caused serious overestimation of simulated values (46 µg/m3). This indicates that Tai’an City had calm and stable weather on 2 August, and O3 levels were controlled by local and Shandong province’s emissions. Different emission reduction ratios were adopted for Tai’an City and other cities in Shandong province (Case 4.6), and the simulated O3 values in Tai’an City (139 µg/m3) were very close to the observed values (134 µg/m3). On the basis of Case 4.6, the emissions of individual cities were adjusted one by one (Linyi, Dezhou, Weifang: NOx 50%, VOCs 50%; Zibo, Binzhou: NOx 100%, VOCs 100%), and the simulated O3 values of all cities were very close to the observed values (improved from an average overestimation by 35 µg/m3 to an average overestimation by 4 µg/m3), proving the rationality of our emission control plan. Figure 6 shows the spatial distribution map of O3 on 2 August, reflecting a good simulation of O3 in the region.

4. Conclusions

This study evaluates the O3 concentration under various O3 precursor emission control schemes in Tai’an City in 2022. When O3 pollutions were severe, 94.4% of MDA8 O3 values in Tai’an City were ranked no higher than in 2021. Whether using O3–8h-90per or Ave-MDA8 O3 (the highest 50) as evaluation indicators, Tai’an City has a strong advantage in the provincial ranking in 2022. These provide strong evidence that the strict control measures taken by Tai’an City during the periods of severe O3 pollutions were very effective in reducing the O3 concentrations in the city. The evaluation results show that without changing the original emission inventory, the model overestimated the observed value of Tai’an City as the highest (3.4~7.7%). When only considering the HMH_2022 period, the model underestimated the O3 levels in the IN_11 cities (−11.0~−2.2%). This result suggested that the original inventory slightly overestimated the actual emissions of Tai’an City, being likely related to the emission reduction measures implemented by Tai’an City during the “One City, One Policy” period. The simulation results of Case 1.1~Case 3.9 showed that when the VOCs emissions in the IN_11 cities increased by 50%, the O3 simulation values were closer to the observations. In this scenario, Tai’an City needed to reduce both VOCs and NOx emissions by 75% to control O3 concentrations. The decreases in rainy days and wind speeds in September 2022, as well as other unfavorable meteorological conditions, resulted in a year-on-year increase of 49.5 µg/m3 in the average MDA8 O3 in Tai’an City during HM_2022. The increase in emissions from other cities also led to an increase of 16.9 µg/m3 in the average MDA8 O3 in Tai’an City. Despite unfavorable meteorological conditions, strict emission reduction measures in Tai’an City still reduced the average MDA8 O3 by 5.8 µg/m3. The results from Case 4.1 to Case 4.7 show that applying those emission control schemes in this study to model simulations was reasonable, and the reduction effects of regional joint emission reductions on O3 were better than that of a single city. This indicates that the city’s individual emission reductions can achieve a decrease in MDA8 O3, although it requires a significant cost.

Supplementary Materials

The following supporting information can be downloaded at: https://www.mdpi.com/article/10.3390/atmos16050505/s1. Table S1: Model evaluation statistics for O3 concentrations in 12 inland cities for the period during the period from 1–30 September 2021 and 2022, for the Base1 and Base2 scenario; Figure S1: Comparison of Air Quality Indicators between 2021 and 2022 in Tai’an City; Figure S2: Comparisons of hourly O3 concentrations for observations and model simulations for the Base1 scenario during the period from 1–30 September 2022, in Tai’an; Figure S3: Comparisons of hourly O3 concentrations for observations and model simulations for the Base1 scenario during the period from 1–30 September 2022, in IN_11 cities (excluding Zibo, including Jinan, Linyi, Heze, Dezhou, Dongying, Jining, Liaocheng, Zaozhuang, Binzhoum, and Weifang); Figure S4: The impact of different emission reduction schemes on the simulation of O3, with NMB as the evalution indicator; Figure S5: Time series of observed meteorological parameters including temperature (T), relative humidity (RH), air pressure (P), planetary boundary layer height (PBLH), and wind direction (WD) for the periods from 1–30 September 2021 and 2021 in Tai’an; Figure S6: The spatial distributions of simulated meteorological parameter differences in Tai’an and surrounding areas in September 2021 and 2022.

Author Contributions

Y.L., Q.S. and S.Y. conceived and designed the research. Y.L. and Q.S. ran the model. Y.L. and Q.S. conducted data analysis. Z.S., L.C., H.X., N.Y., Y.G., T.Y., Y.W. and J.C. contributed to scientific discussions. Y.L., Q.S., S.Y. and P.L. wrote and revised the manuscript. All authors have read and agreed to the published version of the manuscript.

Funding

This work was supported by National Natural Science Foundation of China (Nos. 42175084, 72361137007, 21577126, 41561144004), Key Discipline for High Level University Construction in Zhejiang Province (Peak Discipline), Ministry of Science and Technology of China (Nos. 2016YFC0202702, 2018YFC0213506, 2018YFC0213503) and National Air Pollution Control Key Is-sues Research Program (No. DQGG0107).

Institutional Review Board Statement

Not applicable.

Informed Consent Statement

Not applicable.

Data Availability Statement

All model results are available upon request.

Conflicts of Interest

Author Tongsuo Yang was employed by the company Shandong Academy of Environmental Sciences Co., Ltd. The remaining authors declare that the research was conducted in the absence of any commercial or financial relationships that could be construed as a potential conflict of interest.

References

  1. Yu, S.; Mathur, R.; Kang, D.; Schere, K.; Eder, B.; Pleim, J. Performance and Diagnostic Evaluation of Ozone Predictions by the Eta-Community Multiscale Air Quality Forecast System during the 2002 New England Air Quality Study. J. Air Waste Manag. Assoc. 2012, 56, 1459–1471. [Google Scholar] [CrossRef] [PubMed]
  2. Turner, M.C.; Jerrett, M.; Pope, C.A., 3rd; Krewski, D.; Gapstur, S.M.; Diver, W.R.; Beckerman, B.S.; Marshall, J.D.; Su, J.; Crouse, D.L.; et al. Long-Term Ozone Exposure and Mortality in a Large Prospective Study. Am. J. Respir. Crit. Care Med. 2016, 193, 1134–1142. [Google Scholar] [CrossRef]
  3. Liu, S.; Zhang, Y.; Ma, R.; Liu, X.; Liang, J.; Lin, H.; Shen, P.; Zhang, J.; Lu, P.; Tang, X.; et al. Long-term exposure to ozone and cardiovascular mortality in a large Chinese cohort. Environ. Int. 2022, 165, 107280. [Google Scholar] [CrossRef]
  4. Ainsworth, E.A.; Yendrek, C.R.; Sitch, S.; Collins, W.J.; Emberson, L.D. The Effects of Tropospheric Ozone on Net Primary Productivity and Implications for Climate Change. Annu. Rev. Plant Biol. 2012, 63, 637–661. [Google Scholar] [CrossRef]
  5. Mills, G.; Pleijel, H.; Malley, C.; Sinha, B.; Cooper, O.; Schultz, M.; Neufeld, H.; Simpson, D.; Sharps, K.; Feng, Z.; et al. Tropospheric Ozone Assessment Report: Present-day tropospheric ozone distribution and trends relevant to vegetation. Elementa Sci. Anthrop. 2018, 6, 47. [Google Scholar] [CrossRef]
  6. Xu, T.; Zhang, C.; Liu, C.; Hu, Q. Variability of PM2.5 and O3 concentrations and their driving forces over Chinese megacities during 2018–2020. J. Environ. Sci. 2023, 124, 1–10. [Google Scholar] [CrossRef] [PubMed]
  7. Wang, T.; Xue, L.; Brimblecombe, P.; Lam, Y.F.; Li, L.; Zhang, L. Ozone pollution in China: A review of concentrations, meteorological influences, chemical precursors, and effects. Sci. Total Environ. 2017, 575, 1582–1596. [Google Scholar] [CrossRef]
  8. Feng, Y.; Ning, M.; Lei, Y.; Sun, Y.; Liu, W.; Wang, J. Defending blue sky in China: Effectiveness of the “Air Pollution Prevention and Control Action Plan” on air quality improvements from 2013 to 2017. J. Environ. Manag. 2019, 252, 109603. [Google Scholar] [CrossRef]
  9. MEEPRC. China Ecological Environment Status Bulletin 2022. 2023. Available online: https://www.mee.gov.cn/hjzl/sthjzk/zghjzkgb/202305/P020230529570623593284.pdf (accessed on 23 April 2025).
  10. Lu, X.; Zhang, S.; Xing, J.; Wang, Y.; Chen, W.; Ding, D.; Wu, Y.; Wang, S.; Duan, L.; Hao, J. Progress of Air Pollution Control in China and Its Challenges and Opportunities in the Ecological Civilization Era. Engineering 2020, 6, 1423–1431. [Google Scholar] [CrossRef]
  11. Zheng, H.; Kong, S.; He, Y.; Song, C.; Cheng, Y.; Yao, L.; Chen, N.; Zhu, B. Enhanced ozone pollution in the summer of 2022 in China: The roles of meteorology and emission variations. Atmos. Environ. 2023, 301, 119701. [Google Scholar] [CrossRef]
  12. Li, C.; Li, F.; Cheng, Q.; Guo, Y.; Zhang, Z.; Liu, X.; Qu, Y.; An, J.; Liu, Y.; Zhang, S. Divergent summertime surface O3 pollution formation mechanisms in two typical Chinese cities in the Beijing-Tianjin-Hebei region and Fenwei Plain. Sci. Total Environ. 2023, 870, 161868. [Google Scholar] [CrossRef]
  13. Liu, C.; He, C.; Wang, Y.; He, G.; Liu, N.; Miao, S.; Wang, H.; Lu, X.; Fan, S. Characteristics and mechanism of a persistent ozone pollution event in Pearl River Delta induced by typhoon and subtropical high. Atmos. Environ. 2023, 310, 119964. [Google Scholar] [CrossRef]
  14. Lu, X.; Hong, J.; Zhang, L.; Cooper, O.R.; Schultz, M.G.; Xu, X.; Wang, T.; Gao, M.; Zhao, Y.; Zhang, Y. Severe Surface Ozone Pollution in China: A Global Perspective. Environ. Sci. Technol. Lett. 2018, 5, 487–494. [Google Scholar] [CrossRef]
  15. Xu, Y.; Zhang, W.; Huo, T.; Streets, D.G.; Wang, C. Investigating the spatio-temporal influences of urbanization and other socioeconomic factors on city-level industrial NOx emissions: A case study in China. Environ. Impact Assess. Rev. 2023, 99, 106998. [Google Scholar] [CrossRef]
  16. Chen, X.; Zhou, M.; Tang, X. Research on the optimal control strategy for pollution reduction in winter under the constraints of urban air quality targets. Chin. J. Manag. Sci. 2023, 31, 1–9. [Google Scholar]
  17. Liu, Y.; Wang, T. Worsening urban ozone pollution in China from 2013 to 2017—Part 1: The complex and varying roles of meteorology. Atmos. Chem. Phys. 2020, 20, 6305–6321. [Google Scholar] [CrossRef]
  18. Lu, X.; Zhang, L.; Chen, Y.; Zhou, M.; Zheng, B.; Li, K.; Liu, Y.; Lin, J.; Fu, T.-M.; Zhang, Q. Exploring 2016–2017 surface ozone pollution over China: Source contributions and meteorological influences. Atmos. Chem. Phys. 2019, 19, 8339–8361. [Google Scholar] [CrossRef]
  19. Ding, J.; Dai, Q.; Fan, W.; Lu, M.; Zhang, Y.; Han, S.; Feng, Y. Impacts of meteorology and precursor emission change on O3 variation in Tianjin, China from 2015 to 2021. J. Environ. Sci. 2023, 126, 506–516. [Google Scholar] [CrossRef]
  20. Yu, S. Fog geoengineering to abate local ozone pollution at ground level by enhancing air moisture. Environ. Chem. Lett. 2018, 17, 565–580. [Google Scholar] [CrossRef]
  21. Dang, R.; Liao, H.; Fu, Y. Quantifying the anthropogenic and meteorological influences on summertime surface ozone in China over 2012–2017. Sci. Total Environ. 2021, 754, 142394. [Google Scholar] [CrossRef]
  22. Wang, Y.; Gao, W.; Wang, S.; Song, T.; Gong, Z.; Ji, D.; Wang, L.; Liu, Z.; Tang, G.; Huo, Y.; et al. Contrasting trends of PM2.5 and surface-ozone concentrations in China from 2013 to 2017. Natl. Sci. Rev. 2020, 7, 1331–1339. [Google Scholar] [CrossRef]
  23. Zeng, Y.; Cao, Y.; Qiao, X.; Seyler, B.C.; Tang, Y. Air pollution reduction in China: Recent success but great challenge for the future. Sci. Total Environ. 2019, 663, 329–337. [Google Scholar] [CrossRef]
  24. Xiao, X.; Cohan, D.S.; Byun, D.W.; Ngan, F. Highly nonlinear ozone formation in the Houston region and implications for emission controls. J. Geophys. Res. Atmos. 2010, 115, D23. [Google Scholar] [CrossRef]
  25. Di, T.; Cohan, D.S.; Napelenok, S.; Bergin, M.; Hu, Y.; Chang, M.; Russell, A.G. Uncertainty Analysis of Ozone Formation and Response to Emission Controls Using Higher-Order Sensitivities. J. Air Waste Manag. Assoc. 2010, 60, 797–804. [Google Scholar]
  26. Cohan, D.S.; Hakami, A.; Hu, Y.; Russell, A.G. Nonlinear Response of Ozone to Emissions: Source Apportionment and Sensitivity Analysis. Environ. Sci. Technol. 2005, 39, 6739–6748. [Google Scholar] [CrossRef]
  27. Li, K.; Liu, M.; Mei, R. Pollution Characteristics and Sensitivity Analysis of Atmospheric Ozone in Tai’an City. Environ. Sci. 2020, 41, 3539–3546. [Google Scholar]
  28. Zhang, C.; Song, Y.; Wang, H.; Zeng, L.; Hu, M.; Lu, K.; Xie, S.; Carter, W.P.L. Observation-Based Estimations of Relative Ozone Impacts by Using Volatile Organic Compounds Reactivities. Environ. Sci. Technol. Lett. 2021, 9, 10–15. [Google Scholar] [CrossRef]
  29. Feng, R.; Luo, K.; Fan, J.-R. Decoding Tropospheric Ozone in Hangzhou, China: From Precursors to Sources. Asia-Pac. J. Atmos. Sci. 2019, 56, 321–331. [Google Scholar] [CrossRef]
  30. Wu, Y.; Wang, P.; Yu, S.; Wang, L.; Li, P.; Li, Z.; Mehmood, K.; Liu, W.; Wu, J.; Lichtfouse, E.; et al. Residential emissions predicted as a major source of fine particulate matter in winter over the Yangtze River Delta, China. Environ. Chem. Lett. 2018, 16, 1117–1127. [Google Scholar] [CrossRef]
  31. Yan, R.; Wang, H.; Huang, C.; An, J.; Bai, H.; Wang, Q.; Gao, Y.; Jing, S.; Wang, Y.; Su, H. Impact of spatial scales of control measures on the effectiveness of ozone pollution mitigation in eastern China. Sci. Total Environ. 2024, 906, 167521. [Google Scholar] [CrossRef] [PubMed]
  32. Wang, Y.; Liao, H. Effect of emission control measures on ozone concentrations in Hangzhou during G20 meeting in 2016. Chemosphere 2020, 261, 127729. [Google Scholar] [CrossRef]
  33. Yu, S.; Mathur, R.; Pleim, J.; Wong, D.; Gilliam, R.; Alapaty, K.; Zhao, C.; Liu, X. Aerosol indirect effect on the grid-scale clouds in the two-way coupled WRF–CMAQ: Model description, development, evaluation and regional analysis. Atmos. Chem. Phys. 2014, 14, 11247–11285. [Google Scholar] [CrossRef]
  34. Pleim, J.E. A Combined Local and Nonlocal Closure Model for the Atmospheric Boundary Layer. Part I: Model Description and Testing. J. Appl. Meteorol. Climatol. 2007, 46, 1383–1395. [Google Scholar] [CrossRef]
  35. Thompson, G.; Morrison, H.; Tatarskii, V. Impact of Cloud Microphysics on the Development of Trailing Stratiform Precipitation in a Simulated Squall Line: Comparison of One- and Two-Moment Schemes. Mon. Weather Rev. 2009, 137, 991–1007. [Google Scholar]
  36. Dou, X.; Li, M.; Jiang, Y.; Song, Z.; Li, P.; Yu, S. Different contributions of meteorological conditions and emission reductions to the ozone pollution during Shanghai’s COVID-19 lockdowns in winter and spring. Atmos. Pollut. Res. 2024, 15, 102252. [Google Scholar] [CrossRef]
  37. Zhang, Y.; Yu, S.; Chen, X.; Li, Z.; Li, M.; Song, Z.; Liu, W.; Li, P.; Zhang, X.; Lichtfouse, E.; et al. Local production, downward and regional transport aggravated surface ozone pollution during the historical orange-alert large-scale ozone episode in eastern China. Environ. Chem. Lett. 2022, 20, 1577–1588. [Google Scholar] [CrossRef]
  38. Liu, Y.; Wang, T.; Stavrakou, T.; Elguindi, N.; Doumbia, T.; Granier, C.; Bouarar, I.; Gaubert, B.; Brasseur, G.P. Diverse response of surface ozone to COVID-19 lockdown in China. Sci. Total Environ. 2021, 789, 147739. [Google Scholar] [CrossRef]
  39. Yao, S.; Wei, W.; Cheng, S.; Niu, Y.; Guan, P. Impacts of Meteorology and Emissions on O3 Pollution during 2013–2018 and Corresponding Control Strategy for a Typical Industrial City of China. Atmosphere 2021, 12, 619. [Google Scholar] [CrossRef]
  40. Zhou, M.; Li, Y.; Zhang, F. Spatiotemporal Variation in Ground Level Ozone and Its Driving Factors: A Comparative Study of Coastal and Inland Cities in Eastern China. Int. J. Environ. Res. Public Health 2022, 19, 9687. [Google Scholar] [CrossRef] [PubMed]
  41. Liu, P.; Song, H.; Wang, T.; Wang, F.; Li, X.; Miao, C.; Zhao, H. Effects of meteorological conditions and anthropogenic precursors on ground-level ozone concentrations in Chinese cities. Environ. Pollut. 2020, 262, 114366. [Google Scholar] [CrossRef]
  42. Yang, L.; Luo, H.; Yuan, Z.; Zheng, J.; Huang, Z.; Li, C.; Lin, X.; Louie, P.K.K.; Chen, D.; Bian, Y. Quantitative impacts of meteorology and precursor emission changes on the long-term trend of ambient ozone over the Pearl River Delta, China, and implications for ozone control strategy. Atmos. Chem. Phys. 2019, 19, 12901–12916. [Google Scholar] [CrossRef]
  43. Yu, S.; Eder, B.; Dennis, R.; Chu, S.H.; Schwartz, S.E. New unbiased symmetric metrics for evaluation of air quality models. Atmos. Sci. Lett. 2006, 7, 26–34. [Google Scholar] [CrossRef]
  44. Wang, L.; Zhou, X.; Liu, Y.; Liu, H.; Zhang, Y.; Fan, G. Characteristics and Source Apportionment of Atmospheric Volatile Organic Compounds of Tai’an Urban Area in Autumn. Acta Sci. Nat. Univ. Pekin. 2024, 60, 329–340. [Google Scholar]
  45. Hui, L.; Liu, X.; Tan, Q.; Feng, M.; An, J.; Qu, Y.; Zhang, Y.; Jiang, M. Characteristics, source apportionment and contribution of VOCs to ozone formation in Wuhan, Central China. Atmos. Environ. 2018, 192, 55–71. [Google Scholar] [CrossRef]
  46. Shandong Provincial Bureau of Statistics. Shandong Statistics Yearbook 2022; China Statistics Press: Beijing, China, 2022. [Google Scholar]
  47. Sillman, S.; Samson, P.J. Impact of temperature on oxidant photochemistry in urban, polluted rural and remote environments. J. Geophys. Res. Atmos. 1995, 100, 11497–11508. [Google Scholar] [CrossRef]
  48. Zhao, S.; Yu, Y.; Yin, D.; Qin, D.; He, J.; Dong, L. Spatial patterns and temporal variations of six criteria air pollutants during 2015 to 2017 in the city clusters of Sichuan Basin, China. Sci. Total Environ. 2018, 624, 540–557. [Google Scholar] [CrossRef]
  49. Pusede, S.E.; Steiner, A.L.; Cohen, R.C. Temperature and Recent Trends in the Chemistry of Continental Surface Ozone. Chem. Rev. 2015, 115, 3898–3918. [Google Scholar] [CrossRef]
  50. Lu, X.; Zhang, L.; Shen, L. Meteorology and Climate Influences on Tropospheric Ozone: A Review of Natural Sources, Chemistry, and Transport Patterns. Curr. Pollut. Rep. 2019, 5, 238–260. [Google Scholar] [CrossRef]
  51. Coates, J.; Mar, K.A.; Ojha, N.; Butler, T.M. The influence of temperature on ozone production under varying NOx conditions—A modelling study. Atmos. Chem. Phys. 2016, 16, 11601–11615. [Google Scholar] [CrossRef]
  52. Kavassalis, S.C.; Murphy, J.G. Understanding ozone-meteorology correlations: A role for dry deposition. Geophys. Res. Lett. 2017, 44, 2922–2931. [Google Scholar] [CrossRef]
  53. Juran, S.; Karl, T.; Ofori-Amanfo, K.K.; Sigut, L.; Zavadilova, I.; Grace, J.; Urban, O. Drought shifts ozone deposition pathways in spruce forest from stomatal to non-stomatal flux. Environ. Pollut. 2025, 372, 126081. [Google Scholar] [CrossRef] [PubMed]
Figure 1. (a) Simulated domain; (b) Distribution of cities in Shandong Province. Different colors represent different provinces and cities (BTH: Beijing, Tianjin, Hebei; HN: Henan; AH: Anhui; JS: Jiangsu; SD: Shandong; TA: Tai’an; JNA: Jinan; JNI: Jining; LY: Linyi; LC: Liaocheng; ZB: Zibo; HZ: Heze; ZZ: Zaozhuang; DZ: Dezhou; BZ: Binzhou; DY: Dongying; WF: Weifang; RZ: Rizhao; QD: Qingdao; YT: Yantai; WH: Weihai).
Atmosphere 16 00505 g001
Figure 2. Differences in MDA8 O3 at the same rank in year and months in Tai’an City in 2021 and 2022. The x-axis represents the rank of daily MDA8 O3 concentrations in ascending order within each month or for the entire year. The black and red solid lines represent MDA8 O3 in 2021 and 2022, respectively. The red dashed lines represent the secondary standard of MDA8 O3 (160 µg/m3), and orange bars represent the difference in MDA8 O3 at the same rank between 2022 and 2021. The shaded areas represent the MDA8 O3 values and their positions that determine O3–8h-90per.
Atmosphere 16 00505 g002
Figure 3. The proportion of the highest 50 days of MDA8 O3 throughout the year distributed in different months (from March to October, 2021 and 2022). Different months are represented by different colors.
Atmosphere 16 00505 g003
Figure 4. Changes in O3 concentrations caused by emission control and meteorological conditions calculated by differences between the results of two cases: (a) Case 3.4 and Case 3.8, (b) Case 3.6 and Case 3.8, (c) Case 3.7 and Case 3.8, (d) Case3.4 and Case 3.9.
Atmosphere 16 00505 g004
Figure 5. (a) Comparisons of observed (black) and simulated MDA8 O3 for Tai’an City and IN_11 cities for Case 4.1 (red) and Case 4.7 (blue) scenarios. (b) Time series of observed (black) and simulated O3 in Tai’an City on 2 August 2022, for Case 4.1~Case 4.7 scenarios. (OBS: average observation concentrations).
Atmosphere 16 00505 g005
Figure 6. Spatial distributions of simulated regional O3 concentrations at 10:00 (a), 12:00 (b), 14:00 (c), and 16:00 (d) on 2 August 2022. The left column represents the Case 4.1, the middle column represents the Case 4.7, and the right column shows the differences in O3 concentrations between these two cases. Different colored dots represent observed O3 values at monitoring stations in various cities. The white oval box represents the Shandong Province region, while the black oval box represents the Tai’an City region.
Atmosphere 16 00505 g006
Table 1. Description of base (Base1 and Base2) and emission control (Case 1.1~Case 2.12) scenarios for estimating the actual emissions of O3 precursors in various cities (TA: Tai’an; IN_11: the eleven inland cities; CO_4: the four coastal cities; NPC_6: six neighboring provinces and cities). Meteorology column shows meteorological conditions at different time periods (SEP_2022: September 2022; SEP_2021: September 2022; HMS_2022: 4~12, 17, 18, and 25~29 September in 2022; HMS_2021: 7~16, 21, 22, and 29, 30 September in 2021).
CasesMeteorologyEmission Control Areas and Proportions
TA and IN_11CO_4, NPC_6 and OTH
VOCsNOxVOCsNOx
Base 1SEP_2022100%100%100%100%
Base 2SEP_2021100%100%100%100%
Case 1.1HMS_2022100%150%100%100%
Case 1.2100%125%100%100%
Case 1.3100%110%100%100%
Case 1.4100%90%100%100%
Case 1.5100%75%100%100%
Case 1.6100%50%100%100%
Case 1.7150%100%100%100%
Case 1.8125%100%100%100%
Case 1.9110%100%100%100%
Case 1.1090%100%100%100%
Case 1.1175%100%100%100%
Case 1.1250%100%100%100%
Case 2.1HMS_2021100%150%100%100%
Case 2.2100%125%100%100%
Case 2.3100%110%100%100%
Case 2.4100%90%100%100%
Case 2.5100%75%100%100%
Case 2.6100%50%100%100%
Case 2.7150%100%100%100%
Case 2.8125%100%100%100%
Case 2.9110%100%100%100%
Case 2.1090%100%100%100%
Case 2.1175%100%100%100%
Case 2.1250%100%100%100%
Table 2. Simulation descriptions for estimating the actual emission levels in Tai’an City and quantifying the contributions of precursor changes and meteorological factors. The abbreviations are same as Table 1.
CasesMeteorologyEmission Control Areas and Proportions
TAIN_11CO_4, NPC_6 and OTH
VOCsNOxVOCsNOxVOCsNOx
Case 3.1HMS_2022100%100%150%100%100%100%
Case 3.275%75%150%100%100%100%
Case 3.350%50%150%100%100%100%
Case 3.425%25%150%100%100%100%
Case 3.500150%100%100%100%
Case 3.625%25%100%50%100%100%
Case 3.7100%50%150%100%100%100%
Case 3.8100%50%100%50%100%100%
Case 3.9HMS_202125%25%150%100%100%100%
Table 3. Description of emission control scenarios in the case study. The abbreviations are the same as Table 1.
CasesMeteorologyEmission Control Areas and Proportions
TAIN_11 and CO_4NPC_6
VOCsNOxVOCsNOxVOCsNOx
Case 4.11~2 August 2022100%100%100%100%100%100%
Case 4.200100%100%100%100%
Case 4.3100%100%00100%100%
Case 4.4100%100%100%100%00
Case 4.50000100%100%
Case 4.650%50%10%10%100%100%
Case 4.750%50%**100%100%
“*” Different cities in the Case 4.7 had adopted different emission control ratios, where LY, DZ, WF: VOCS 50%, NOX 50%; ZB, BZ: VOCS 100%, NOX 100%.
Table 4. Comparisons of O3 indicators among 16 cities in Shandong Province. Ave_MDA8 O3 (the highest 50): the average value of MDA8 O3 for the highest 50 days of MDA8 O3 throughout the year.
CasesTypeO3–8h-90perAve_MDA8 O3 (The Highest 50)
YearYear
20212022Change RateRanking20212022Change RateRanking
Tai’anTA184.0178.0−3.3%1200.4195.0−2.7%2
RizhaoCO_4153.6151.0−1.7%2170.5164.2−3.7%1
JinanIN_11180.6182.00.8%3197.4199.31.0%3
BinzhouIN_11180.0184.62.6%4196.3206.04.9%8
YantaiCO_4150.0156.64.4%5160.1173.08.0%13
HezeIN_11168.6176.24.5%6189.3195.43.3%6
LinyiIN_11168.0176.04.8%7185.5191.43.2%5
ZaozhuangIN_11172.6181.65.2%8190.6195.32.5%4
ZiboIN_11182.0191.65.3%9198.0208.15.1%10
LiaochengIN_11166.2176.86.4%10185.4196.15.8%11
QingdaoCO_4143.6153.67.0%11160.5168.44.9%9
WeihaiCO_4145.0155.67.3%12156.8170.68.8%14
JiningIN_11169.2182.07.6%13189.0200.86.2%12
DezhouIN_11170.6183.67.6%14191.0199.54.4%7
WeifangIN_11155.0168.08.4%15165.8186.012.2%16
DongyingIN_11166.0185.211.6%16182.3201.610.6%15
Disclaimer/Publisher’s Note: The statements, opinions and data contained in all publications are solely those of the individual author(s) and contributor(s) and not of MDPI and/or the editor(s). MDPI and/or the editor(s) disclaim responsibility for any injury to people or property resulting from any ideas, methods, instructions or products referred to in the content.

