Article

Impact of Changes of Land Use on Water Quality, from Tropical Forest to Anthropogenic Occupation: A Multivariate Approach

by
Alexis Joseph Rodríguez-Romero
1,
Axel Eduardo Rico-Sánchez
1,
Erick Mendoza-Martínez
1,
Andrea Gómez-Ruiz
1,
Jacinto Elías Sedeño-Díaz
2 and
Eugenia López-López
1,*
1
Laboratorio de Evaluación de la Salud de los ecosistemas Acuáticos, Instituto Politécnico Nacional, Prolongación de Carpio y Plan de Ayala 11340, 07738 Ciudad de Mexico, Mexico
2
Coordinación Politécnica para la Sustentabilidad, Instituto Politécnico Nacional, Instituto Politécnico Nacional, 07738 Ciudad de Mexico, Mexico
*
Author to whom correspondence should be addressed.
Water 2018, 10(11), 1518; https://doi.org/10.3390/w10111518
Submission received: 6 September 2018 / Revised: 17 October 2018 / Accepted: 23 October 2018 / Published: 26 October 2018
(This article belongs to the Section Water Quality and Contamination)

Abstract

:
Worldwide, it is acknowledged that changes of land use influence water quality; however, in tropical forests, the relationship between land use and water quality is still poorly understood. This study assessed spatial and seasonal variations in water quality, and the relationship between water quality and changes of land use in the Bobos-Nautla River, whose upper course runs across a patch of a tropical cloud forest. Spatial and seasonal variations in water quality and land use were assessed with multivariate tools. A cluster analysis, as well as a Principal Component Analysis (PCA-3D), identified three groups of sites: (1) an upper portion, which showed the best water quality and the broadest natural vegetation coverage; (2) a middle course, with high nitrogen and phosphorus concentrations associated with extensive agricultural uses; and (3) a lower course, characterized by the highest levels of total and fecal coliforms, as well as ammonia nitrogen, associated with the highest percentage of urbanization and human settlements. Our findings demonstrate the impact of changes of land use on water quality of rivers running through cloud forests in tropical zones, which are currently endangered ecosystems.

1. Introduction

It is recognized that climate change is a process that evolves slowly, reflecting a set of modifications that are evident in the long term. However, changes of land use have short-term, frequently drastic effects, leading to considerable impacts on environmental and hydrological processes (infiltration, groundwater recharge, base flow, runoff, water quality) [1]. Understanding the relationship between land use and freshwater quality is key for effective water management, both currently and in the future [2,3].
The quality of freshwater reflects the combined effects of multiple natural processes and the anthropogenic changes of land use [4,5]. Runoff from catchment areas into water bodies is the main source of nutrients and pollutants [6]; consequently, the relationship between water quality in lotic environments and changes of land use has raised a growing interest within the scientific community, as landscape patterns regulate physical and biogeochemical processes in the basin [7]. Agriculture and urbanization are the main sources of nutrients and xenobiotics that degrade water quality in water bodies [8]. The conversion of native vegetation to agriculture and human settlements has significantly increased the human well-being at the expense of the degradation of many ecosystem services and biodiversity [9,10]. Particularly, the annual deforestation rate has increased dramatically in tropical zones [11,12], and although the deforestation rate showed a 50% decrease in 2015 relative to 1990 worldwide, in Mexico the loss of forest areas still prevails [12]. According to the Secretariat of Environment and Natural Resources (SEMARNAT), 29% of the original natural vegetation coverage in the Mexican territory had been lost by 2011 [13], with mountain cloud forests among the ecosystems most vulnerable to changes of land use [14]. In developing countries, the combination of a vigorous population growth rate, industrialization, and expanding agricultural areas has exerted and ever-increasing pressure on water [15] and forest resources, impacting ecological processes. In Mexico, cloud forests are seriously threatened by deforestation and habitat fragmentation [16]. For this reason, environmental policies and management plans for the conservation of water and forest resources should be developed.
Cloud forests cover a mere 1% of the Mexican territory, ranking second among the ecosystems with the highest species richness in Mesoamerica [17]. This forest is characterized by several arboreal strata with a high abundance of ferns and epiphytes, as well as a high biodiversity associated with its unique climatic conditions: high cloudiness, fog at the canopy level, and high relative humidity [18,19]. However, models on the effects of changes of land use on climate change have predicted an estimated loss of up to 70% of cloud forest area by 2080 [20]. Changes of land use in ecosystems as vulnerable as cloud forests affect biodiversity and ecosystem services, including the hydrological cycle [21]. The influence of changes of land use on water quality of rivers running through these forests is currently poorly understood, particularly in areas with a mosaic of land uses along the river course. Some research [22,23] has demonstrated that cloud forest vegetation can function as a natural filter against pollutants dumped in watersheds; hence, vegetation cover, diversity, and structure are key drivers of water quality. Although changes of land use associated with loss of water quality have been reported for several countries in various works [22,23,24], the information on this issue in Mexico is scarce. First-order streams with different land uses including cloud forest, grassland, and coffee plantations, which were related to eight ions in water (Ca2+, CO32−, NO3, Cl, Na+, Mg2+, and K+) and total suspended solids, and to the structure of vegetation, were analyzed [25], indicating that the ions studied increased in grassland and coffee plantations but were lower in forest cloud forest, and a loss of vegetation diversity was detected.
In this sense, there is a large number of tools for the detection of the effects of climate change and land uses on water quality [1,3]. Among them, modeling has proven to be a reliable tool for predicting the long-term effects of climate change on water quality. Some models are based primarily on spatial analysis using Geographic Information Systems (GIS) through satellite imagery and digital elevation that incorporate various watershed attributes in addition to land use areas and water quality parameters (slope, precipitation, air temperature, topography and soil parameters, river flow, elevation, and anthropogenic factors influencing land use, among others) [1,3,26,27,28]; other models include time series, linear models, multiple linear regression, and constrained least squares models [26,29]. Models are also used to explore the behavior of pollutant levels in stream water under different scenarios. The current heavy deforestation and high rate of land use change in tropical forests cause short-term effects in the water quality of rivers flowing across them; therefore, studies should be conducted to identify the main factors affecting water quality in these areas.
Water quality is controlled by multiple factors, including the connectivity and interaction of the river with the watershed. Multivariate statistical methods (cluster analysis, CA; principal component analysis, PCA) are key methods to evaluate the correlations among the various water quality parameters and land uses to identify the key drivers affecting water quality and influencing the aquatic ecosystem. CA and PCA have been extensively used to characterize and evaluate freshwater quality, revealing temporal and spatial variations caused by natural and anthropogenic factors [30,31,32,33]. CA is an unsupervised pattern-recognition technique that reveals the intrinsic structure or underlying behavior of a data set without making a priori assumptions about the data, in order to sort the components of a system into categories or clusters according to their similarity [34]. In the clustering procedure, study sites (components) are sorted in such a way that similar components are clustered into the same class sharing a particular set of properties [35]. Thus, cluster analysis allows interpreting the data and identifying patterns [34]. For its part, PCA is a powerful tool for pattern recognition and detection of correlations (or co-variances) among a set of variables or samples. It provides information on the most significant parameters associated with spatial and temporal variations; it also describes whole data sets by excluding the least significant parameters with minimum loss of the original information [36]. It is extremely useful for the analysis of data involving a large number of variables. It has been extensively used as an unbiased method that reveals associations between samples and variables [37]. Furthermore, the potential capabilities of GIS combined with multivariate statistical analyses for assessing water quality have been explored [38]. Thus, the combined use of GIS with CA and PCA facilitates the interpretation of complex databases to gain a deeper insight on water quality in watershed studies, being key in the development of appropriate strategies for effective management of water resources [34]. Although several studies in temperate latitudes use CA/PCA to assess the relationship between changes in land use and their impact on water quality, as is the case of [34], this is the first study that uses both tools (CA/PCA) in combination with GIS to explore the effect of changes of land use in a tropical cloud forest on water quality of a stream running through it in Mexico.
This study aims to investigate the temporal and spatial variations in water quality as related to land uses along the Bobos River, Veracruz, a hydrological system that flows through an important cloud forest area in the Gulf of Mexico slope. In order to analyze land uses and water quality indicators, we used CA and PCA to detect patterns (clusters of study sites) and to identify the key parameters (land uses and water quality indicators) associated with seasonal and spatial patterns.

2. Materials and Methods

2.1. Study Area

The Bobos River is located in the northeastern portion of the Gulf of Mexico slope, within the Nautla River basin; a section of the main river channel flows across the natural protected area named “Filobobos River and its Surroundings” (Río Filobobos y su Entorno; Figure 1). The basin is used for multiple activities, including mining in the upper course, the production of banana, citrus, and coffee in the middle course, and fisheries, humid-soil agriculture, induced pastures, and human settlements in the lowlands. The region is also used for tourism activities such as rafting. The largest town, Martínez de la Torre (>250,000 inhabitants), is located in the lowlands, a region that also includes less densely populated towns (<250,000 inhabitants) such as Altotonga, Jalacingo, and Tlapacoyan [39].

2.2. Field Work

This study involved 12 study sites located along the Bobos and Nautla rivers. In the upper course, the sites selected were Pimiento (PI) and Huapala (HU). Along the Alseseca river tributary, the sites selected were Jalacingo (JL), Tomata (TM), and Encanto (EN), located close to Tlapacoyan and within the natural protected area. Last, the sites Tezcapa (TZ), Manantial (MA), Puente Filo (FI), Palmillas (PA), Rojo Gómez (RG), Martínez de la Torre (MZ), and Paso Largo (PL) are located along the mainstream of Bobos-Nautla rivers, with RG, MZ, and PL being close to the largest town in the region (Martinez de la Torre). The study involved six monitoring events that encompassed the dry, wet, and cold seasons, the latter influenced by northerly winds (cold fronts): August (rainy) and December (cold) 2013, February (cold), June, and September (rainy) 2014, and September (rainy) 2015. In addition, the altitudinal profile of each stream in the basin was delineated, locating study sites according to altitude and distance traveled, in kilometers, from the highest to the lowest study site; a topographic map was included.
The following variables were recorded at each site and study season: dissolved oxygen (mg/L), water temperature (°C), conductivity (μs/cm), turbidity (NTU), and pH (using a Quanta® probe, Hydrolab, Austin, TX, USA). In addition, water samples (100 mL and 500 mL) were collected from each site for microbiological and chemical testing in the laboratory.

2.3. Water Quality

Water samples were tested for nitrates (mg/L), nitrites (mg/L), ammonia nitrogen (mg/L), total nitrogen (mg/L), orthophosphates (mg/L), total phosphorus (mg/L), color (Pt–Co U), and hardness, using the spectrophotometric techniques of the Hach® DR 3900 instrument (Hach, Loveland, CO, USA); on the other hand, chlorides (mg/L), BOD5 (mg/L), alkalinity (mg/L CaCO3), and total and fecal coliforms (MPN/100 mL) were determined using American Public Health Association (APHA) techniques [40]. The water quality index (WQI) was calculated from the multiplicative weighted index proposed by Dinius [41], ranging from 0 to 100, where zero corresponds to extremely poor water quality and 100 to excellent water quality, considering five different potential uses of water (public water supply, fish and shellfish, agricultural, industrial, and recreational uses). The WQI considers the percentage of oxygen saturation (%DO), BOD5, NO3 concentration, water hardness, conductivity, color, total and fecal coliforms, alkalinity, chlorides, pH, and atmospheric and water temperature, using the following equation:
WQI = i = 1 n I i w i
where WQI = Water Quality Index (0 to 100); Ii = subindex of the ith parameter (0 to 100); Wi = weighting value of the parameter (0 to 1); n = number of parameters.

2.4. Land Uses

For the characterization of study sites based on land uses, an interactive map was developed based on the geographic layers of land use at 1:250,000 scale provided by INEGI (National Institute of Statistical and Geography), using the QGIS software (Las Palmas version) (Open Source Geospatial Foundation, Chicago, IL, USA). For each study site, “buffers” (i.e., zones influenced by land use) were set measuring 2 km in length upstream of the monitoring site by 500 m at both sides (2 km × 500 m). Additionally, land use was assessed watershed upstream from each study site. In this case, we calculated the percentage of each land use by means of the Simulador de Flujos de Agua de Cuencas Hidrográficas (SIATL) (3.2) [42]; these were subsequently grouped into major land-use categories.

2.5. Statistical Analysis

A dissimilarity analysis was conducted between study sites through Euclidean distances, with the dendrogram drawn according to the Ward’s hierarchical clustering method using averages of physicochemical parameters for each study site to identify sections along the river and to define clusters for comparison.
Homoscedasticity testing was performed with cluster data; afterwards, analysis of variance (ANOVA) (α = 0.95) and multiple comparison tests between clusters were performed using the Student–Newman–Keuls method.
The physicochemical characterization of study sites and their relationship with land uses were performed through a principal component analysis with three dimensions (PCA-3D) using the Spearman’s correlation coefficient. To this end, a matrix was built with study sites as rows and environmental parameters and land uses as columns. This analysis considered averages of physicochemical parameters for sampling seasons and percentage of each land use. The data set was standardized using the formula X = log (x + 1); for percentages, the formula was 2π × arcsin √p, where p is the relative value of each individual land use. All statistical analyses were run using the software XLStat-2015 (Addinsoft, Paris, France).

3. Results

3.1. Clustering of Study Sites According to Their Physicochemical Properties

The dendrogram of the dissimilarity analysis of study sites (Figure 2) revealed three clusters. The first (C1) grouped together sites PI, HU, MA, TZ, and FI and was defined as the upper course. C2 clustered sites RG and PA (the middle course of the Bobos River) and sites JL, TM, and EN (from the Alseseca River tributary); finally, a third cluster (C3) included sites PL and MTZ (the lower course).

3.2. Longitudinal Profile of the River

The longitudinal profile of the river, including topographic relief and slope of each river section, as defined by the dissimilarity analysis, led to the identification of a marked change in gradient (Figure 3A,B); as expected, C1 showed the steepest slope (4.76%), C2 attained an intermediate slope (3.18%), and C3 had the lowest slope (0.44%).

3.3. WQI

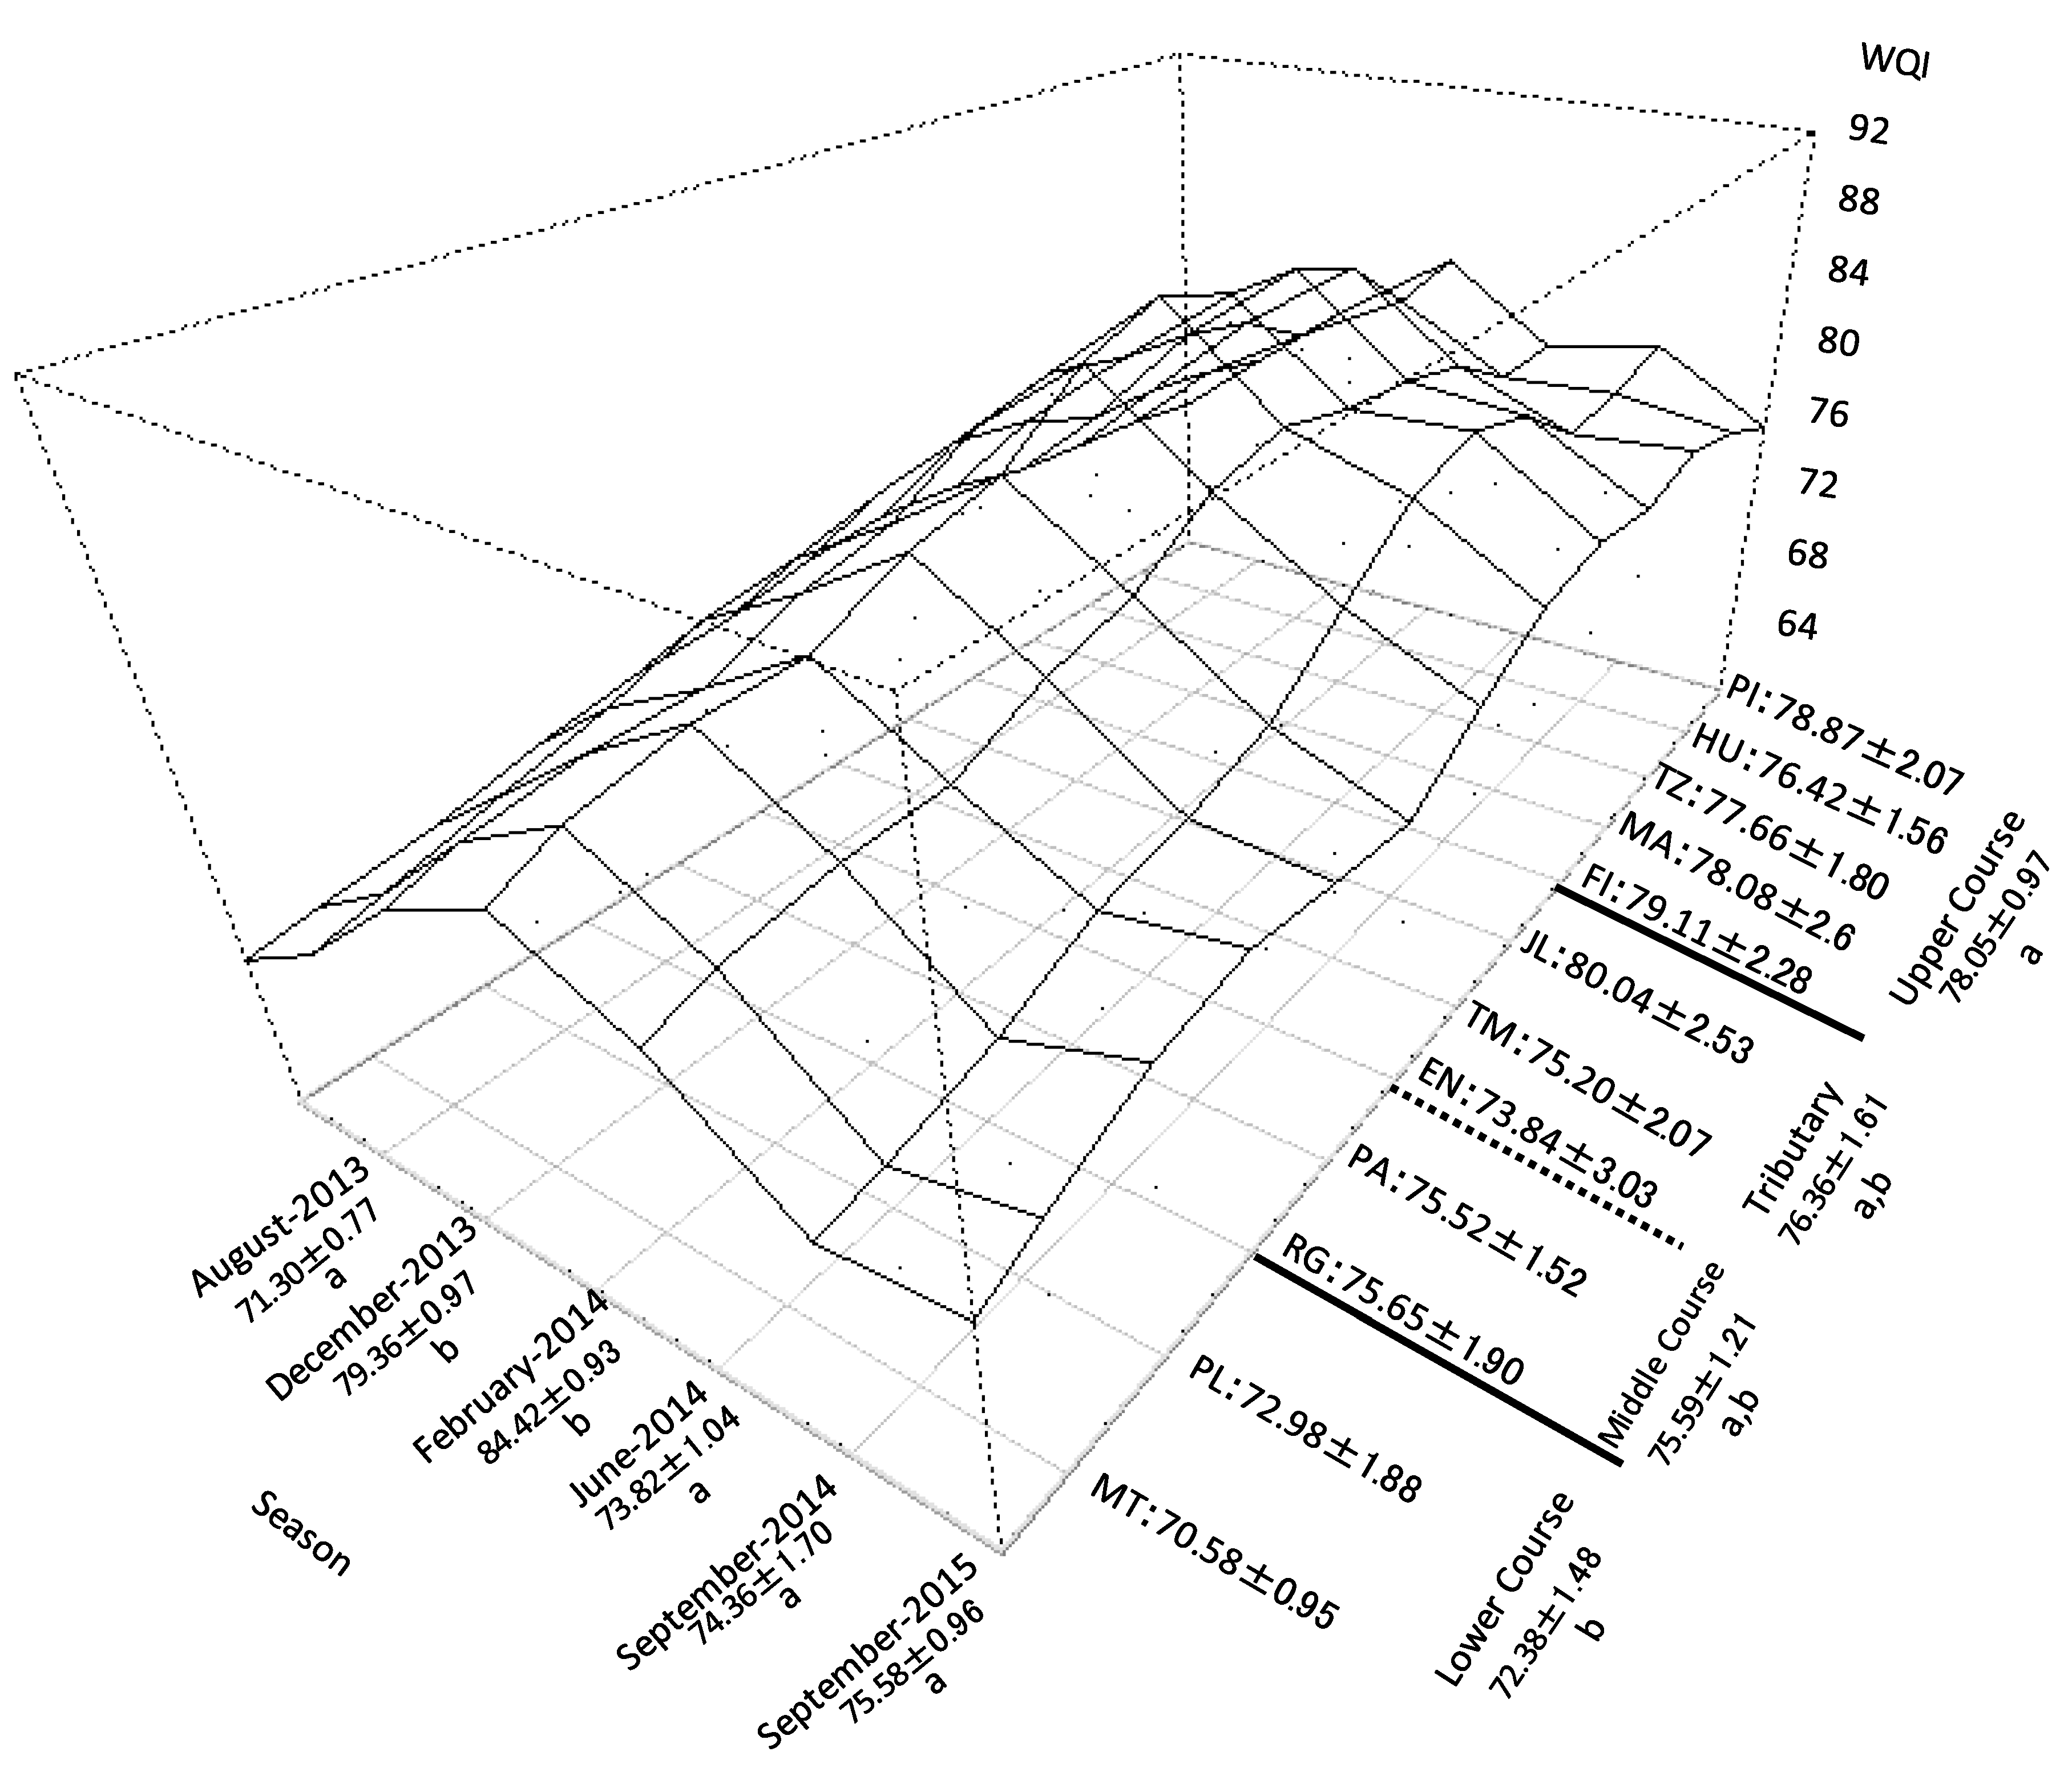
Mean WQI values for each site ranged from 70.58 ± 0.95 in Martinez de la Torre (MZ) to 80.04 ± 2.53 for Jalacingo (JL) (Figure 4). However, differences between study sites were not statistically significant (p > 0.05).
The mean WQI attained the highest value in the upper course (78.05 ± 0.97), which was significantly different from the lower course (72.38 ± 1.48; p < 0.05). Furthermore, in accordance with the water quality categories of [41], WQI values for the upper course can be classified as follows: “Acceptable for all water sports; “Acceptable for fish and shellfish”; “Minor purification for crops requiring high-quality water”; “Treatment needed for public water supply.” By contrast, WQI values in the lower course correspond to the following categories: “Becoming polluted to practice any water sports”; “Marginal quality for sensitive fish and shellfish”; “No treatment needed for most crops and industries”, “Treatment required for public water supply.”
On the other hand, averages by season (Figure 4) yielded the lowest values in the rainy seasons of August 2013 and June 2014 (71.30 ± 0.77 and 73.82 ± 1.04, respectively), which were significantly different (p < 0.05) versus December 2013 and February 2014, when the highest values were recorded (79.36 ± 0.97 and 84.42 ± 0.93, respectively). According to WQI values, the seasonal patterns show differences only in the case of public water supply, which fell into the category “Minor purification required” in the dry season, but into the category of “Necessary Treatment for Public Water Supply” in the rainy season. The global WQI for the whole study area ranges from mildly polluted for human use to excellent quality for industrial, recreational, and fishing uses.

3.4. Land Uses

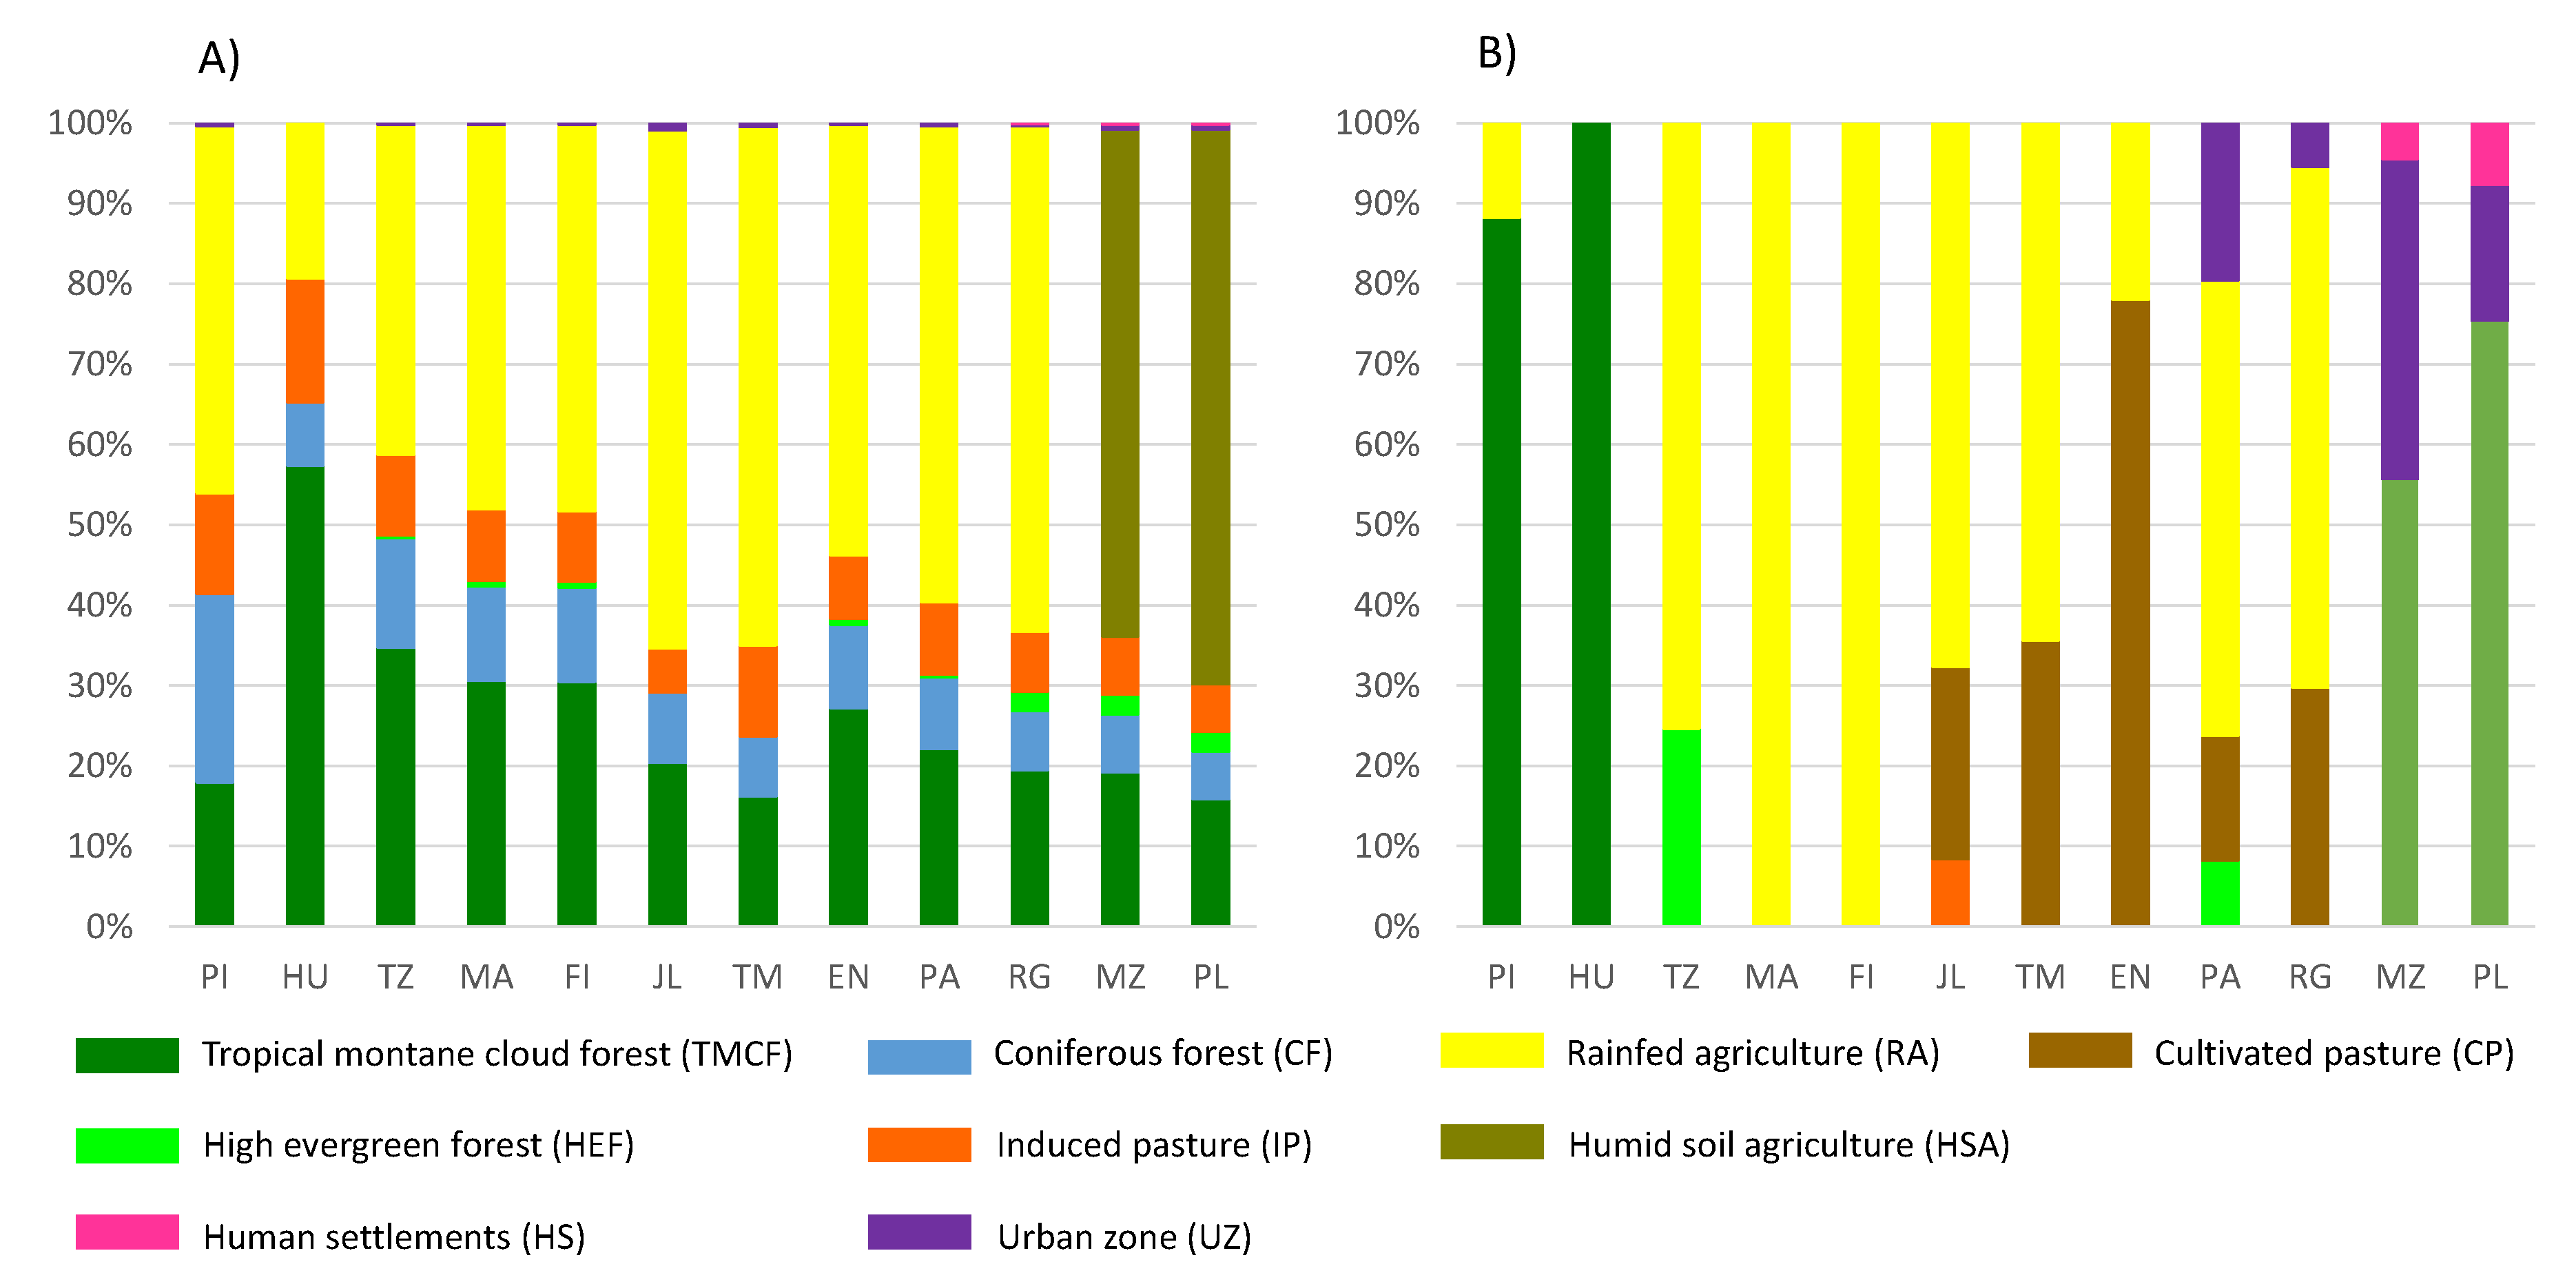
Nine different land uses were identified in the assessment of land use watershed upstream from each study site (tropical mountain cloud forest, TMCF; coniferous forest, CF; high evergreen forest, HEF; humid soil agriculture, HSA; rainfed agriculture, RA; induced pasture, IP; cultivated pasture, CP; human settlements, HS; urban zones, UZ) (Figure 5). Land-use percentages obtained from this assessment (Figure 5A) show that the tree types of forests (TMCF, CF, and HEF) are represented in all study sites, ranging from 24 to 38% in C3 and C2, and from 41 to 65% in CI. Agriculture uses (RA, IP, CP, and HSA) ranged from 62 to 76% in C3 (particularly HSA) and from 35 to 58% in both C2 and C1. In all clusters, HS and UZ showed values below 1%. On the other hand, the assessment of land use including the buffer zone (2 km × 500 m) (Figure 5B and Figure 6) showed two types of forest (TMCF and HEF); in C1, the percentages ranged from 23 to 100%, although forests were not represented in three study sites of this cluster (TZ, MA, and FI); HEF was observed in only one C2 site (PA: 8%) but was completely absent in C3. HS and UZ ranged from 25 to 42% in C3; in C2, UZ varied from 5 to 20% only in study sites PA and RG; C1 shows no influence of this land use.

3.5. Multivariate Analysis

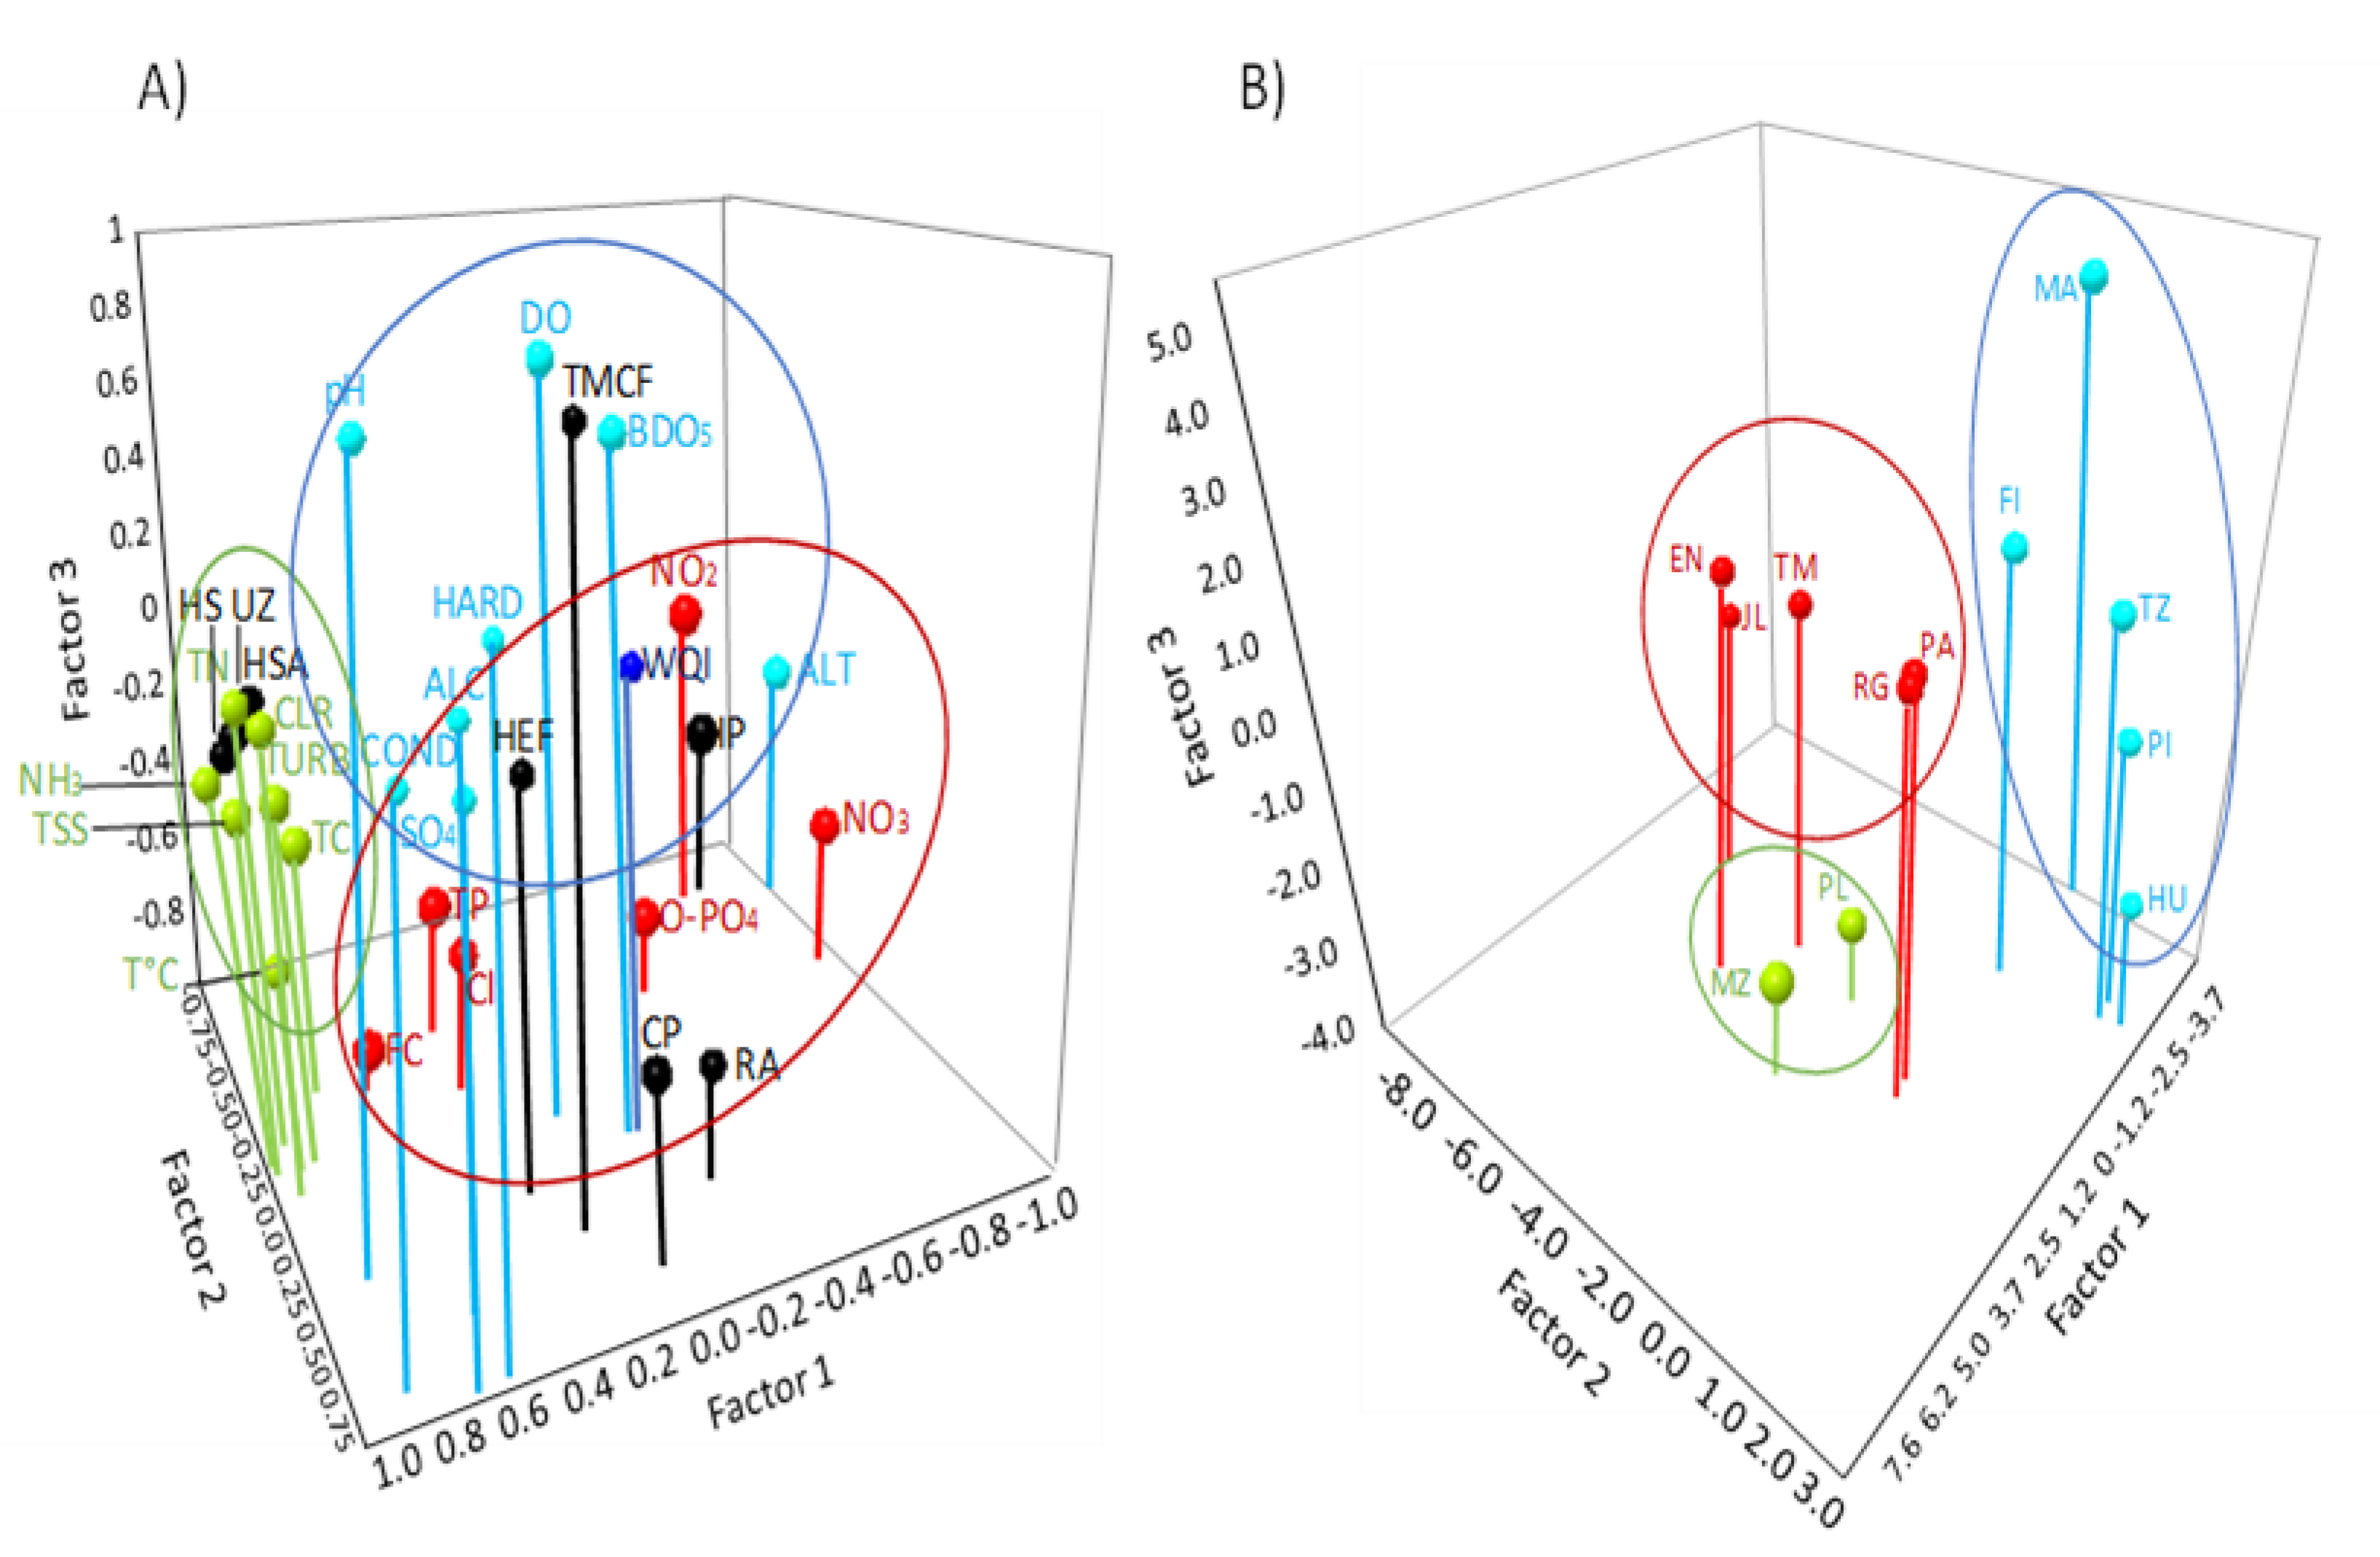
The principal component analysis (PCA-3D) accounted for 69.51% of the cumulative variance of the data set in the first three axes (F1: 35.56%, F2: 20.91%, and F3: 13.03%); factor loadings are shown in Table 1. The first component (F1) showed the importance of the altitudinal gradient and the variables associated with changes along the river course: altitude and WQI are inversely proportional to turbidity, temperature, nitrogen (NH3 and TN), coliforms (total and fecal), total suspended solids, alkalinity, chloride, color, and land uses HS and UZ; F2 is related to nutrient enrichment (NO3 and O–PO4) and mineralization (conductivity, SO4, and hardness; land uses related to F2 were cultivated and induced pastures, all of which were directly proportional to F2); finally, F3 is related to DO, BOD, and rainfed agriculture, which are directly proportional to F3 (Table 1). The 3-D plot (Figure 7) shows clusters of study sites: Cluster I comprises sites PI, HU, TZ, MA, and FI, characterized by the highest conductivity, alkalinity, hardness, dissolved oxygen, and sulfates. These sites also reached the highest WQI values of the six periods studied; in addition, these showed the highest percentages of natural vegetation (tropical mountain cloud forest and high evergreen forest), as well as rainfed agriculture from TZ to FL, along with clearing of natural vegetation. Cluster II includes sites located along the Alseseca river tributary (JL, TM, and EN) and sites in the middle course (RG and PA), characterized by the highest levels of nitrates, nitrites, orthophosphates, total phosphorus, chlorides, BOD5, and fecal coliforms. These sites were closely related to rainfed agriculture, as well as to induced and cultivated pastures. Finally, Cluster III includes sites located in the lower course (MZ and PL), associated with the highest percentage of human settlements and urban zones, humid soil agriculture, and the highest values of total nitrogen, ammonia nitrogen, pH, total coliforms, turbidity, suspended solids, and color (Table 2).

4. Discussion

The water quality index proposed by Dinius [41] has been used by several authors to indicate the effect of anthropogenic impacts and used as an easy-to-interpret tool for assessing water quality [43]. The results obtained in this work demonstrate a marked temporal variation, with the dry cold season (February 2014) showing the highest water quality; however, as regards spatial variation, this index is insensitive to variations between sites, seemingly unsuitable for identifying sections with different characteristics along the river. Some authors [44] stress that this analysis should be conducted in parallel with an assessment of the changes of land use, since study sites with different land uses yielded very similar scores. The above derives from the fact that the WQI does not include water-quality parameters that are affected by changes of land use, such as nutrients (orthophosphates, ammonia, nitrites, and nitrates) [44,45,46]. However, the combined analysis of the 23 physicochemical variables and all land uses considered in this study and using multivariate methods (CA and PCA) allowed for the identification of the relationship between changes of land use and physicochemical water quality, and revealed spatial variation patterns.
The CA identified three regions along the course of the river, which share local issues requiring particular attention or management. For instance, C1 (upper course) shows effects of the changes of land use (HP, CP, and RA) according to the PCA, although it showed the highest coverage of TMCF vegetation. These changes of land use were most evident in sites TZ, MA, and FL, characterized by nutrient enrichment. C1 sites, despite their location in the best preserved area, should be closely monitored and deforestation should be regulated. Furthermore, the steep slope along the river course in this zone promotes self-purification. Nilsson et al. [47] indicate that the upper course of any stream is key for the conservation of water quality in the rest of the basin, as it plays a key role in maintaining the buffering system and diluting pollutants downstream.
For its part, the PCA evidenced that C2 is closely related to agricultural practices (RA, CP, and IP account for the higher nutrient levels in sites TM, JL, RG, and PA), contributing to high nitrogen (NO2 and NO3) and phosphorus (O–PO4) inputs. This has been highlighted by various authors [47,48,49,50], who point out that increased nutrient levels in water bodies are directly related to the use of agrochemicals, with higher concentrations during the rainy season as a result of leaching and runoff. This fact evidences the need to implement best management practices to prevent excess nutrient discharges into the river.
Last, C3 (MTZ and PL) was associated with human settlements (UZ, HS, and HSA) and showed wastewater indicators (fecal and total coliforms, ammonium, total N, and chlorides). Due to the low gradient in this section of the river, its self-cleaning capacity decreases sharply, as reported by [51] for the lower course of the Potrero de los Funes river, Argentina. The zone of the river associated with C3 requires the establishment of wastewater treatment facilities before discharge into the river. In all cases, the studies relating land-use changes at different spatio-temporal scales show that forest clearing or replacement of natural vegetation coverage within a basin leads to the deterioration of water quality [48,49,52].
The combination of two multivariate tools was useful in this study. The cluster analysis produced groups based on similarities and differences; for its part, the PCA allowed identifying the variables, producing a new set of variables (principal components) that are consistent with the clusters derived from CA. In this study, the PCA confirmed its validity as a method for monitoring changes in water systems and the key drivers associated with them.
In contrast with the assessment of the effect of land use in the watershed upstream from each study site, the interpretation of the effects of land use on water quality from the analysis of buffer zones involves scale and interpretation implications according to the research hypothesis established a priori. It has been pointed out [53,54] that the significant effects on water quality result from changes of land use in the areas closest to the study sites, since it is in these areas that the watershed is being washed off of materials, which enter river water and cause immediate effects. Our findings reveal that, when the influence of land uses is explored according to the watershed upstream from each study site, C2 and C3 include percentages of forests (TMCF, HEF, and CF) with an altitudinal range lacking an evident relationship with the river course; thus, these may not directly affect water quality. For their part, AH and ZU display a minor relative influence, since both represent a small and constant percentage across all study sites (<1%), particularly in C3, which is the area where human settlements are located in the proximity of the river; consequently, wastewater indicators are evident. On the other hand, our results show that changes at a local scale (buffer land uses) significantly affect water quality, as stressed by [7]. In this respect, our results show that study sites located in the upper course (PI and HU), with extensive coverage of natural vegetation (92% and 100%, respectively), show good water quality, as nutrient concentrations were low, while C2 and C3 showed the highest impact by agricultural practices and human settlements.
Gove et al. [55] found a greater influence of upstream vs. lateral inputs as the length of the catchment area increases. The fact that these increases reach a point of diminishing returns indicates that processing within the river eventually dampens the memory of upstream events relative to more recent longitudinal and lateral inputs. Therefore, if the total cumulative upstream land use governs water quality at any point in the basin, water quality measurements would exhibit little variations downstream. In this study, when watershed upstream from each study site are considered, land uses that are distant from the river course become evident, offsetting the effect of land uses adjacent to the river. On the other hand, the use of a 2 km × 500 m buffer zone use reveals a shift of land uses with an immediate effect on the water body. The cluster analysis showed three different groups based on similar water quality characteristics, which are consistent with Figure 5B. In this sense, and considering the objectives of this study, the use of information derived from small-scale buffers seems more appropriate, since these actually provide information on the effects of land uses adjacent to the river course.
The analysis of results discussed in this work proposes a baseline assessment methodology for intertropical latitudes, as environmental monitoring data are scarce in many Latin American countries [25], and Mexico has poor records of historical changes of either land use or water quality.
Based on the above, developing countries in tropical zones should start to identify the direct effects of different land uses using approaches similar to the one described herein, in order to investigate cause–effect responses. According to [55], the incorporation of the effect of the watershed upstream of each study site could be masking/neutralizing the effects of land uses adjacent to the river course. Working with small-scale buffers (e.g., 2 km × 500 m) and building a monitoring network produce baseline data on the effects of land uses in different basins, and produce useful parameters for incorporation into various modeling tools such as SWAT. In turn, this facilitates building models on potential changes of land use and the expected hydrological changes, which should be taken into account by policy makers focused on sustainable water resource management and climate change, as suggested in [56]. In turn, these tools predict the effects of changes of land uses; examples include [3], wherein future changes in water quality within a watershed dominated by agriculture are anticipated, [57], wherein various hydrological land-use scenarios in the upper portion of the Mississippi river are modeled to 2091 and the impact of land uses on hydrologic processes is determined, and [1], wherein different scenarios of the effects of climate change on water quality are assessed. In this sense, our results can be used as a small-scale quantitative component for use in future predictions about changes of land use and land cover, as defined in [58], and in the development of management plans and public policies for conservation.

5. Conclusions

The loss of tropical cloud forest is mainly due to the change of land cover to anthropogenic land uses. Our results revealed that streams located in this basin are highly vulnerable to changes of land use. These changes alter the proper functioning of the tropical cloud forest and the ecosystem services, including water quality. Hence, conservation measures targeting cloud forests and high evergreen forests, along with reforestation programs in the rest of the basin, should be implemented; wastewater treatment plants should also be established in the lower course of the river—the section most affected by direct pollution issues and where the river self-purification capacity is not as efficient as in the upper course. Our results evidence that the natural protected area in the river urgently requires the implementation of reforestation programs to improve the condition of the local ecosystems (streams and forest).

Author Contributions

E.L.-L. and J.E.S.-D. participated in the conceptualization and design stages, performed the methodology, and obtained funding resources; A.J.R.-R. and E.M.-M. carried out data collection and analysis; A.E.R.-S. and A.G.-R. also participated in the investigation. All authors contributed to the manuscript.

Funding

This research was funded by CONACyT (National Council for Science and Technology), grant number [PY-FOINS-CONACyT-1931], and by the SIP Secretariat for Research and Postgraduate Studies at Instituto Politécnico Nacional, grant number (SIP 20170908).

Acknowledgments

María Elena Sánchez-Salazar translated the manuscript into English and contributed to the edition of the final manuscript.

Conflicts of Interest

The authors declare no conflict of interest. The sponsors had no role in study design, data collection, analyses, or interpretation; drafting the manuscript, or the decision to publish the results.

References

  1. Fan, M.; Shibata, H. Simulation of watershed hydrology and stream water quality under land use and climate change scenarios in Teshio River watershed, Northern Japan. Ecol. Indic. 2015, 50, 79–89. [Google Scholar] [CrossRef]
  2. Ding, J.; Jiang, Y.; Fu, L.; Liu, Q.; Peng, Q.; Kang, M. Impacts of land use on surface water quality in a subtropical River Basin: A case study of the Dongjiang River Basin, Southeastern China. Water 2015, 7, 4427–4445. [Google Scholar] [CrossRef]
  3. Rajib, M.A.; Ahiablame, L.; Paul, M. Modeling the effects of future land use change on water quality under multiple scenarios: A case study of low-input agriculture with hay/pasture production. Sustain. Water Qual. Ecol. 2016, 8, 50–66. [Google Scholar] [CrossRef]
  4. Kazi, T.G.; Arain, M.B.; Jamali, M.K.; Jalbani, N.; Afridi, H.I.; Sarfraz, R.A.; Baig, J.A.; Shah, A.Q. Assessment of water quality of polluted lake using multivariate statistical techniques: A case study. Ecotoxicol. Environ. Saf. 2009, 72, 301–309. [Google Scholar] [CrossRef] [PubMed]
  5. Peters, N.E.; Meybeck, M. Water quality degradation effects on freshwater availability: Impacts of human activities. Water Int. 2000, 25, 185–193. [Google Scholar] [CrossRef]
  6. Tong, S.T.Y.; Chen, W. Modeling the relationship between land use and surface water quality. J. Environ. Manag. 2002, 66, 377–393. [Google Scholar] [CrossRef]
  7. Xiao, R.; Wang, G.; Zhang, Q.; Zhang, Z. Multi-scale analysis of relationship between landscape pattern and urban river water quality in different seasons. Sci. Rep. 2016, 6, 25250. [Google Scholar] [CrossRef] [PubMed] [Green Version]
  8. Bennett, E.M.; Carpenter, S.R.; Caraco, N.F. Human impact on erodable phosphorus and eutrophication: A global perspective: Increasing accumulation of phosphorus in soil threatens rivers, lakes, and coastal oceans with eutrophication. AIBS Bull. 2001, 51, 227–234. [Google Scholar]
  9. Foley, J.A.; DeFries, R.; Asner, G.P.; Barford, C.; Bonan, G.; Carpenter, S.R.; Chapin, F.S.; Coe, M.T.; Daily, G.C.; Gibbs, H.K.; et al. Global consequences of land use. Science 2005, 309, 570–574. [Google Scholar] [CrossRef] [PubMed]
  10. Assessment, M.E. Ecosystem and Human Well-Being: Biodiversity Synthesis; World Resources Institute: Washington, DC, USA, 2005. [Google Scholar]
  11. Hansen, M.C.; Potapov, P.V.; Moore, R.; Hancher, M.; Turubanova, S.A.A.; Tyukavina, A.; Thau, D.; Stehman, S.V.; Goetz, S.J.; Loveland, T.R.; et al. High-resolution global maps of 21st-century forest cover change. Science 2013, 342, 850–853. [Google Scholar] [CrossRef] [PubMed]
  12. Keenan, R.J.; Reams, G.A.; Achard, F.; de Freitas, J.V.; Grainger, A.; Lindquist, E. Dynamics of global forest area: Results from the FAO Global Forest Resources Assessment 2015. For. Ecol. Manag. 2015, 352, 9–20. [Google Scholar] [CrossRef]
  13. Secretariat of Environment and Natural Resources (SEMARNAT). El Medio Ambiente en México 2013–2014; SEMARNAT: Mexico City, Mexico, 2014.
  14. Martínez, M.L.; Pérez-Maqueo, O.; Vázquez, G.; Castillo-Campos, G.; García-Franco, J.; Mehltreter, K.; Equihua, M.; Landgrave, R. Effects of land use change on biodiversity and ecosystem services in tropical montane cloud forests of Mexico. For. Ecol. Manag. 2009, 258, 1856–1863. [Google Scholar] [CrossRef]
  15. Thorne, R.S.J.; Williams, W.P. The response of benthic macroinvertebrate to pollution in developing countries: A multimetric system of bioassessment. Freshw. Biol. 1997, 37, 671–686. [Google Scholar] [CrossRef]
  16. Toledo-Aceves, T.; García-Franco, J.G.; Williams-Linera, G.; MacMillan, K.; Gallardo-Hernández, C. Significance of remnant cloud forest fragments as reservoirs of tree and epiphytic bromeliad diversity. Trop. Conserv. Sci. 2014, 7, 230–243. [Google Scholar] [CrossRef]
  17. Ponce-Reyes, R.; Reynoso-Rosales, V.-H.; Watson, J.E.M.; VanDerWal, J.; Fuller, R.A.; Pressey, R.L.; Possingham, H.P. Vulnerability of cloud forest reserves in Mexico to climate change. Nat. Clim. Chang. 2012, 2, 448–452. [Google Scholar] [CrossRef]
  18. Foster, P. The potential negative impacts of global climate change on tropical montane cloud forests. Earth-Sci. Rev. 2001, 55, 73–106. [Google Scholar] [CrossRef]
  19. Martınez-Morales, M.A. Landscape patterns influencing bird assemblages in a fragmented neotropical cloud forest. Biol. Conserv. 2005, 121, 117–126. [Google Scholar] [CrossRef]
  20. Ponce-Reyes, R.; Nicholson, E.; Baxter, P.W.J.; Fuller, R.A.; Possingham, H. Extinction risk in cloud forest fragments under climate change and habitat loss. Divers. Distrib. 2013, 19, 518–529. [Google Scholar] [CrossRef]
  21. Muñoz-Villers, L.E.; McDonnell, J.J. Land use change effects on runoff generation in a humid tropical montane cloud forest region. Hydrol. Earth Syst. Sci. 2013, 17, 3543–3560. [Google Scholar] [CrossRef] [Green Version]
  22. McDowell, W.H.; Asbury, C.E. Export of carbon, nitrogen, and major ions from three tropical montane watersheds. Limnol. Oceanogr. 1994, 39, 111–125. [Google Scholar] [CrossRef] [Green Version]
  23. Turner, W.R.; Brandon, K.; Brooks, T.M.; Costanza, R.; da Fonseca, G.A.B.; Portela, R. Global Conservation of Biodiversity and Ecosystem Services. BioScience 2007, 57, 868–873. [Google Scholar] [CrossRef] [Green Version]
  24. Quétier, F.; Lavorel, S.; Thuiller, W.; Davies, I. Plant-trait-based modeling assessment of ecosystem-service sensitivity to land-use change. Ecol. Appl. 2007, 17, 2377–2386. [Google Scholar] [CrossRef] [PubMed]
  25. Martínez, M.L.; Manson, R.H.; Balvanera, P.; Dirzo, R.; Soberón, J.; García-Barrios, L.; Martínez-Ramos, M.; Moreno-Casasola, P.; Rosenzweig, L.; Sarukhán, J. The evolution of ecology in Mexico: Facing challenges and preparing for the future. Front. Ecol. Environ. 2006, 4, 259–267. [Google Scholar] [CrossRef]
  26. Tu, J. Spatial and temporal relationships between water quality and land use in northern Georgia, USA. J. Integr. Environ. Sci. 2011, 8, 151–170. [Google Scholar] [CrossRef] [Green Version]
  27. Hutchinson, K.J.; Christiansen, D.E. Use of the Soil and Water Assessment Tool (SWAT) for Simulating Hydrology and Water Quality in the Cedar River Basin, Iowa, 2000–10; Scientific Investigations Report 2013–5002; U.S. Geological Survey (USGS): Reston, VA, USA, 2013.
  28. Schönhart, M.; Trautvetter, H.; Parajka, J.; Blaschke, A.P.; Hepp, G.; Kirchner, M.; Mitter, H.; Schmid, E.; Strenn, B.; Zessner, M. Modelled impacts of policies and climate change on land use and water quality in Austria. Land Use Policy 2018, 76, 500–514. [Google Scholar] [CrossRef]
  29. Kang, J.-H.; Lee, S.W.; Cho, K.H.; Ki, S.J.; Cha, S.M.; Kim, J.H. Linking land-use type and stream water quality using spatial data of fecal indicator bacteria and heavy metals in the Yeongsan river basin. Water Res. 2010, 44, 4143–4157. [Google Scholar] [CrossRef] [PubMed]
  30. Bengraïne, K.; Marhaba, T.F. Using principal component analysis to monitor spatial and temporal changes in water quality. J. Hazard. Mater. 2003, 100, 179–195. [Google Scholar] [CrossRef]
  31. Reghunath, R.; Murthy, T.R.S.; Raghavan, B.R. The utility of multivariate statistical techniques in hydrogeochemical studies: An example from Karnataka, India. Water Res. 2002, 36, 2437–2442. [Google Scholar] [CrossRef]
  32. Simeonov, V.; Stratis, J.A.; Samara, C.; Zachariadis, G.; Voutsa, D.; Anthemidis, A.; Sofoniou, M.; Kouimtzis, T. Assessment of the surface water quality in Northern Greece. Water Res. 2003, 37, 4119–4124. [Google Scholar] [CrossRef]
  33. Brodnjak-Vončina, D.; Dobčnik, D.; Novič, M.; Zupan, J. Chemometrics characterisation of the quality of river water. Anal. Chim. Acta 2002, 462, 87–100. [Google Scholar] [CrossRef]
  34. Singh, K.P.; Malik, A.; Sinha, S. Water quality assessment and apportionment of pollution sources of Gomti river (India) using multivariate statistical techniques—A case study. Anal. Chim. Acta 2005, 538, 355–374. [Google Scholar] [CrossRef]
  35. Danielsson, Å.; Cato, I.; Carman, R.; Rahm, L. Spatial clustering of metals in the sediments of the Skagerrak/Kattegat. Appl. Geochem. 1999, 14, 689–706. [Google Scholar] [CrossRef]
  36. Zhou, F.; Liu, Y.; Guo, H. Application of multivariate statistical methods to water quality assessment of the watercourses in Northwestern New Territories, Hong Kong. Environ. Monit. Assess. 2007, 132, 1–13. [Google Scholar] [CrossRef] [PubMed]
  37. Wenning, R.J.; Erickson, G.A. Interpretation and analysis of complex environmental data using chemometric methods. TrAC Trends Anal. Chem. 1994, 13, 446–457. [Google Scholar] [CrossRef]
  38. Arslan, O. A GIS-based spatial-Multivariate statistical analysis of water quality data in the Porsuk River, Turkey. Water Qual. Res. J. 2009, 44, 279–293. [Google Scholar] [CrossRef]
  39. Instituto Nacional de Estadística Geografía e Informática (INEGI). Carta Geológica-Minera Altotonga E14-B16, 1:50,000; INEGI: Aguascalientes, Mexico, 2010.
  40. American Public Health Association (APHA). Standard Methods for the Examination of Water and Wastewater, 21st ed.; APHA: Washington, DC, USA, 2005; p. 1220.
  41. Dinius, S.H. Design of an Index of Water Quality. J. Am. Water Resour. Assoc. 1987, 23, 833–843. [Google Scholar] [CrossRef]
  42. SIATL|Simulador de Flujos de Agua de Cuencas Hidrográficas. Available online: http://antares.inegi.org.mx/analisis/red_hidro/siatl/# (accessed on 16 October 2018).
  43. Boyd, C.E. Water Quality: An Introduction; Springer: Berlin, Germany, 2015; ISBN 9783319174464. [Google Scholar]
  44. Tromboni, F.; Dodds, W.K. Relationships between land use and stream nutrient concentrations in a highly urbanized tropical region of Brazil: Thresholds and riparian zones. Environ. Manag. 2017, 60, 30–40. [Google Scholar] [CrossRef] [PubMed]
  45. Carpenter, S.R.; Al, E. Nonpoint pollution of surface waters with phosphorus and nitrogen. Ecol. Appl. 1998, 8, 559–568. [Google Scholar] [CrossRef]
  46. Buck, O.; Niyogi, D.K.; Townsend, C.R. Scale-dependence of land use effects on water quality of streams in agricultural catchments. Environ. Pollut. 2004, 130, 287–299. [Google Scholar] [CrossRef] [PubMed]
  47. Nilsson, C.; Renöfält, B.M. Linking flow regime and water quality in rivers: A challenge to adaptive catchment management. Ecol. Soc. 2008, 13, 18. [Google Scholar] [CrossRef]
  48. Solaimani, K.; Arekhi, M.; Tamartash, R.; Miryaghobzadeh, M. Land use/cover change detection based on remote sensing data (A case study; Neka Basin). Agric. Biol. J. N. Am. 2010, 1, 1148–1157. [Google Scholar] [CrossRef]
  49. Permatasari, P.A.; Setiawan, Y.; Khairiah, R.N.; Effendi, H. The effect of land use change on water quality: A case study in Ciliwung Watershed. In IOP Conference Series: Earth and Environmental Science; IOP Publishing: Bristol, UK, 2017. [Google Scholar] [CrossRef]
  50. Rodríguez-Romero, A.J.; Rico-Sánchez, A.E.; Catalá, M.; Sedeño-Díaz, J.E.; López-López, E. Mitochondrial activity in fern spores of Cyathea costaricensis as an indicator of the impact of land use and water quality in rivers running through cloud forests. Chemosphere 2017, 189, 435–444. [Google Scholar] [CrossRef] [PubMed]
  51. González, S.O.; Almeida, C.A.; Calderón, M.; Mallea, M.A.; González, P. Assessment of the water self-purification capacity on a river affected by organic pollution: Application of chemometrics in spatial and temporal variations. Environ. Sci. Pollut. Res. 2014, 21, 10583–10593. [Google Scholar] [CrossRef] [PubMed]
  52. Costa, M.H.; Botta, A.; Cardille, J.A. Effects of large-scale changes in land cover on the discharge of the Tocantins River, Southeastern Amazonia. J. Hydrol. 2003, 283, 206–217. [Google Scholar] [CrossRef]
  53. Sliva, L.; Williams, D.D. Buffer zone versus whole catchment approaches to studying land use impact on river water quality. Water Res. 2001, 35, 3462–3472. [Google Scholar] [CrossRef]
  54. Li, S.; Gu, S.; Tan, X.; Zhang, Q. Water quality in the Upper Han River basin, China: The impacts of land use/land cover in riparian buffer zone. J. Hazard. Mater. 2009, 165, 317–324. [Google Scholar] [CrossRef] [PubMed]
  55. Gove, N.E.; Edwards, R.T.; Conquest, L.L. Effects of scale on land use and water quality relationships: A longitudinal basin-wide perspective. J. Am. Water Resour. Assoc. 2001, 37, 1721–1734. [Google Scholar] [CrossRef]
  56. Wu, Y.; Liu, S.; Sohl, T.L.; Young, C.J. Projecting the land cover change and its environmental impacts in the Cedar River Basin in the Midwestern United States. Environ. Res. Lett. 2013, 8, 024025. [Google Scholar] [CrossRef] [Green Version]
  57. Rajib, A.; Merwade, V. Hydrologic response to future land use change in the Upper Mississippi River Basin by the end of 21st century. Hydrol. Process. 2017, 31, 3645–3661. [Google Scholar] [CrossRef]
  58. Sleeter, B.M.; Sohl, T.L.; Bouchard, M.A.; Reker, R.R.; Soulard, C.E.; Acevedo, W.; Griffith, G.E.; Sleeter, R.R.; Auch, R.F.; Sayler, K.L.; et al. Scenarios of land use and land cover change in the conterminous United States: Utilizing the special report on emission scenarios at ecoregional scales. Glob. Environ. Chang. 2012, 22, 896–914. [Google Scholar] [CrossRef]
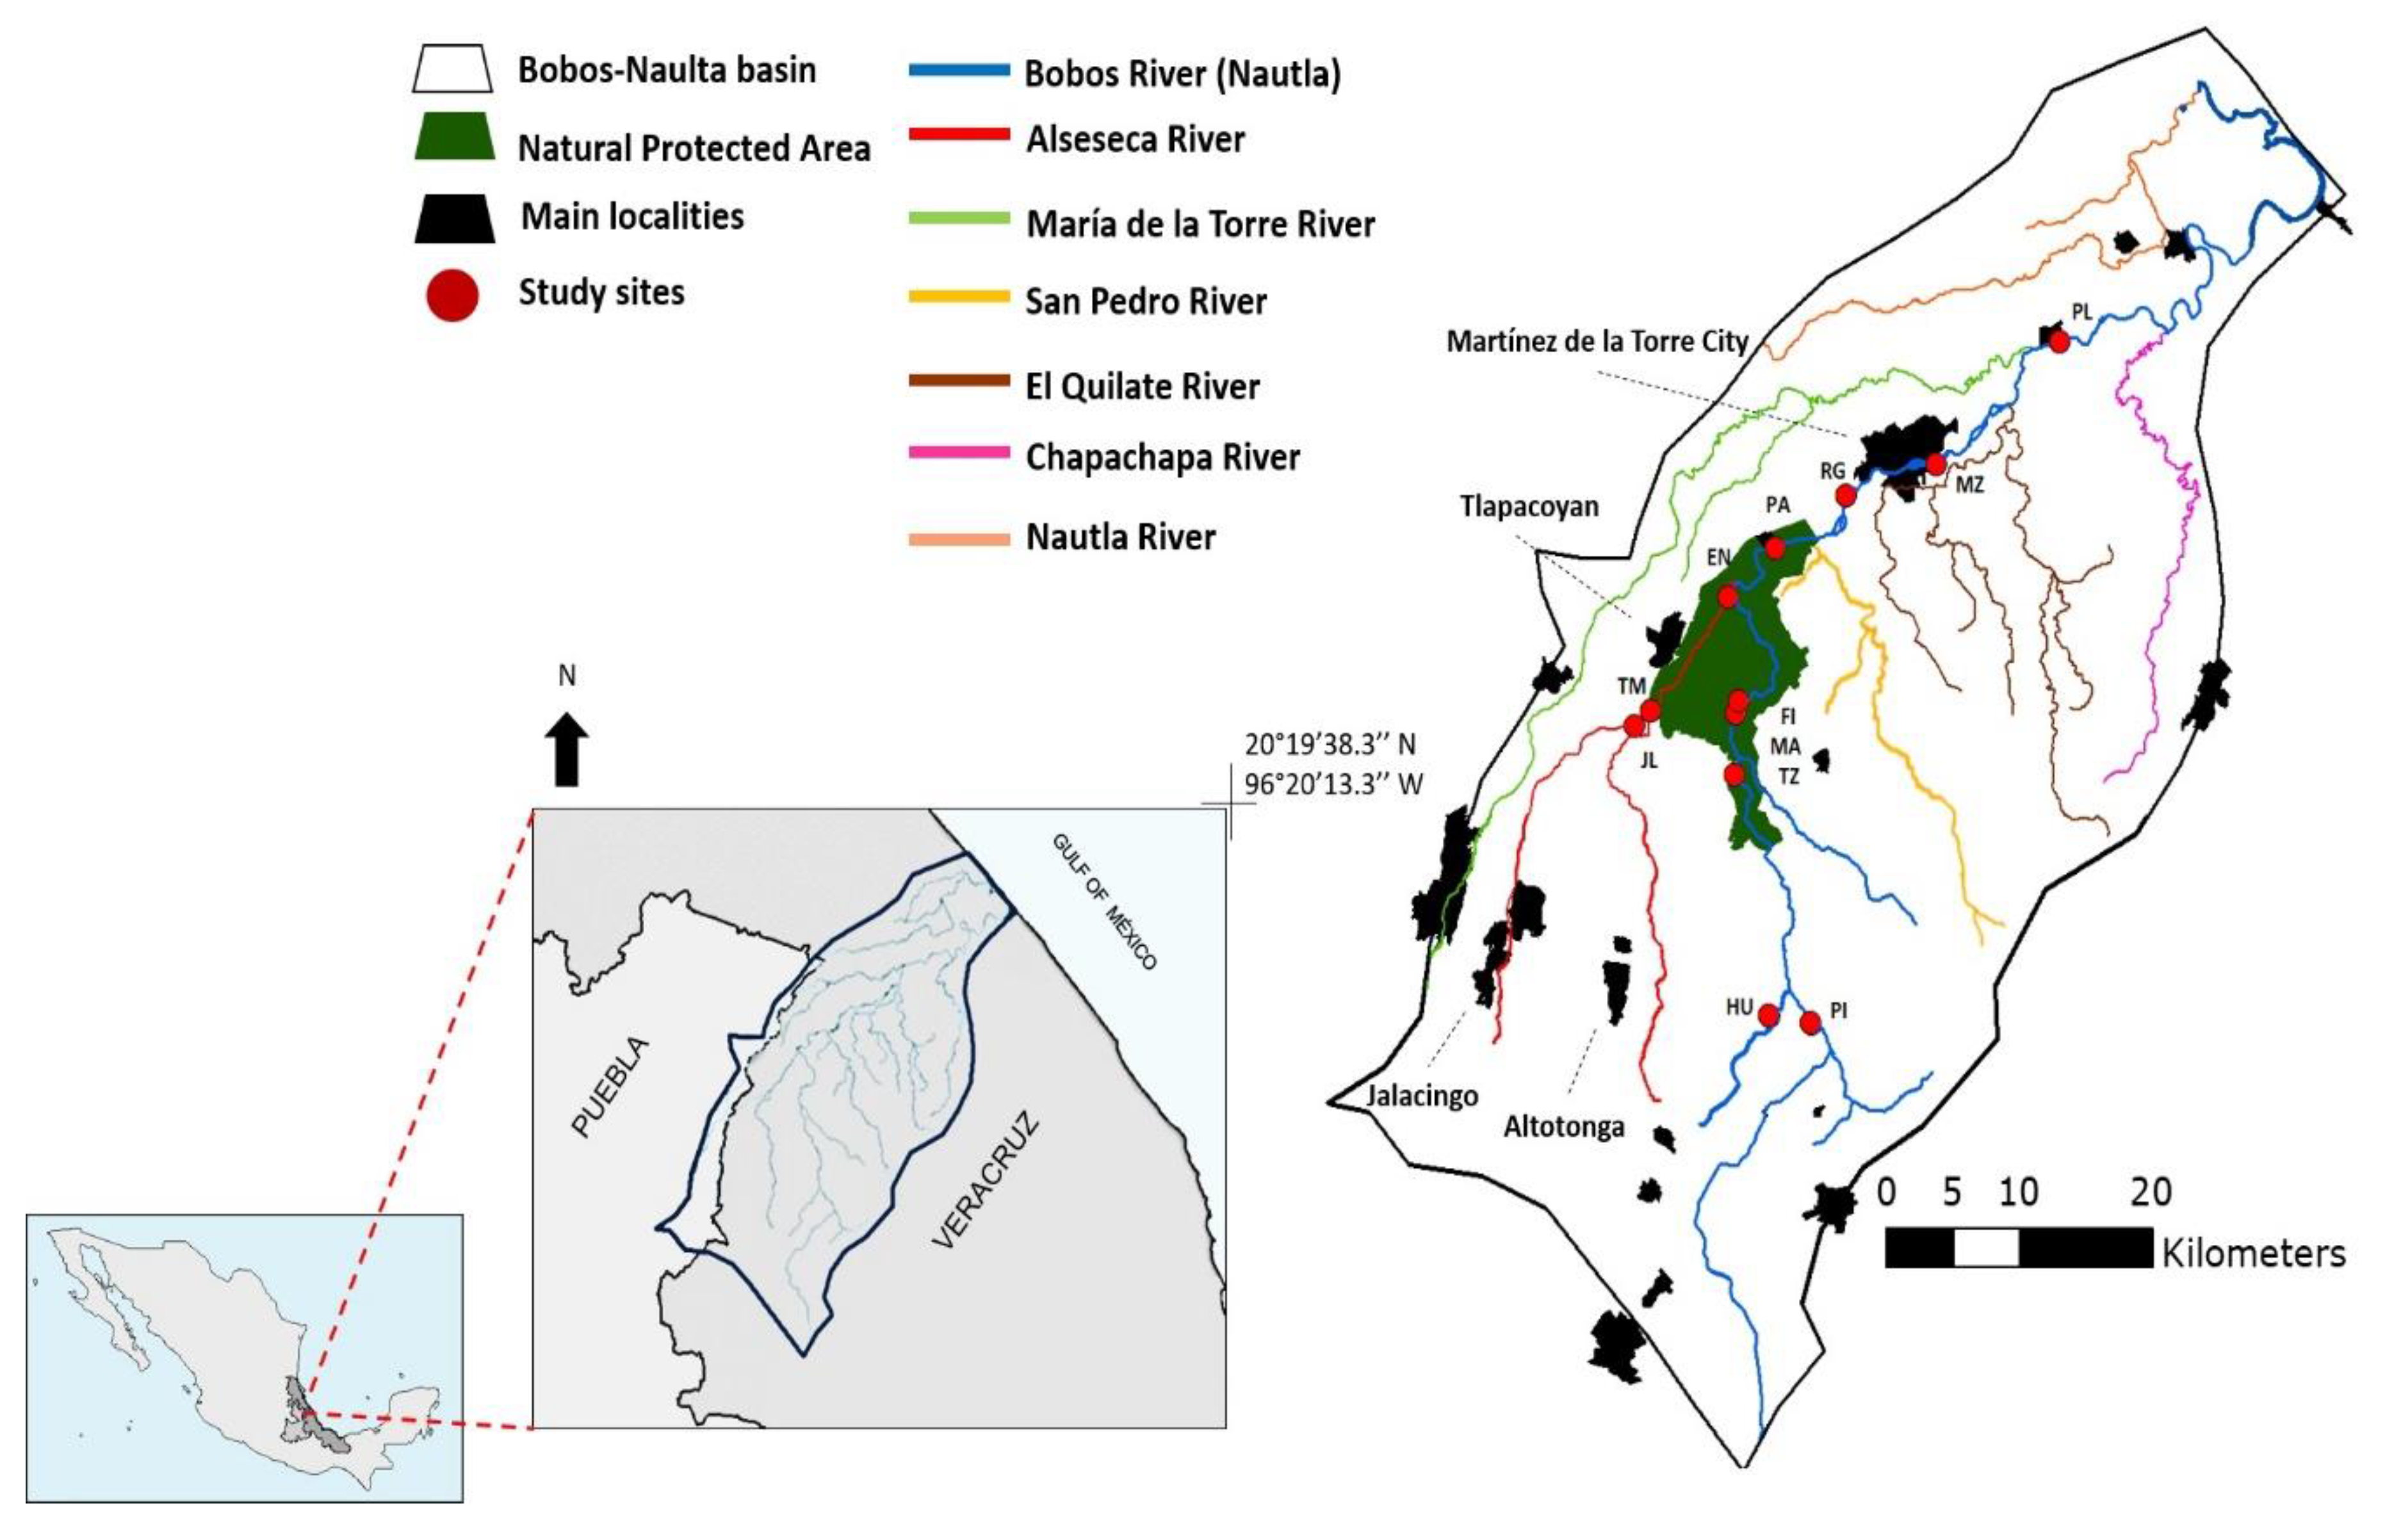
Figure 1. Geographic location of the Bobos river basin and study sites. Red dots mark study sites. PI = Pimiento, HU = Huapala, JL = Jalacingo, TM = Tomata, EN = Encanto, TZ = Tezcapa, MA = Manantial, PI = Puente Filo, PA = Palmillas, RG = Rojo Gómez, MZ = Martínez de la Torre, and PL = Paso Largo.
Water 10 01518 g001
Figure 2. Dendrogram of dissimilarity of Euclidean distances between study sites based on average physicochemical values of all study periods.
Water 10 01518 g002
Figure 3. Altitudinal profile and topographic relief of the Bobos-Nautla River. (A) Altitudinal profile of streams in the Bobos-Nautla River basin. The relative slope (%) for each section is shown in brackets according to the clustering from the dissimilarity analysis. (B) Topographic relief of the Bobos-Nautla River watershed.
Water 10 01518 g003
Figure 4. Mean values of water quality index (WQI) by study site, season, and river portion. a ≠ b (p < 0.05).
Water 10 01518 g004
Figure 5. Percentage of land use in each study site. (A) Percentage of land use for watershed upstream from each study site. (B) Percentage of land use for the upstream 500 m × 2 km buffer zone.
Water 10 01518 g005
Figure 6. Percentage of land uses from buffer and mean WQI of study sites along the Bobos River. Tributaries and streams are shown in colors as in Figure 1.
Water 10 01518 g006
Figure 7. Principal component analysis for study sites, physicochemical variables, WQI, and land uses. (A) Environmental and land-use variables; (B) clusters of study sites.
Water 10 01518 g007
Table 1. Factor loadings and variance (%) for components F1, F2, and F3. Figures in bold are significant (p < 0.05 for each component).
ParameterF1 (35.56%)F2 (20.91%)F3 (13.03%)
DO−0.0871−0.01710.8850
pH0.38790.30740.6906
COND0.09790.7551−0.3434
TURB0.8437−0.17930.1031
T (°C)0.78240.1094−0.4135
NO3−0.7053−0.5861−0.0335
NO2−0.1607−0.65860.5103
NH30.95590.13130.0420
TN0.84920.15850.1872
O–PO4−0.0362−0.6673−0.0824
TP0.5200−0.5171−0.0259
SO4−0.12640.6642−0.3709
BDO5−0.2876−0.09060.7283
TC0.8242−0.28180.0543
FC0.7499−0.5891−0.2426
TSS0.9432−0.13230.0726
HARD−0.34860.8449−0.0211
ALC−0.17930.8110−0.2087
Cl0.3173−0.2528−0.2921
ALT−0.8523−0.16030.1463
CLR0.8230−0.01560.1958
TMCF−0.46230.43790.6355
HEF−0.14920.2514−0.1479
IP−0.1868−0.70410.2858
CP−0.0485−0.7128−0.4024
RA−0.4603−0.4009−0.6416
HSA0.77890.24160.1623
UZ0.86280.26150.0455
HS0.83250.25670.0858
WQI−0.57580.25820.0610
Table 2. Mean values (± Standard Error (SE)) of components related to N and P, WQI, and predominant land uses (%) for each study site.
SiteNO3 (mg/L)NO2 (mg/L)NH3 (mg/L)TN (mg/L)O–PO4 (mg/L)TP (mg/L)WQIPredominant Land Use
PI1.17 (±1.007)0.007 (±0.004)0.19 (±0.09)7.94 (±3.43)0.47 (±0.13)0.76 (±0.4)76.42 ± 1.60TMCF (100%)
HU1.02 (±0.1)0.007 (±0.002)0.18 (±0.04)6.63 (±2.18)0.31 (±0.31)0.59 (±0.1)78.87 ± 2.11TMCF (92%)
TZ0.97 (±0.09)0.007 (±0.001)0.21 (±0.02)8.16 (±2.17)0.34 (±0.07)0.65 (±0.12)76.66 ± 1.97RA (77.6%)
MA1.34 (±0.13)0.006 (±0.001)0.19 (±0.01)7.45 (±2)0.48 (±0.08)0.72 (±0.07)78.08 ± 2.48RA (96%)
FI0.96 (±0.09)0.005 (±0.001)0.25 (±0.06)8.56 (±1.56)0.51 (±0.1)0.89 (±0.13)79.11 ± 2.50RA (79.11%)
JL1.46 (±0.22)0.013 (±0.003)0.21 (±0.03)7.65 (±2.02)0.56 (±0.07)0.8 (±0.12)80.04 ± 2.77RA (67%)
TM1.27 (±0.3)0.011 (±0.004)0.26 (±0.1)8.05 (±3.42)0.53 (±0.17)0.93 (±0.4)75.20 ± 2.27RA (59%)
EN1.21 (±0.25)0.008 (±0.002)0.3 (±0.12)9.31 (±1.95)0.66 (±0.05)1.23 (±0.3)73.84 ± 3.32CP (79%)
PA1.07 (±0.15)0.008 (±0.002)0.27 (±0.08)9.34 (±2.43)0.45 (±0.07)0.8 (±0.15)75.52 ± 1.62RA, HS (59%, 14%)
RG1.03 (±0.16)0.007 (±0.002)0.27 (±0.05)9.89 (±2.8)0.4 (±0.1)0.74 (±0.08)75.65 ± 2.08RA (67%)
MZ0.53 (±0.39)0.005 (±0.005)0.48 (±0.45)10.15 (±9.69)0.25 (±0.03)0.79 (±0.20)70.58 ± 1.35HSA, HS, UZ (62%, 32%, 6%)
PL1.12 (±0.1)0.008 (±0.002)0.35 (±0.14)9.96 (±2.9)0.64 (±0.16)1.08 (±0.33)72.98 ± 2.06HSA, HS, UZ (76%, 23%, 1%)