An Automatic Irrigation Control System for Soilless Culture of Lettuce

1
School of the Environment and Safety Engineering, Institute of Environment Health and Ecological Security, Jiangsu University, Zhenjiang 212013, China
2
College of Engineering, Huazhong Agriculture University, Wuhan 430070, China
*
Author to whom correspondence should be addressed.
Water 2018, 10(11), 1692; https://doi.org/10.3390/w10111692
Submission received: 17 September 2018
/
Revised: 9 November 2018
/
Accepted: 15 November 2018
/
Published: 20 November 2018
(This article belongs to the Section Water, Agriculture and Aquaculture)
Abstract
:To achieve precise measurement of moisture content in the substrate and intelligent water-saving irrigation, a simple and low cost automatic irrigation control system based on ZigBee wireless network has been developed. A software with irrigation strategy was proposed based on the models of substrate wetting pattern, lettuce root zone and the evapotranspiration. The system could detect substrate moisture in real-time and irrigate automatically according to the threshold of substrate and the irrigation strategy. The average fresh weight per plant under intelligent irrigation are 16.60% and 11.37% higher than manual control irrigation at least in different growth stages in spring and summer, the average drainage rate of intelligent irrigation is 16.08% and 17.06% smaller than manual control irrigation in spring and summer, and the irrigation water use efficiency of intelligent irrigation is 68.03% and 98.61% higher than manual control irrigation in spring and summer. The results show that the system is a promising tool for scientific and rational irrigation decision.
1. Introduction
Lettuce, one kind of shallow rooted and moisture sensitive crop, is the most popular vegetable with the highest consumption rate throughout the world [1,2]. Moisture stress is being crucial for yield and quality [3], because of the water condition of the root zone is one of the most important factors for lettuce cultivation.
Soilless culture is a promising technique largely applied in greenhouse horticulture due to its multiple advantages [4,5]. In substrate culture, water must be precisely controlled to the crop because the water holding capacity of the substrate is very low and substrate are usually inert [6,7].
Lettuce has been grown with substrate in greenhouse for many years [8,9]. However, most lettuce growers tend to irrigate when they observe crop wilting during the day and the amount of irrigation they apply is based on their experience [10]. Obviously, an adequate irrigation control is of great importance to achieve a profitable production of lettuce with high yield and quality.
An automatic irrigation system was designed based on the potential evapotranspiration for irrigation control under greenhouse climatic conditions [11,12], soil moisture sensors [13,14] and leaf temperature sensor [15]. Due to the advantages of straightforward installation, and low cost in wiring and piping in wireless technologies, autonomous irrigation with sensors in agricultural systems has been intensively explored in the last years [16,17,18,19], however, most of these studies were conducted on soil, the substrate physicochemical properties are significantly difference from soil, and these differences have great impact on substrate water evaporation capacity, substrate moisture migration, crop root growth in substrate, and substrate moisture detection, therefore, the automatic irrigation control system for soil cause waste of water or water stress to crops in substrate cultivation. For better irrigation management, substrate water evaporation capacity, substrate moisture migration, crop root growth in substrate, and substrate moisture detection are required.
The main objective of this study were (i) to develop an automatic irrigation control system applied in soilless based on ZigBee wireless sensor networks; (ii) to evaluate the performance of the developed automated system under greenhouse conditions. This low cost technology can easily be installed and used in a variety of settings including greenhouse, home gardens and small farms.
2. Material and Methods
2.1. Configuration of the System
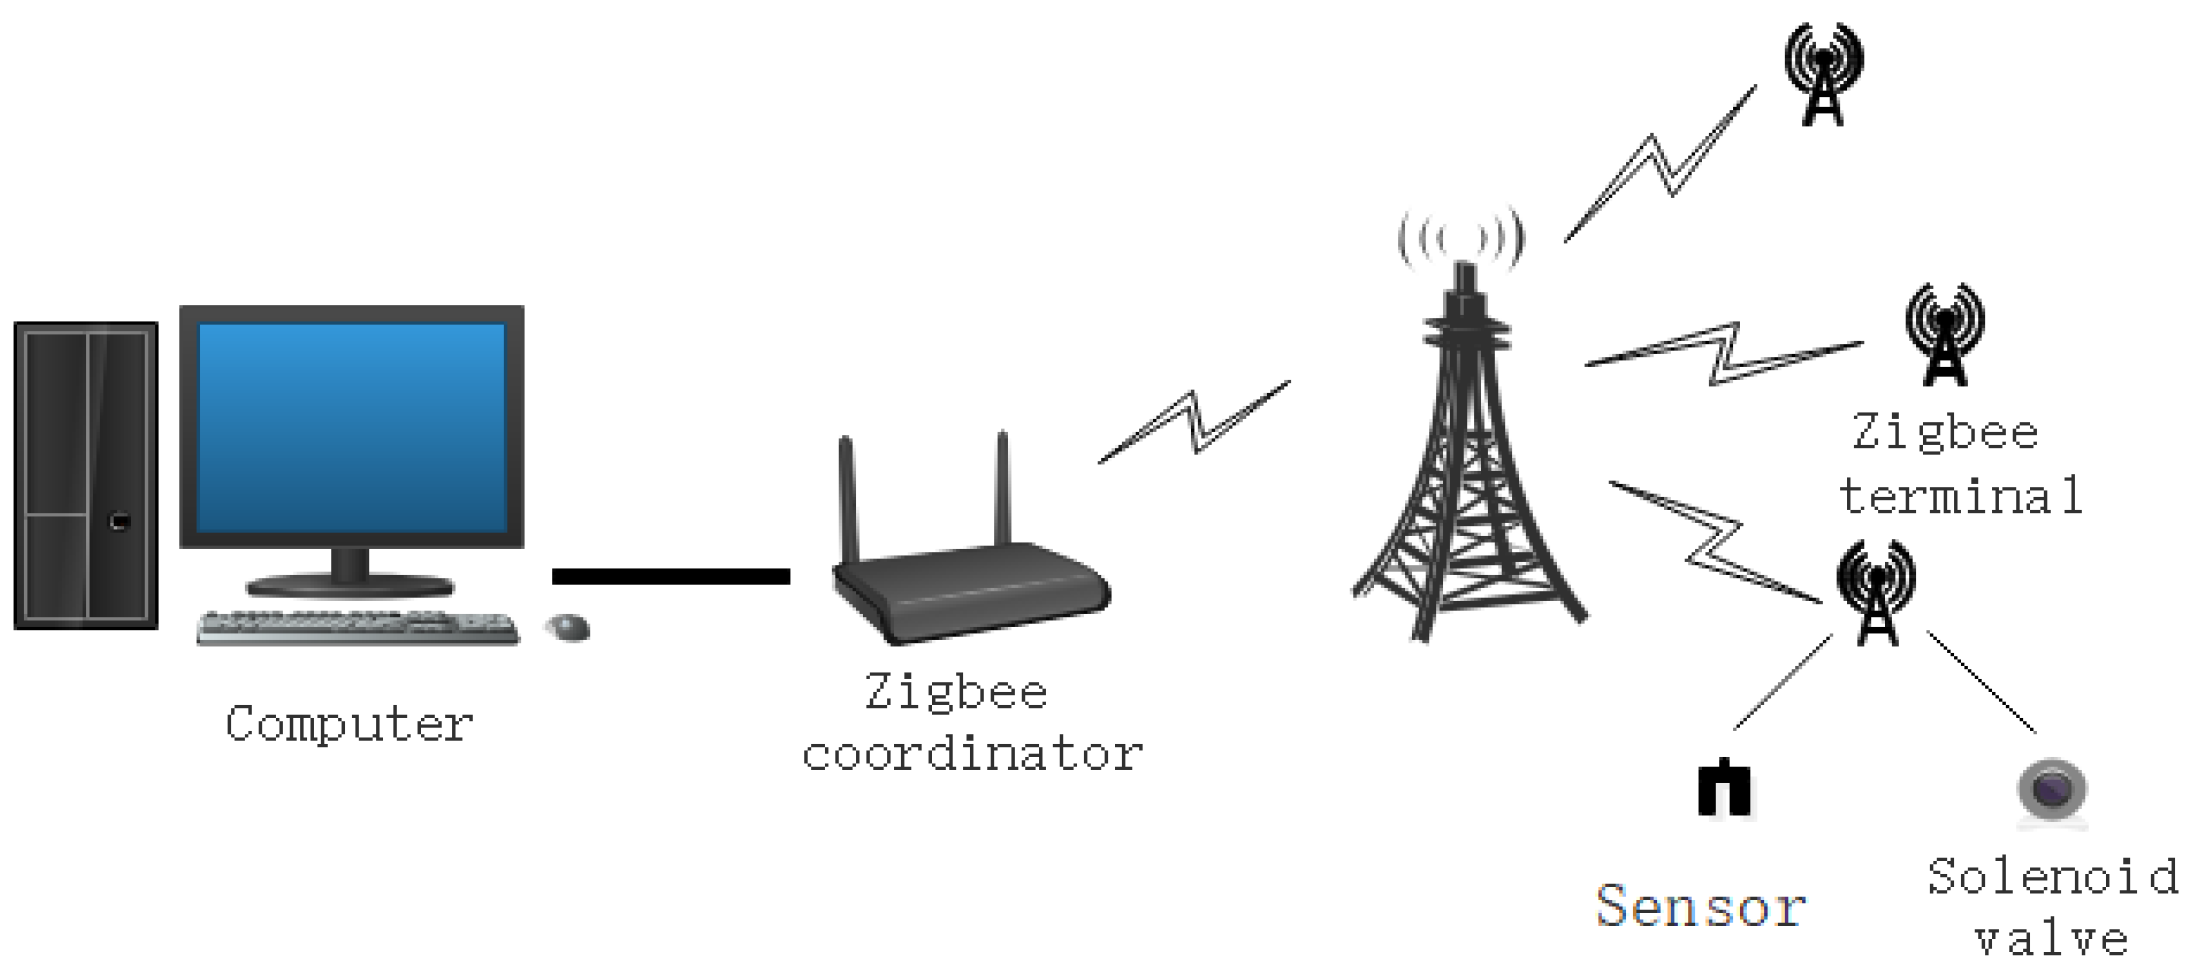
The irrigation control system is illustrated in Figure 1. The base station unit is the initiator of the ZigBee network construction, which controls the entire network. The function unit (Zigbee terminal and Zigbee coordinator) is responsible for collection and transition of the irrigation control signal and substrate moisture signal, including air temperature, solar radiation and so on. The sensor unit is used to measure the substrate water content, air temperature, and solar radiation.
2.2. Irrigation Control Strategy
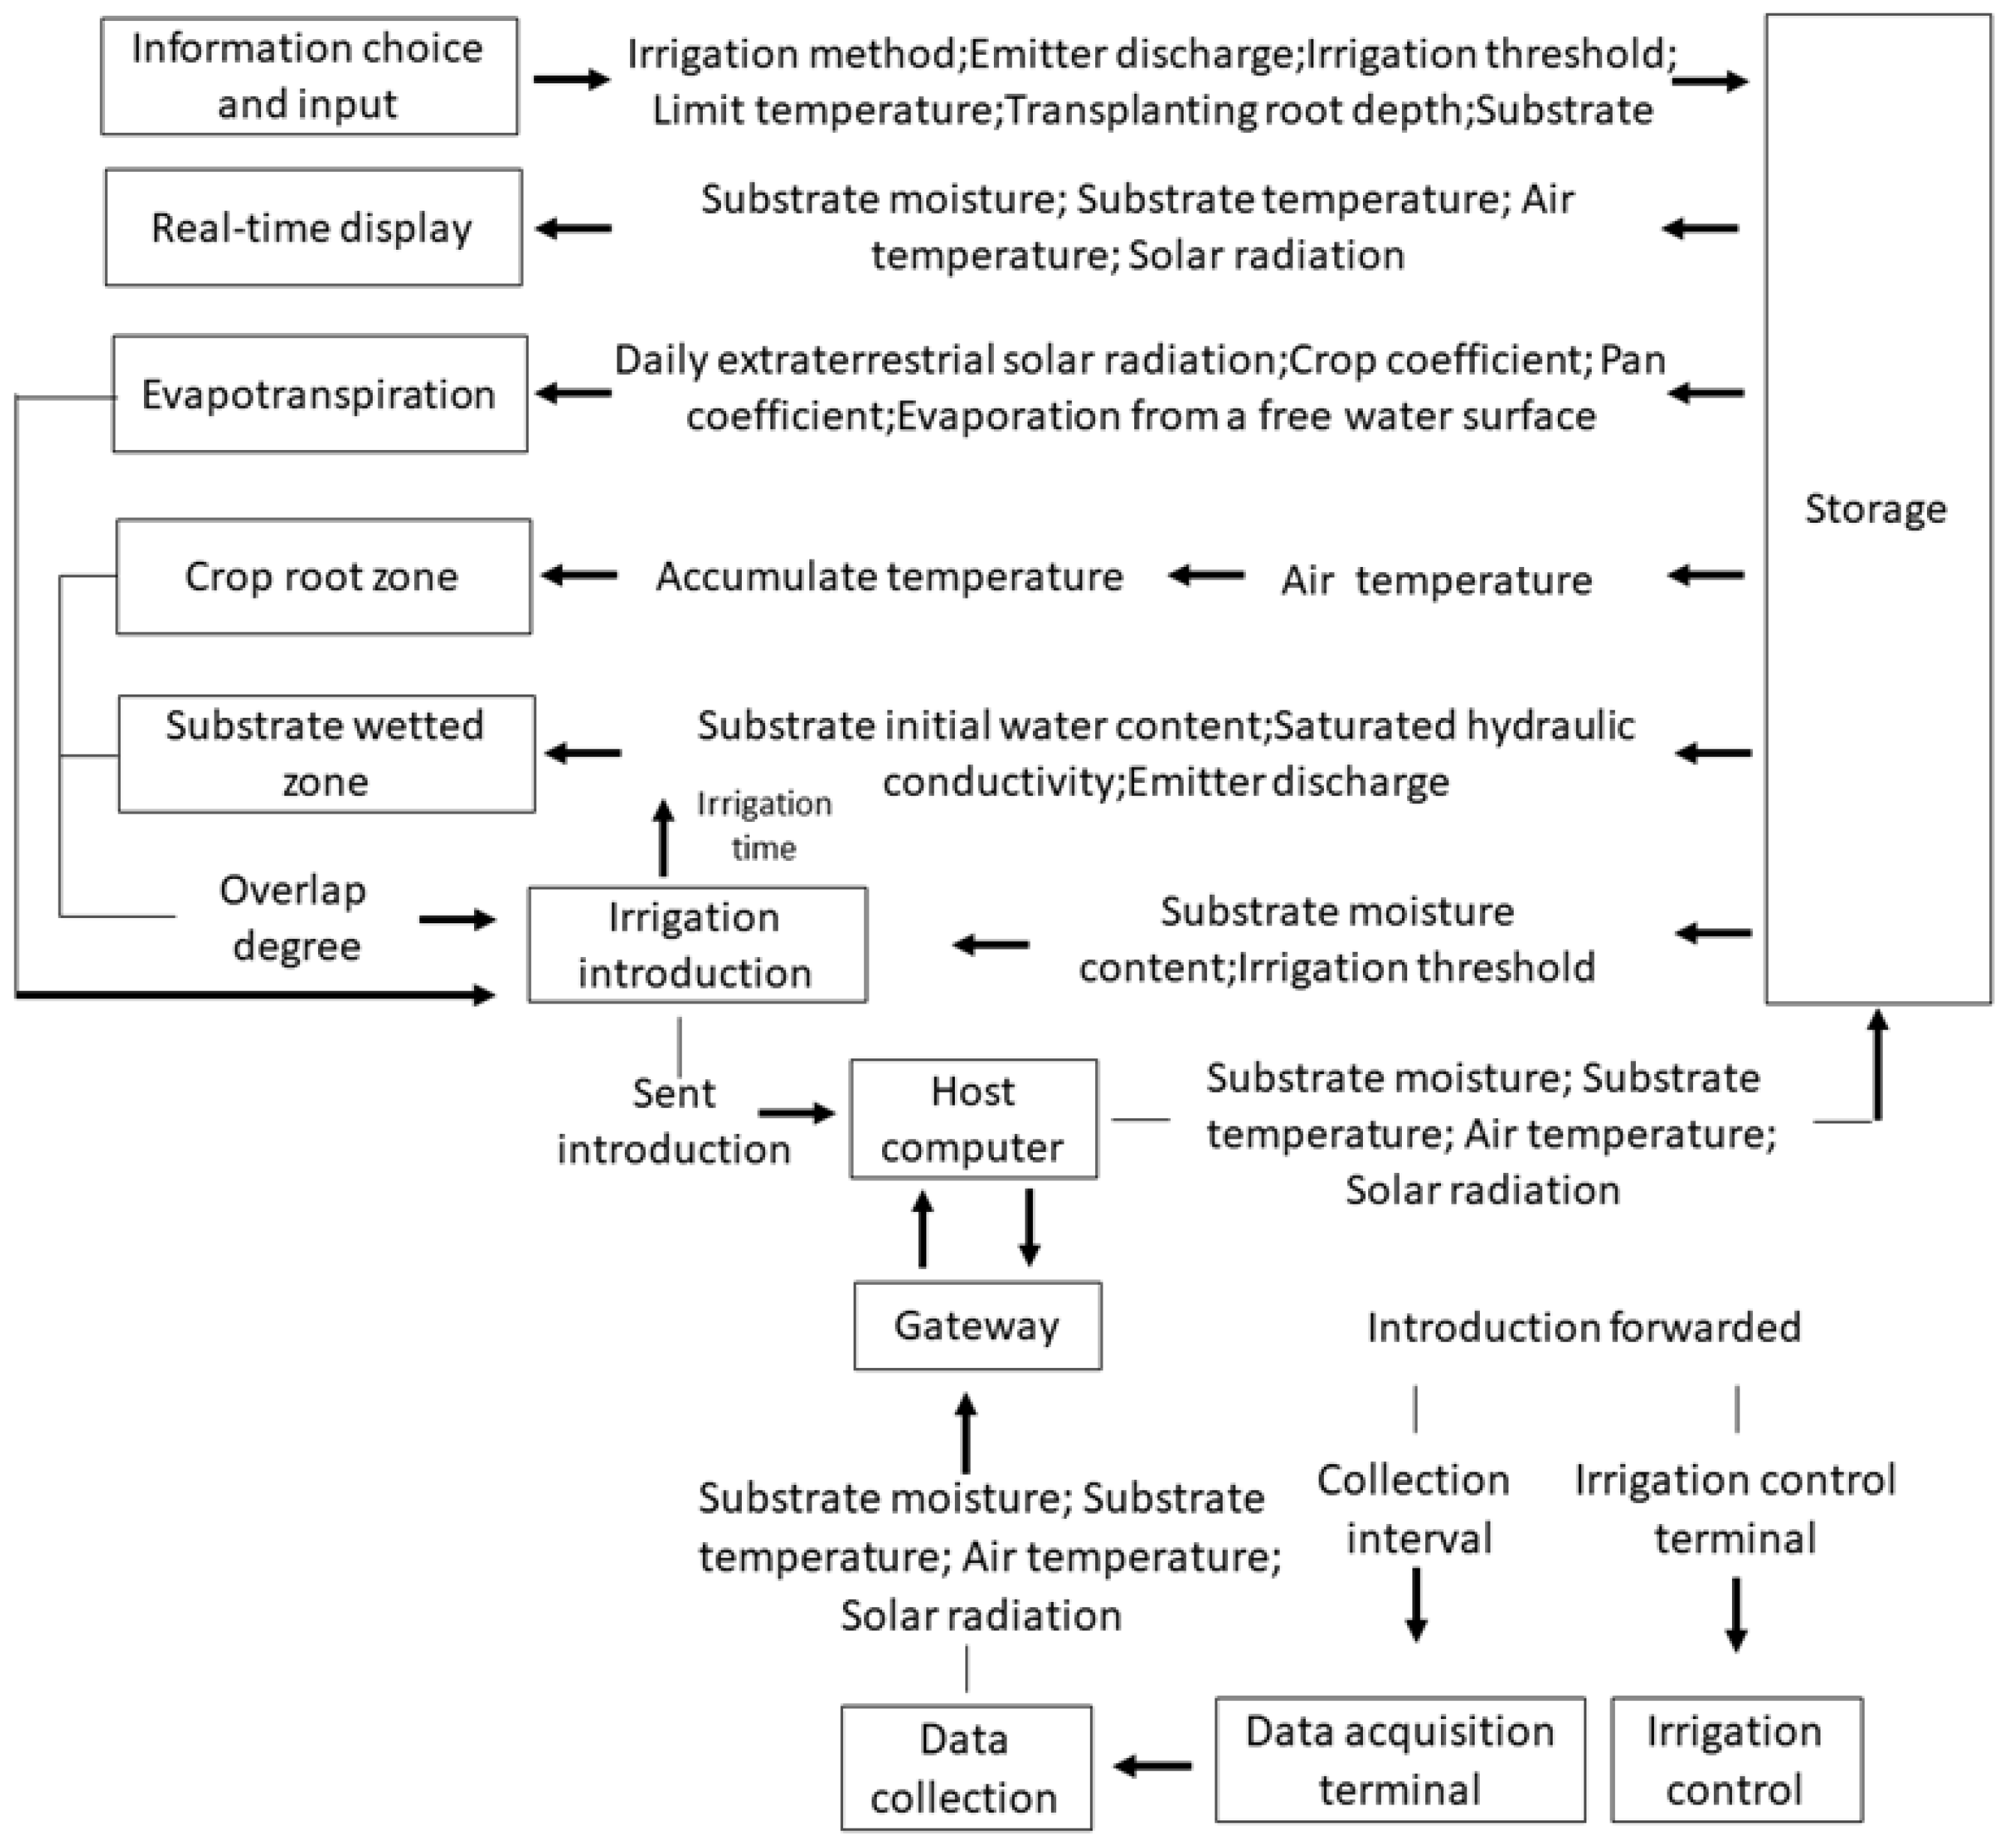
The control strategy based on the crop root zone, substrate wetted zone, crop water evapotranspiration and substrate moisture was proposed to achieve dynamic real-time measurement and irrigation control.
Irrigation begun when the substrate moisture content detected by sensors below the irrigation threshold value (0.14 cm3/cm3). The crop water evapotranspiration, the substrate wetted zone and root zone were calculated according to a predetermined interval. Combined with the irrigation volume, crop water evapotranspiration, the overlap area of substrate wetted zone and crop root zone (overlap (R, W)) to make co-decisions when the irrigation stopped, the conditions for stopping irrigation are meet (i) the overlap area is more than 80%; (ii) the irrigation volume is greater or equal to crop water evapotranspiration; and (iii) the water content in the root zone is higher than irrigation threshold value at the same time. A control flow chart of the automatic irrigation control system is depicted in Figure 2.
2.3. Irrigation Control Model
This work aims at testing the adequacy of the automatic irrigation control system to properly manage the irrigation for soilless, the scheme of the model is as follows:
2.3.1. Substrate Moisture Sensor Calibration Model
To obtain reliable substrate moisture content, a compensation model based on temperature for each EC-5 sensor (8.9 cm length, 1.8 cm width, 0.7 cm depth, METER, Pullman, WA, USA) can be calculated as [20]:
where θsensor is the substrate water content (%), U is the output voltage of EC-5 (mv), T is the substrate temperature (°C), and a,b and c are the constant.
2.3.2. Crop Water Evapotranspiration Simulation Model
A crop water evapotranspiration simulation model was developed to calculate the crop water consumption cultivated with substrate for each irrigation interval. ETc,t is the water evapotranspiration for periods shorter than a day and can be calculated as [7]:
where Ra,d is the daily extraterrestrial solar radiation and Ra,t is the daily extraterrestrial solar radiation during the interval between irrigation, which can be obtained by PYR solar radiation sensor (METER, USA), ETc,d is the daily crop water evapotranspiration and can be calculated as [21]:
where Kc is the crop coefficient, ET0 is the reference evapotranspiration, which can be calculated as:
where Kpan = 0.79 is the pan coefficient for greenhouse climatic condition [22] and E0 is the evaporation from a free water surface.
2.3.3. Crop Root Zone Simulation Model
A crop root zone simulation model was developed to calculate the root growth and distribution in substrate. The root depth (Z) and root zone radius (R) under different depths can be used to describe the root zone and expressed as [23]:
where is the growth rates of the root depth (cm/day), bz is a constant (cm/°C day), Ta is the day mean of air temperature (°C), Tb is the minimum temperature for root growth (°C), Z is root depth (cm), R is root radius (cm) and d, e, f, g are the coefficient that could be described as:
where C is undetermined coefficient and h, i, j, k are the constants, DD is the cumulative temperature (°C) and can be described as:
where Tm is the maximum temperature for root growth (°C).
2.3.4. Substrate Wetted Zone Simulation Model
A substrate wetted zone simulation model was developed to calculate the moisture migration in substrate. The wetted radius (W) on the substrate surface and the wetted depth (D) in the substrate are essential for the determination of the substrate wetted zone, which can be expressed as [24]:
where W is the wetted radius (cm), D is the wetted depth (cm), V is the irrigation volume (L), Ks is the saturated hydraulic conductivity (cm/h), q is the emitter discharge (L/h), z is the depth of emitter insert into the substrate (cm), A1, A2 are constants and n1, n2 are exponents of equation.
According to the experimental data, the whole wetted zone under substrate surface can be expressed as [25]:
where X and Y are the wetted radius and wetted depth at a specific application time and any position of the wetting front. is the angle between wetted radius (W) and wetted depth (D).
2.3.5. Overlapping-Degree Model
The overlap area of substrate wetted zone and crop root zone (overlap (R, W)) were calculated to indicate the matching results and can be described as:
where area(R, W) is the overlap area of substrate wetted zone and crop root zone (cm2), and can be described by the minimal area of piecewise curve based on intersection points of Equations (6), (10) and (11). Area(R) is the area of crop root zone (cm2) and can be described as:
where Z is root depth (cm), R is root radius (cm).
2.4. Crop Cultivation and Experimental Conditions
This experiment was conducted in a lettuce greenhouse, which can open the side wall automatically when the temperature was higher than 26 °C. The grind vinegar residue (50%) and peat (50%) paced to a bulk density of 0.184 g/cm3 are used as growth substrate, and the saturated hydraulic conductivity was found to be 0.051 cm/s, a flow rate of 1 L/h per dripper was operated by the irrigation set, and the total volume of irrigation is measured by high precision water meter. Lettuce seeds (High Vegetable Seed of China, Liertian Seeds limited company, Cangzhou, Hebei, China) were obtained from a supermarket, and transplanted when it grows four leaves after planting, the substrate was saturated with water before transplanting. Lettuces were planted on line spaced 0.2 m apart, and 60 lettuces were used for intelligent irrigation, other identical amount lettuces for manual control irrigation with three replicates. The experimental treatments were applied 35 days from transplanting, and the fresh leaves of lettuce were weight by balance every 6 days. The root depth, root radius at different depth, the wetted depth, wetted radius at different depth were monitored by dig methods in a previous cultivation experiment.
2.5. Analysis
Data were subjected to analysis of variance (ANOVA) for intelligent irrigation and manual control irrigation analysis using Microsoft Excel to determine the statistical significance of the treatments at a 5% significance level.
3. Results and Discussion
3.1. Software Application Development
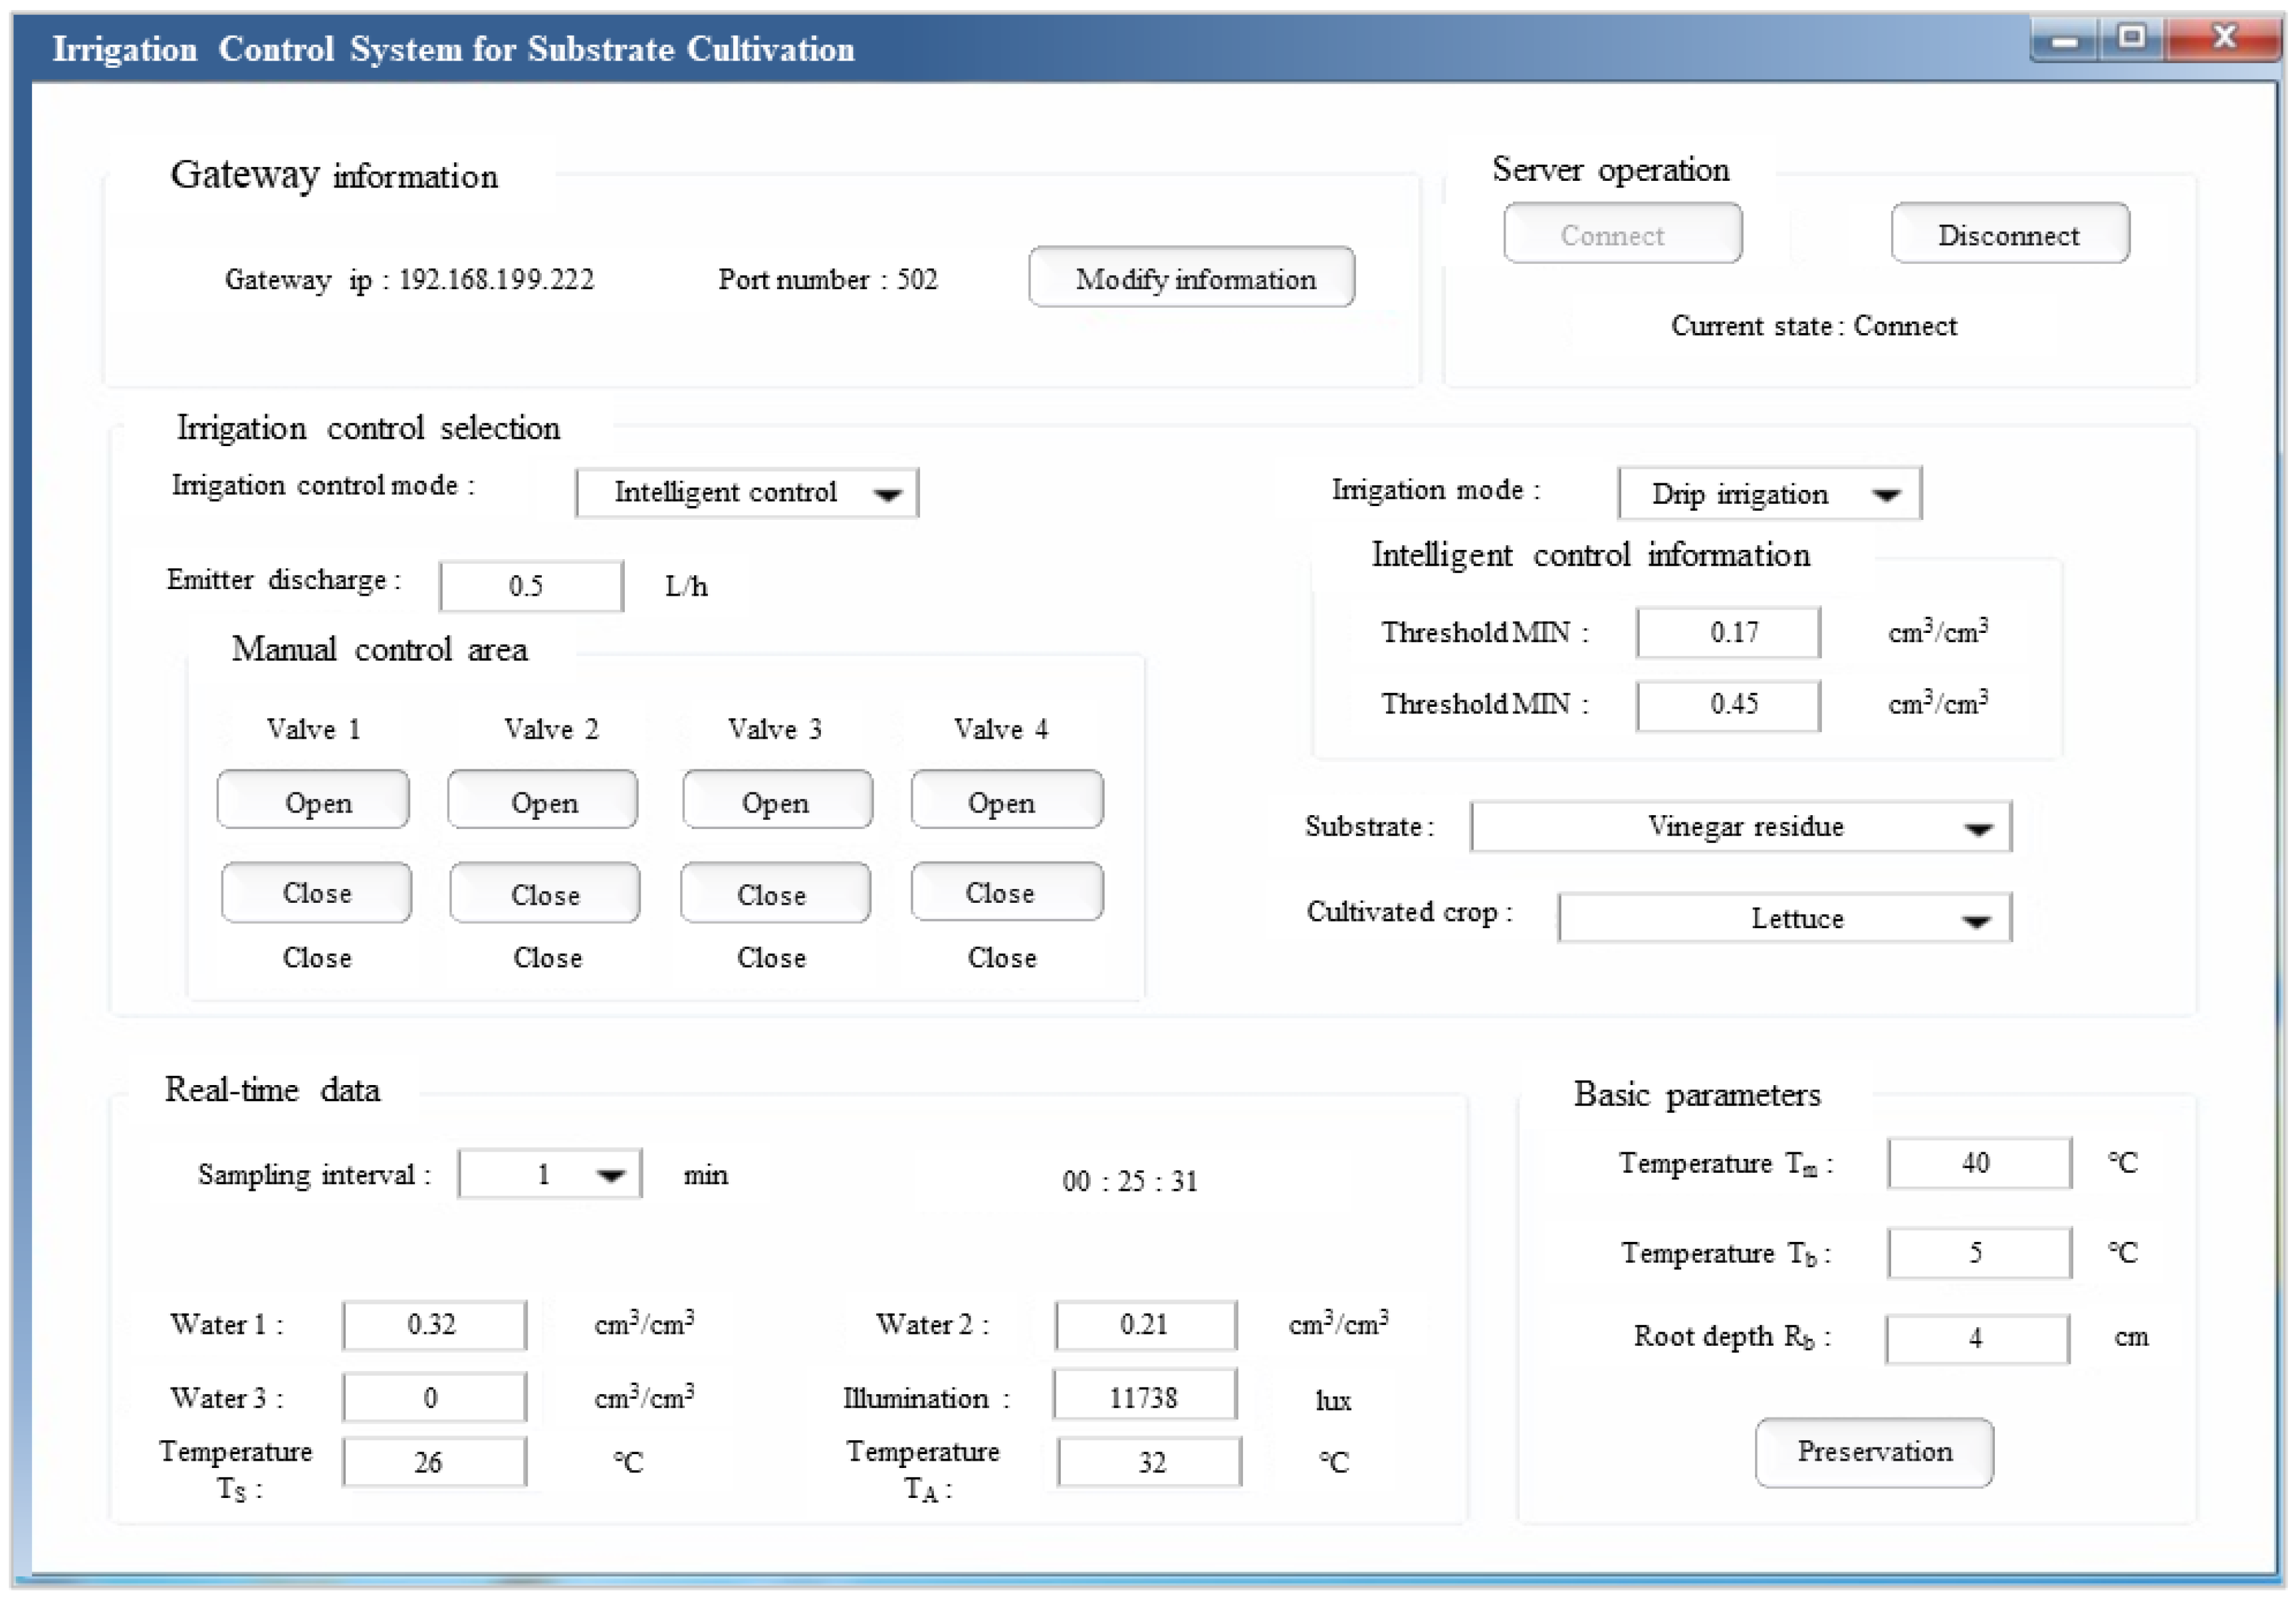
A software was designed to implement the proposed methodology, the irrigation strategy has been pre-programmed and the substrate wetting pattern and crop root zone can be simulated. The user interface designed and organized into several frames, it allowed users to choice irrigation mode, substrate type and crop variety, input basic parameters, and real-time display the detected data from sensors in real-time (Figure 3).
3.2. Model Parameters
The model parameters are the core and key of the irrigation control system. The values of the parameters can be obtained by experiments and radiation sensors. Table 1 and Table 2 are the parameters of EC-5 sensor, root depth model, wetting pattern model and the root zone radius model, and can be defined as input parameters.
3.3. Performance of the Control System
The automatic irrigation control system has been developed to assist those growers who don’t know when and how to irrigate in soilless conditions. The friendly man-machine interface makes it easy to use. The control system has two irrigation methods: manual control irrigation and intelligent irrigation, the performance of the control system is validated by comparing intelligent irrigation and manual control irrigation.
3.3.1. Crop Performance
Aboveground average fresh weight (FW) per plant measured every 7 days after planting in spring and summer, are summarized in Table 3. The average fresh weight (FW) per plant under intelligent irrigation are at least 16.60% and 11.37% higher than manual control irrigation at different growth stages in spring and summer. This fact can be related to the low water holding capacity of substrate and also due to the intelligent irrigation method may detect and irrigate in real time and maintain the water content at root zone meeting the plant demand in comparison with the manual control irrigation method.
3.3.2. Drainage Rate at Each Irrigation
Table 4 and Table 5 show the detailed comparison of drainage rate at every irrigation pulse for 3 days in spring and summer. The average drainage rates were 8.67% and 9.82% for intelligent irrigation, 24.75% and 26.88% for manual control irrigation in spring and summer, the average drainage rate of intelligent irrigation is 16.08% and 17.06% smaller than manual control irrigation in spring and summer, respectively.
The intelligent irrigation can reduce the drainage rate effectively, the lower drainage rate of intelligent irrigation can be due to reduce the irrigation depth, increase irrigation frequency and decrease irrigation amount per irrigation. Nevertheless the average drainage rate in summer is higher than in spring for intelligent irrigation and manual control irrigation, these is because the higher temperature in summer lead to the upper substrate dry, and increase the substrate water repellency, the irrigation water is easier to drainage during irrigation.
3.3.3. Irrigation Water Use Efficiency
The irrigation water use efficiency (IWUE) can be described by the fresh weight (FW) divided irrigation amount [10]. Table 6 shows the total irrigation amount and drainage amount, crop fresh weight and IWUE in spring and summer. The intelligent irrigation reduce the irrigation amount, drainage amount and increase the IWUE compared to the manual control irrigation, the IWUE of intelligent irrigation is 68.03% and 98.61% higher than manual control irrigation in spring and summer, respectively. This is because the intelligent irrigation of the irrigation control system realized the accurate detection of substrate water content and precise control of irrigation volume, and the lettuces grow well without water stress and wilt symptoms.
4. Conclusions
A simple and low-cost automatic irrigation control system based on ZigBee wireless network has been developed and tested for soilless cultivation in greenhouse. A software with friendly interface was developed to simulate the irrigation, set parameters, and display real-time substrate moisture content, substrate temperature and air temperature. The system performed well, as the average fresh weight per plant under intelligent irrigation are 16.60% and 11.37% higher than manual control irrigation at different growth stages, the average drainage rate of intelligent irrigation is 16.08% and 17.06% smaller than manual control irrigation in spring and summer, and the irrigation water use efficiency of intelligent irrigation is 68.03% and 98.61% higher than manual control irrigation in spring and summer, however, the IWUE of intelligent irrigation have a room for improvement, further improvement to the proposed model and irrigation control strategy should be introduced to solve the irrigation problem in substrate cultivation.
Author Contributions
Z.L. designed and carried out the simulations and wrote the paper; Q.X. analyzed the data and revised the manuscript.
Funding
This research was funded by the National Natural Science Foundation of China (grant number 51509098).
Conflicts of Interest
The authors declare no conflict of interest.
References
- Johnson, W.C.; Jackson, L.E.; Ochoa, O.; van Wijk, R.; Peleman, J.; Clair, D.A.S.; Michelmore, R.W. Lettuce, a shallow-rooted crop, and Lactuca serriola, its wild progenitor, differ at QTL determining root architecture and deep soil water exploitation. Theor. Appl. Genet. 2000, 101, 1066–1073. [Google Scholar] [CrossRef]
- Bozkurt, S.; Mansuroglu, G.S. The effects of drip line depths and irrigation levels on yield, quality and water use characteristics of lettuce under greenhouse. Afr. J. Biotechnol. 2011, 10, 3370–3379. [Google Scholar]
- Sahin, U.; Kuslu, Y.; Kiziloglu, F.M.; Cakmakci, T. Growth, yield, water use and crop quality responses of lettuce to different irrigation quantities in a semi-arid region of high altitude. J. Appl. Hortic. 2016, 18, 195–202. [Google Scholar]
- Fei, L.; Wang, A.; Wang, L.; Yin, C.; Wang, J. Experiment on substrate cultivation of cherry tomatoes in sunlight greenhouse with drip irrigation. J. Drain. Irrig. Mach. Eng. 2016, 34, 1070–1076. [Google Scholar]
- Lu, J.; Wang, J.; Liu, J.; Lu, H.; Li, P. Water distribution of mixed media in elevated strawberry cultivation. J. Drain. Irrig. Mach. Eng. 2017, 35, 535–540. [Google Scholar]
- Rodríguez, D.; Reca, J.; Martínez, J.; Urrestarazu, M. New Adaptive Hybrid-Automatic Irrigation Control System for Soilless Culture. J. Irrig. Drain. Eng. 2014, 141. [Google Scholar] [CrossRef]
- Rodríguez, D.; Reca, J.; Martínez, J.; López-Luque, R.; Urrestarazu, M. Development of a New Control Algorithm for Automatic Irrigation Scheduling in Soilless Culture. Appl. Math. Inf. Sci. 2015, 9, 47–56. [Google Scholar] [CrossRef]
- Turhan, E.; Sevgican, A. Effects of different growing media on greenhouse lettuce grown in soilless culture. Acta Hortic. 1999, 491, 405–408. [Google Scholar] [CrossRef]
- Engindeniz, S.; Tuzel, Y. Economic analysis of organic greenhouse lettuce production in turkey. Sci. Agric. 2006, 63, 285–290. [Google Scholar] [CrossRef]
- Chauhan, Y.S.; Wright, C.C.; Holzworth, D.; Rachaputi, R.C.N.; Payero, J.O. AQUAMAN: A web-based decision support system for irrigation scheduling in peanuts. Irrig. Sci. 2013, 31, 271–283. [Google Scholar] [CrossRef]
- Norrie, J.; Graham, M.E.D.; Dubé, P.A.; Gosselin, A. Improvements in Automatic Irrigation of Peat-grown Greenhouse Tomatoes. HortTechnology 1994, 4, 154–159. [Google Scholar]
- Munyaradzi, M.; Nyambo, B.; Mashonjowa, E.; Rupere, T. Low Cost Automated Irrigation Controller for A Greenhouse on An 8 Bit PIC Microcontroller Using A Radiation Sensor. Internal J. Innov. Technol. Res. 2013, 1, 130–135. [Google Scholar]
- Ferrarezi, R.S.; Dove, S.K.; van Iersel, M.W. An Automated System for Monitoring Soil Moisture and Controlling Irrigation Using Low-cost Open-source Microcontrollers. HortTechnology 2015, 25, 100–118. [Google Scholar]
- Montesano, F.F.; van Iersel, M.W.; Parente, A. Timer versus moisture sensor-based irrigation control of soilless lettuce:Effects on yield, quality and water use efficiency. Hort. Sci. 2016, 43, 67–75. [Google Scholar]
- Debnath, M.; Patel, N.; Mishra, A.K.; Varghese, C. Irrigation Scheduling Using Low Cost Plant Leaf Temperature Sensor Based Water Application System for Increasing Water Productivity of Fruit Crop. Int. J. Electron. Commun. Comput. Eng. 2016, 7, 49–56. [Google Scholar]
- Viani, F.; Bertolli, M.; Salucci, M.; Polo, A. Low-Cost Wireless Monitoring and Decision Support for Water Saving in Agriculture. IEEE Sens. J. 2017, 17, 4299–4309. [Google Scholar] [CrossRef]
- Nagarajan, G.; Minu, R.I. Wireless Soil Monitoring Sensor for Sprinkler Irrigation Automation System. Wirel. Pers. Commun. 2017, 98, 1–17. [Google Scholar] [CrossRef]
- Montesano, F.F.; Iersel, M.W.V.; Boari, F.; Cantore, V.; Parente, A. Sensor-based irrigation management of soilless basil using a new smart irrigation system: Effects of set-point on plant physiological responses and crop performance. Agric. Water Manag. 2015, 203, 20–29. [Google Scholar] [CrossRef]
- Mafuta, M.; Zennaro, M.; Bagula, A.; Ault, G.; Gombachika, H.; Chadza, T. Successful Deployment of a Wireless Sensor Network for Precision Agriculture in Malawi. Int. J. Distrib. Sens. Netw. 2013, 9, 1–13. [Google Scholar] [CrossRef]
- Liu, Z.G.; Li, P.P.; Hu, Y.G.; Zhang, X. Calibration method for detection of matrix water content with dielectric-type moisture sensor. Trans. CSAE 2011, 27, 109–202. [Google Scholar]
- Doorenbos, J.; Pruitt, W.O. Guidelines for Predicting Crop Water Requirements; Food and Agriculture Organization of the United Nations: Rome, Italy, 1977. [Google Scholar]
- Zhang, X.; Zhuang, W.; Li, H.; Zhang, Q.; Liu, T. Research of Pan Coefficient Kp in Southwest of China. J. Irrig. Drain. 2018, 35, 109–112. [Google Scholar]
- Liu, Z.G.; Wang, J.Z.; Xu, Y.F.; Li, P.P. Root Growth Model of Lettuce under Different Cultivation Substrates and Irrigation Modes. Trans. Chin. Soc. Agric. Mach. 2014, 45, 284–288. [Google Scholar]
- Liu, Z.G.; Li, P.P.; Hu, Y.G. Modeling the Wetting Patterns in Cultivation Substrates under Drip Irrigation. J. Coast. Res. 2015, 73, 173–176. [Google Scholar] [CrossRef]
- Liu, Z.G.; Xu, Q.C. Wetting patterns estimation in cultivation substrates under drip irrigation. Desalin. Water Treat. 2018, 112, 319–324. [Google Scholar] [CrossRef]
Figure 1.
Schematic representation of irrigation control system.

Figure 2.
Flow diagram for the proposed control algorithm.

Figure 3.
Control interface.


Table 1.
The parameters of the EC-5 sensor, root depth model and wetting pattern model.
| EC-5 Sensor | Root Depth (Z) | Wetted Radius | Wetted Depth | ||||
|---|---|---|---|---|---|---|---|
| a | b | c | bz | A1 | n1 | A2 | n2 |
| 1.83 | 522.24 | 597.41 | 0.014 | 0.15 | 1.01 | 2.96 | 0.28 |
Table 2.
The parameters of the root zone radius model.
| Coefficient | Root Zone Radius (R) | |||
|---|---|---|---|---|
| h | i | j | k | |
| d | 5.04 × 10⁻¹⁰ | −5.61 × 10⁻⁷ | 4.24 × 10⁻⁵ | 0.08 |
| e | −1.15 × 10⁻⁸ | 1.48 × 10⁻⁵ | −4.48 × 10⁻³ | −0.53 |
| f | 4.69 × 10⁻⁸ | −7.26 × 10⁻⁵ | 2.98 × 10⁻² | −0.34 |
| g | −2.67 × 10⁻⁸ | 3.58 × 10⁻⁵ | −9.95 × 10⁻³ | −0.46 |
Table 3.
The average fresh weight (FW) per plant.
| Irrigation Methods | FW in Spring/g | FW in Summer/g | ||||||||
|---|---|---|---|---|---|---|---|---|---|---|
| 7 day | 14 day | 21 day | 28 day | 35 day | 7 day | 14 day | 21 day | 28 day | 35 day | |
| Intelligent irrigation | 3.15 a | 10.14 a | 31.65 a | 92.21 a | 211.20 a | 1.78 a | 6.57 a | 20.96 a | 85.08 a | 178.52 a |
| Manual control irrigation | 2.06 b | 7.12 b | 18.63 b | 76.18 b | 181.13 b | 1.37 b | 5.21 b | 16.30 b | 63.71 b | 160.38 b |
Letters indicate statistical significance at α = 0.05 level within “a” and “b”.
Table 4.
Detail comparisons of drainage rate at different irrigation control treatments for 3 days.
| Irrigation Methods | Irrigation Frequency | Spring | ||
|---|---|---|---|---|
| Irrigation Amount/m3 | Drainage Amount/m3 | Drainage Rate/% | ||
| Intelligent irrigation | 1 | 0.224 a | 0.020 a | 8.93 a |
| 2 | 0.202 a | 0.017 a | 8.41 a | |
| Manual control irrigation | 1 | 0.444 b | 0.110 b | 24.75 b |
Letters indicate statistical significance at α = 0.05 level within “a” and “b”.
Table 5.
Detail comparisons of drainage rate at different irrigation control treatments for 3 days.
| Irrigation Methods | Irrigation Frequency | Summer | ||
|---|---|---|---|---|
| Irrigation Amount/m3 | Drainage Amount/m3 | Drainage Rate/% | ||
| Intelligent irrigation | 1 | 0.211 a | 0.020 a | 9.48 a |
| 2 | 0.202 a | 0.021 a | 10.40 a | |
| 3 | 0.224 a | 0.022 a | 9.82 a | |
| 4 | 0.219 a | 0.021 a | 9.59 a | |
| Manual control irrigation | 1 | 0.444 b | 0.108 b | 24.32 b |
| 2 | 0.444 b | 0.128 b | 28.83 b | |
| 3 | 0.444 b | 0.122 b | 27.48 b | |
Letters indicate statistical significance at α = 0.05 level within “a” and “b”.
Table 6.
Total irrigation, drainage, fresh weight and irrigation water use efficiency for 35 days.
| Irrigation methods | Accumulated | |||||||
|---|---|---|---|---|---|---|---|---|
| Spring | Summer | |||||||
| Irrigation/m3 | Drainage/m3 | FW/kg | IWUE/kg m3 | Irrigation/m3 | Drainage/m3 | FW/kg | IWUE/kg m3 | |
| Intelligent irrigation | 6.18 a | 0.53 a | 12.67 a | 2.05 a | 7.48 a | 0.736 a | 10.71 a | 1.43 a |
| Manual control irrigation | 8.89 b | 2.21 b | 10.87 b | 1.22 b | 13.33 b | 3.59 b | 9.62 b | 0.72 b |
Letters indicate statistical significance at α = 0.05 level within “a” and “b”.
© 2018 by the authors. Licensee MDPI, Basel, Switzerland. This article is an open access article distributed under the terms and conditions of the Creative Commons Attribution (CC BY) license (http://creativecommons.org/licenses/by/4.0/).
Share and Cite
MDPI and ACS Style
Liu, Z.; Xu, Q. An Automatic Irrigation Control System for Soilless Culture of Lettuce. Water 2018, 10, 1692. https://doi.org/10.3390/w10111692
AMA Style
Liu Z, Xu Q. An Automatic Irrigation Control System for Soilless Culture of Lettuce. Water. 2018; 10(11):1692. https://doi.org/10.3390/w10111692
Chicago/Turabian StyleLiu, Zhigang, and Qinchao Xu. 2018. "An Automatic Irrigation Control System for Soilless Culture of Lettuce" Water 10, no. 11: 1692. https://doi.org/10.3390/w10111692
Note that from the first issue of 2016, this journal uses article numbers instead of page numbers. See further details here.