Assessing the Effects of Urbanization on Flood Events with Urban Agglomeration Polders Type of Flood Control Pattern Using the HEC-HMS Model in the Qinhuai River Basin, China


Abstract
:1. Introduction
2. Materials and Methods
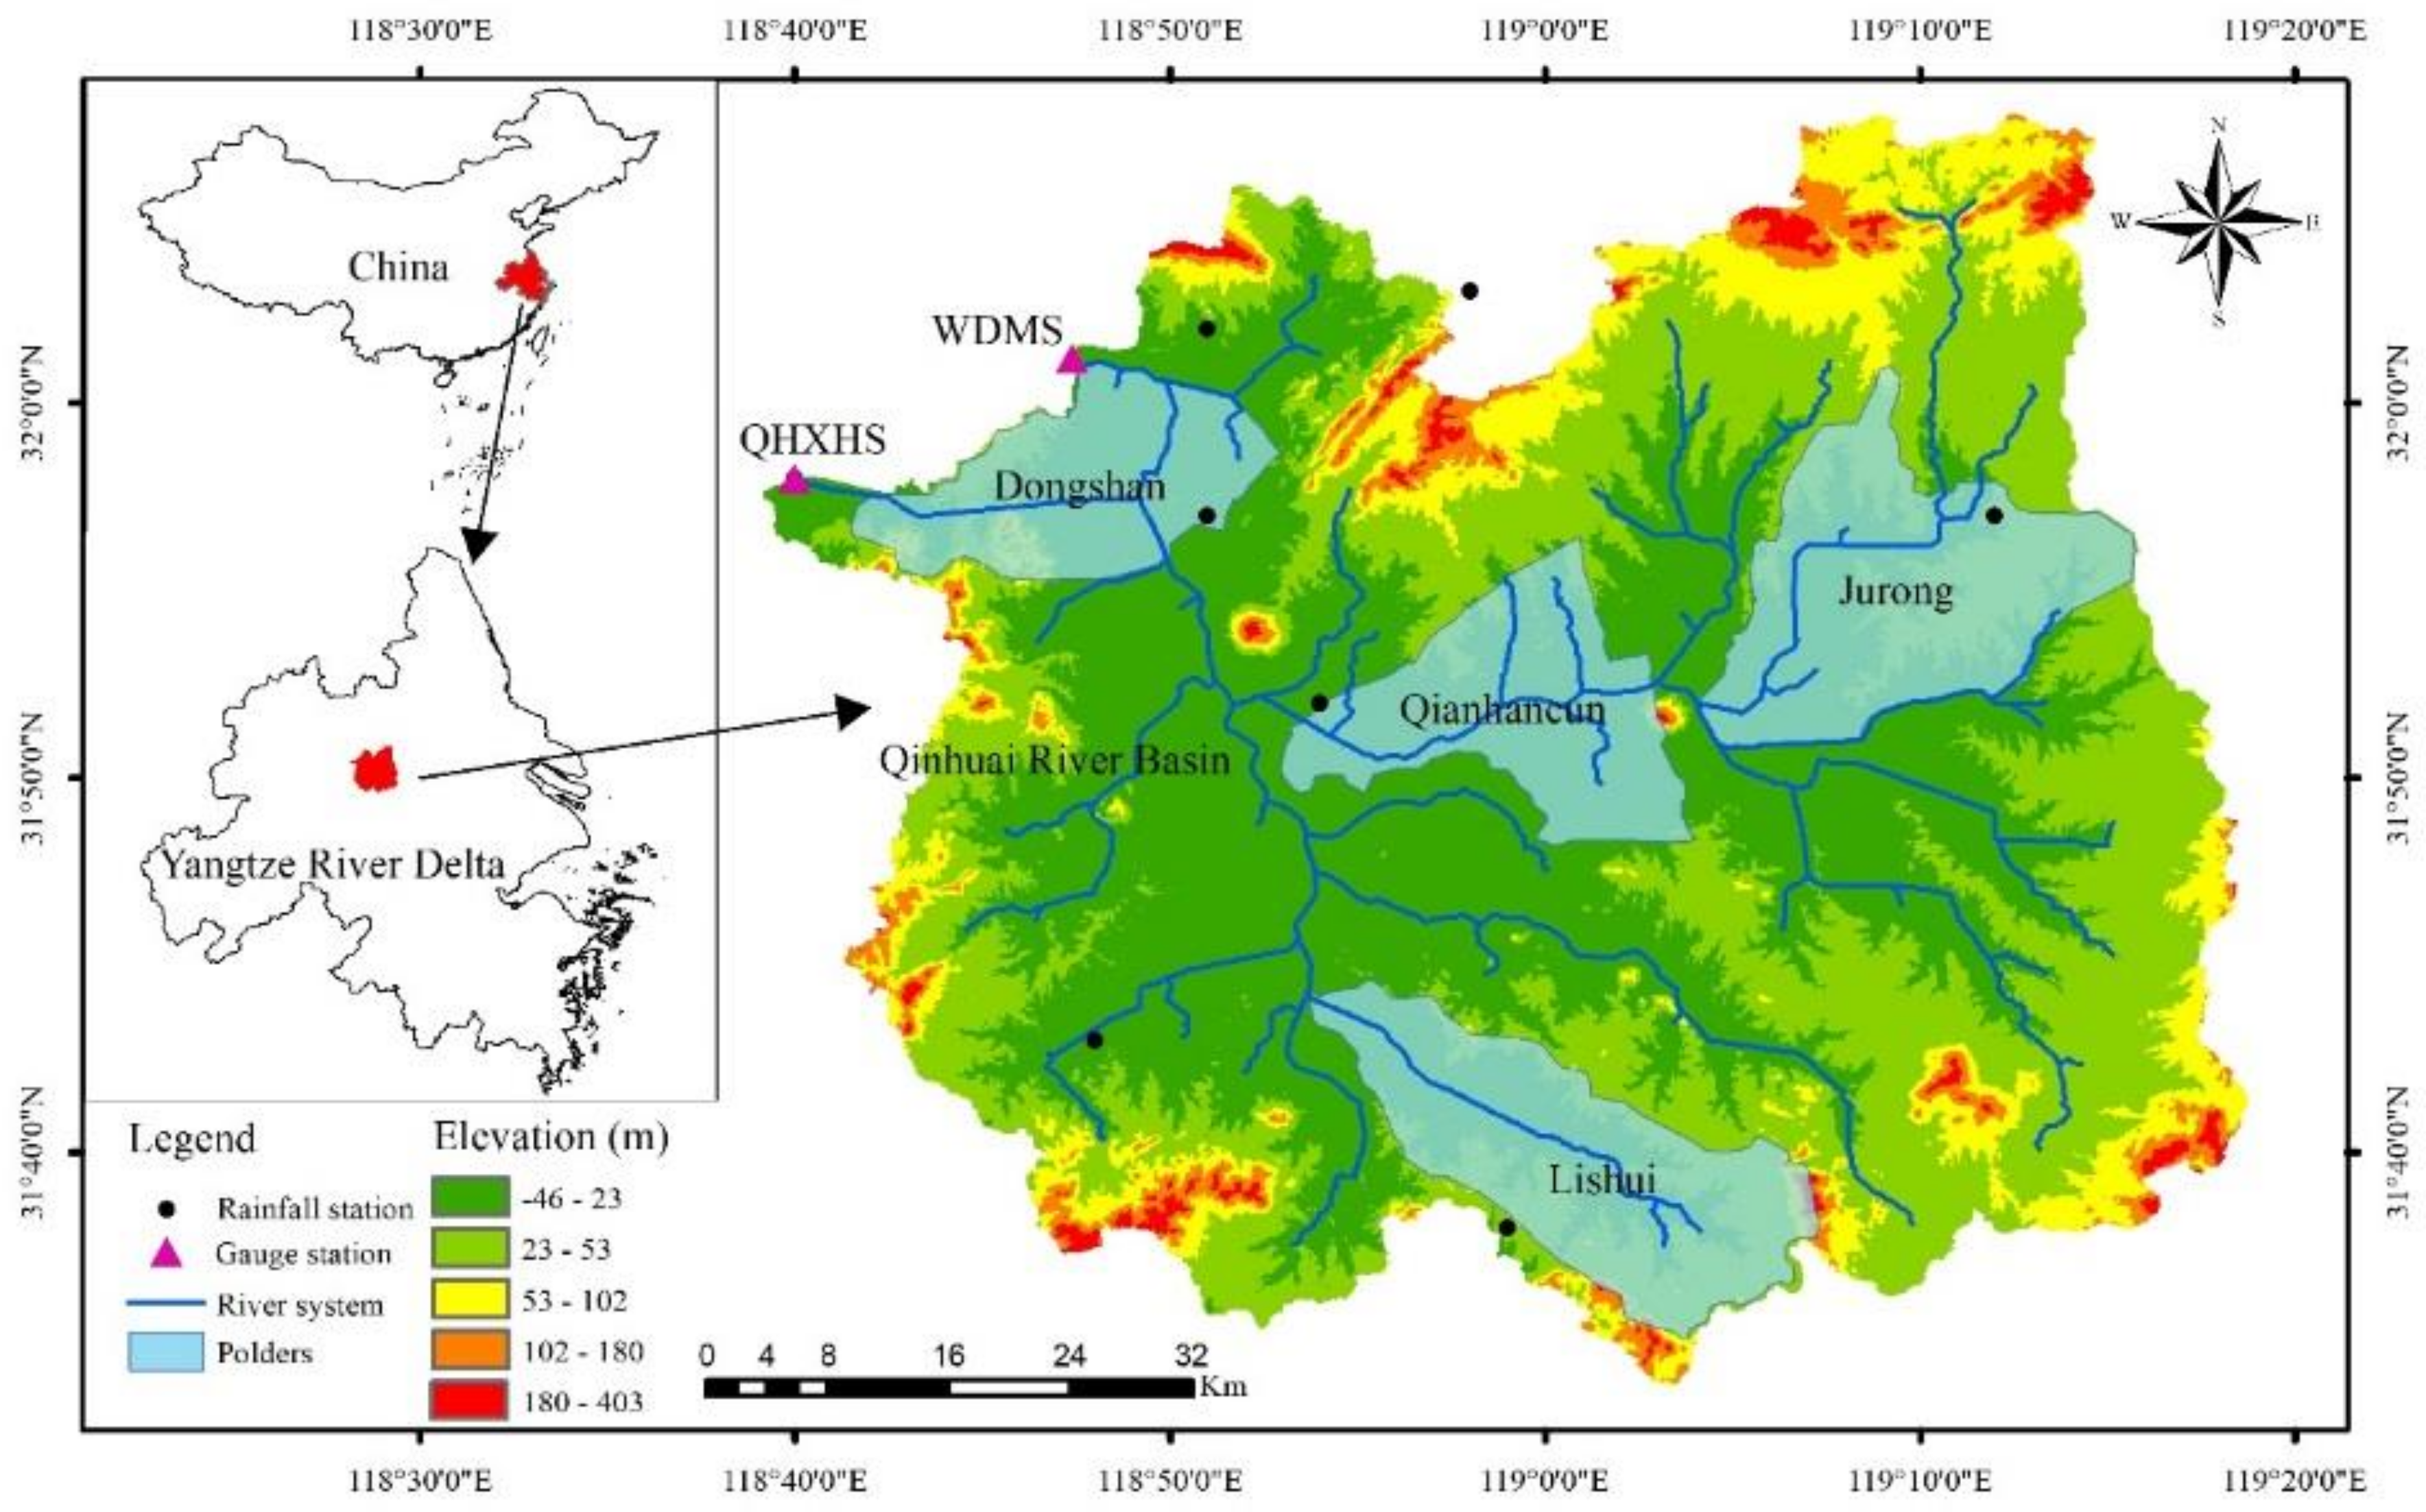
2.1. Study Area
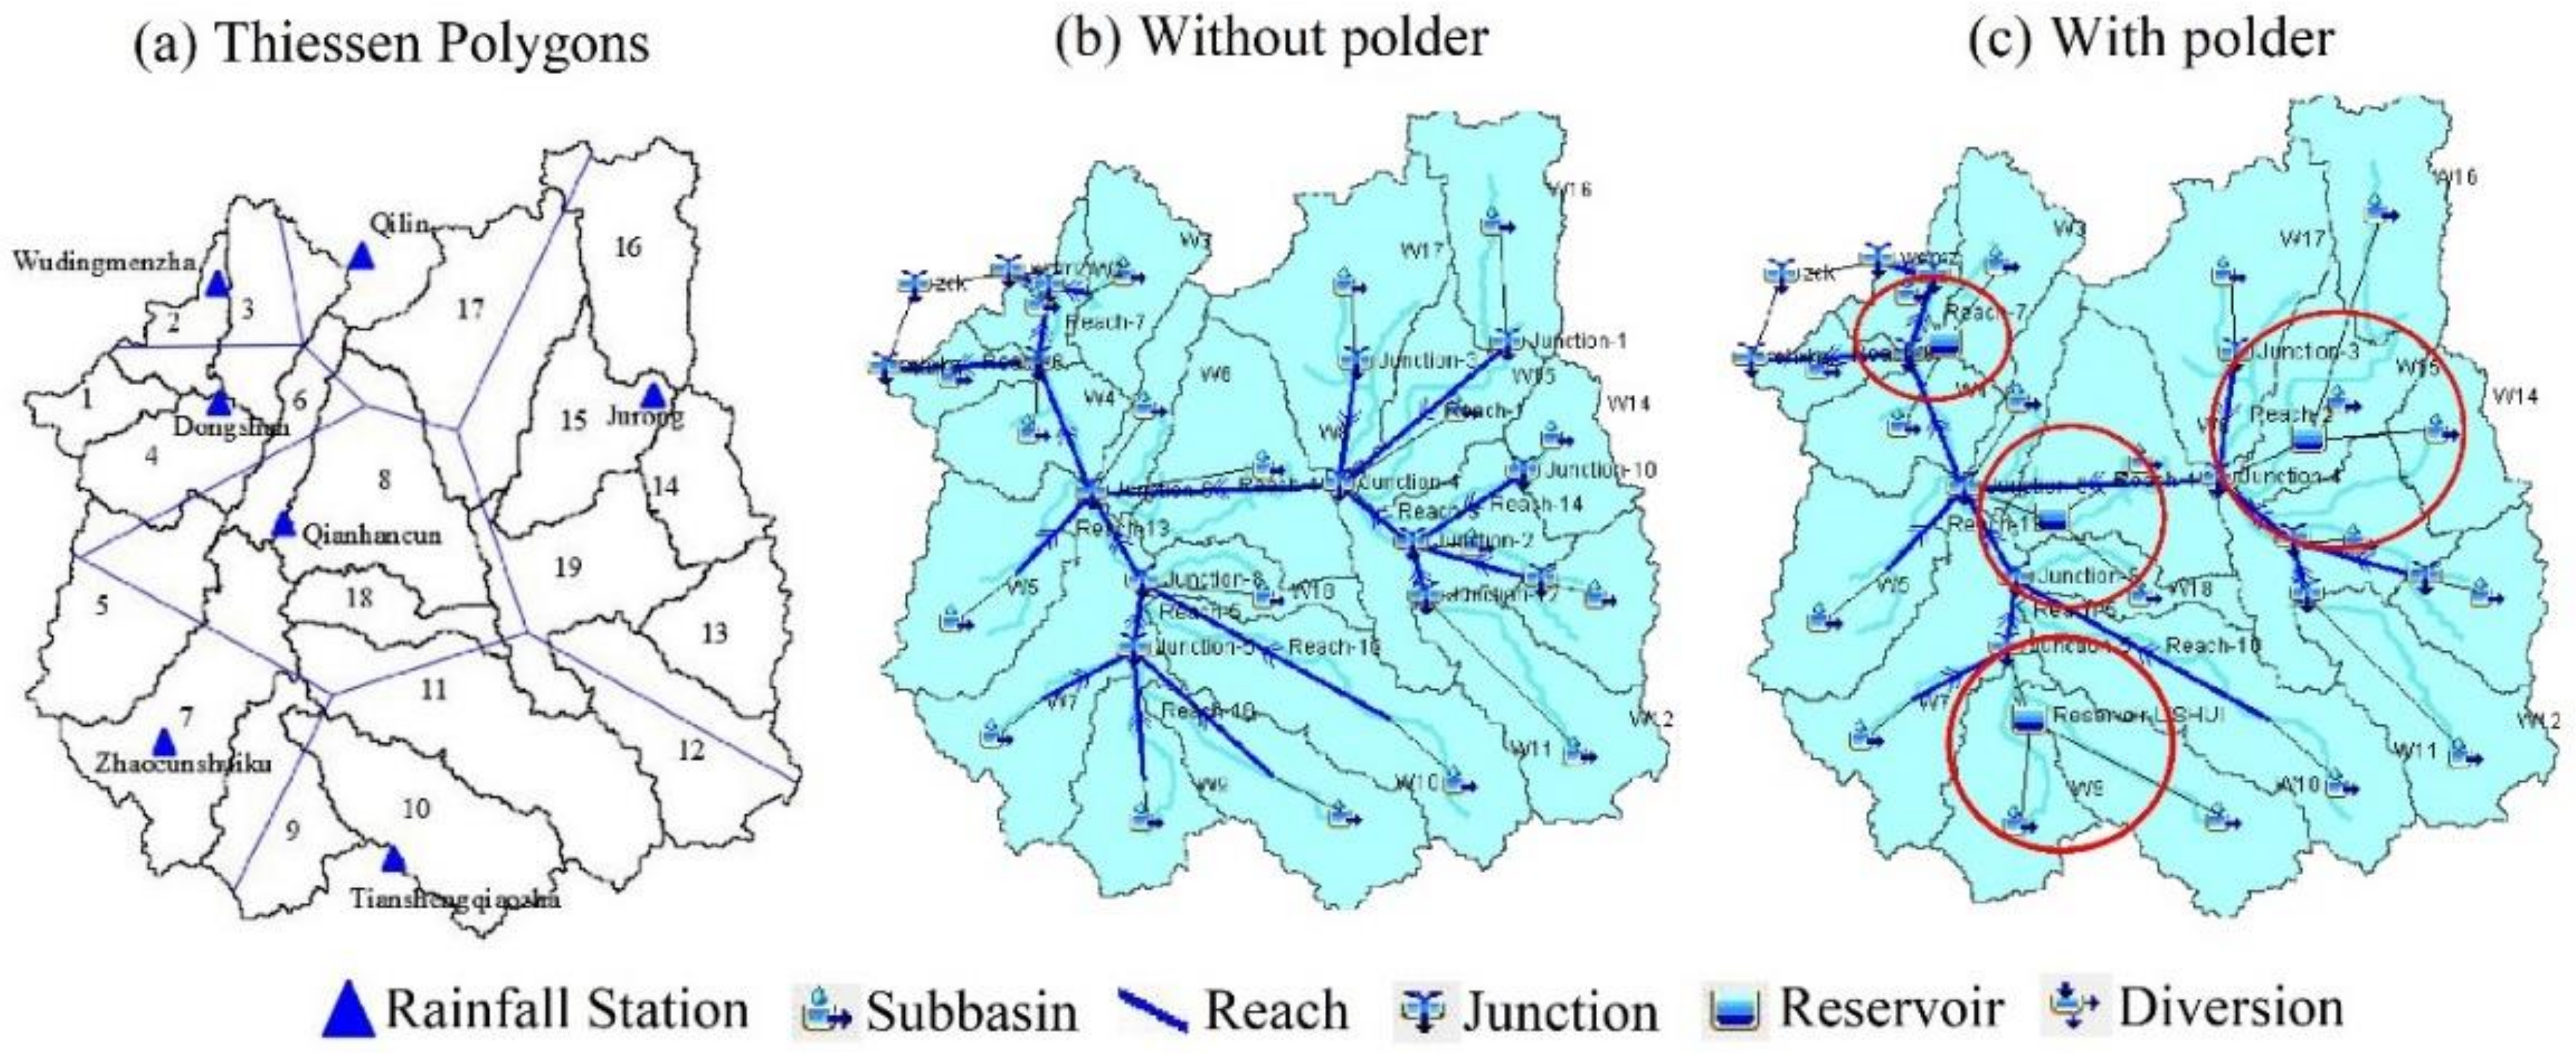
2.2. Description of Urban Agglomeration Polders
2.3. Model Setup
2.4. Calibration of HEC-HMS
3. Results and Discussion
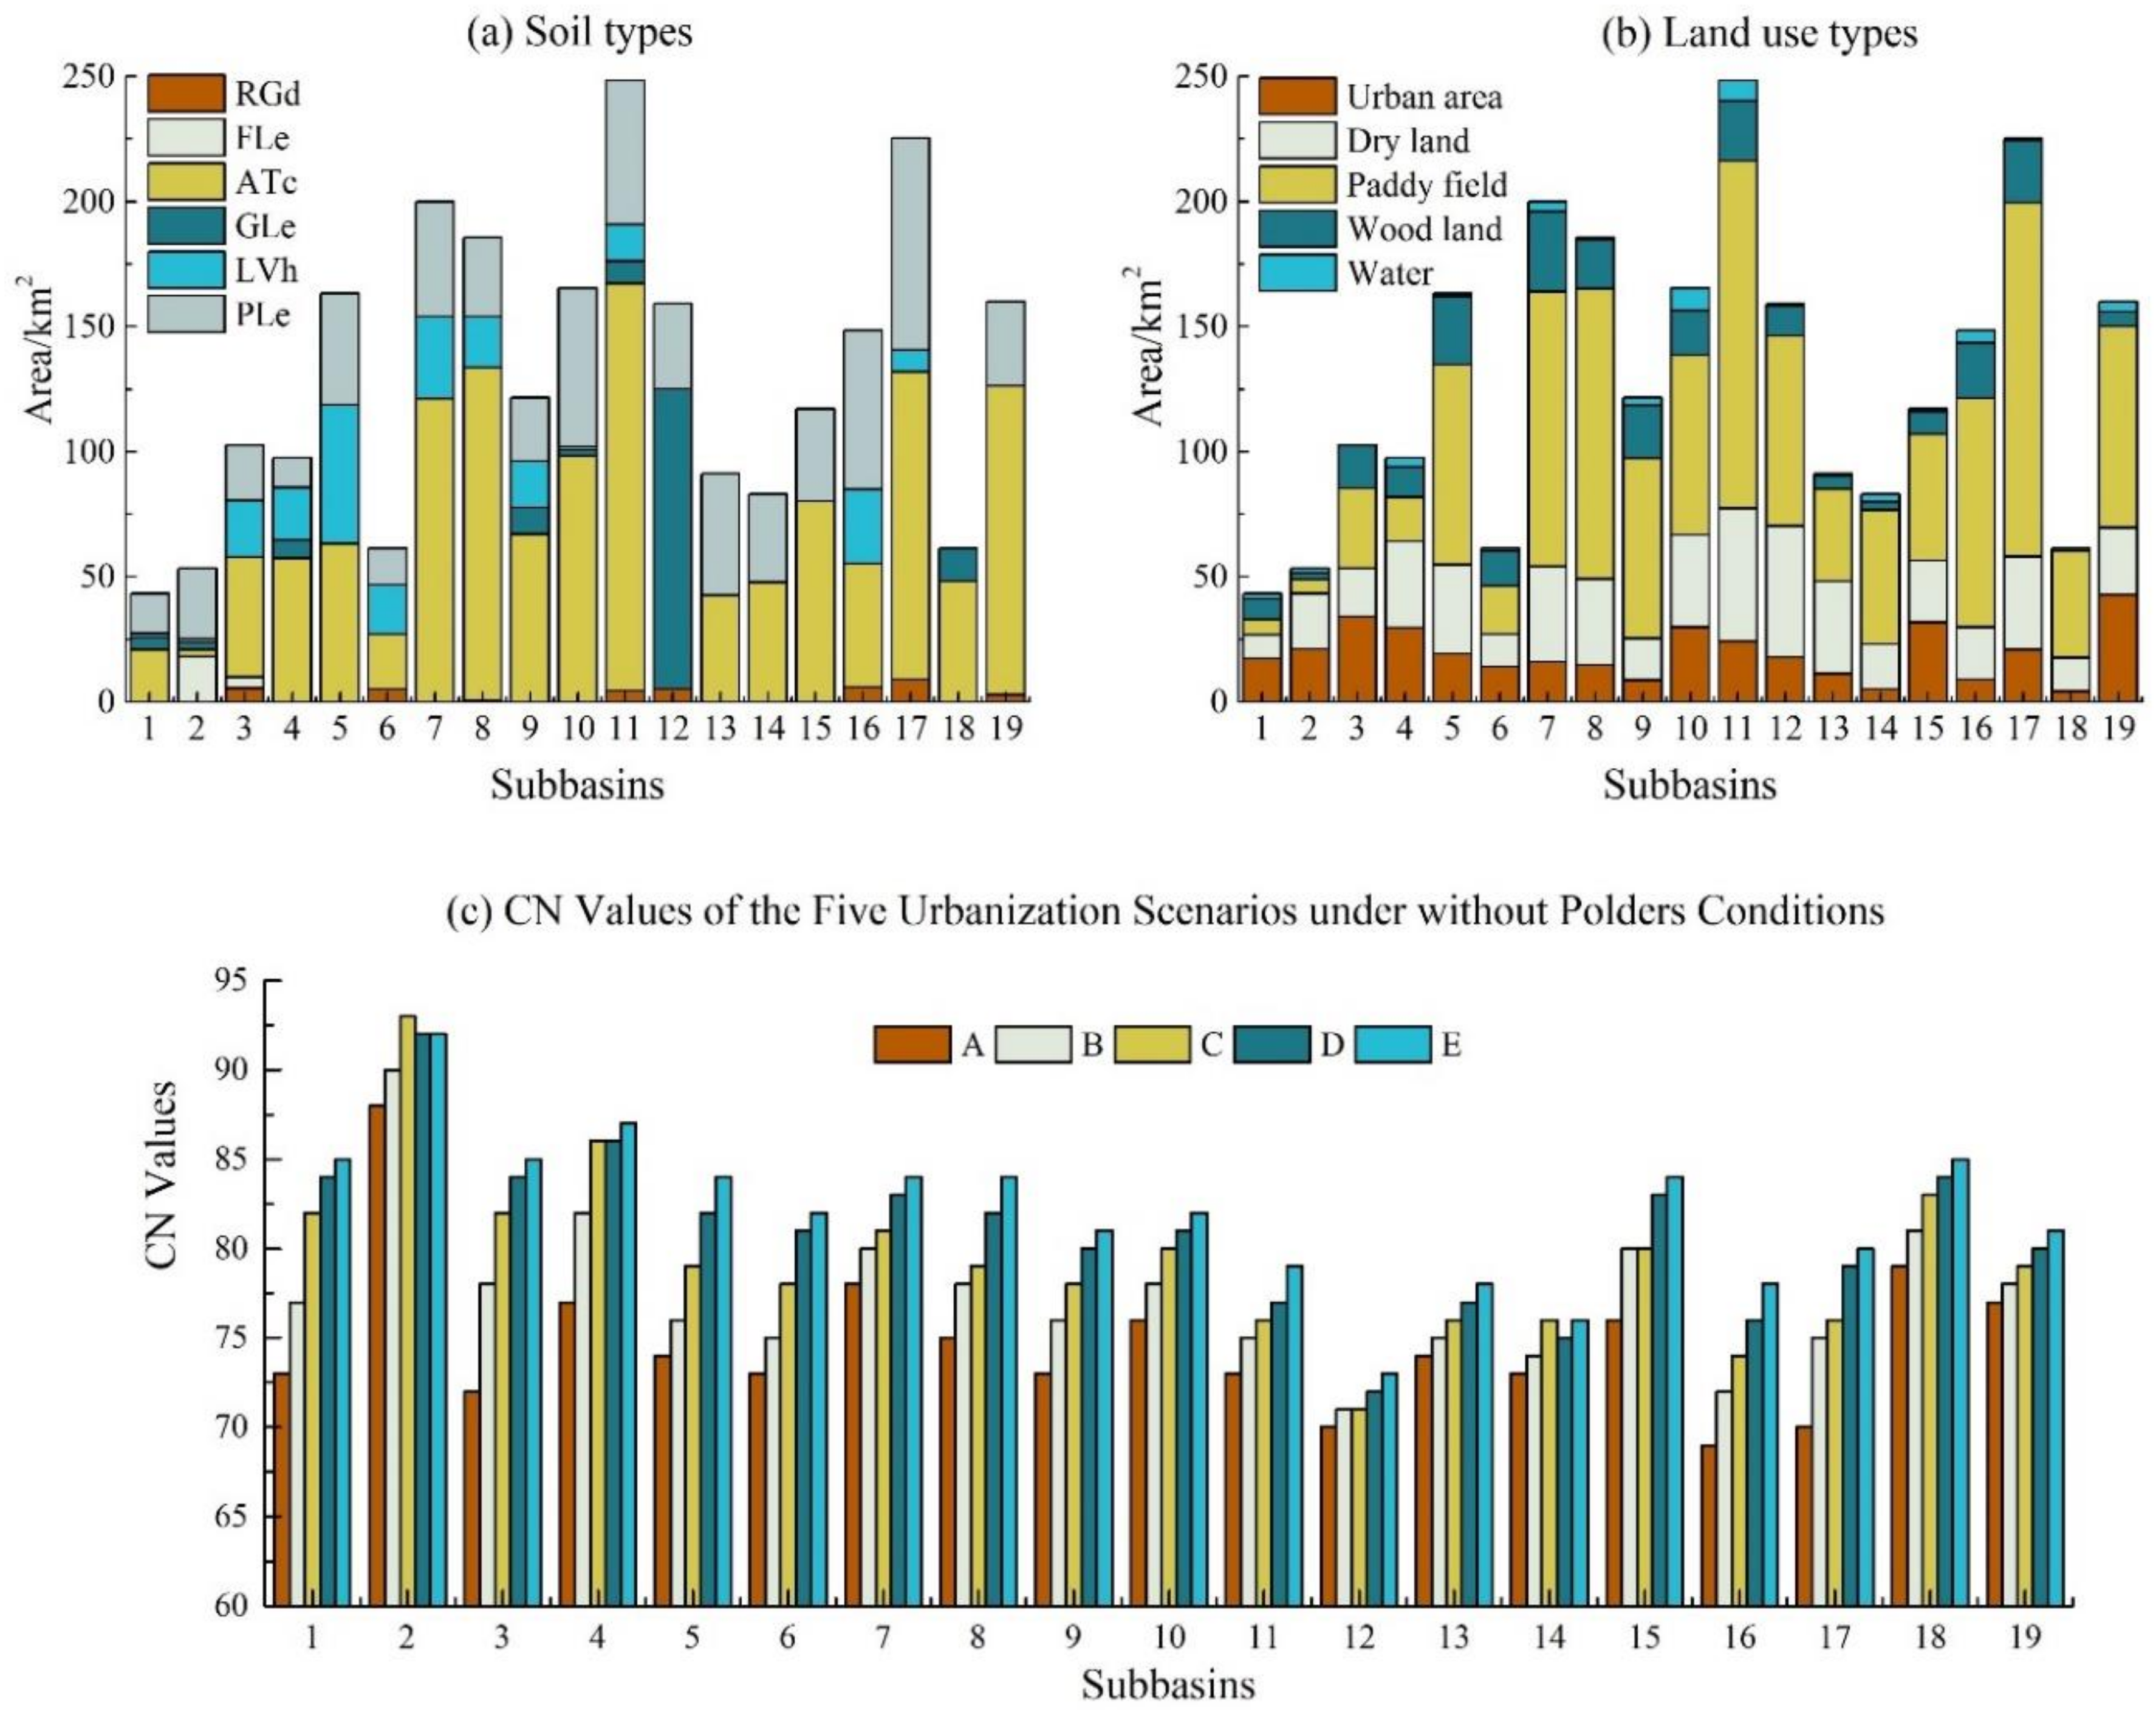
3.1. Determination of CN Value
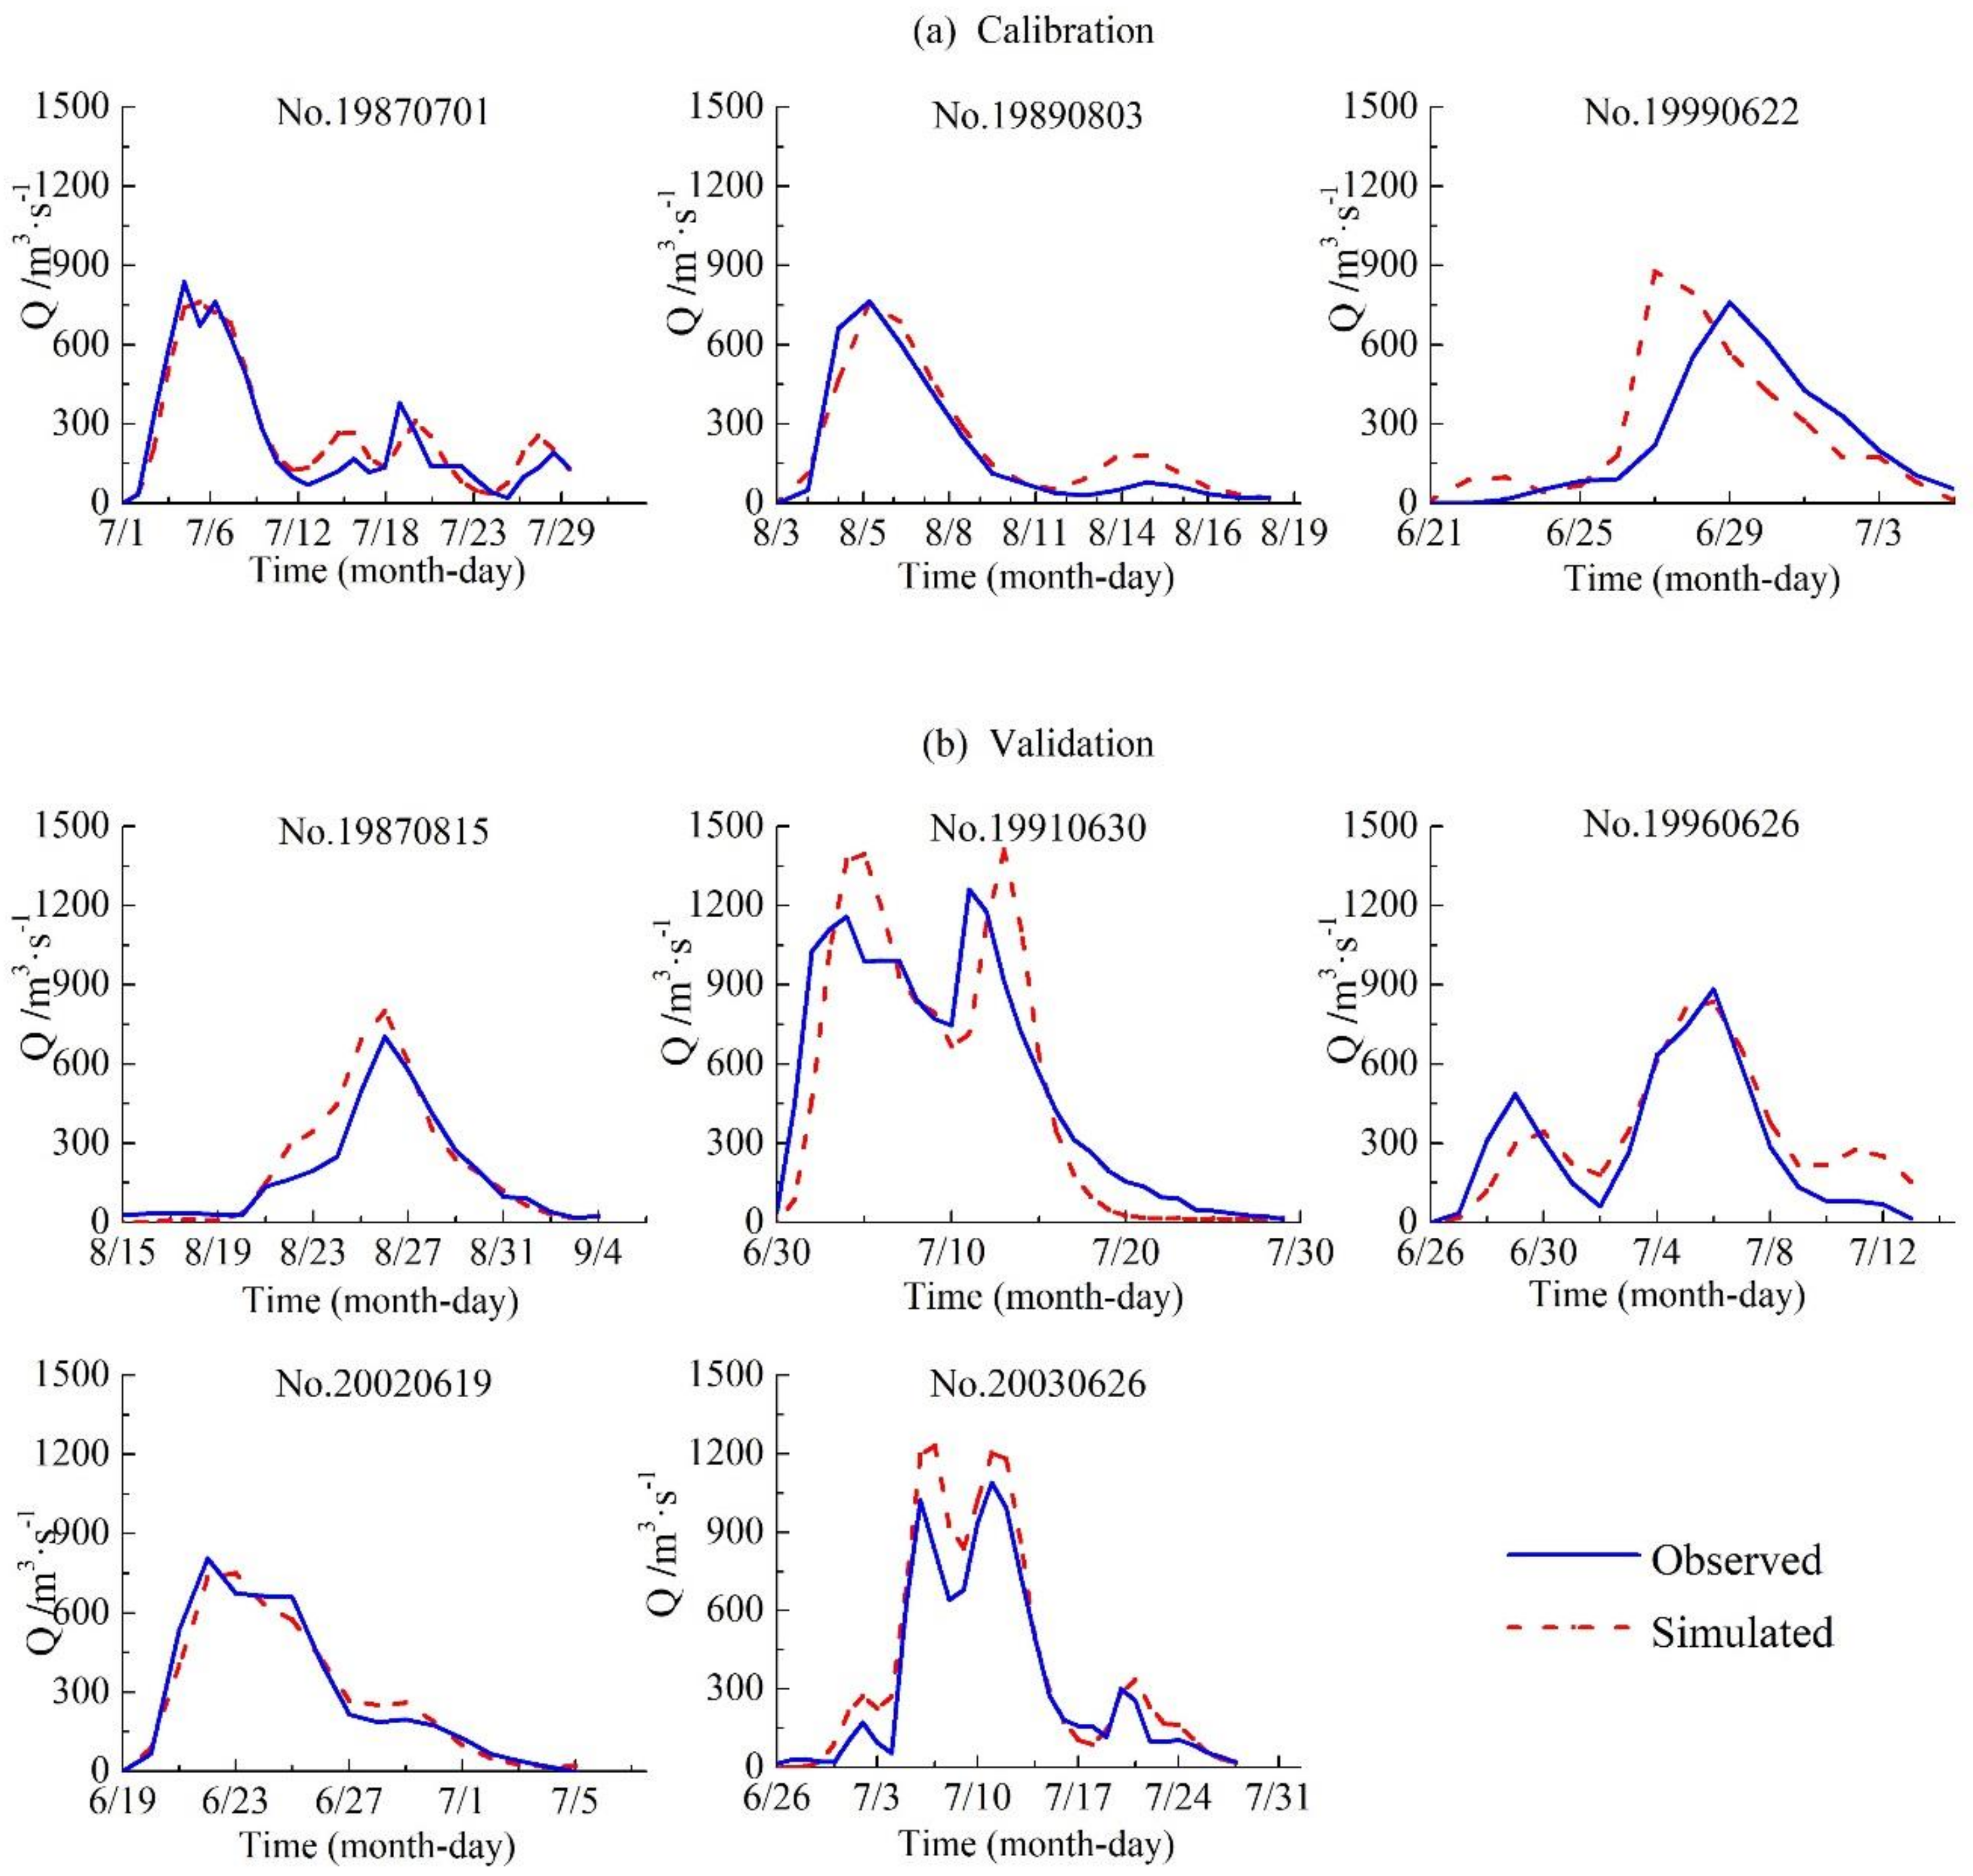
3.2. Calibration and Validation of HEC-HMS
3.3. Urbanization Scenarios
3.4. Determination of Flood Magnitude
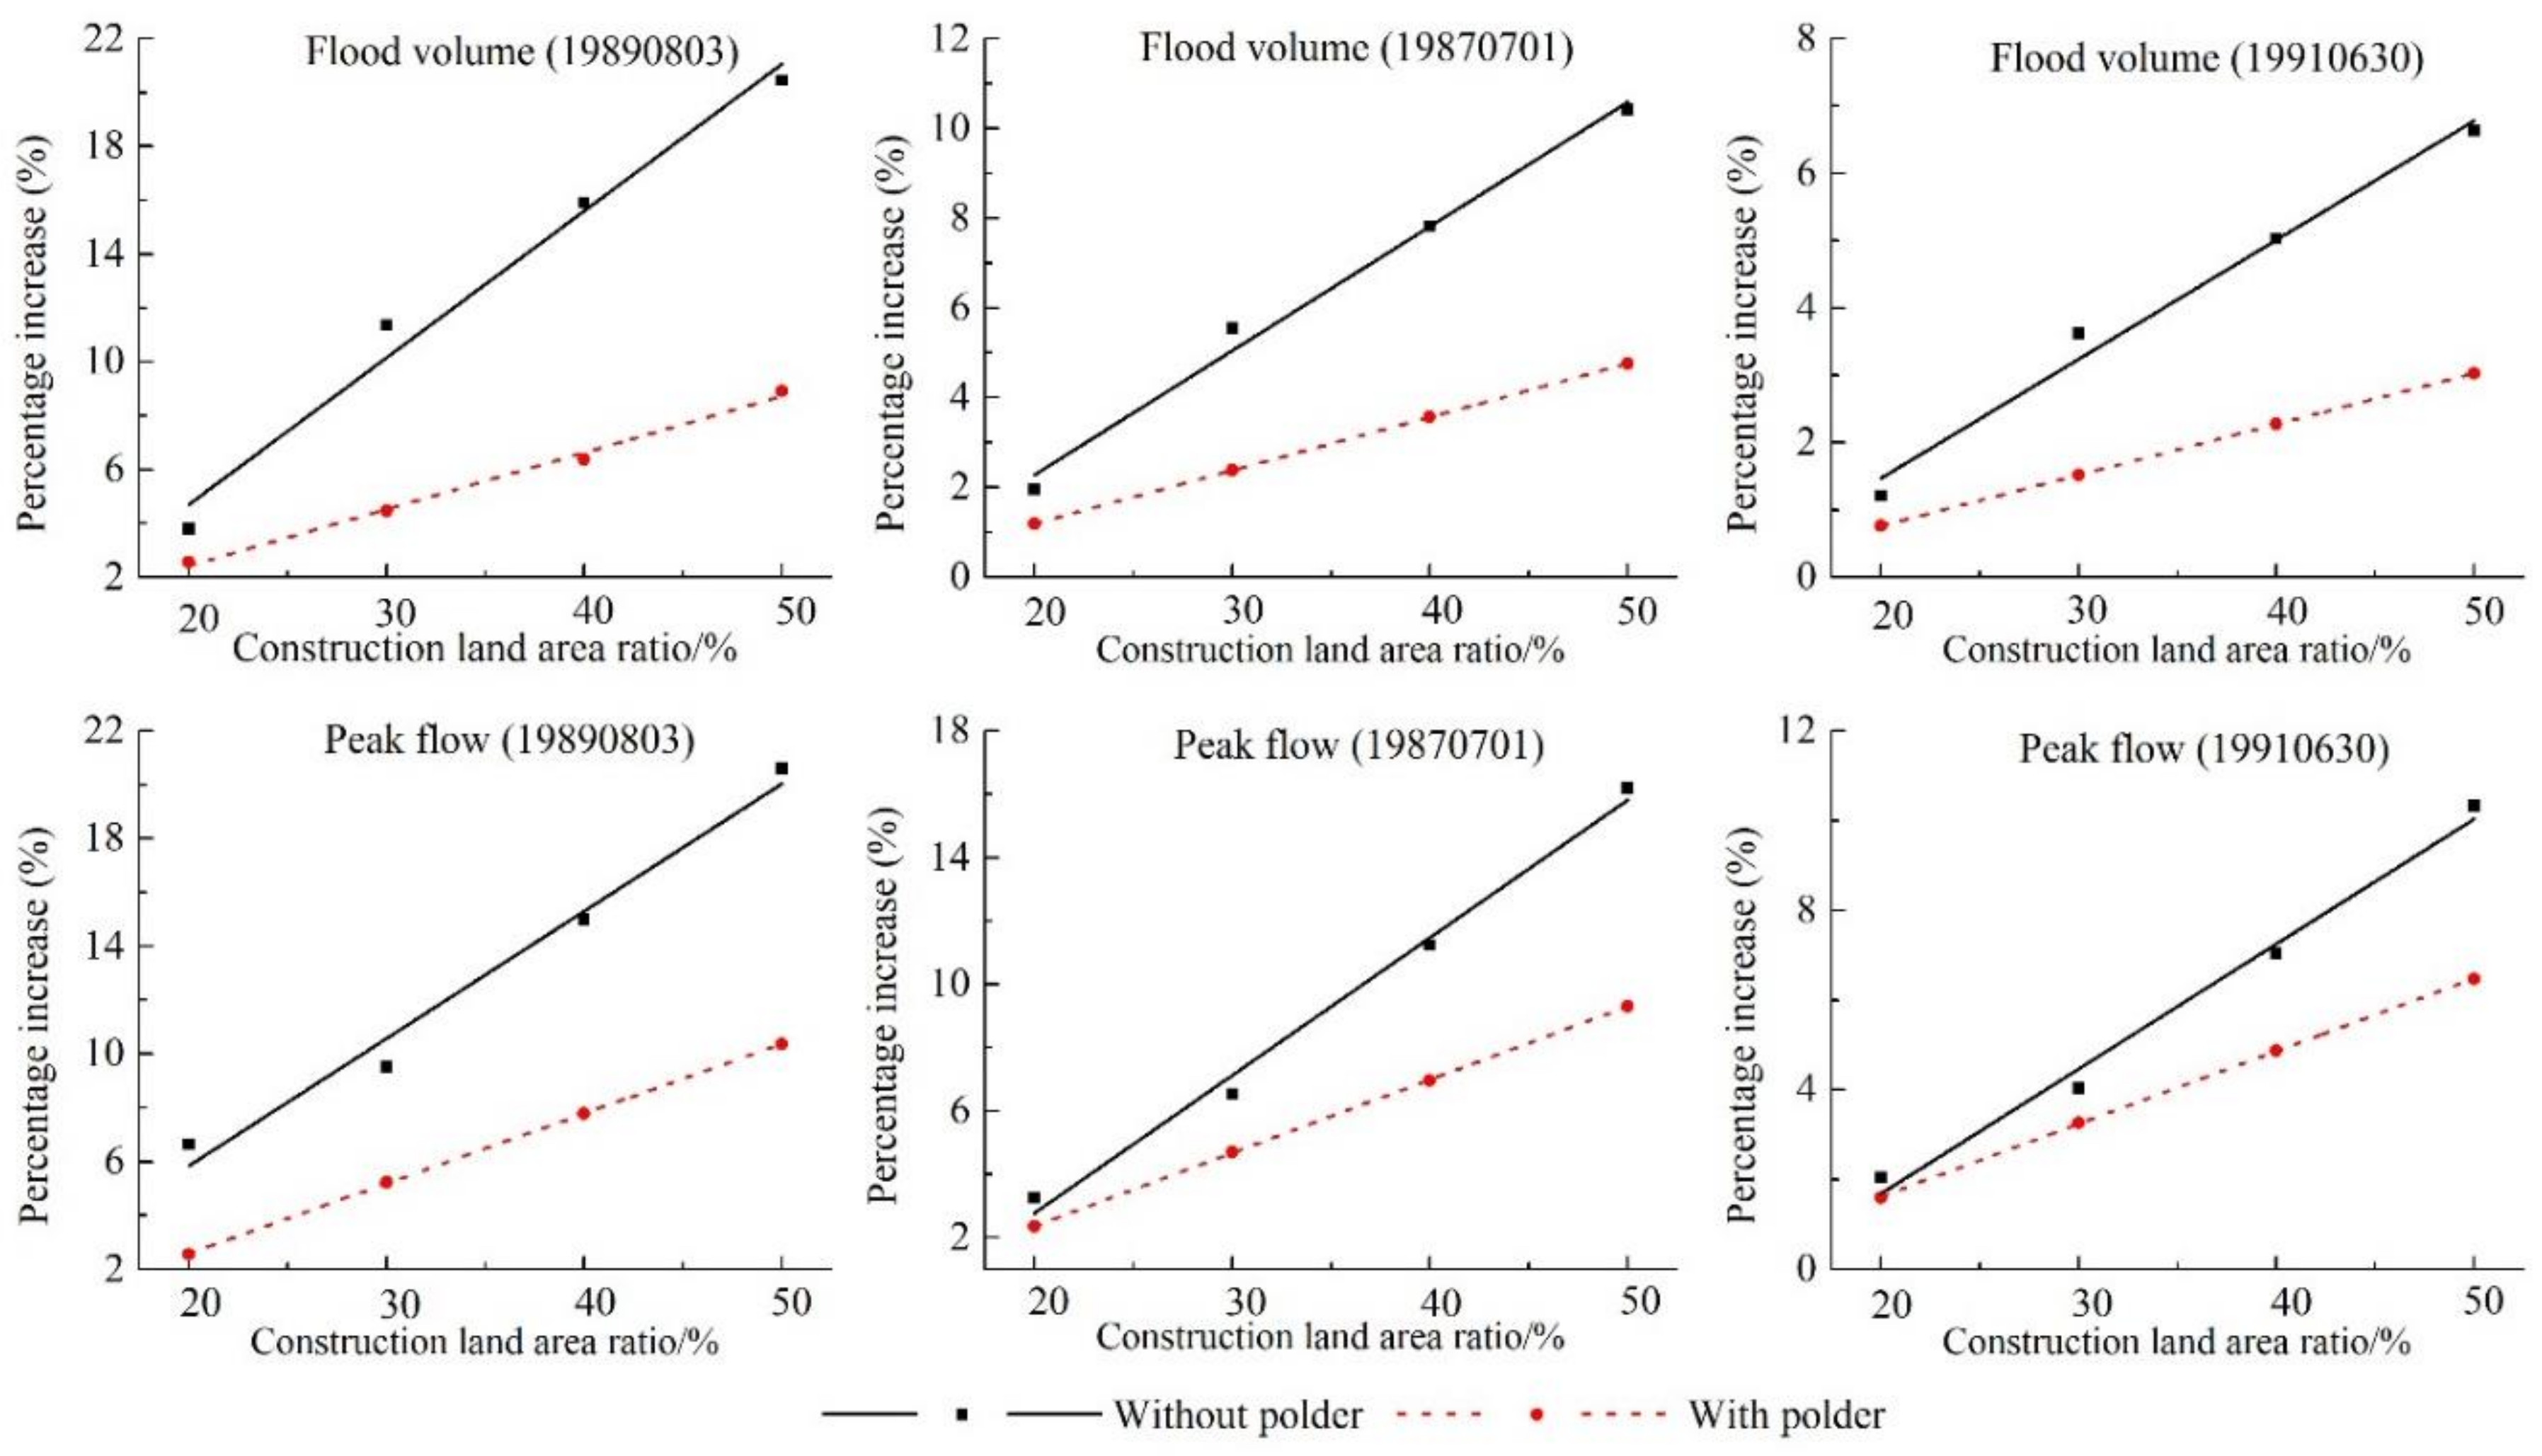
3.5. Hydrological Response to Urbanization of UAPFCP on Flood Events
3.6. Sensitivity of Flood Changes to Increasing Urbanization of UAPFCP
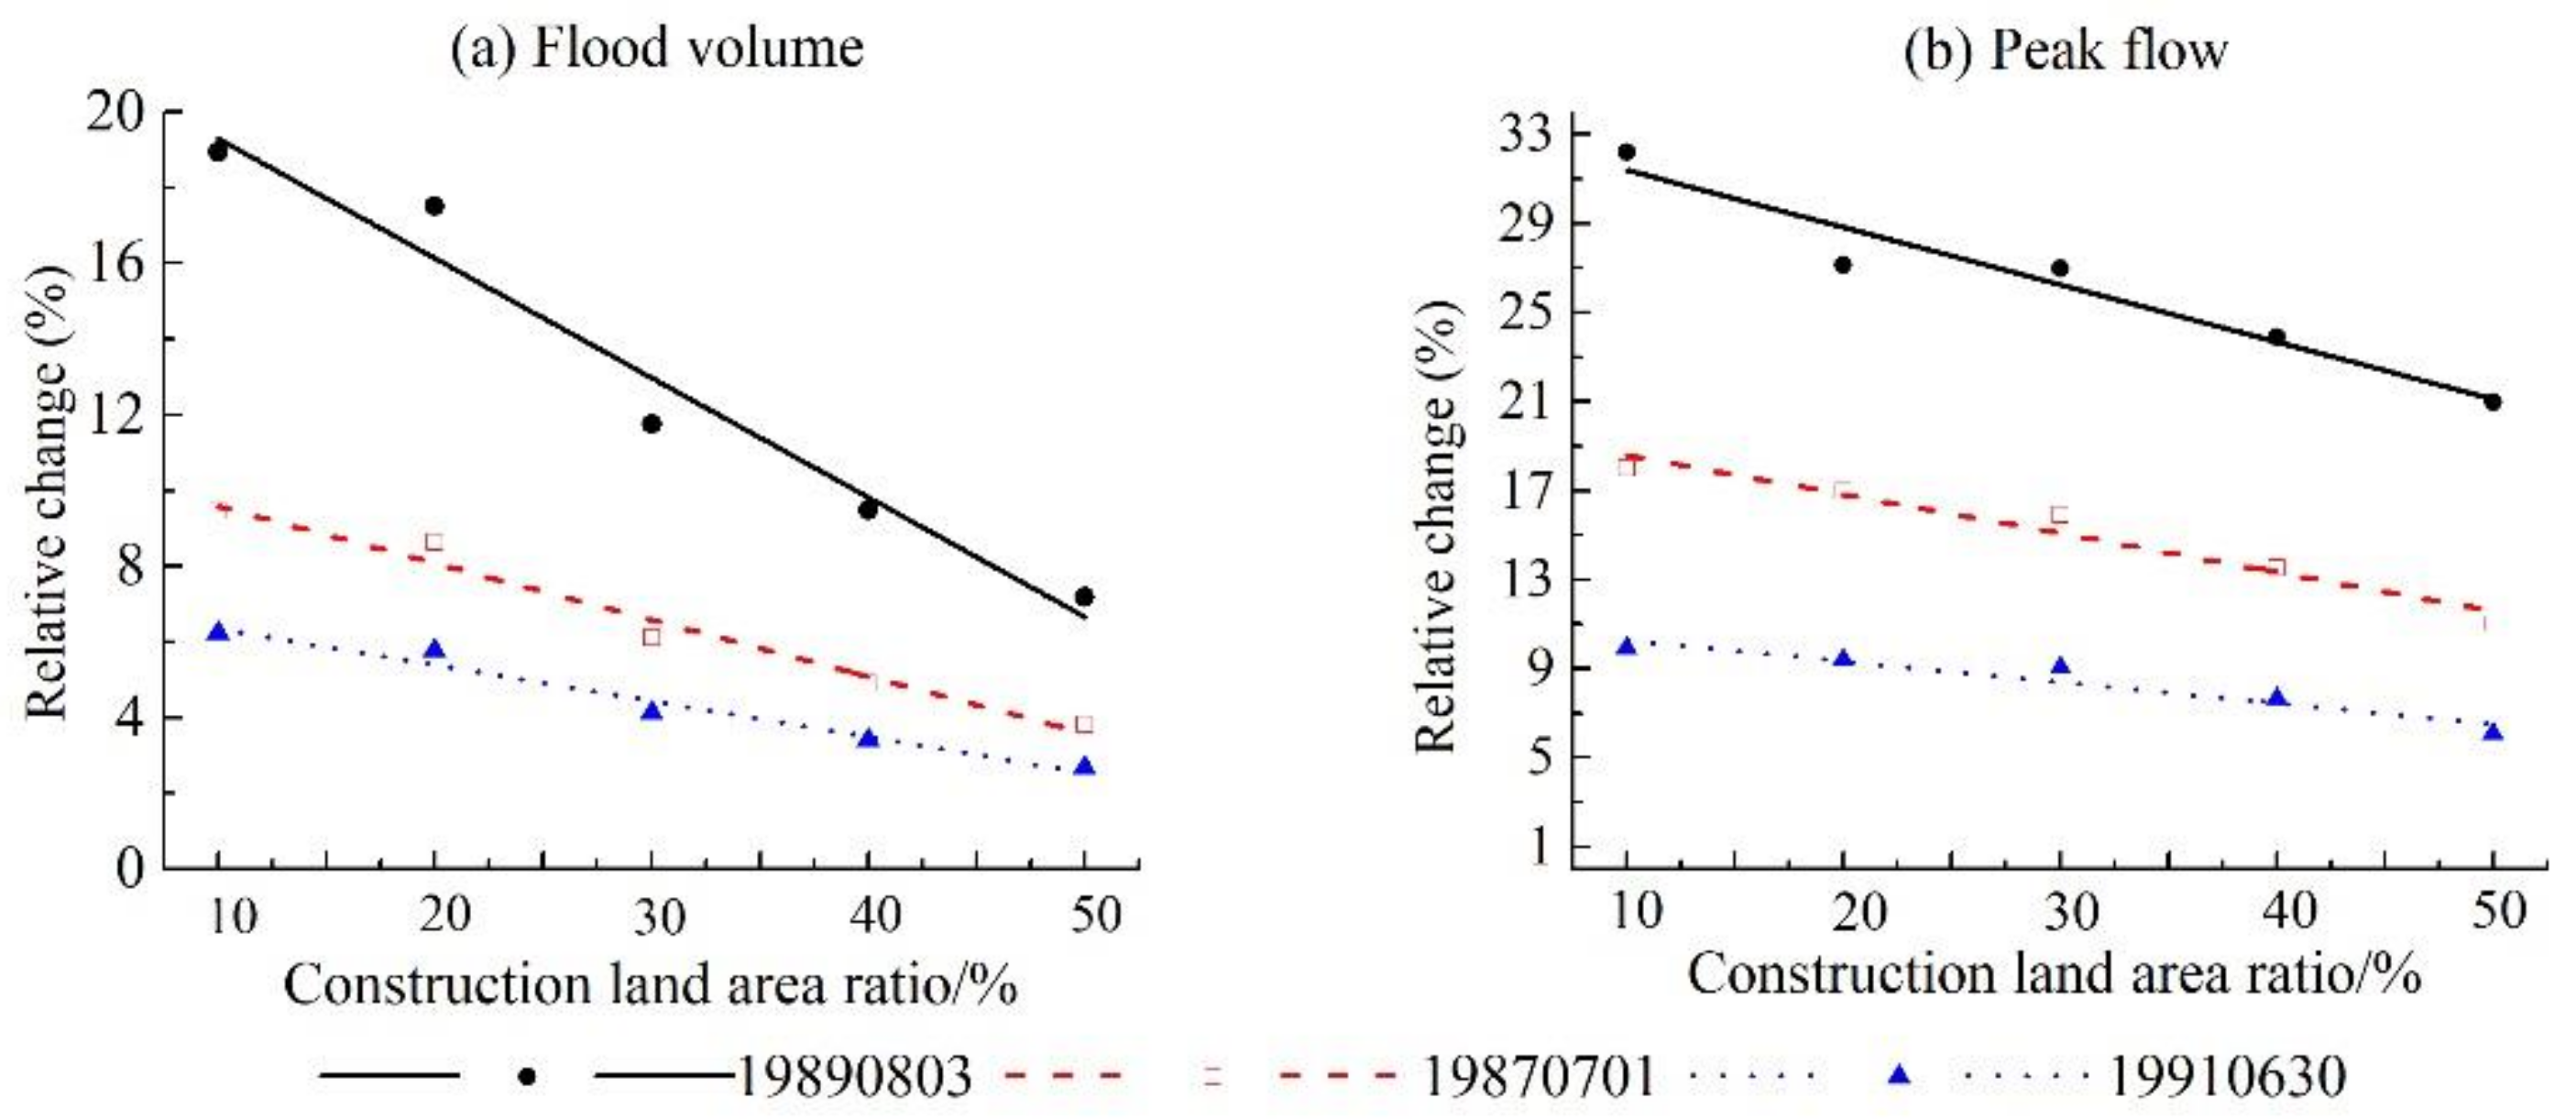
3.7. Interaction between Urbanization and Urban Agglomeration Polders on Flood Events
4. Summary and Conclusions
Author Contributions
Funding
Acknowledgments
Conflicts of Interest
References
- Ji, X.; Xu, Y.; Han, L.; Yang, L. Impacts of urbanization on river system structure: A case study on Qinhuai river basin, Yangtze river delta. Water Sci. Technol. J. Int. Assoc. Water Pollut. Res. 2014, 70, 671–677. [Google Scholar] [CrossRef] [PubMed]
- Ahn, G.-C. The Effect of Urbanization on the Hydrologic Regime of the Big Darby Creek Watershed; The Ohio State University: Columbus, OH, USA, 2007. [Google Scholar]
- Salvadore, E.; Bronders, J.; Batelaan, O. Hydrological modelling of urbanized catchments: A review and future directions. J. Hydrol. 2015, 529, 62–81. [Google Scholar] [CrossRef]
- Nirupama, N.; Simonovic, S.P. Increase of flood risk due to urbanisation: A Canadian example. Nat. Hazards 2007, 40, 25–41. [Google Scholar] [CrossRef]
- Beighley, R.E.; Melack, J.M.; Dunne, T. Impacts of California’s climatic regimes and coastal land use change on streamflow characteristics. J. Am. Water Resour. Assoc. 2003, 39, 1419–1433. [Google Scholar] [CrossRef]
- Zhou, F.; Xu, Y.; Chen, Y.; Xu, C.Y.; Gao, Y.; Du, J. Hydrological response to urbanization at different spatio-temporal scales simulated by coupling of clue-s and the swat model in the Yangtze river delta region. J. Hydrol. 2013, 485, 113–125. [Google Scholar] [CrossRef]
- Remondi, F.; Burlando, P.; Vollmer, D. Exploring the hydrological impact of increasing urbanisation on a tropical river catchment of the metropolitan Jakarta, Indonesia. Sustain. Cities Soc. 2016, 20, 210–221. [Google Scholar] [CrossRef]
- Gao, Y.; Yuan, Y.; Wang, H.; Schmidt, A.R.; Wang, K.; Ye, L. Examining the effects of urban agglomeration polders on flood events in Qinhuai river basin, china with HEC-HMS model. Water Sci. Technol. 2017, 75, 2130–2138. [Google Scholar] [CrossRef] [PubMed]
- Meenu, R.; Rehana, S.; Mujumdar, P.P. Assessment of hydrologic impacts of climate change in Tunga-Bhadra basin, India with HEC-HMS and SDSM. Hydrol. Process. 2013, 27, 1572–1589. [Google Scholar] [CrossRef]
- Yuan, Y.; Gao, Y.; Wu, X. Flood simulation of flood control model for polder type based on HEC_HMS hydrological model in Qinhuai river basin. J. China Three Gorges Univ. (Nat. Sci.) 2015, 37, 34–39. [Google Scholar]
- Zhao, G.; Hörmann, G.; Fohrer, N.; Gao, J.; Li, H.; Tian, P. Application of a simple raster-based hydrological model for streamflow prediction in a humid catchment with polder systems. Water Resour. Manag. 2011, 25, 661–676. [Google Scholar] [CrossRef]
- Ren, L.; Liu, X.; Fei, Y.; Jing, X.; Wei, L. Quantitative analysis of runoff reduction in the Laohahe basin. Hydrol. Res. 2012, 43, 38–47. [Google Scholar] [CrossRef]
- Zhang, S.; Hou, L.; Wei, C.; Zhou, X.; Wei, N. Study on water quantity and quality-integrated evaluation based on the natural-social dualistic water cycle. Pol. J. Environ. Stud. 2015, 24, 829–840. [Google Scholar] [CrossRef]
- Suriya, S.; Mudgal, B.V. Impact of urbanization on flooding: The Thirusoolam sub watershed—A case study. J. Hydrol. 2012, 412, 210–219. [Google Scholar]
- Du, J.; Li, Q.; Rui, H.; Zuo, T.; Zheng, D.; Xu, Y.; Xu, C.Y. Assessing the effects of urbanization on annual runoff and flood events using an integrated hydrological modeling system for Qinhuai River basin, China. J. Hydrol. 2012, 464–465, 127–139. [Google Scholar] [CrossRef]
- Yong, B.; Zhang, W.; Zhao, D.; Zhu, Q. Application of hydrological modeling system HEC-HMS to Baohe catchment of Hanjiang basin. Bull. Soil Water Conserv. 2006, 26, 86–90. [Google Scholar]
- Halwatura, D.; Najim, M. Application of the HEC-HMS model for runoff simulation in a tropical catchment. Environ. Model. Softw. 2013, 46, 155–162. [Google Scholar] [CrossRef]
- Fu, S.; Wang, X.; Wang, H.; Wei, X.; Yuan, A. Meathod of determining CN value in the SCS-CN method. Arid Land Geogr. 2012, 35, 415–421. [Google Scholar]
- Xu, Y. The Effects of Urbanization on Water System and Hydrological Process in the Yangtze River Delta; Science Press: Beijing, China, 2012. [Google Scholar]
- Rui, H. Land Use Changes and Its Hydrological Responses in the Qinhuai River Basin; Nanjing University: Nanjing, China, 2012. [Google Scholar]
- Che, Z. Discussing the empirical formula and graph of soil permeability coefficient. Water Resour. Hydropower Northeast China 1995, 9, 17–19. [Google Scholar]
- Liang, R. Application of HEC-HMS in the Beizhangdian Watershed; Tai Yuan University of Technology: Tai Yuan, China, 2012. [Google Scholar]
- Li, Q. Changing of Spatial Pattern and the Hydrological Response of Urbanization in Qinhuai River Basin; Nanjing University: Nanjing, China, 2012. [Google Scholar]
- Nash, J.E.; Sutcliffe, J.V. River flow forecasting through conceptual models part I—A discussion of principles. J. Hydrol. 1970, 10, 282–290. [Google Scholar] [CrossRef]
- Balistrocchi, M.; Orlandini, S.; Ranzi, R.; Bacchi, B. Copula-based modeling of flood control reservoirs. Water Resour. Res. 2018, 53, 9883–9900. [Google Scholar]
- Bhaduri, B.; Minner, M.; Tatalovich, S.; Harbor, J. Long-term hydrologic impact of urbanization: A tale of two models. J. Water Resour. Plan. Manag. 2001, 127, 13–19. [Google Scholar]
- Calhoun, D.L.; Frick, E.A.; Buell, G.R. Effects of Urban Development on Nutrient Loads and Streamflow, Upper Chattahoochee River Basin, Georgia, 1976–2001; Georgia Institute of Technology: Atlanta, GA, USA, 2003. [Google Scholar]
- Choi, W.; Deal, B.M. Assessing hydrological impact of potential land use change through hydrological and land use change modeling for the Kishwaukee river basin (USA). J. Environ. Manag. 2008, 88, 1119–1130. [Google Scholar] [CrossRef] [PubMed]
- Brun, S.E.; Band, L.E. Simulating runoff behavior in an urbanizing watershed. Comput. Environ. Urban Syst. 2000, 24, 5–22. [Google Scholar] [CrossRef]
- Wissmar, R.C.; Timm, R.K.; Logsdon, M.G. Effects of changing forest and impervious land covers on discharge characteristics of watersheds. Environ. Manag. 2004, 34, 91–98. [Google Scholar] [CrossRef] [PubMed]


| Data Types | Time | Sources |
|---|---|---|
| Daily rainfall | 1986–2015 | China Meteorological Data Sharing Service System |
| Daily discharge | 1986–2015 | China Meteorological Data Sharing Service System |
| Soil data | 2009 | Harmonized World Soil Database |
| Land use data | 1988, 1994, 2002, 2016 | European Space Agency GlobCover |
| Digital Elevation Model | 2009 | Shuttle Radar Topography Mission |
| Soil Type | RGd | FLe | ATc | GLe | LVh | PLe |
|---|---|---|---|---|---|---|
| Hydrological unit | A | C | A | A | A | C |
| Land Use Types | Hydrological Units | |
|---|---|---|
| A | C | |
| Urban land | 69 | 86 |
| Dry land | 65 | 81 |
| Paddy field | 62 | 78 |
| Wood land | 25 | 70 |
| Water | 92 | 92 |
| Period | Flood No. | Dv (%) | Dp (%) | NSE | R |
|---|---|---|---|---|---|
| Calibration | 19870701 | 19.43 | 2.05 | 0.871 | 0.960 |
| 19890803 | 18.94 | 7.03 | 0.900 | 0.970 | |
| 19990622 | 1.49 | −2.05 | 0.908 | 0.950 | |
| Mean value | - | 13.29 | 2.34 | 0.890 | 0.960 |
| Validation | 19870815 | 15.24 | 13.62 | 0.837 | 0.960 |
| 19910630 | −6.51 | 16.00 | 0.892 | 0.970 | |
| 19960626 | 14.26 | −5.56 | 0.813 | 0.920 | |
| 20020619 | −1.36 | −6.99 | 0.959 | 0.980 | |
| 20030626 | 19.86 | 15.00 | 0.870 | 0.980 | |
| Mean value | - | 8.30 | 6.42 | 0.870 | 0.960 |
| Sub basin | Reach | |||||
|---|---|---|---|---|---|---|
| No. | Lag Time (min) | Threshold Ratio to Peak | Recession Constant | No. | K (h) | X |
| W1 | 2542 | 0.10 | 0.01 | R1 | 4.34 | 0.50 |
| W2 | 2531 | 0.10 | 0.01 | R2 | 4.02 | 0.28 |
| W3 | 2533 | 0.90 | 0.01 | R3 | 0.91 | 0.29 |
| W4 | 2536 | 0.90 | 0.01 | R4 | 4.79 | 0.50 |
| W5 | 2625 | 0.10 | 0.01 | R5 | 3.39 | 0.05 |
| W6 | 2645 | 0.10 | 0.01 | R6 | 1.71 | 0.01 |
| W7 | 2813 | 0.10 | 0.01 | R7 | 1.71 | 0.29 |
| W8 | 2625 | 0.90 | 0.60 | R8 | 2.85 | 0.02 |
| W9 | 2843 | 0.90 | 0.88 | R9 | 1.60 | 0.05 |
| W10 | 2813 | 0.10 | 0.01 | R10 | 5.68 | 0.10 |
| W11 | 3000 | 0.95 | 0.01 | R11 | 0.86 | 0.01 |
| W12 | 3100 | 0.10 | 0.01 | R12 | 2.60 | 0.19 |
| W13 | 3000 | 0.10 | 0.01 | R13 | 4.00 | 0.06 |
| W14 | 3100 | 0.10 | 0.01 | R14 | 2.17 | 0.29 |
| W15 | 3000 | 0.95 | 0.99 | R15 | 2.17 | 0.20 |
| W16 | 3000 | 0.90 | 1.00 | R16 | 0.91 | 0.29 |
| W17 | 3000 | 0.95 | 0.88 | R17 | 3.88 | 0.07 |
| W18 | 2625 | 0.10 | 0.01 | R18 | 2.99 | 0.13 |
| W19 | 3000 | 0.10 | 0.01 | R19 | 3.63 | 0.07 |
| Flood No. | Scenarios | Without Polder | With Polder | Increase Rate Compared with Scenario A under the without Polder Condition (%) | Increase Rate Compared with Scenario A under the with Polder Condition (%) | Relative Change between with and without Polder Conditions (%) | |||||
|---|---|---|---|---|---|---|---|---|---|---|---|
| Qv (mm) | Qp (m3·s−1) | Qv (mm) | Qp (m3·s−1) | Qv | Qp | Qv | Qp | Qv | Qp | ||
| 19890803 | A | 132 | 767 | 157 | 1014 | 18.94 | 32.20 | ||||
| B | 137 | 818 | 161 | 1040 | 3.79 | 6.65 | 2.55 | 2.56 | 17.52 | 27.14 | |
| C | 147 | 840 | 164 | 1067 | 11.36 | 9.52 | 4.46 | 5.23 | 11.76 | 26.98 | |
| D | 153 | 882 | 167 | 1093 | 15.91 | 14.99 | 6.37 | 7.79 | 9.47 | 23.89 | |
| E | 159 | 925 | 171 | 1119 | 20.45 | 20.60 | 8.92 | 10.36 | 7.18 | 20.96 | |
| 19870701 | A | 307 | 828 | 336 | 977 | 9.45 | 18.00 | ||||
| B | 313 | 855 | 340 | 1000 | 1.95 | 3.26 | 1.19 | 2.35 | 8.63 | 16.96 | |
| C | 324 | 882 | 344 | 1023 | 5.54 | 6.52 | 2.38 | 4.71 | 6.11 | 15.92 | |
| D | 331 | 921 | 348 | 1045 | 7.82 | 11.23 | 3.57 | 6.96 | 4.90 | 13.51 | |
| E | 339 | 962 | 352 | 1068 | 10.42 | 16.18 | 4.76 | 9.31 | 3.83 | 11.00 | |
| 19910630 | A | 497 | 1365 | 528 | 1500 | 6.24 | 9.89 | ||||
| B | 503 | 1393 | 532 | 1524 | 1.21 | 2.05 | 0.76 | 1.60 | 5.77 | 9.40 | |
| C | 515 | 1420 | 536 | 1549 | 3.62 | 4.03 | 1.52 | 3.27 | 4.14 | 9.04 | |
| D | 522 | 1461 | 540 | 1573 | 5.03 | 7.03 | 2.27 | 4.87 | 3.40 | 7.63 | |
| E | 530 | 1506 | 544 | 1597 | 6.64 | 10.33 | 3.03 | 6.47 | 2.68 | 6.07 | |
© 2018 by the authors. Licensee MDPI, Basel, Switzerland. This article is an open access article distributed under the terms and conditions of the Creative Commons Attribution (CC BY) license (http://creativecommons.org/licenses/by/4.0/).
Share and Cite
Fang, G.; Yuan, Y.; Gao, Y.; Huang, X.; Guo, Y. Assessing the Effects of Urbanization on Flood Events with Urban Agglomeration Polders Type of Flood Control Pattern Using the HEC-HMS Model in the Qinhuai River Basin, China. Water 2018, 10, 1003. https://doi.org/10.3390/w10081003
Fang G, Yuan Y, Gao Y, Huang X, Guo Y. Assessing the Effects of Urbanization on Flood Events with Urban Agglomeration Polders Type of Flood Control Pattern Using the HEC-HMS Model in the Qinhuai River Basin, China. Water. 2018; 10(8):1003. https://doi.org/10.3390/w10081003
Chicago/Turabian StyleFang, Guohua, Yu Yuan, Yuqin Gao, Xianfeng Huang, and Yuxue Guo. 2018. "Assessing the Effects of Urbanization on Flood Events with Urban Agglomeration Polders Type of Flood Control Pattern Using the HEC-HMS Model in the Qinhuai River Basin, China" Water 10, no. 8: 1003. https://doi.org/10.3390/w10081003
APA StyleFang, G., Yuan, Y., Gao, Y., Huang, X., & Guo, Y. (2018). Assessing the Effects of Urbanization on Flood Events with Urban Agglomeration Polders Type of Flood Control Pattern Using the HEC-HMS Model in the Qinhuai River Basin, China. Water, 10(8), 1003. https://doi.org/10.3390/w10081003