A Coupled Model for Simulating Water and Heat Transfer in Soil-Plant-Atmosphere Continuum with Crop Growth
Abstract
:1. Introduction
2. Model Conceptualization and Formulation
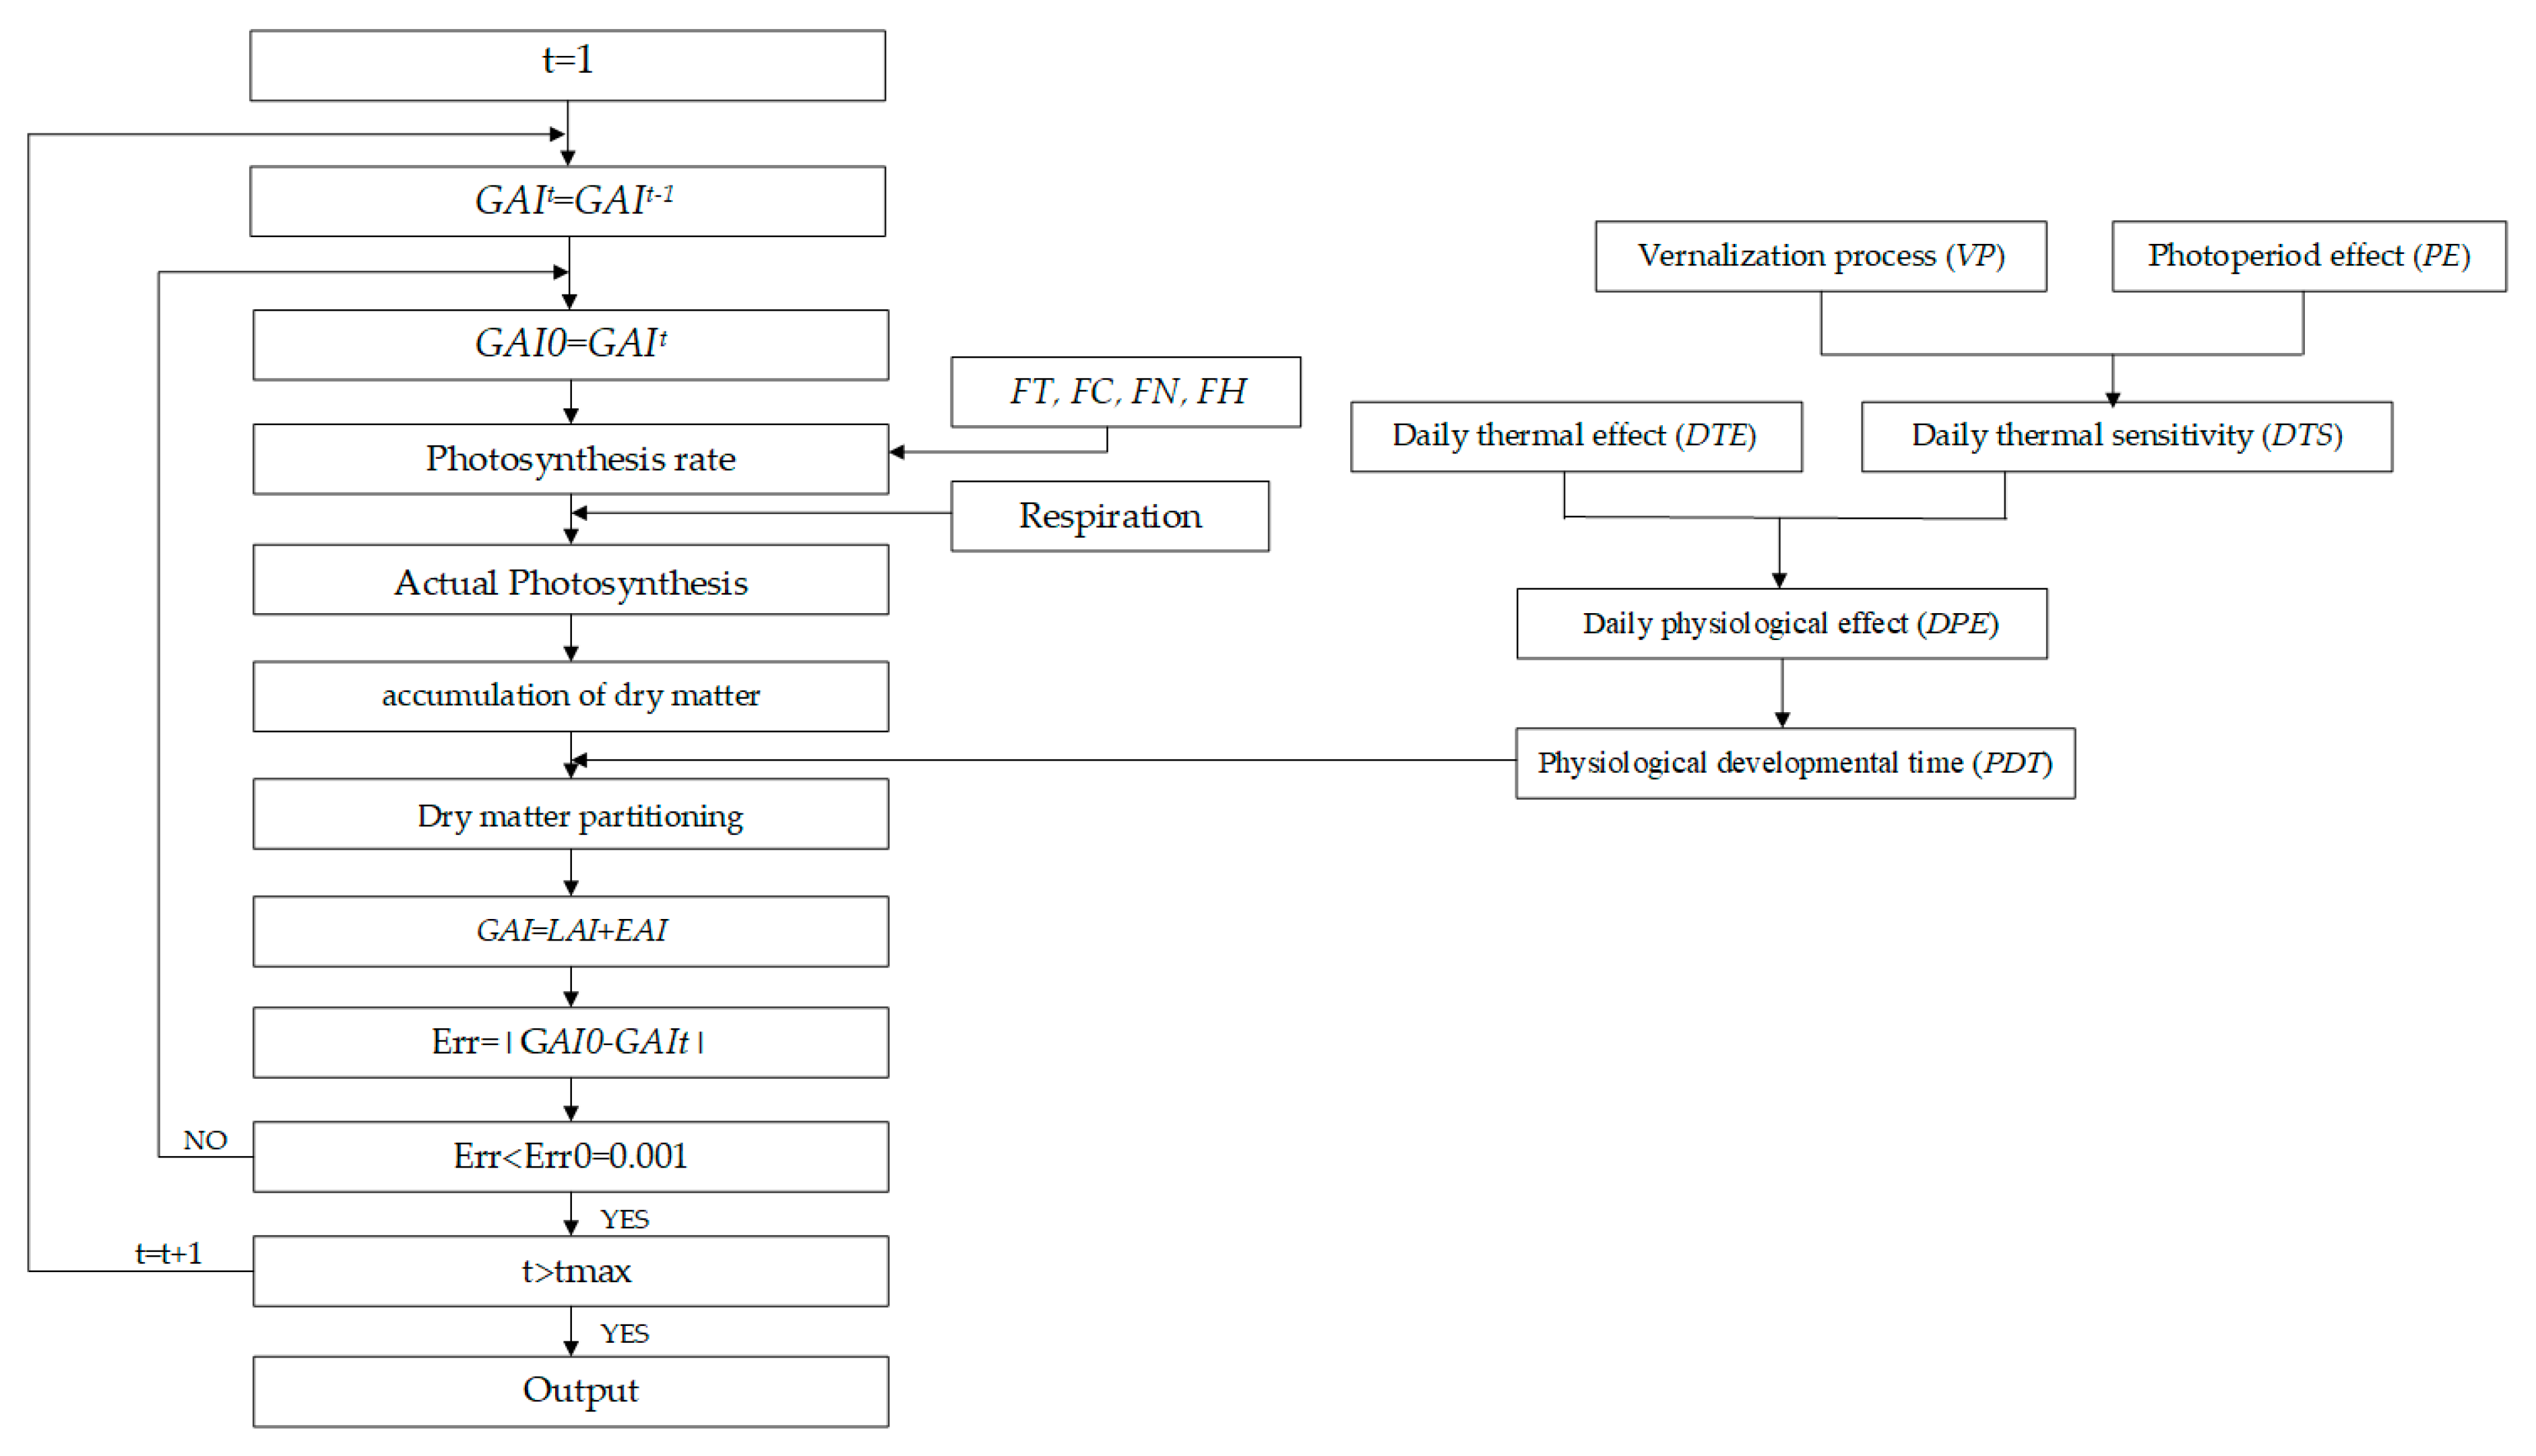
2.1. Coupling of Crop Growth and SPAC Water–Heat Transport
2.2. Crop Module
2.2.1. Simulation of Crop Stage Development
2.2.2. Simulation of Biomass Accumulation
2.2.3. Dry Biomass Partitioning and Yield
2.3. SPAC Module
2.3.1. Calculation of Net Radiation and Water-Heat Transport in Crop Canopy
2.3.2. Calculation of Crop Transpiration under Water Stress in Root Zone
2.3.3. Water and Heat Transfer in Soil with Root Water Uptake
3. Experiment and Model Input
3.1. Study Area and Experiment
3.2. Model Input
4. Simulation Results
4.1. Soil Water Content
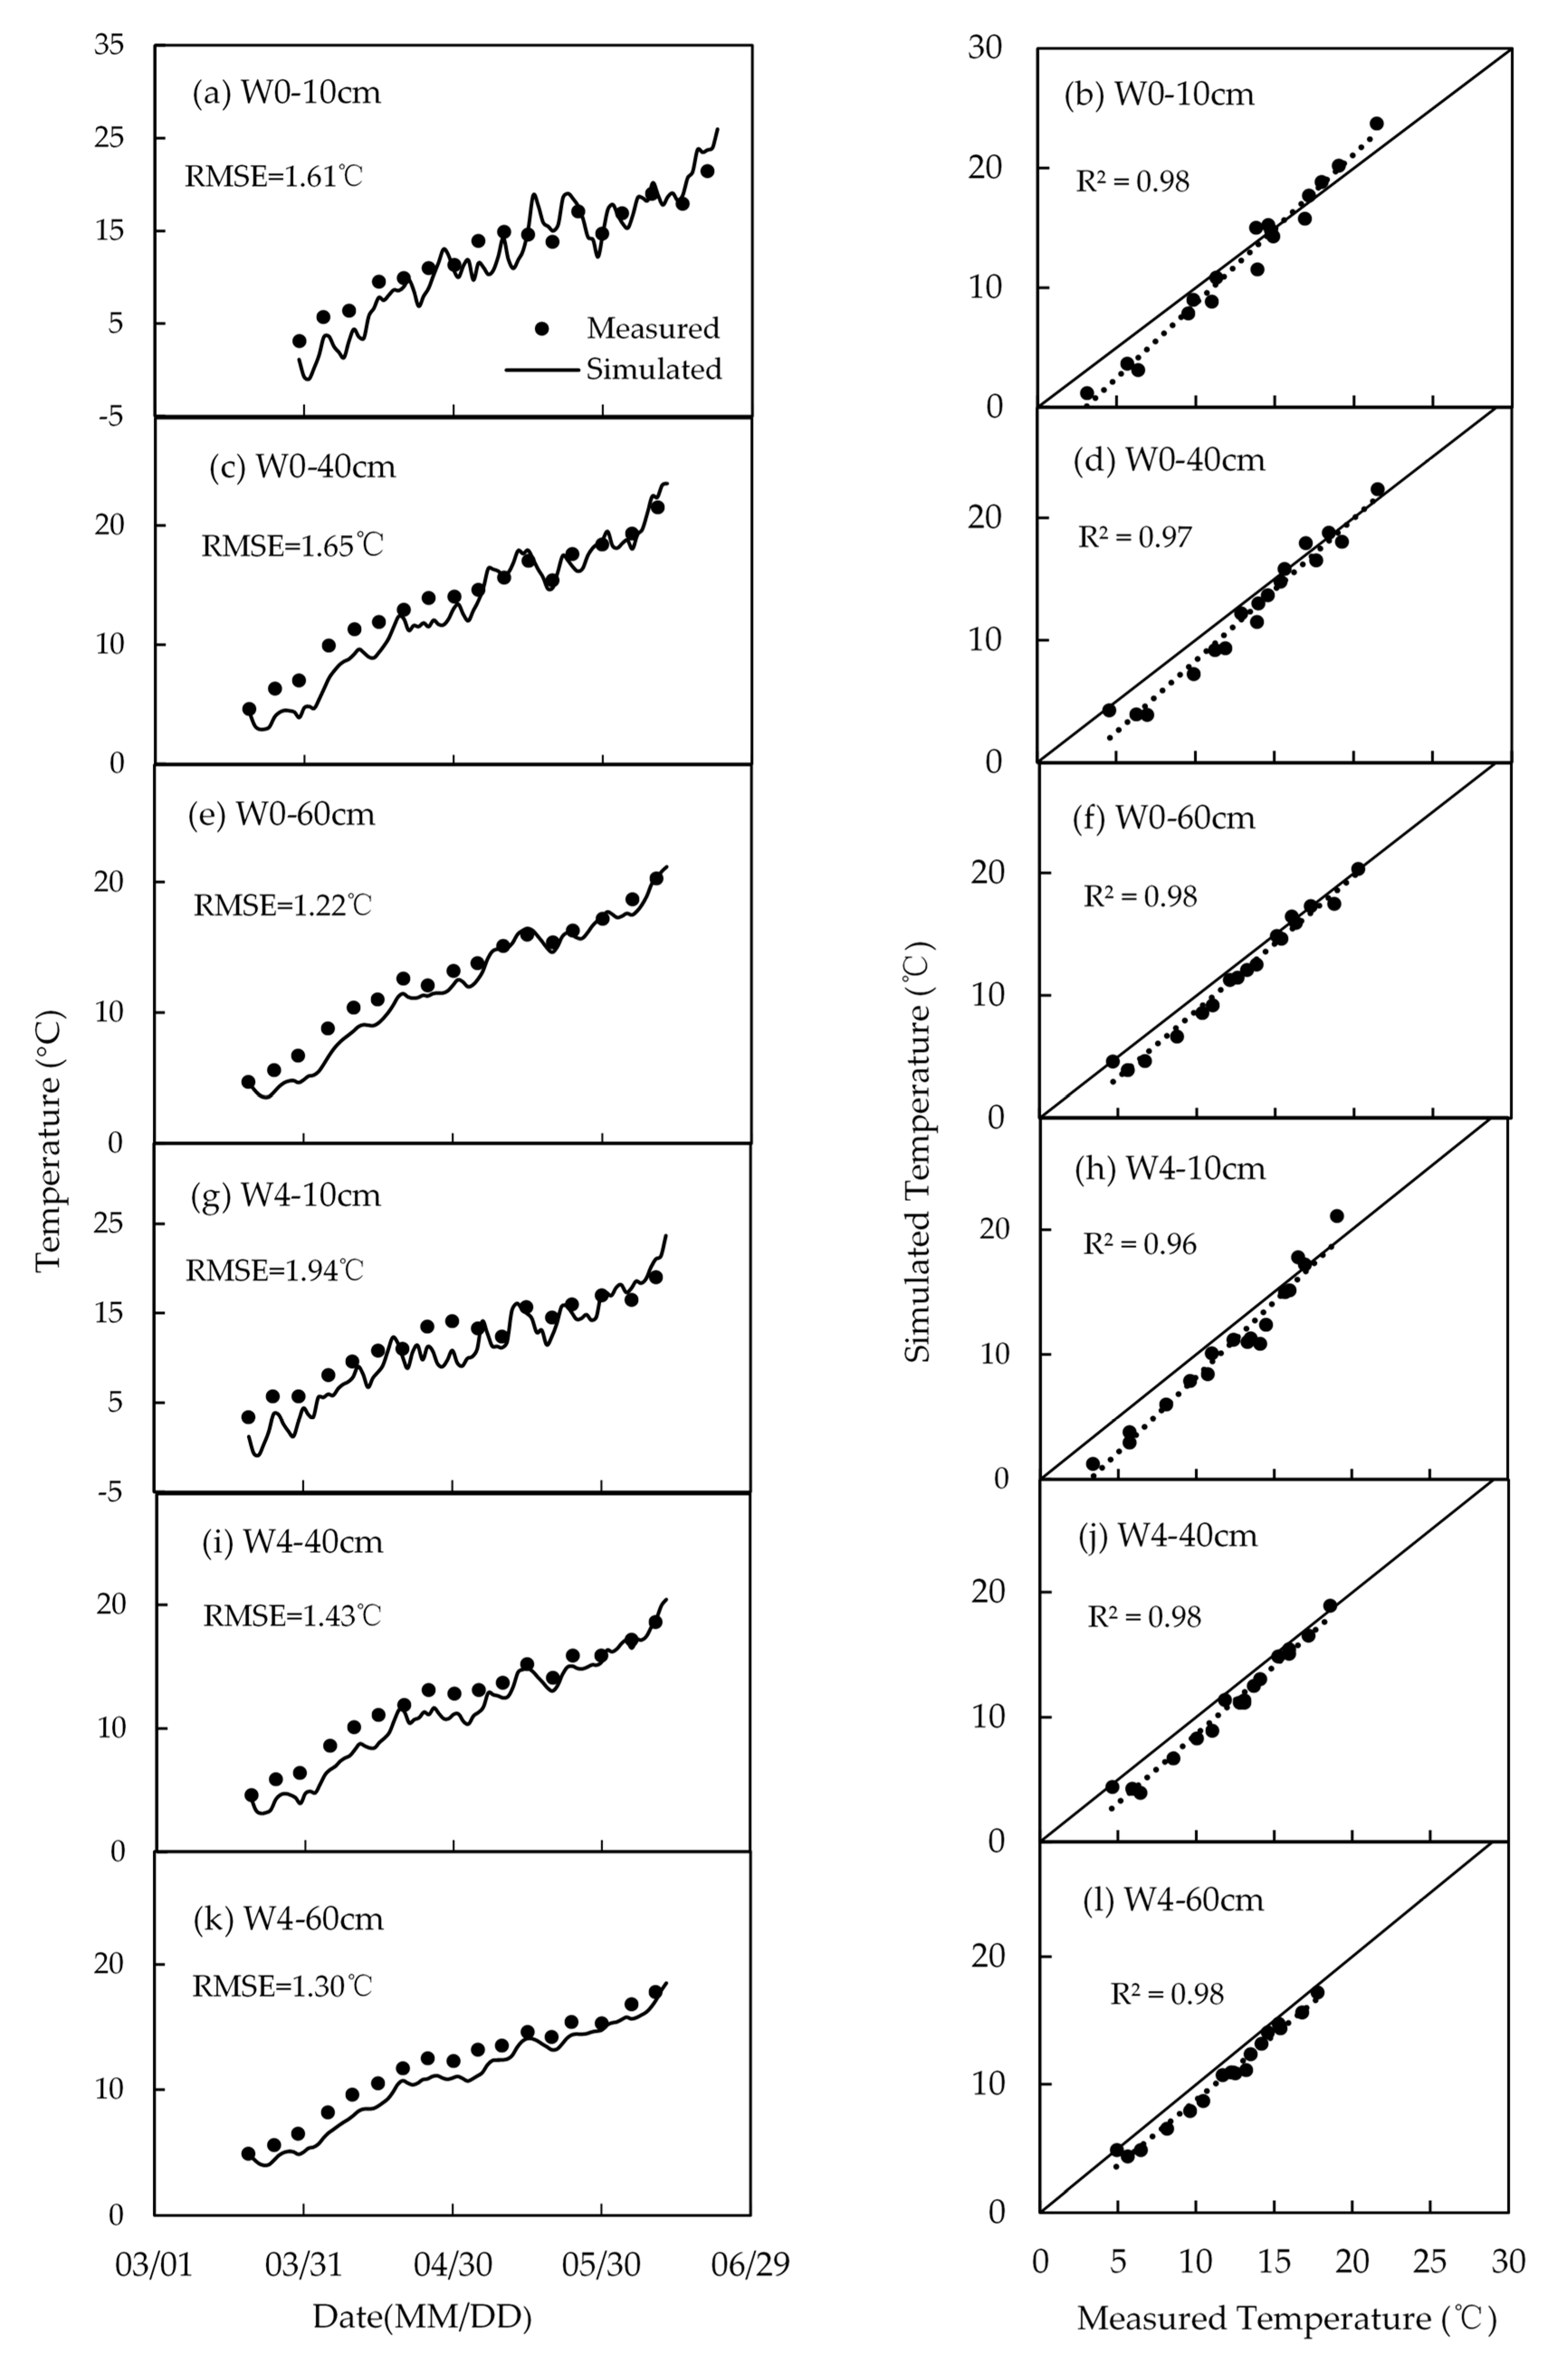
4.2. Soil Temperature
4.3. Leaf Area Index
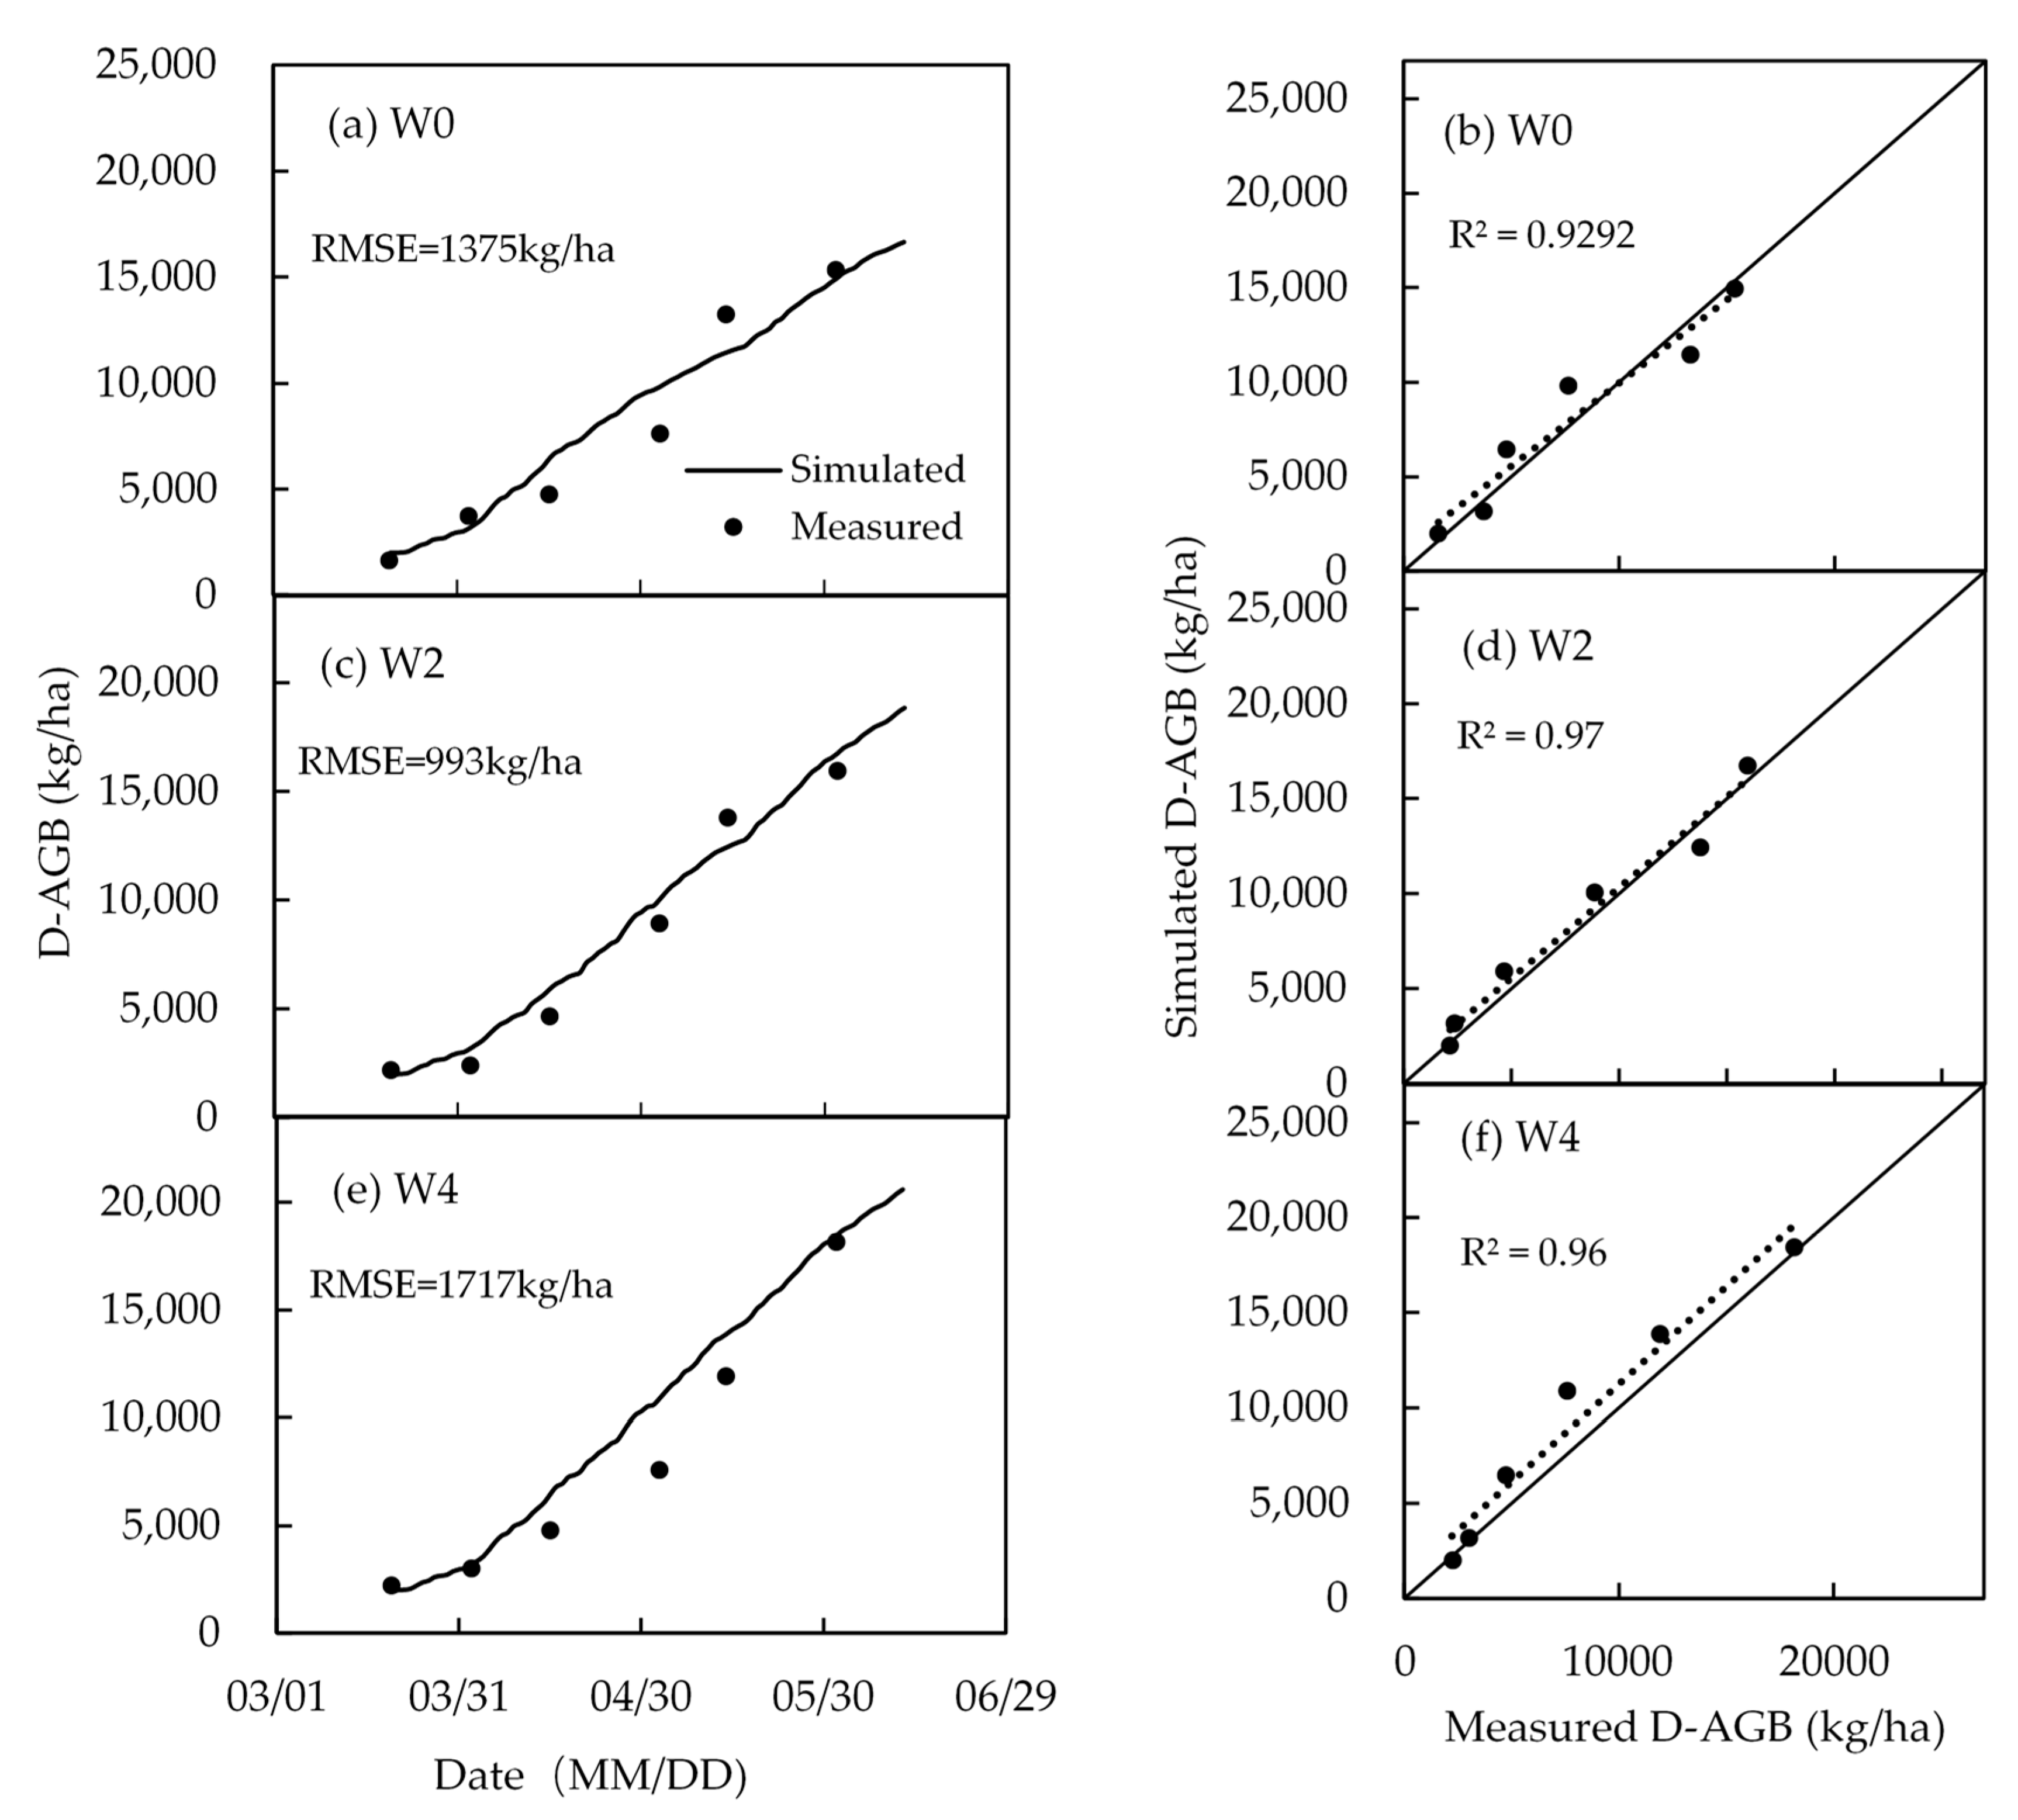
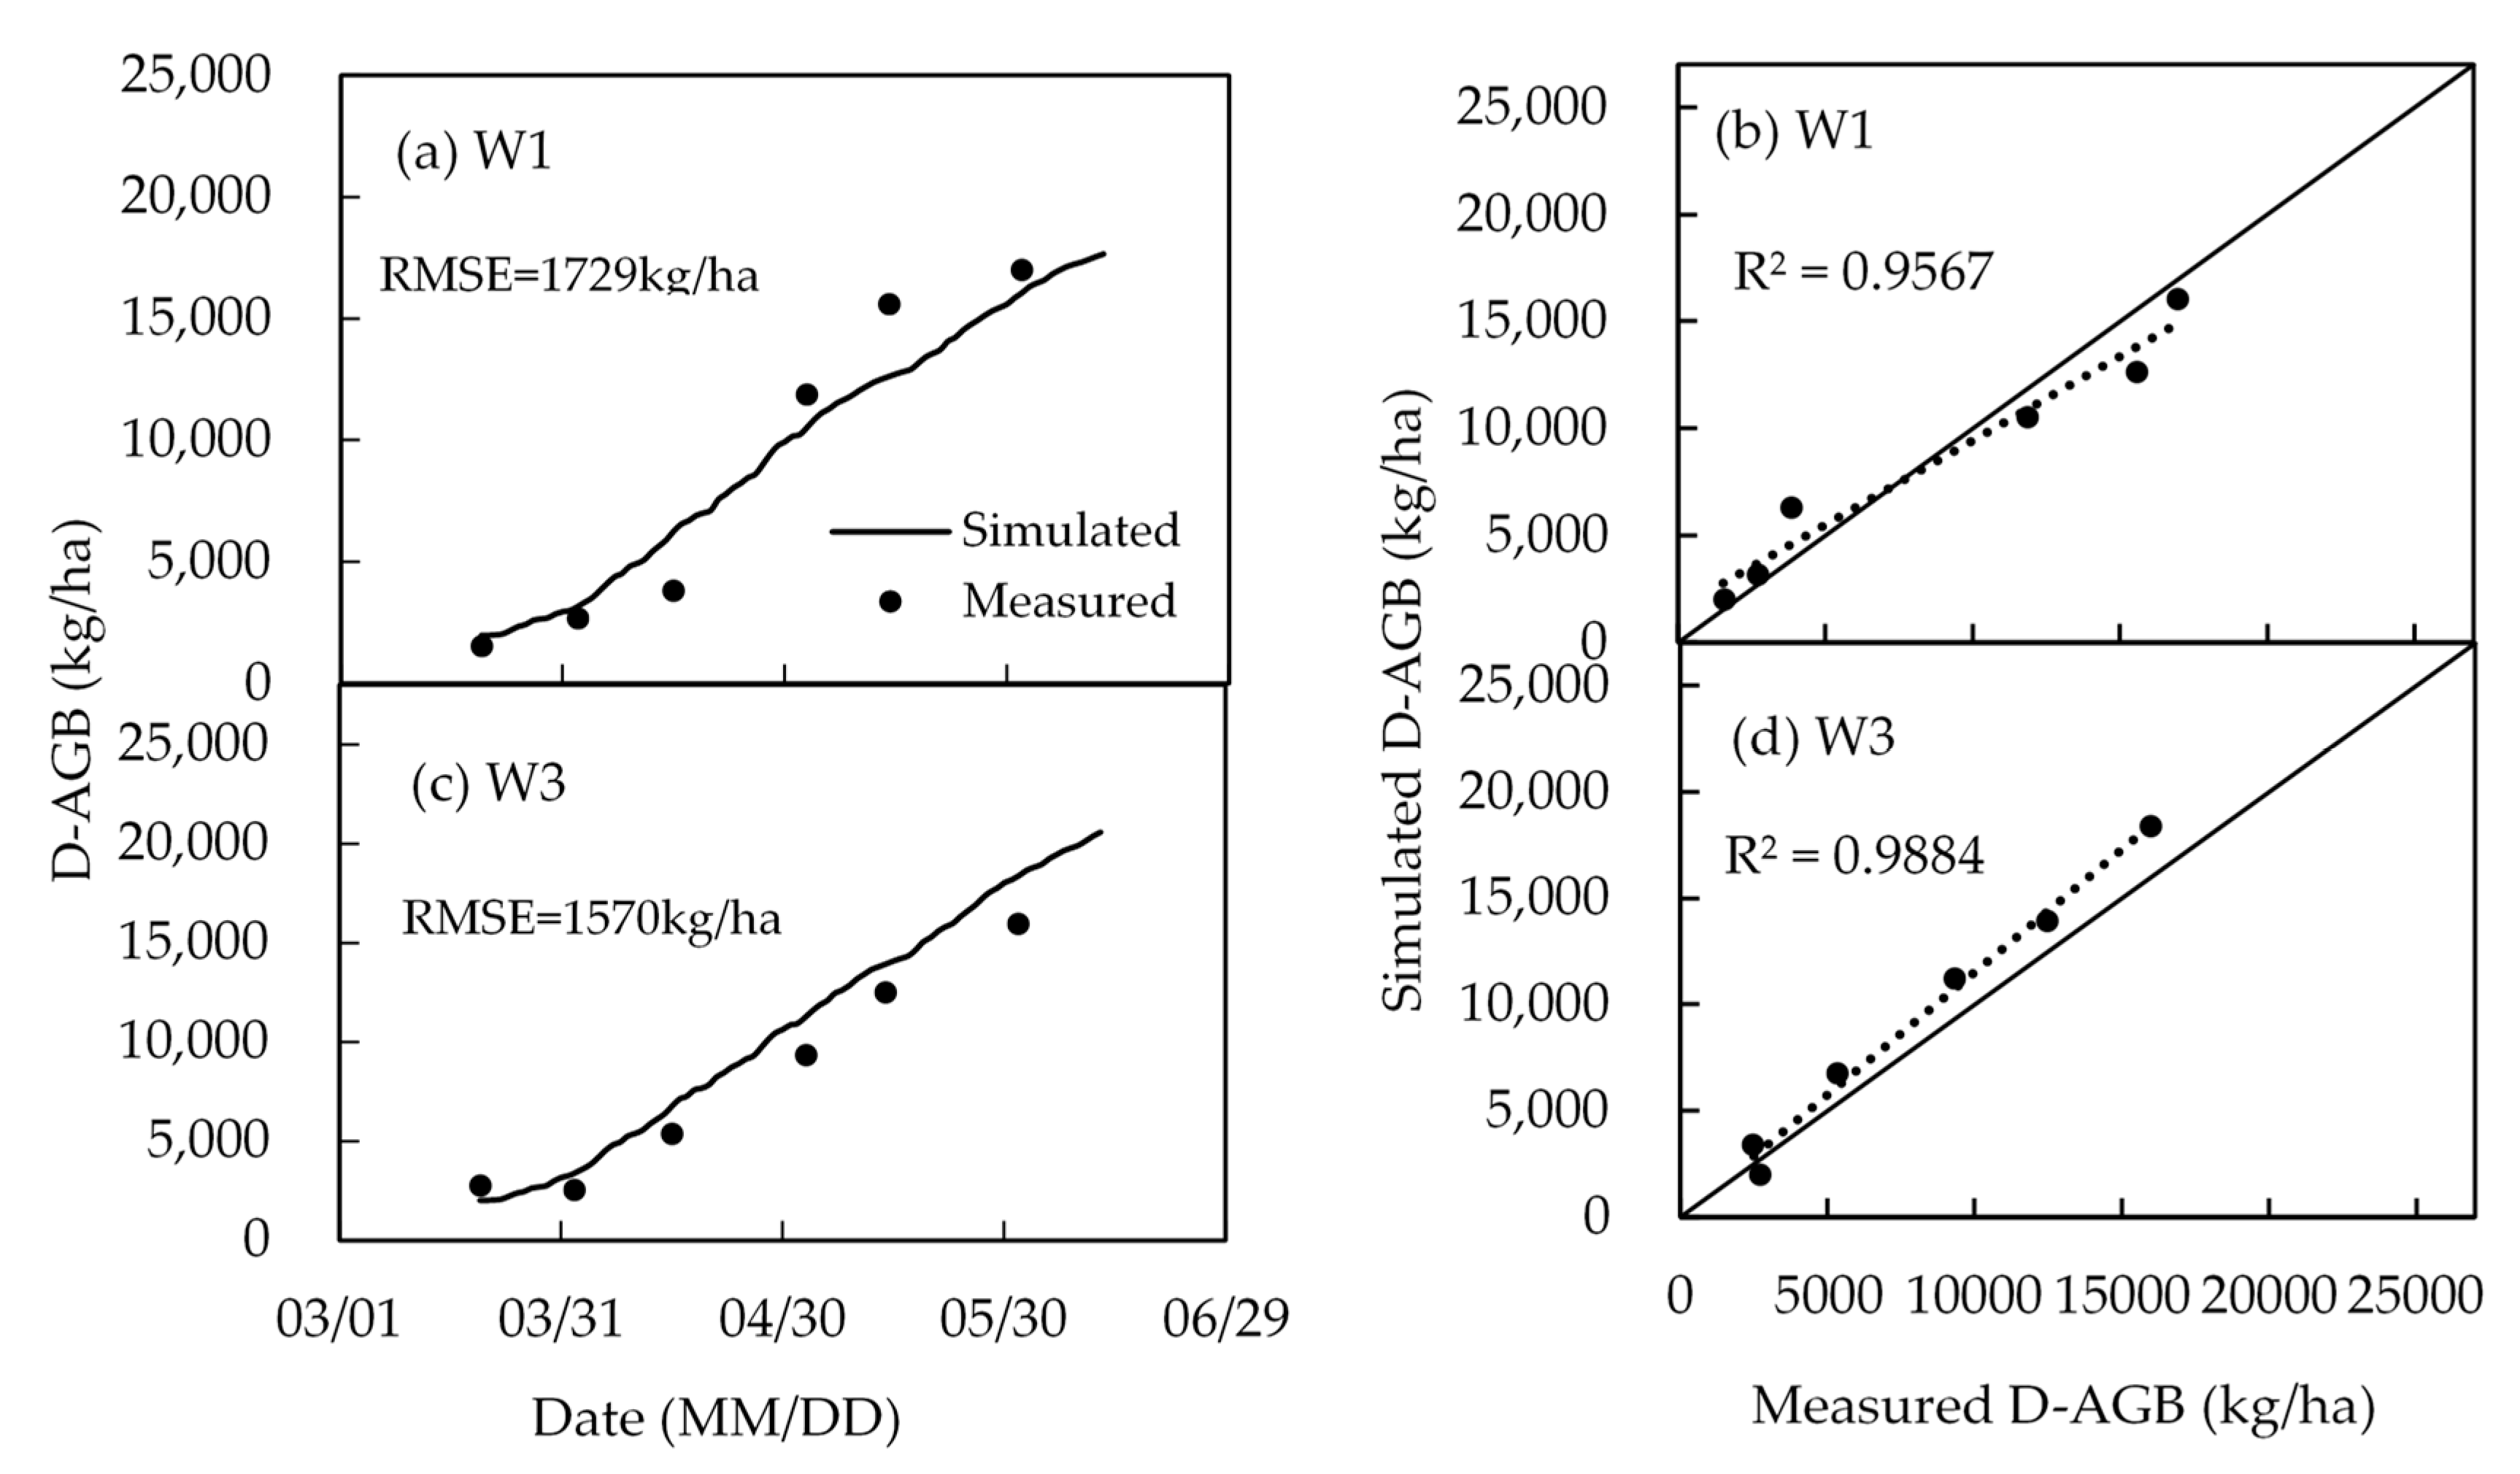
4.4. Biomass and Yield
5. Discussion on the Coupling Effect of Model
5.1. Comparison between CropSPAC and the Detached Crop Module
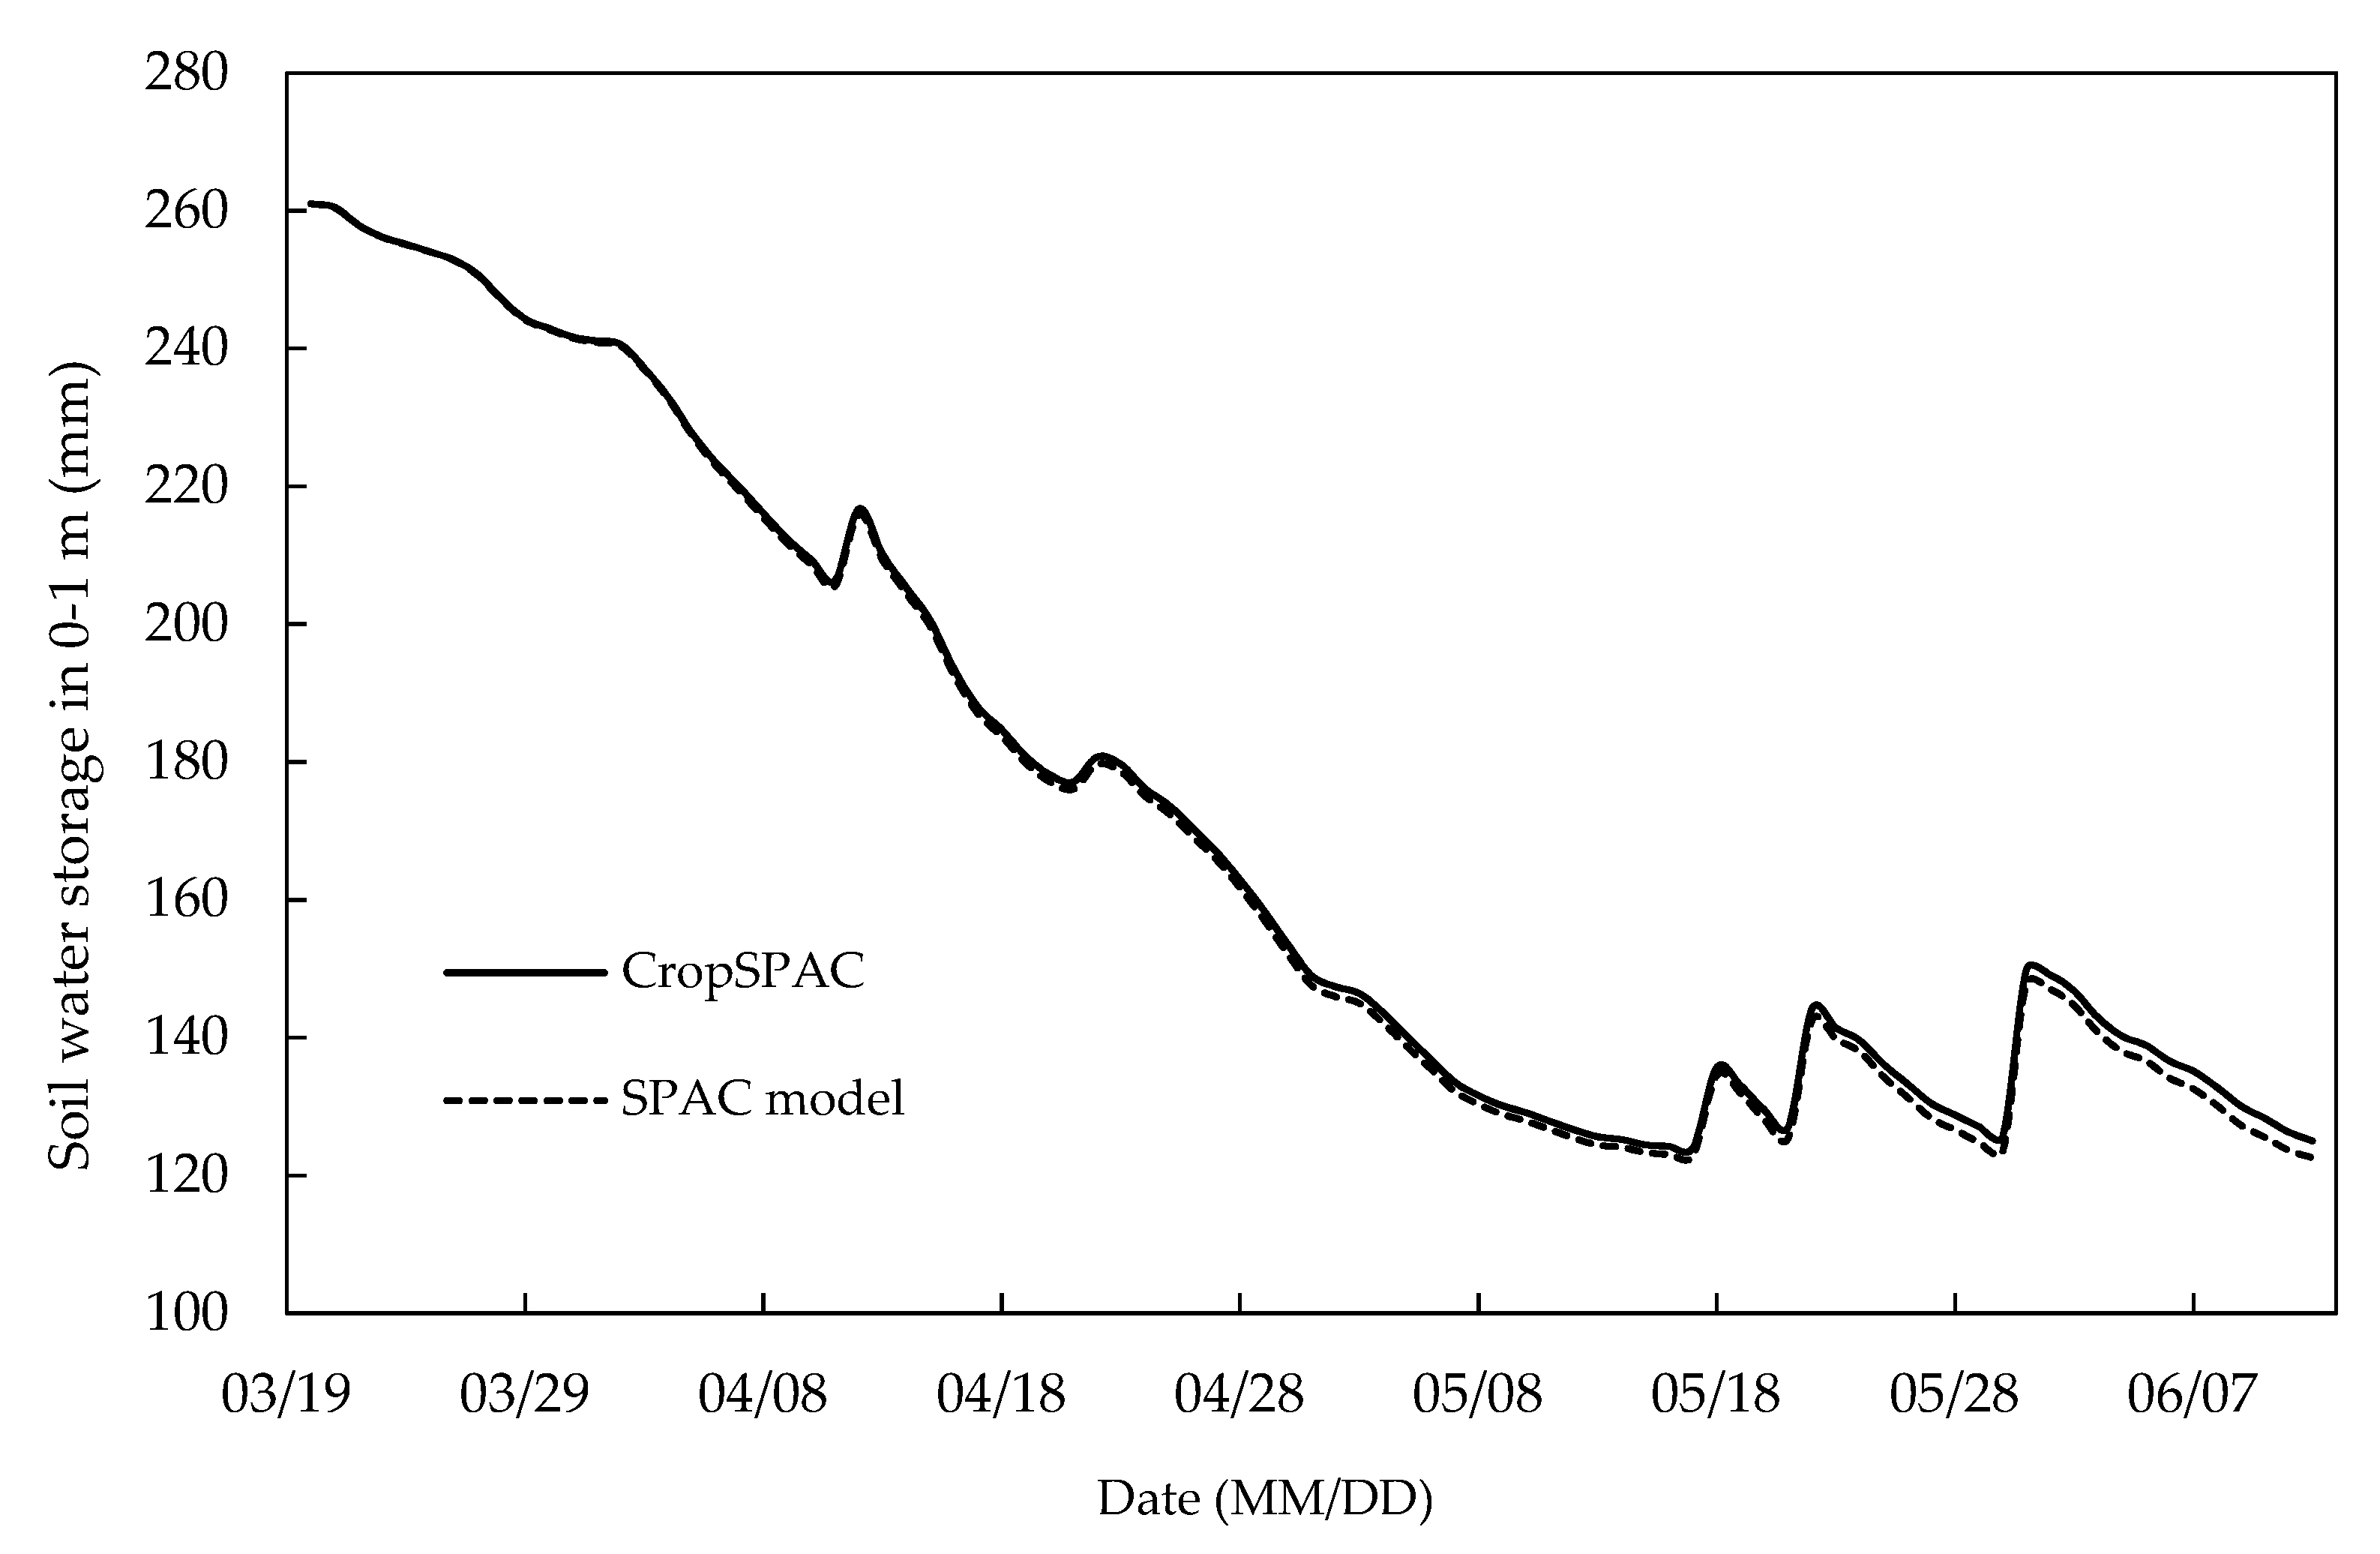
5.2. Comparison between CropSPAC and SPAC
6. Conclusions and Future Work
Author Contributions
Funding
Acknowledgments
Conflicts of Interest
Appendix A. Supplementary Description of the Variable Formula in the Crop Module
| Tb (°C) | T0 (°C) | Tm (°C) | |
|---|---|---|---|
| Emergence date to double ridge date | 0 | 20 | 32 |
| Double ridge date to heading date | 3.3 | 22 | 32 |
| Heading date to maturity | 8 | 25 | 35 |
Appendix B. Supplementary Description of the Variable Formula in the SPAC Module
Appendix C. Parameters of the CropSPAC
| Sort | Symbol | Parameter Name | Unit | Value | Source |
|---|---|---|---|---|---|
| Genetic parameter | ts | Temperature sensitivity | 0.9 | ||
| PVT | Physiological vernalization time | day | 50 | ||
| PS | Photoperiod sensitivity | 0.005 | [27] | ||
| BDF | Basic developmental factor | 0.99 | |||
| HI | Harvest index | 0.5 | |||
| SLA | leaf weight per unit | ha/kg | 0.0022 | ||
| Parameters in water influence factor | θOH | Upper limit of optimum soil water content | cm3/cm3 | 0.35 | Calibrated with the observed data |
| θOL | Lower limit of optimum soil water content | cm3/cm3 | 0.18 | ||
| θWP | Wilting point soil content | cm3/cm3 | 0.05 | ||
| Influence factor | FC | CO2 concentration influence factor | 0.95 | [27] | |
| FN | Nitrogen influence factor | 0.95 | |||
| Photosynthesis | κ | Extinction coefficient | 0.6 | [27] | |
| PLMX0 | Maximum photosynthetic rate of leaves | kgCO2·ha−1·h−1 | 40 | ||
| ε | Initial utilization efficiency of absorbed light | kgCO2·ha−1·h−1/(J·m−2·s−1) | 0.5 | ||
| σ | Single leaf dissipation coefficient | 0.2 | |||
| Respiration | T0 | Optimum temperature of respiration | °C | 25 | [27] |
| Q10 | Temperature coefficient of respiration | 2 | [27] | ||
| RM(T0) | Sustained respiration coefficient at T0 | gCO2/gCO2 | 0.010 | Calibrated with the observed data | |
| Rg | Growth respiration coefficient | gCO2/gCO2 | 0.26 | ||
| Rp(T0) | Photorespiration coefficient at T0 | gCO2/gCO2 | 0.20 | ||
| Radiation | A | Surface albedo | 0.25 | [34] | |
| μ | Radiation ratio | 0.97 | [34] | ||
| A | Net radiation distribution coefficient | 0.3973 | [35] | ||
| B | Net radiation distribution coefficient | 1.036 | [35] |
References
- Passioura, J.B. Plant–Water Relations. Encyclopedia of Life Sciences (ELS); John Wiley & Sons, Ltd.: Hoboken, NJ, USA, 2010; pp. 1–7. [Google Scholar]
- Nilson, S.E.; Assmann, S.M. The control of transpiration. Insights from Arabidopsis. Plant Physiol. 2007, 143, 19–27. [Google Scholar] [CrossRef] [PubMed]
- Liu, B.; Yang, L.; Zeng, Y.; Yang, F.; Yang, Y.; Lu, Y. Secondary crops and non-crop habitats within landscapes enhance the abundance and diversity of generalist predators. Agric. Ecosyst. Environ. 2018, 258, 30–39. [Google Scholar] [CrossRef]
- Silva, V.D.P.R.D.; Silva, R.A.E.; Maciel, G.F.; Braga, C.C.; Junior, J.L.C.D.S.; Souza, E.P.D.; Almeida, R.S.R.; Silva, A.M.T.; Holanda, R.M.D. Calibration and validation of the AquaCrop model for the soybean crop grown under different levels of irrigation in the Motopiba region, Brazil. Cienc. Rural 2018, 48, 1–8. [Google Scholar] [CrossRef]
- Goyne, P.J.; Meinke, H.; Milroy, S.P.; Hammer, G.L.; Hare, J.M. Development and use of a barley crop simulation model to evaluate production management strategies in north-eastern Australia. Aust. J. Agric. Res. 1996, 47, 1470–1477. [Google Scholar] [CrossRef]
- Badenko, V.L.; Garmanov, V.V.; Ivanov, D.A.; Savchenko, A.N.; Topaj, A.G. Prospects of application of dynamic crop models in the problems of midterm and long-term planning of agricultural production and land management. Russ. Agric. Sci. 2015, 41, 187–190. [Google Scholar] [CrossRef]
- Wang, L.; Agyemang, S.A.; Amini, H.; Shahbazi, A. Mathematical modeling of production and biorefinery of energy crops. Renew. Sustain. Energy Rev. 2015, 43, 530–544. [Google Scholar] [CrossRef]
- Lizaso, J.I.; Boote, K.J.; Jones, J.W.; Porter, C.H.; Echatte, L.; Westgate, M.E.; Sonohat, G. CSM-IXIM: A new maize simulation model for DSSAT version 4.5. Agron. J. 2011, 103, 766–779. [Google Scholar] [CrossRef]
- Liu, B.; Asseng, S.; Liu, L.; Tang, L.; Cao, W.; Zhu, Y. Testing the responses of four wheat crop models to heat stress at anthesis and grain filling. Glob. Chang. Biol. 2016, 22, 1890–1903. [Google Scholar] [CrossRef] [PubMed]
- Maiorano, A.; Martre, P.; Asseng, S.; Ewert, F.; Muller, C.; Rotter, R.P.; Ruane, A.C.; Semenov, M.A.; Wallach, D.; Wang, E.; et al. Crop model improvement reduces the uncertainty of the response to temperature of multi-model ensembles. Field Crops Res. 2017, 202, 5–20. [Google Scholar] [CrossRef]
- Williams, J.R.; Jones, C.A.; Kiniry, J.R.; Spanel, D.A. The EPIC crop growth model. Trans. ASABE 1989, 32, 497–511. [Google Scholar] [CrossRef]
- Diepen, C.A.; Wolf, J.; Keulen, H.; Rappoldt, C. WOFOST: A simulation model of crop production. Soil Use Manag. 1989, 5, 16–24. [Google Scholar] [CrossRef]
- Pathak, H.; Li, C.; Wassmann, R. Greenhouse gas emissions from Indian rice fields: Calibration and upscaling using the DNDC model. Biogeosciences 2005, 2, 77–102. [Google Scholar] [CrossRef]
- Jones, J.W.; Hoogenboom, G.; Porter, C.H.; Boote, K.J.; Batchelor, W.D.; Hunt, L.A.; Wilkens, P.W.; Singh, U.; Gijsman, A.J.; Ritchie, J.T. The DSSAT cropping system model. Eur. J. Agron. 2003, 18, 235–265. [Google Scholar] [CrossRef]
- Raes, D.; Steduto, P.; Hsiao, T.C.; Fereres, E. AquacropThe FAO crop model to simulate yield response to water: II. main algorithms and software description. Agron. J. 2009, 101, 438–447. [Google Scholar] [CrossRef]
- Yang, J.; Mao, X.; Wang, K.; Yang, W. The coupled impact of plastic film mulching and deficit irrigation on soil water/heat transfer and water use efficiency of spring wheat in Northwest China. Agric. Water Manag. 2018, 201, 232–245. [Google Scholar] [CrossRef]
- Philip, J.R. Plant water relations: Some physical aspects. Annu. Rev. Plant Physiol. 1966, 17, 245–268. [Google Scholar] [CrossRef]
- Yang, Y.; Shang, S.; Guan, H. Development of a soil-plant-atmosphere continuum model (HDS-SPAC) based on hybrid dual-source approach and its verification in wheat field. Sci. China Technol. Sci. 2012, 55, 2671–2685. [Google Scholar] [CrossRef]
- Deng, Z.; Guan, H.; Hutson, J.; Forster, M.A.; Wang, Y.Q.; Simmons, C.T. A vegetation-focused soil-plant-atmospheric-continuum model to study hydrodynamic soil-plant water relations. Water Resour. Res. 2017, 53, 4965–4983. [Google Scholar] [CrossRef]
- Federer, C.A. A soil-plant-atmosphere model for transpiration and availability of soil water. Water Resour. Res. 1979, 15, 555–562. [Google Scholar] [CrossRef]
- Gou, S.; Miller, G. A groundwater–soil–plant–atmosphere continuum approach for modelling water stress, uptake, and hydraulic redistribution in phreatophytic vegetation. Ecohydrology 2014, 7, 1029–1041. [Google Scholar] [CrossRef]
- Zhang, X.; Xiao, Y.; Wan, H.; Deng, Z.; Pan, G.; Xia, J. Using stable hydrogen and oxygen isotopes to study water movement in soil-plant-atmosphere continuum at Poyang Lake wetland, China. Wetl. Ecol. Manag. 2017, 25, 1–14. [Google Scholar] [CrossRef]
- Kroes, J.G.; Huygen, J.; Vervoort, R.W. User’s Guide of SWAP Version 2.0; Simulation of Water Flow, Solute Transport and Plant Growth in the Soil-Water-Atmosphere-Plant Environment; DLO Winand Staring Centre: Wageningen, The Netherlands, 1999. [Google Scholar]
- Arnold, J.G.; Srinivasan, R.; Muttiah, S.; Williams, J.R. Large area hydrologic modeling and assessment part I: Model development. J. Am. Water Resour. Assoc. 1998, 34, 73–89. [Google Scholar] [CrossRef]
- Chen, F.; Mitchell, K.; Schaake, J.; Xue, Y.; Pan, H.; Koren, V.; Duan, Q.Y.; Ek, M.; Betts, A. Modeling of land surface evaporation by four schemes and comparison with FIFE observations. J. Geophys. Res. Atmos. 1996, 101, 7251–7268. [Google Scholar] [CrossRef]
- Ek, M.; Mitchell, K.; Lin, Y.; Rogers, E.; Grunmann, P.; Koren, V.; Gayno, G.; Tarpley, J. Implementation of Noah land surface model advances in the national centers for environmental prediction operational mesoscale Eta model. J. Geophys. Res. Atmos. 2003, 108, 8851. [Google Scholar] [CrossRef]
- Cao, W.; Luo, W. Crop System Simulation and Intelligent Management; Higher Education Press: Beijing, China, 2003; pp. 27–33, 57–63. ISBN 7-04-011756-8. [Google Scholar]
- Cao, W.; Moss, D.N. Modelling phasic development in wheat: A conceptual integration of physiological components. J. Agric. Sci. 1997, 129, 163–172. [Google Scholar] [CrossRef]
- Cong, Z.; Lei, Z.; Hu, H.; Yang, S. Study on coupling between winter wheat growth and water-heat transfer in soil-plant-atmosphere continuum I. Model. J. Hydraul. Eng. 2005, 36, 575–580. [Google Scholar] [CrossRef]
- Goudriaan, J. A simple and fast numerical method for the computation of daily totals of crop photosynthesis. Agric. For. Meteorol. 1986, 38, 249–254. [Google Scholar] [CrossRef]
- Liu, T.; Cao, W.; Luo, W.; Wang, S.; Guo, W.; Zou, W.; Zhou, Q. Quantitative simulation on dry matter partitioning dynamic in wheat organs. J. Triticeae Crops. 2001, 21, 25–31. [Google Scholar] [CrossRef]
- Liu, T.; Cao, W.; Luo, W.; Guo, W. Simulation on leaf area index in wheat. J. Triticeae Crops 2001, 21, 25–31. [Google Scholar] [CrossRef]
- Mao, X.; Shang, S.; Lei, Z.; Yang, S. Study on evapotranspiration of winter wheat using SPAC model. J. Hydraul. Eng. 2001, 8, 7–11. [Google Scholar] [CrossRef]
- Bavel, C.H.M.V.; Hillel, D.I. Calculating potential and actual evaporation from a bare soil surface by simulation of concurrent flow of water and heat. Agric. Meteorol. 1976, 17, 453–476. [Google Scholar] [CrossRef]
- Kang, S.; Liu, X.; Xiong, Y. Theory of Water Transport in Soil-Plant-Atmosphere Continuum and its Applicatition; Water Resources and Electric Power Press: Beijing, China, 1994; pp. 30–37. ISBN 7-120-01718-7. [Google Scholar]
- Choudhury, B.J.; Monteith, J.L. A four-layer model for the heat budget of homogeneous land surfaces. Q. J. R. Meteorol. Soc. 1988, 114, 373–398. [Google Scholar] [CrossRef]
- Hanan, N.P.; Prince, S.D. Stomatal conductance of west-central supersite vegetation in HAPEX-Sahel: Measurements and empirical models. J. Hydrol. 1997, 188, 536–562. [Google Scholar] [CrossRef]
- Lei, Z.; Yang, S.; Xie, S. Soil Water Dynamics; Tsinghua University Press: Beijing, China, 1999; pp. 208–214. ISBN 7-302-00208-8. [Google Scholar]
- Xu, D.; Cai, L. Simulation of infiltration and recharge based on field water balance in cropped soil. J. Hydraul. Eng. 1997, 12, 64–71. [Google Scholar] [CrossRef]
- Yao, K.M.; Jian, W.M.; Zheng, H.S. Experimental Research Methods for Agrometeorology; Meteorological Press: Beijing, China, 1995; pp. 214–216. ISBN 7-5029-1810-8.
- Flerchinger, G.N.; Saxton, K.E. Simultaneous heat and water model of a freezing snow-residue-soil system I. Theory and development. Trans. ASAE 1989, 32, 0565–0571. [Google Scholar] [CrossRef]
- Mualem, Y. A new model for predicting the hydraulic conductivity of unsaturated porous media. Water Resour. Res. 1976, 12, 513–522. [Google Scholar] [CrossRef]
- Van Genuchten, T.M. A closed-form equation for predicting the hydraulic conductivity of unsaturated soils. Soil Sci. Soc. Am. J. 1980, 44, 892–898. [Google Scholar] [CrossRef]
- Johansen, O. Thermal Conductivity of Soils. Ph.D. Thesis, Trondheim University, Trondheim, Norway, 1975. [Google Scholar]
- Shang, S.; Li, X.; Mao, X.; Lei, Z. Simulation of water dynamics and irrigation scheduling for winter wheat and maize in seasonal frost areas. Agric. Water Manag. 2004, 68, 117–133. [Google Scholar] [CrossRef]
- Korres, N.E.; Norsworthy, J.K.; Burgos, N.R.; Oosterhuis, D.M. Temperature and drought impacts on rice production: An agronomic perspective regarding short-and long-term adaptation measures. Water Res. Rural Dev. 2016, 9, 12–27. [Google Scholar] [CrossRef]
- Shavrukov, Y.; Kurishbayev, A.; Jatayev, S.; Shvidchenko, V.; Zotova, L.; Koekemoer, F.; Groot, S.D.; Soole, K.; Langridge, P. Early flowering as a drought escape mechanism in plants: How can it aid wheat production? Front. Plant Sci. 2017, 8, 1–8. [Google Scholar] [CrossRef]
- Yan, L.; Loukoianov, A.; Blechl, A.; Tranquilli, G.; Ramakrishna, W.; Sanmiguel, P.; Bennetzen, J.; Echenique, V.; Dubcovsky, J. The wheat VRN2 gene is a flowering repressor downregulated by vernalization. Science 2004, 303, 1640–1644. [Google Scholar] [CrossRef] [PubMed]
- Yan, L.; Loukoianov, A.; Tranquilli, G.; Helguera, M.; Fahima, T.; Dubcovsky, J. Positional cloning of the wheat vernalization gene VRN1. Proc. Natl. Acad. Sci. USA 2003, 100, 6263–6268. [Google Scholar] [CrossRef] [PubMed]
- Cao, W.; Jiang, H. Modeling thermal-photo response and development progress in wheat. J. Nanjing Agric. Univ. 1996, 19, 9–16. [Google Scholar] [CrossRef]
- Sun, Z.; Shi, J.; Weng, D. A further research on the climatological calculation method of the global solar radiation over China. J. Nanjing Inst. Meteorol. 1992, 2, 21–29. [Google Scholar] [CrossRef]
- Wu, Q. Numerical Simulation of Hydrothermal Migration under Field Evapotranspiration. Ph.D. Thesis, Tsinghua University, Beijing, China, 1993. [Google Scholar]
- Lin, J.; Sun, S. A study of moisture and heat transport in soil and the effect of surface resistance to evaporation. J. Hydraul. Eng. 1983, 7, 3–10. [Google Scholar] [CrossRef]








| Treatment | Fertilization (kg/ha) | Irrigation Volume (mm) | Total Irrigation (mm) | |||
|---|---|---|---|---|---|---|
| 21 April 1999 | March 26 | April 21 | May 4 | May 19 | ||
| W0 | 150 | - | - | - | - | 0 |
| W1 | 150 | - | 60 | - | - | 60 |
| W2 | 150 | - | 60 | - | 50 | 110 |
| W3 | 150 | 60 | 60 | - | 50 | 170 |
| W4 | 150 | 60 | 60 | 60 | 50 | 230 |
| Initial Conditions | Symbol | Unit | Value |
|---|---|---|---|
| Physiological development time | PDT | 8 | |
| Vernalization | VP | 1 | |
| Dry biomass amount | Wday | kg/ha | 2585 |
| Dry aboveground biomass amount | Wtop | kg/ha | 2226 |
| Dry leaf biomass amount | Wleaf | kg/ha | 601 |
| Soil Texture | Ks (cm/min) | θs | θr | α (cm−1) | n |
|---|---|---|---|---|---|
| Sandy loam | 0.02 | 0.48 | 0.05 | 0.02 | 1.34 |
| Treatments | Measured Yield (kg/ha) | Simulated Yield (kg/ha) | Relative Error |
|---|---|---|---|
| W0 | 3395 | 3987 | 17.4% |
| W1 | 4722 | 4192 | 11.2% |
| W2 | 5378 | 4518 | 15.9% |
| W3 | 5641 | 4925 | 12.6% |
| W4 | 5340 | 4937 | 7.5% |
© 2018 by the authors. Licensee MDPI, Basel, Switzerland. This article is an open access article distributed under the terms and conditions of the Creative Commons Attribution (CC BY) license (http://creativecommons.org/licenses/by/4.0/).
Share and Cite
Yang, W.; Mao, X.; Yang, J.; Ji, M.; Adeloye, A.J. A Coupled Model for Simulating Water and Heat Transfer in Soil-Plant-Atmosphere Continuum with Crop Growth. Water 2019, 11, 47. https://doi.org/10.3390/w11010047
Yang W, Mao X, Yang J, Ji M, Adeloye AJ. A Coupled Model for Simulating Water and Heat Transfer in Soil-Plant-Atmosphere Continuum with Crop Growth. Water. 2019; 11(1):47. https://doi.org/10.3390/w11010047
Chicago/Turabian StyleYang, Weicai, Xiaomin Mao, Jian Yang, Mengmeng Ji, and Adebayo J. Adeloye. 2019. "A Coupled Model for Simulating Water and Heat Transfer in Soil-Plant-Atmosphere Continuum with Crop Growth" Water 11, no. 1: 47. https://doi.org/10.3390/w11010047
APA StyleYang, W., Mao, X., Yang, J., Ji, M., & Adeloye, A. J. (2019). A Coupled Model for Simulating Water and Heat Transfer in Soil-Plant-Atmosphere Continuum with Crop Growth. Water, 11(1), 47. https://doi.org/10.3390/w11010047


