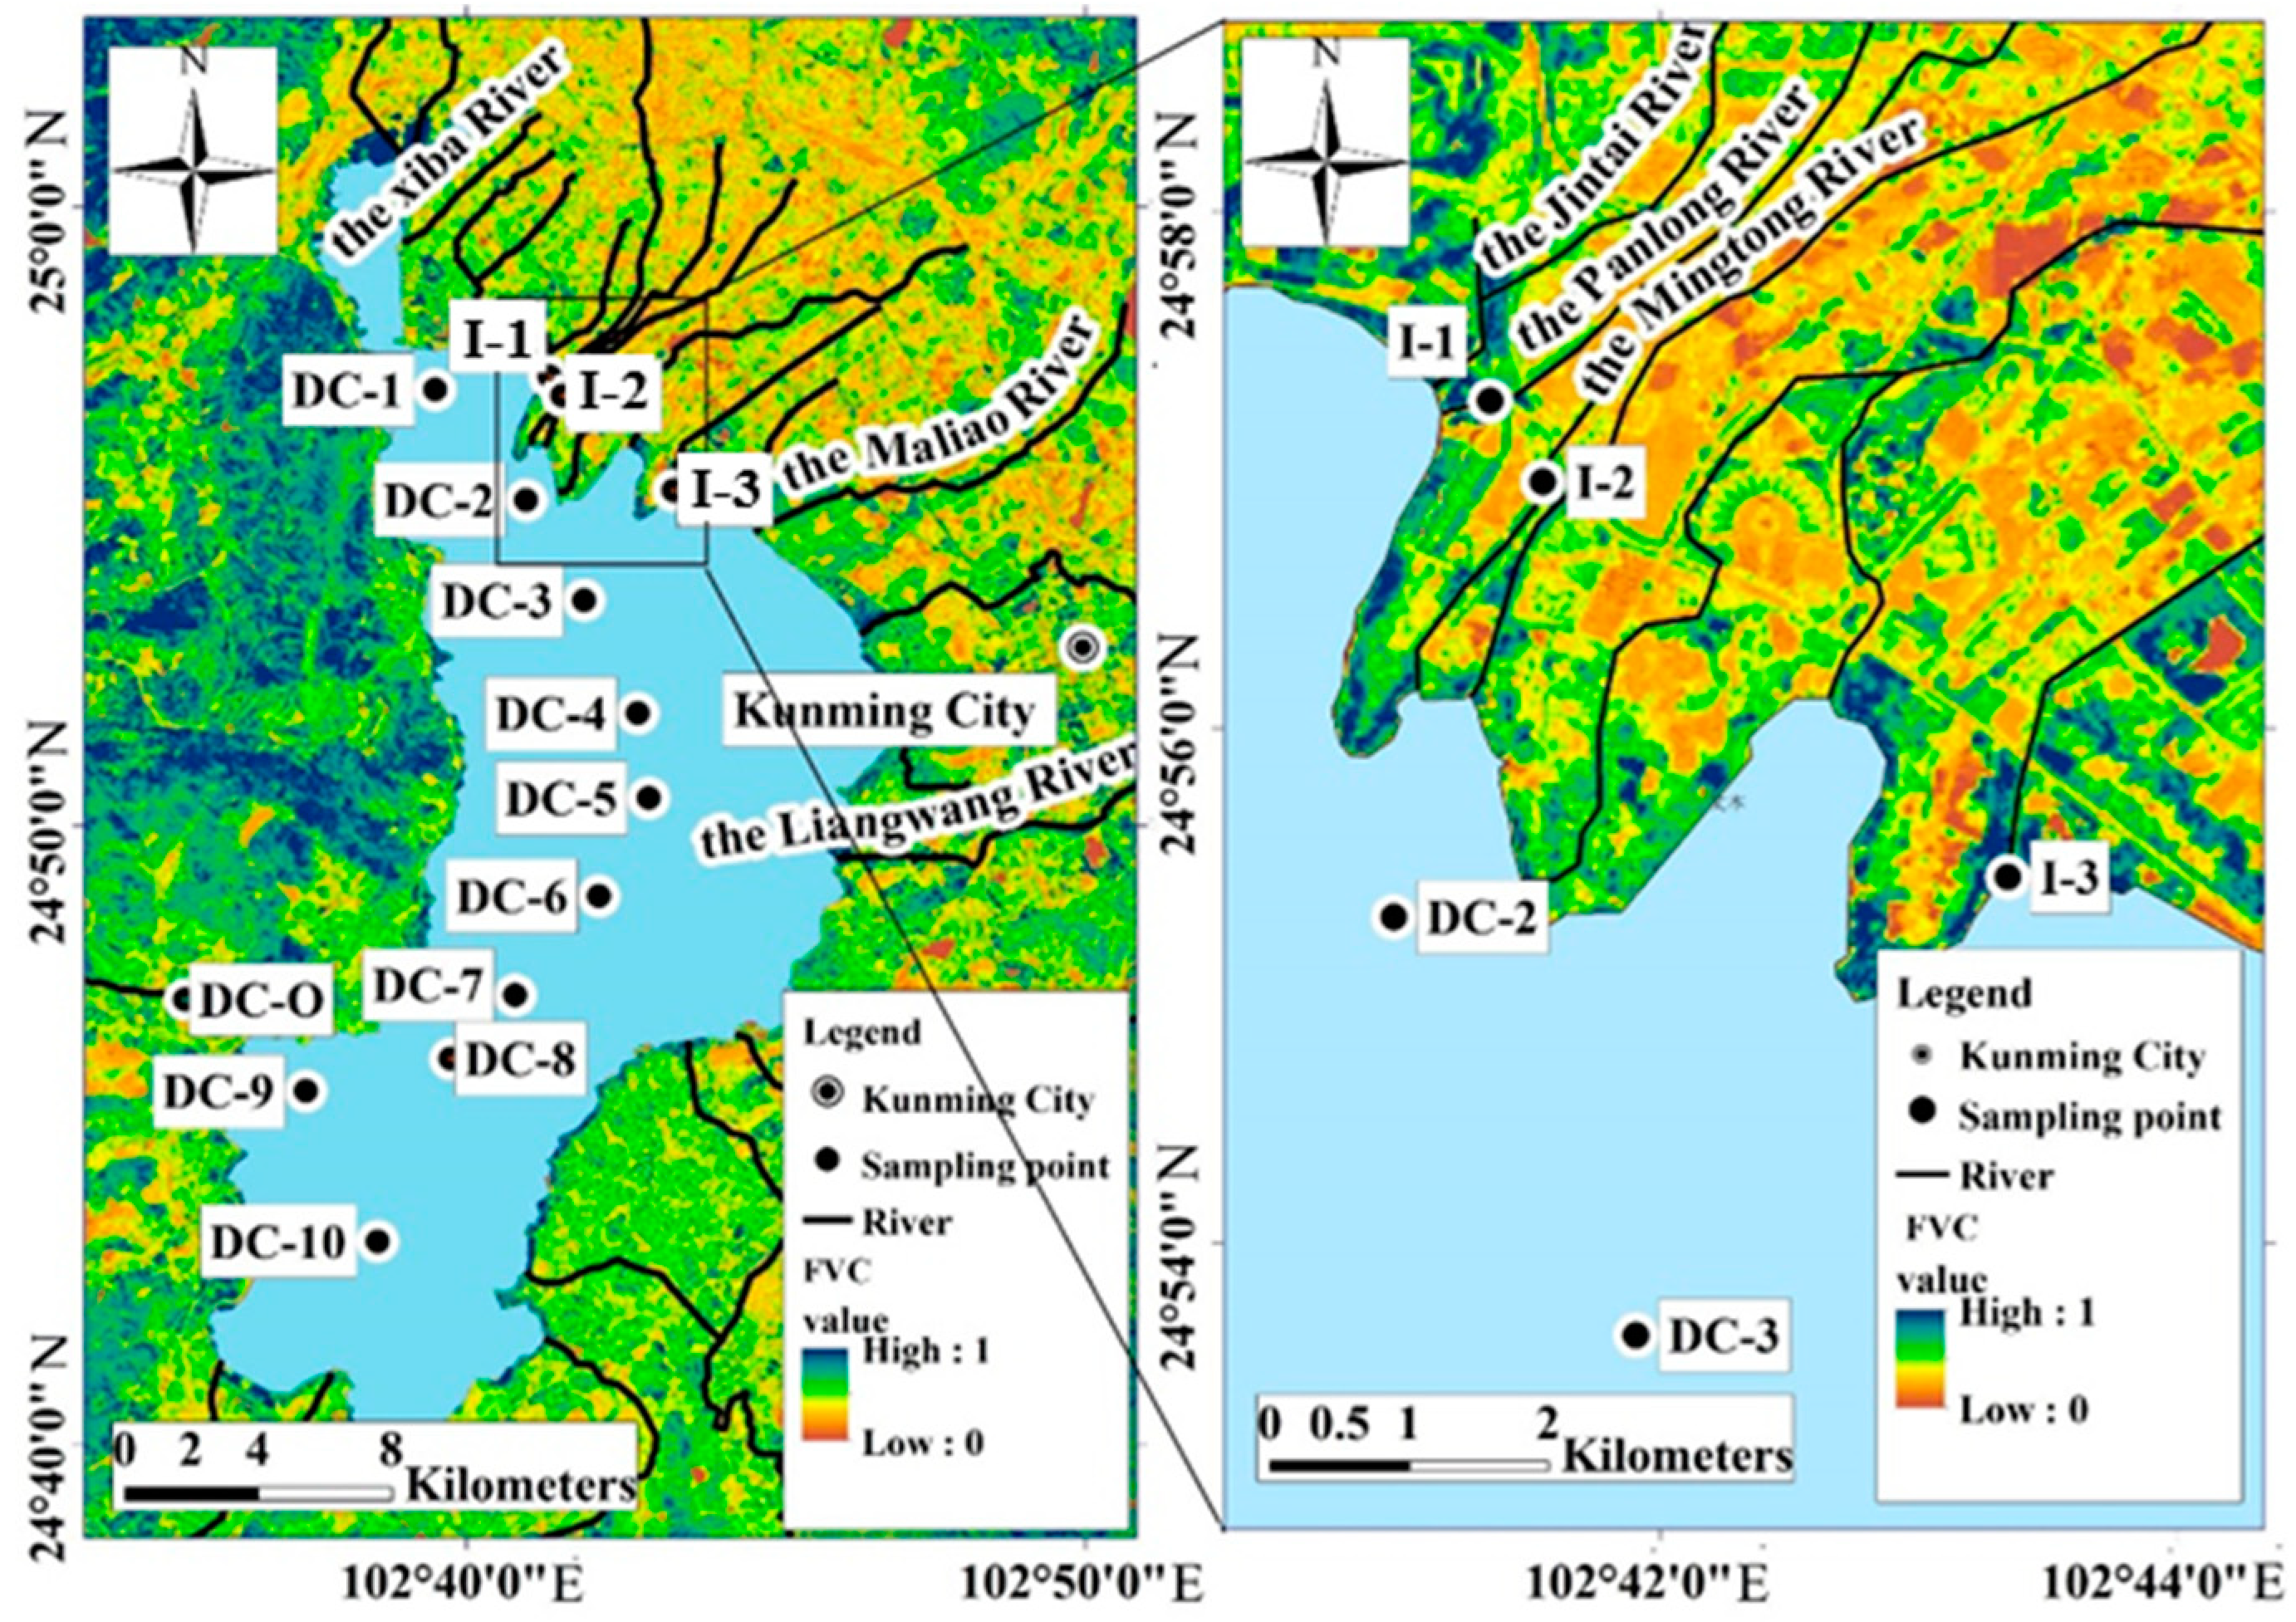
3.1. Characterization of Water Chemistry and DOC in the Dianchi Lake Waters
The temperature in the pore water was 17.3 °C, 2.8 °C higher than average values in surface water. The water above the deposition layer was weakly basic with pH ranging from 7.12~9.07 and a narrower range of 7.24~8.48 in pore water. The conductivity value averaged 365.3 at DC-2 and 374.9 µS·cm−1 at DC-9, which was 55.1 µS·cm−1 higher in pore water than that in the water above the deposition layer. Total dissolved solids (TDS = [Ca2+ + Mg2+ + Na+ + K+] + [HCO3– + SO42− + Cl−]) ranged from 236 to 448 (average 263.29) and 240 to 247 (average 242.7) mg·L−1 in surface and underlying water, respectively, and this index was not measured in pore water. The percentage contribution of Ca2+ and Na+ in cations was more than 69%, while Mg2+ and K+ was lower. The ion balance of total cations and anions (meq·L−1) was better than ±5%.
Nitrate concentrations were high, ranging from 1.47 to 44.64 mg·L
−1 in samples of surface and underlying water and 1.04 to 80.14 mg·L
−1 in pore water. NO
3−-N was of 1.9 mg·L
−1 in surface water and close to water quality standard value listed as class V of 2 mg·L
−1 for total nitrogen [
27], indicating that the water quality in Dianchi Lake was deteriorating. Bicarbonates (HCO
3−) concentration ranged from 94.54 to 220.59 and 87.01 to 116.7 mg·L
−1 in surface and underlying water, respectively. The Dianchi Lake water could be defined as HCO
3-Ca type due to relatively high Ca concentration in total cations [
28]. SO
42− concentrations in surface and underlying water were 24.27 to 50.54 and 43.19 to 51.77 mg·L
−1, respectively, which did not differentiate as much as that in pore water, where it ranged from 5.46 to 29.42 and 6.94 to 40.55 mg·L
−1 in the pore water of DC-2 and DC-9, respectively. The ratio Ca/Mg represented salinity and acidity/alkalinity in a paleoenvironment, which exhibited concordant variant trends with HCO
3− in water compartments above the sediments in this study, with the average values of 2.61 and 1.94 in the pore water and the water above the deposition layer.
DOC in surface water ranged from 1.59 to 6.24 mg C∙L
−1, and the lowest value was at the inlet river water of DC-1. This basically fluctuated around 5.84 mg C∙L
−1 in the central water area. DOCs were 5.25 and 5.55 mg C∙L
−1 in water above the deposition layer but only 4.43 mg C∙L
−1 at DC-2 and 3.81 mg C∙L
−1 at DC-9 for the pore water. Organic matter can provide physical sites for metal adsorption and electron donors for sulfate reduction [
29]. DOCs were experienced identically with SO
42− (R
2 = 0.98, p
≤ 0.01) in that both of them were the same sources or experienced the same geochemical processes, i.e., along with disintegration of the bound carbonatite and halide minerals and at much lower levels at inlets than at the lake central region. Almost all of the anions were HCO
3− and Cl
−, which might have been due to bedrock and minerals weathering and anthropogenic inputs around the lake drainage area [
27,
28]. This resulted from SO
42− being utilized as an electron acceptor to oxidize DOM, during which HCO
3− and SiO
32− were produced from organic phases. Due to a large amount of anthropogenic discharge [
27], NO
3− was 32.84 mg∙L
−1, much higher at inlets than that of 2.24 mg∙L
−1 found at the central lake region. It was utilized as an electron acceptor during DOC mineralization, and this only happened in the central water areas DC-1 to DC-10. HCO
3– and pH were the highest and the lowest at inlets, corresponding to 3.11 mmol∙L
−1 and 7.38. EC and TDS were also highest with 454.13 μS·cm
−1 and 346.67 mg∙L
−1, respectively, at those sites.
3.2. Sources of DOM Based on Spectral and Fluorescent Characteristics
The parameter of
a (355) represented the UV-absorption coefficient at 355 nm, an index for the content of CDOM [
30]. Its values ranged from 1.38 to 3.92 m
−1 in water above the deposition layer and from 1.38 to 4.15 m
−1 in the pore water. Fluorescent dissolved organic matter (FDOM) ranged from 27.47 to 116.61 quinine sulphate units (QSU) in water above the deposition layer and 70.06 to 115.51 QSU in the pore water. It was more abundant in the pore water and, at 38.09 QSU, it was higher than the water above the deposition layer. C1 and C2 were generally higher in pore water at DC-2–53.70 and 43.82 QSU, respectively. The lower S
R values explained the higher molecular weight of DOM at inlets. They were 1.40 and 0.92 on average in waters above the deposition layer, and in the pore water, the trough value of 0.51 presented at I-3. Previous studies used SUVA at 254 nm as a proxy for DOM aromaticity as it is strongly correlated with percentage aromaticity determined by
13C NMR [
18]. SUVA
254 indicates aromaticity of terrigenous origination, and SUV260 denotes the hydrophobicity of DOM, averaged as 2.83 and 2.73 L∙(mg C)
−1m
−1 and 5.28 and 4.64 L∙(mg C)
−1m
−1 in the above mentioned two parts of the water. The values of fluorescence intensity, humification (HIX), and biological (BIX) indices ranged from 1.91, 2.10, 1.15 to 2.06, 2.47, and 1.18 in lake water, respectively (
Table 1).
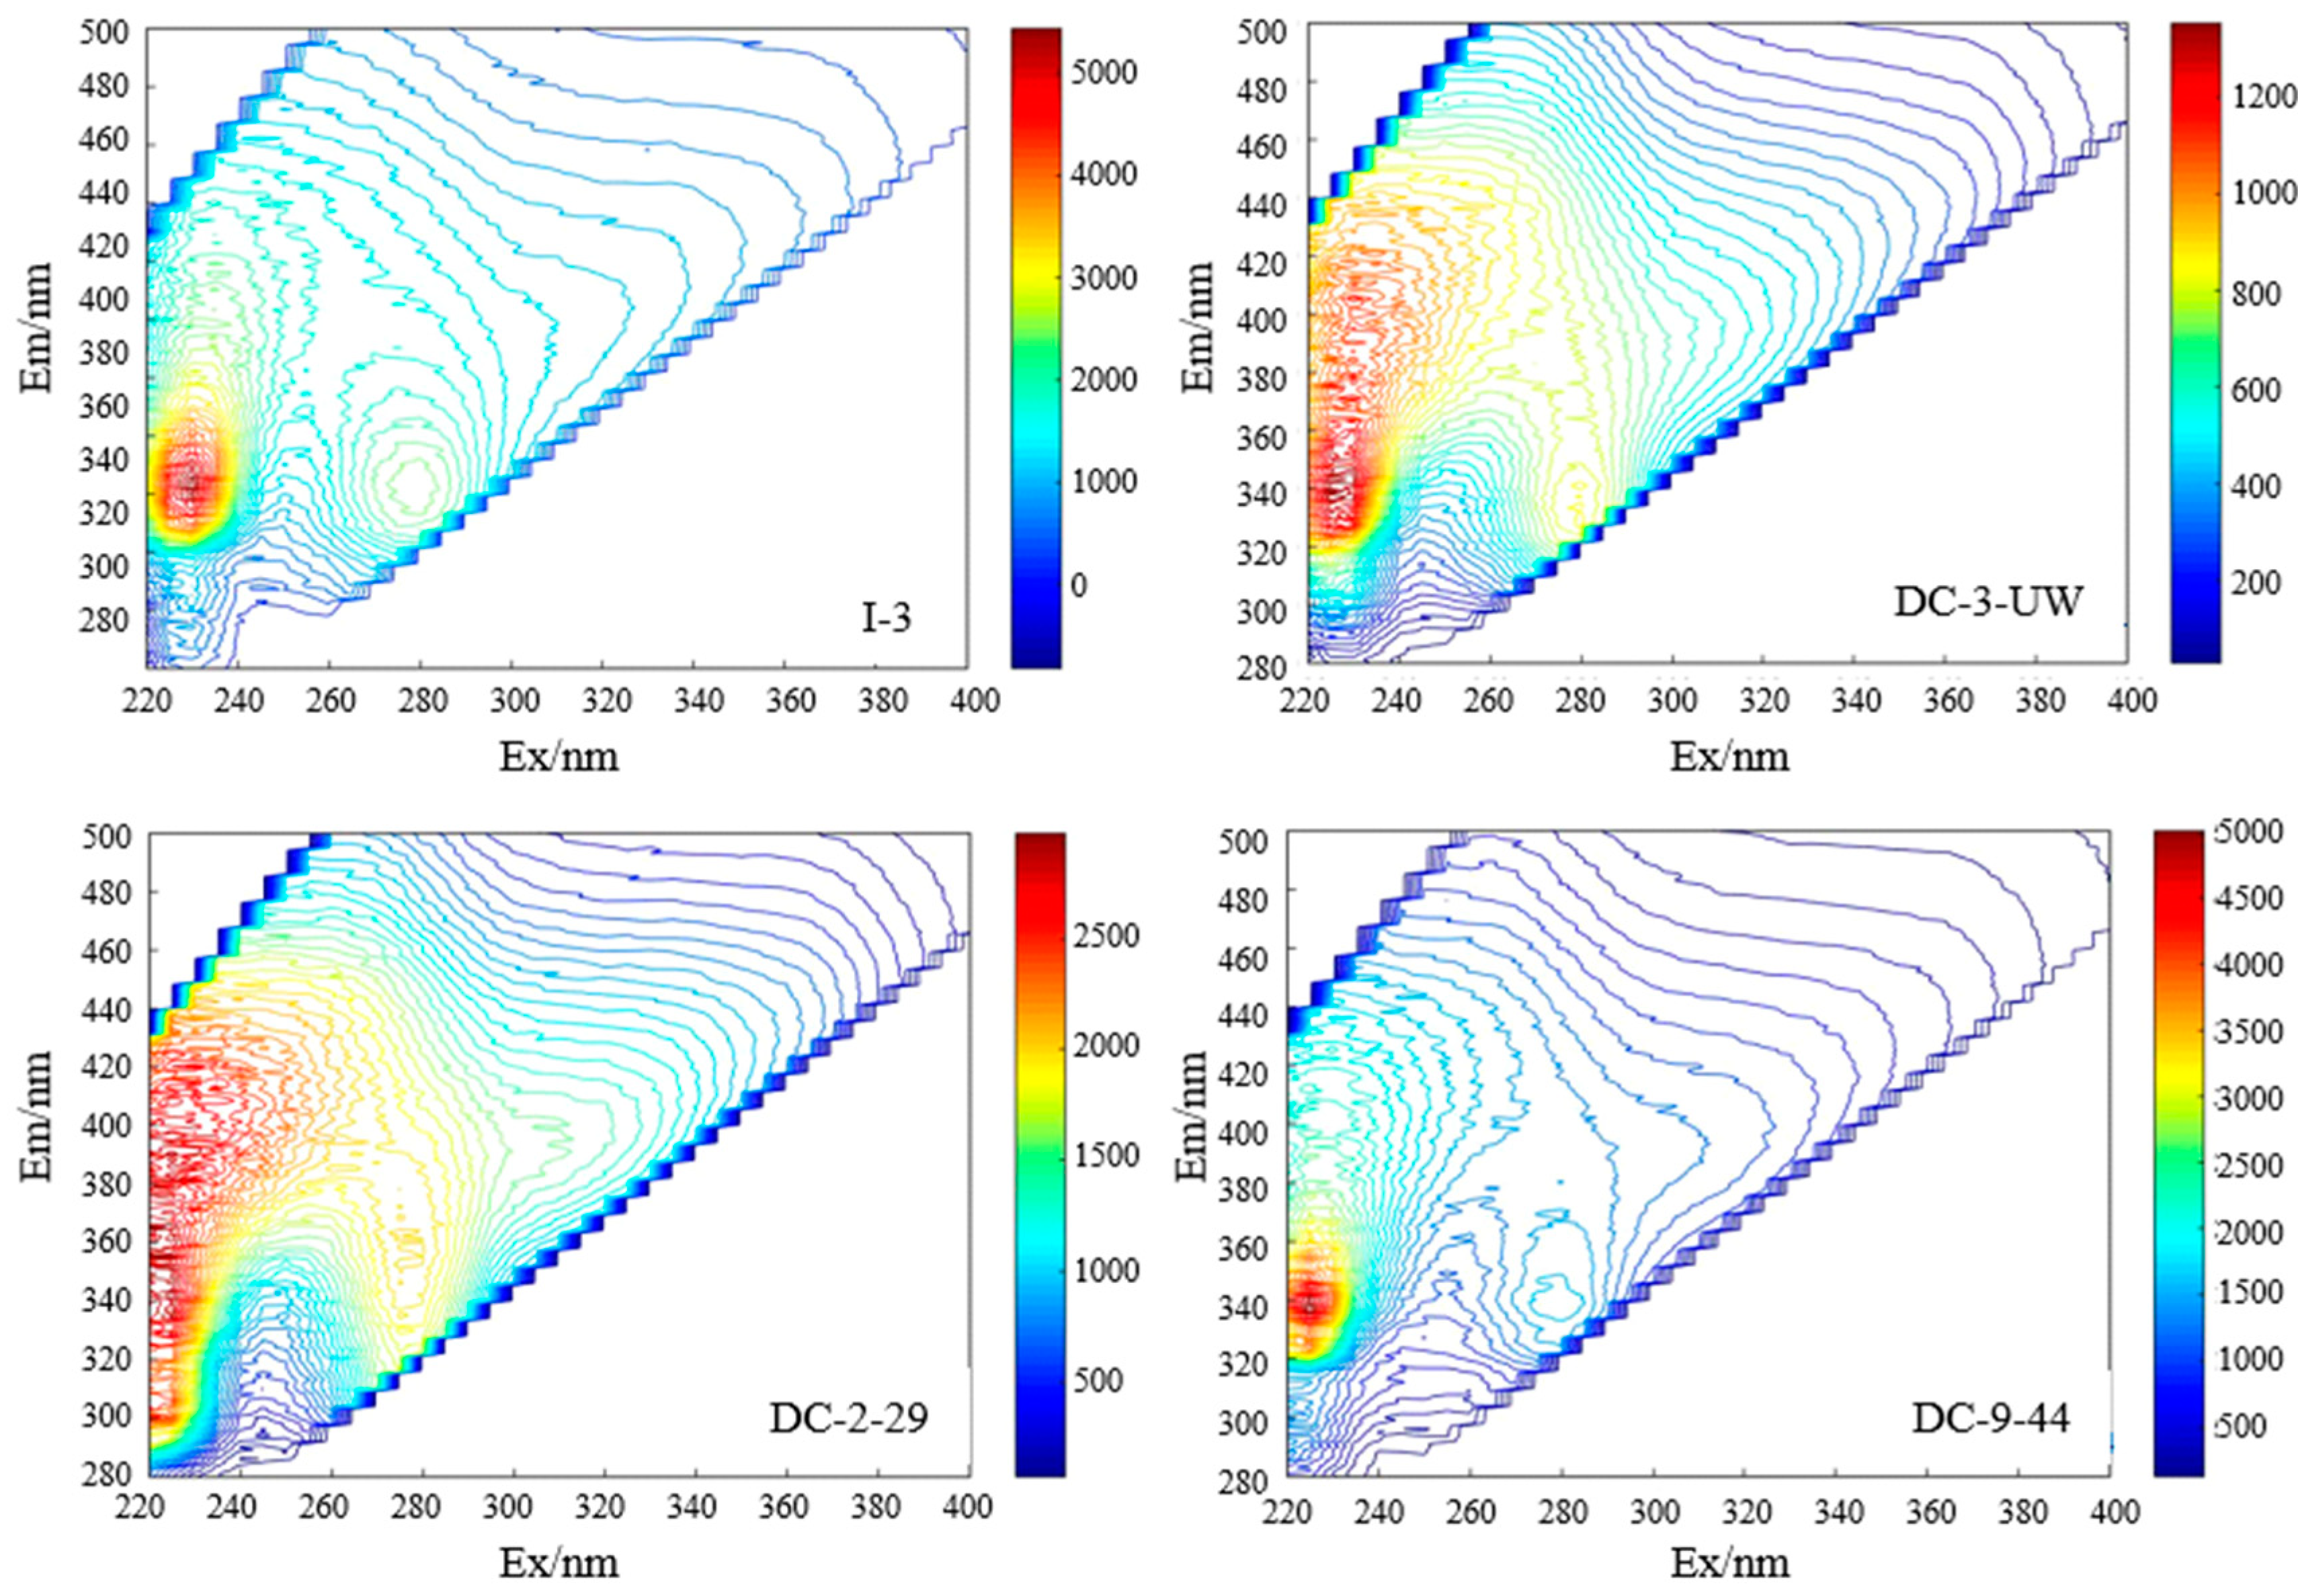
The fluorescence images of surface, underlying, and sediment pore water in Dianchi Lake are presented in
Figure 2. In water compartments, the fluorescence index averaged 1.9 or exceeded 2.0, suggesting that autochthonous OM was predominant for suspended particulates from authigenic micro-organic residues and algal excretion/detritus decomposition. High BIX values (>1) and low HIX values (<4) connected to autochthonous DOM [
31]. BIX ranged from 1.04 to 1.23 and a HIX range from 1.71 to 4.14 ordinarily fluctuated around 2.13 except for the only extreme value 4.14 at I-1, further illustrating the predominantly autochthonous origin of DOM and occasionally allochthonous origin in surface waters.
For this study, the DOC/FDOM/CDOM normalized Fmax values (F/DOC) and the percentage abundance of each component (%C1 and %C2) were included as PARAFAC indicators. Component 1 showed three fluorescence peaks (Ex/Em pairs at 250/440 nm; 315/440 nm; and 315/410 nm). Peaks at 250/440 nm and 315/440 nm were similar to the traditional terrestrial humic-like peak A and peak C [
32], and spectral features were also similar to other reported terrestrial humic-like matter. These two short wavelength (UV and visible spectrum) humic-like peaks originated from fulvic-like substances [
33,
34]. This fraction of fluorophores were more hydrophobic, larger in molecular unit, and non-biodegradable [
35]. Peak M was a typical humic-like fluorescence that was observed originally in productive oceanic environments but now has been found in freshwater impacted by agriculture [
36]. The fluorescence images of fluorescent components in the water compartments of Dianchi Lake are presented in
Figure 3. Component 2 showed two fluorescence Ex/Em maxima such as peak Tuv at Ex/Em = 225/341 as the strong peak with high fluorescence intensity, whereas peak T at Ex/Em = 275/341 was shown as a minor peak with low fluorescence intensity. This component corresponded to a protein-like substance tryptophan with two fluorescence peaks at ultraviolet and visible regions [
37]. Component 2 (Ex/Em = 225/341 and 275/341) came from highly proteinaceous material. Protein-like substances with autochthonous sources were easily adsorbed onto the sediment minerals and/or retained by the microorganisms on the sediments [
38,
39]. It was suggested that humic-like components originated from microbial/algal activities, having probably been associated with a more condensed structure and larger molecular size and a relatively more refractory nature, whereas the tryptophan-like C2 fluorophore was less structurally condensed and more labile [
34]. The highest FDOM appeared in pore water DC-2 by 98.52 QSU. C1 and C2 nearly accounted for 50% of FDOM in surface and underlying water, respectively, but C2 was slightly higher in pore water than that in water above the deposition layer. The percentage of C1 in FDOM was always anti-correlated with that of C2, which indicated that these two components mutually transformed in the above mentioned water compartments. FDOM also accounted for the highest proportion in DOC in pore water at DC-2 by 25.3 L∙QSU∙(mg C)
−1. Whatever the FDOM or the percentages of FDOM in DOC were, the values were both higher in pore water than in water above the deposition layer, e.g., they merely averaged 46.1 QSU and 8.33 L∙QSU∙(mg C)
−1 in underlying waters. Fluorescence intensity of humic acid decreased with decreasing molecular weight and pH and increasing ionic strength [
40]. It was the same phenomenon for molecular weight with pH values in surface water at Dianchi Lake but with converse ionic strength. Proportions of humic-like DOM increased with ionic strength increasing, both reaching the highest at inlets with 12.1 L∙QSU·(mg C)
−1 and 0.01 mol·L
−1. The above correlations between humic-like DOM and molecular weight, pH, and ionic strength were not observed in the underlying and the pore water. The humic-like organic matter was a major source for DOM in Dianchi Lake.
3.3. Analysis of Relationship between Water Chemistry and Characteristic of DOM in Dianchi Lake Waters
Dissolved organic carbon in water could be produced from the disruption or the disintegration of organomineral complexes and could decrease binding of humic acid (HA) or fulvic acid (FA) by metal oxides, osmotic shock, and lysis of microbial cells [
3,
11,
41]. Therefore, part of DOC resulted from bedrock mineralization and erosion along with the degradation of OM by microbial cells, and this kind of collapse effect was most evident at inlets. The total fluorescent intensity in surface waters was highest at inlets with 137.69 QSU. Nutrients such as N, P, and Si accumulated at inlets; they had the same horizontal trends with total FDOM (R
2 = 0.87, P ≤ 0.01), indicating that they all originated from the disintegration and the degradation of particle encapsulation of organic matter into mineral structures. This opinion was verified from the obvious positive correlations between FDOM and HCO
3−, Ca
2+, Na
+, K
+ (R
2 = 0.95, P ≤ 0.01), ratios of Ca/Mg and Na/K (R
2 = 0.94, P ≤ 0.01), and a significant negative correlation between FDOM, pH, and DO (R
2 = −0.66, P ≤ 0.01). Other than release from mineral lattice, the fluorescence effect of DOM could be intensified by an increase of Ca
2+ and Mg
2+ [
19,
42].
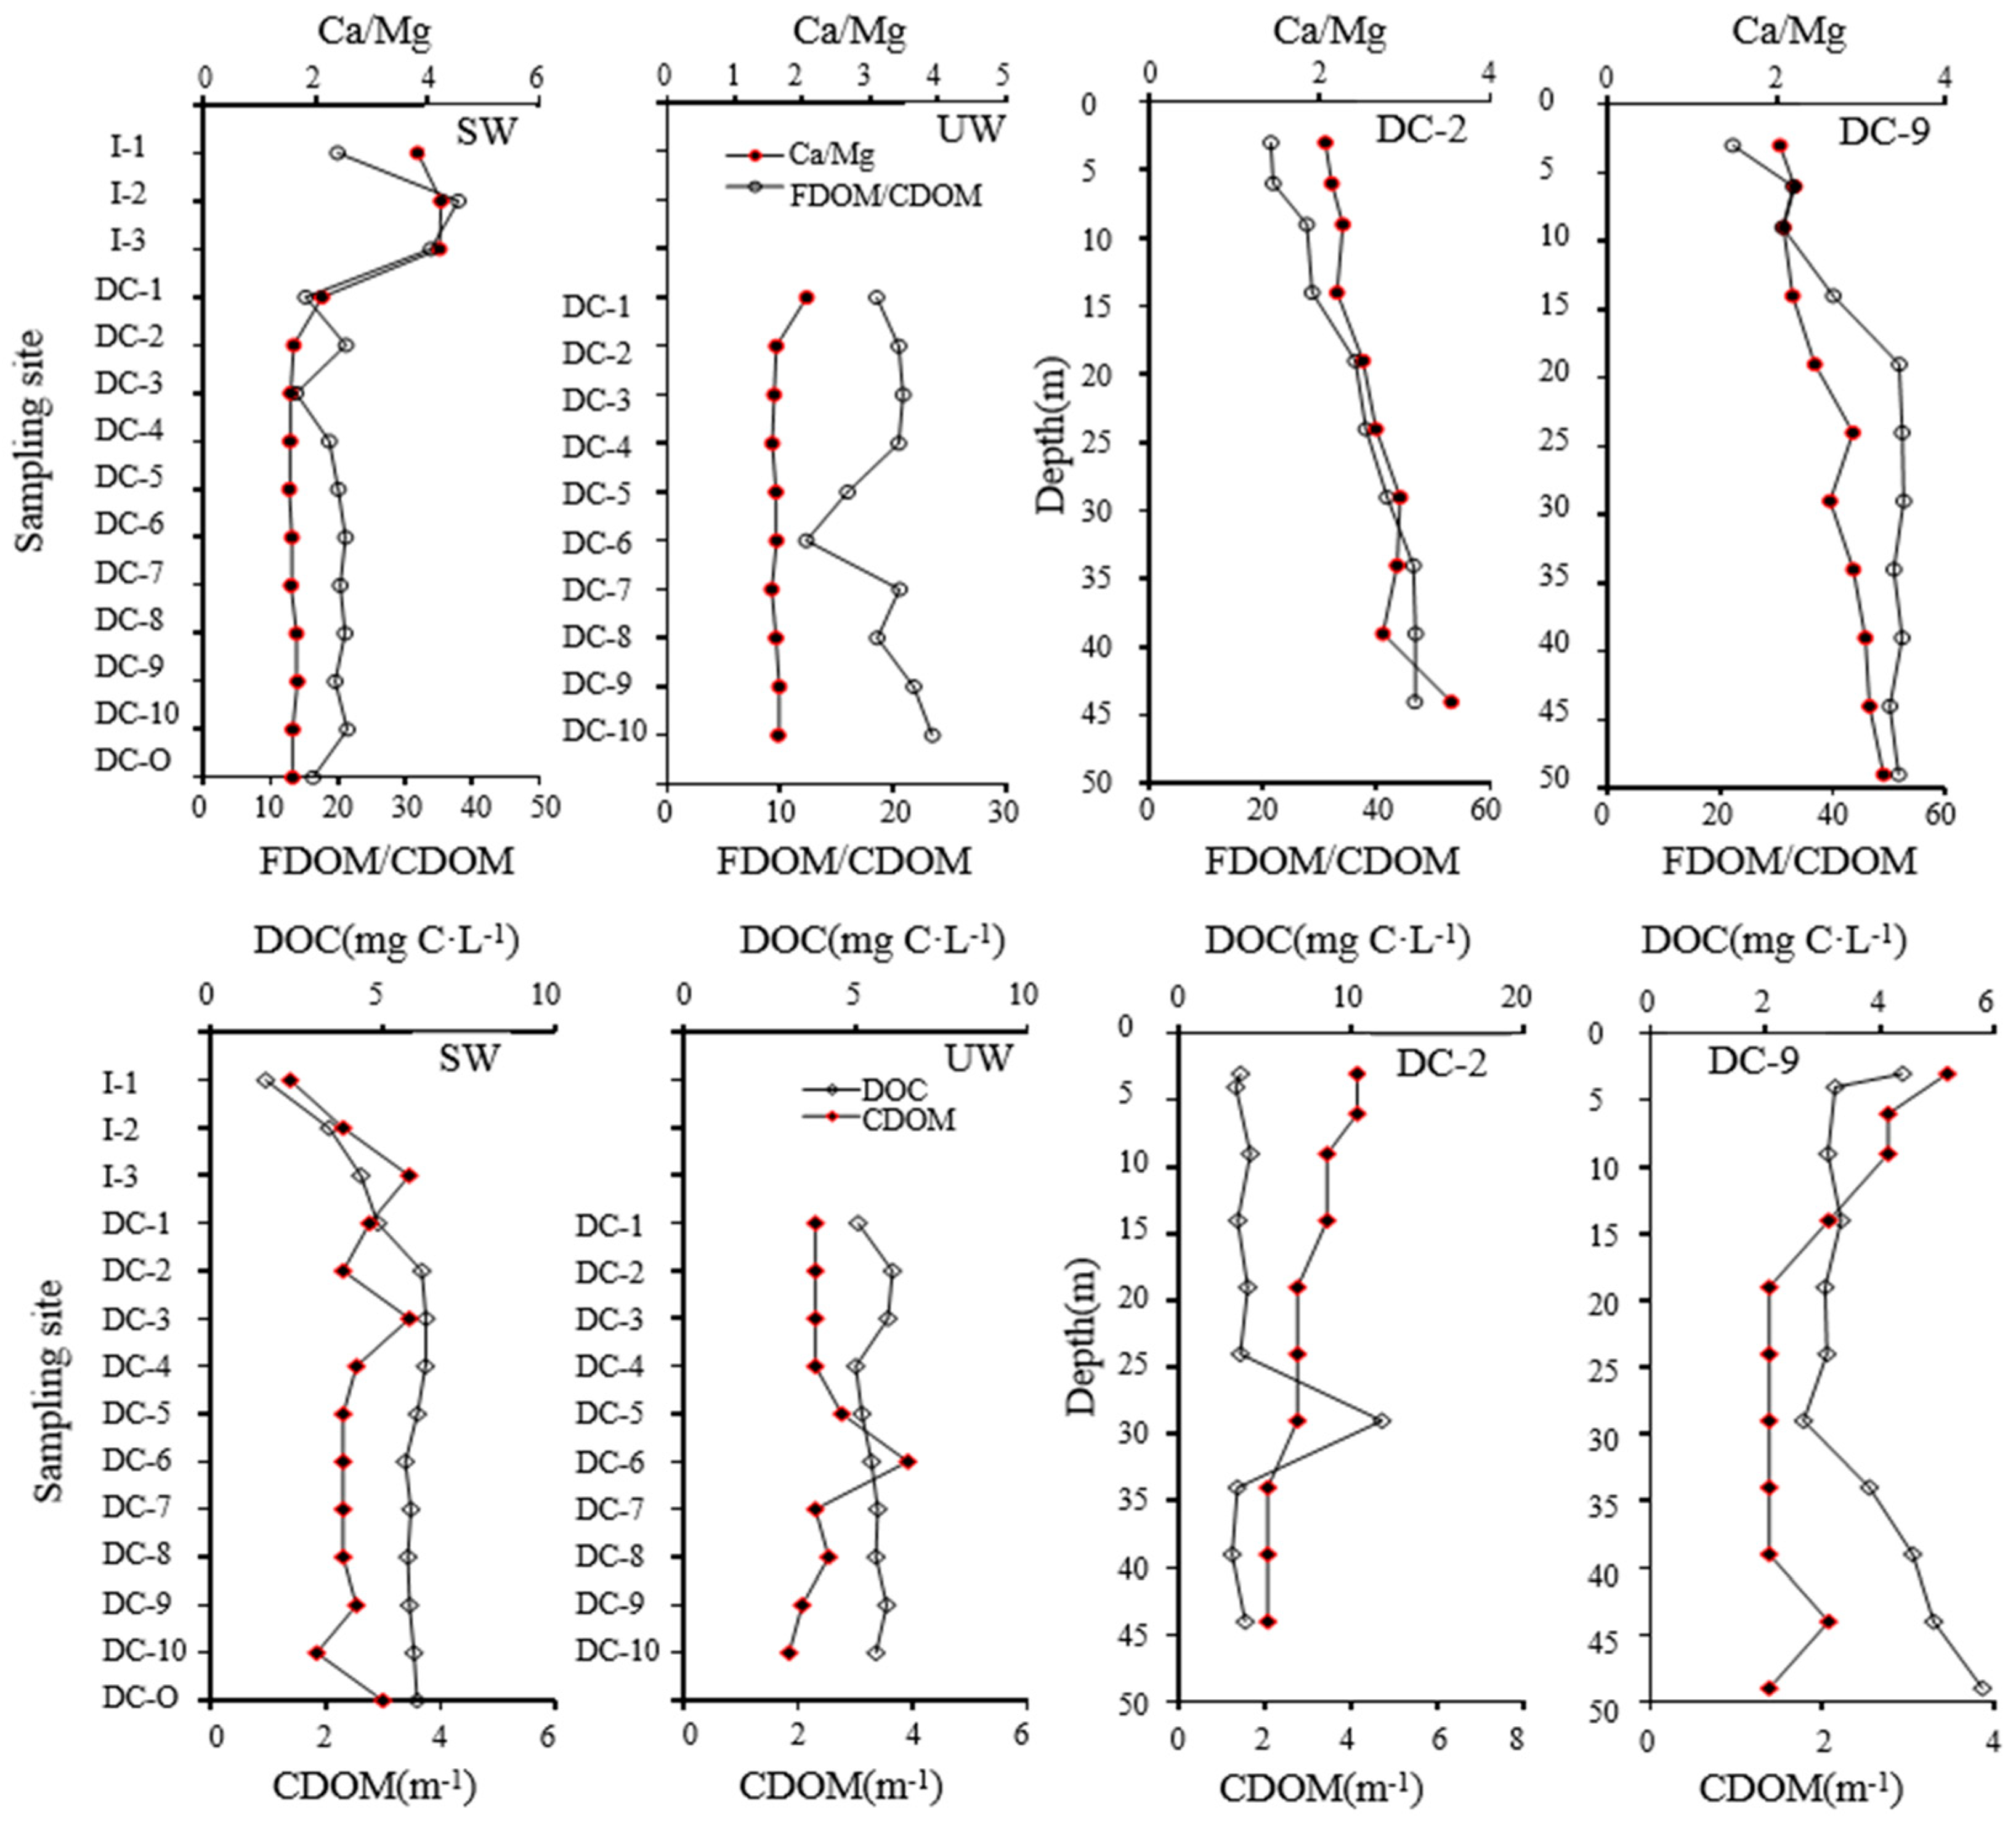
Ratios of Ca/Mg consistently fluctuated around 1.64 from DC-1 to DC-10 in the central lake (
Figure 4) but reached up to 4.09 abruptly at lake inlets. Higher water alkalinity resulted from particulate and dissolved organic matter anaerobically decomposing in surface water, producing HCO
3- and H
+ that both behaved identically. Organic matter (particulate and dissolved organic matter) was degraded anaerobically the most at lake inlets, where pH and DO values dropped to their lowest at 7.13 and 2.98 mg·L
−1. FDOM was concentrated rapidly at inlets and was thereafter basically unchanged and fluctuated around 56.43 QSU in the central lake region. FDOM/CDOM indicated the ratio of intensity of florescent DOM to that of chlorophore DOM [
6,
12,
19]. The ratios of FDOM/CDOM in lake inlets and surface water were generally lower than those in pore water, suggesting that humification plays an important role in DOM transformation in the sediments.
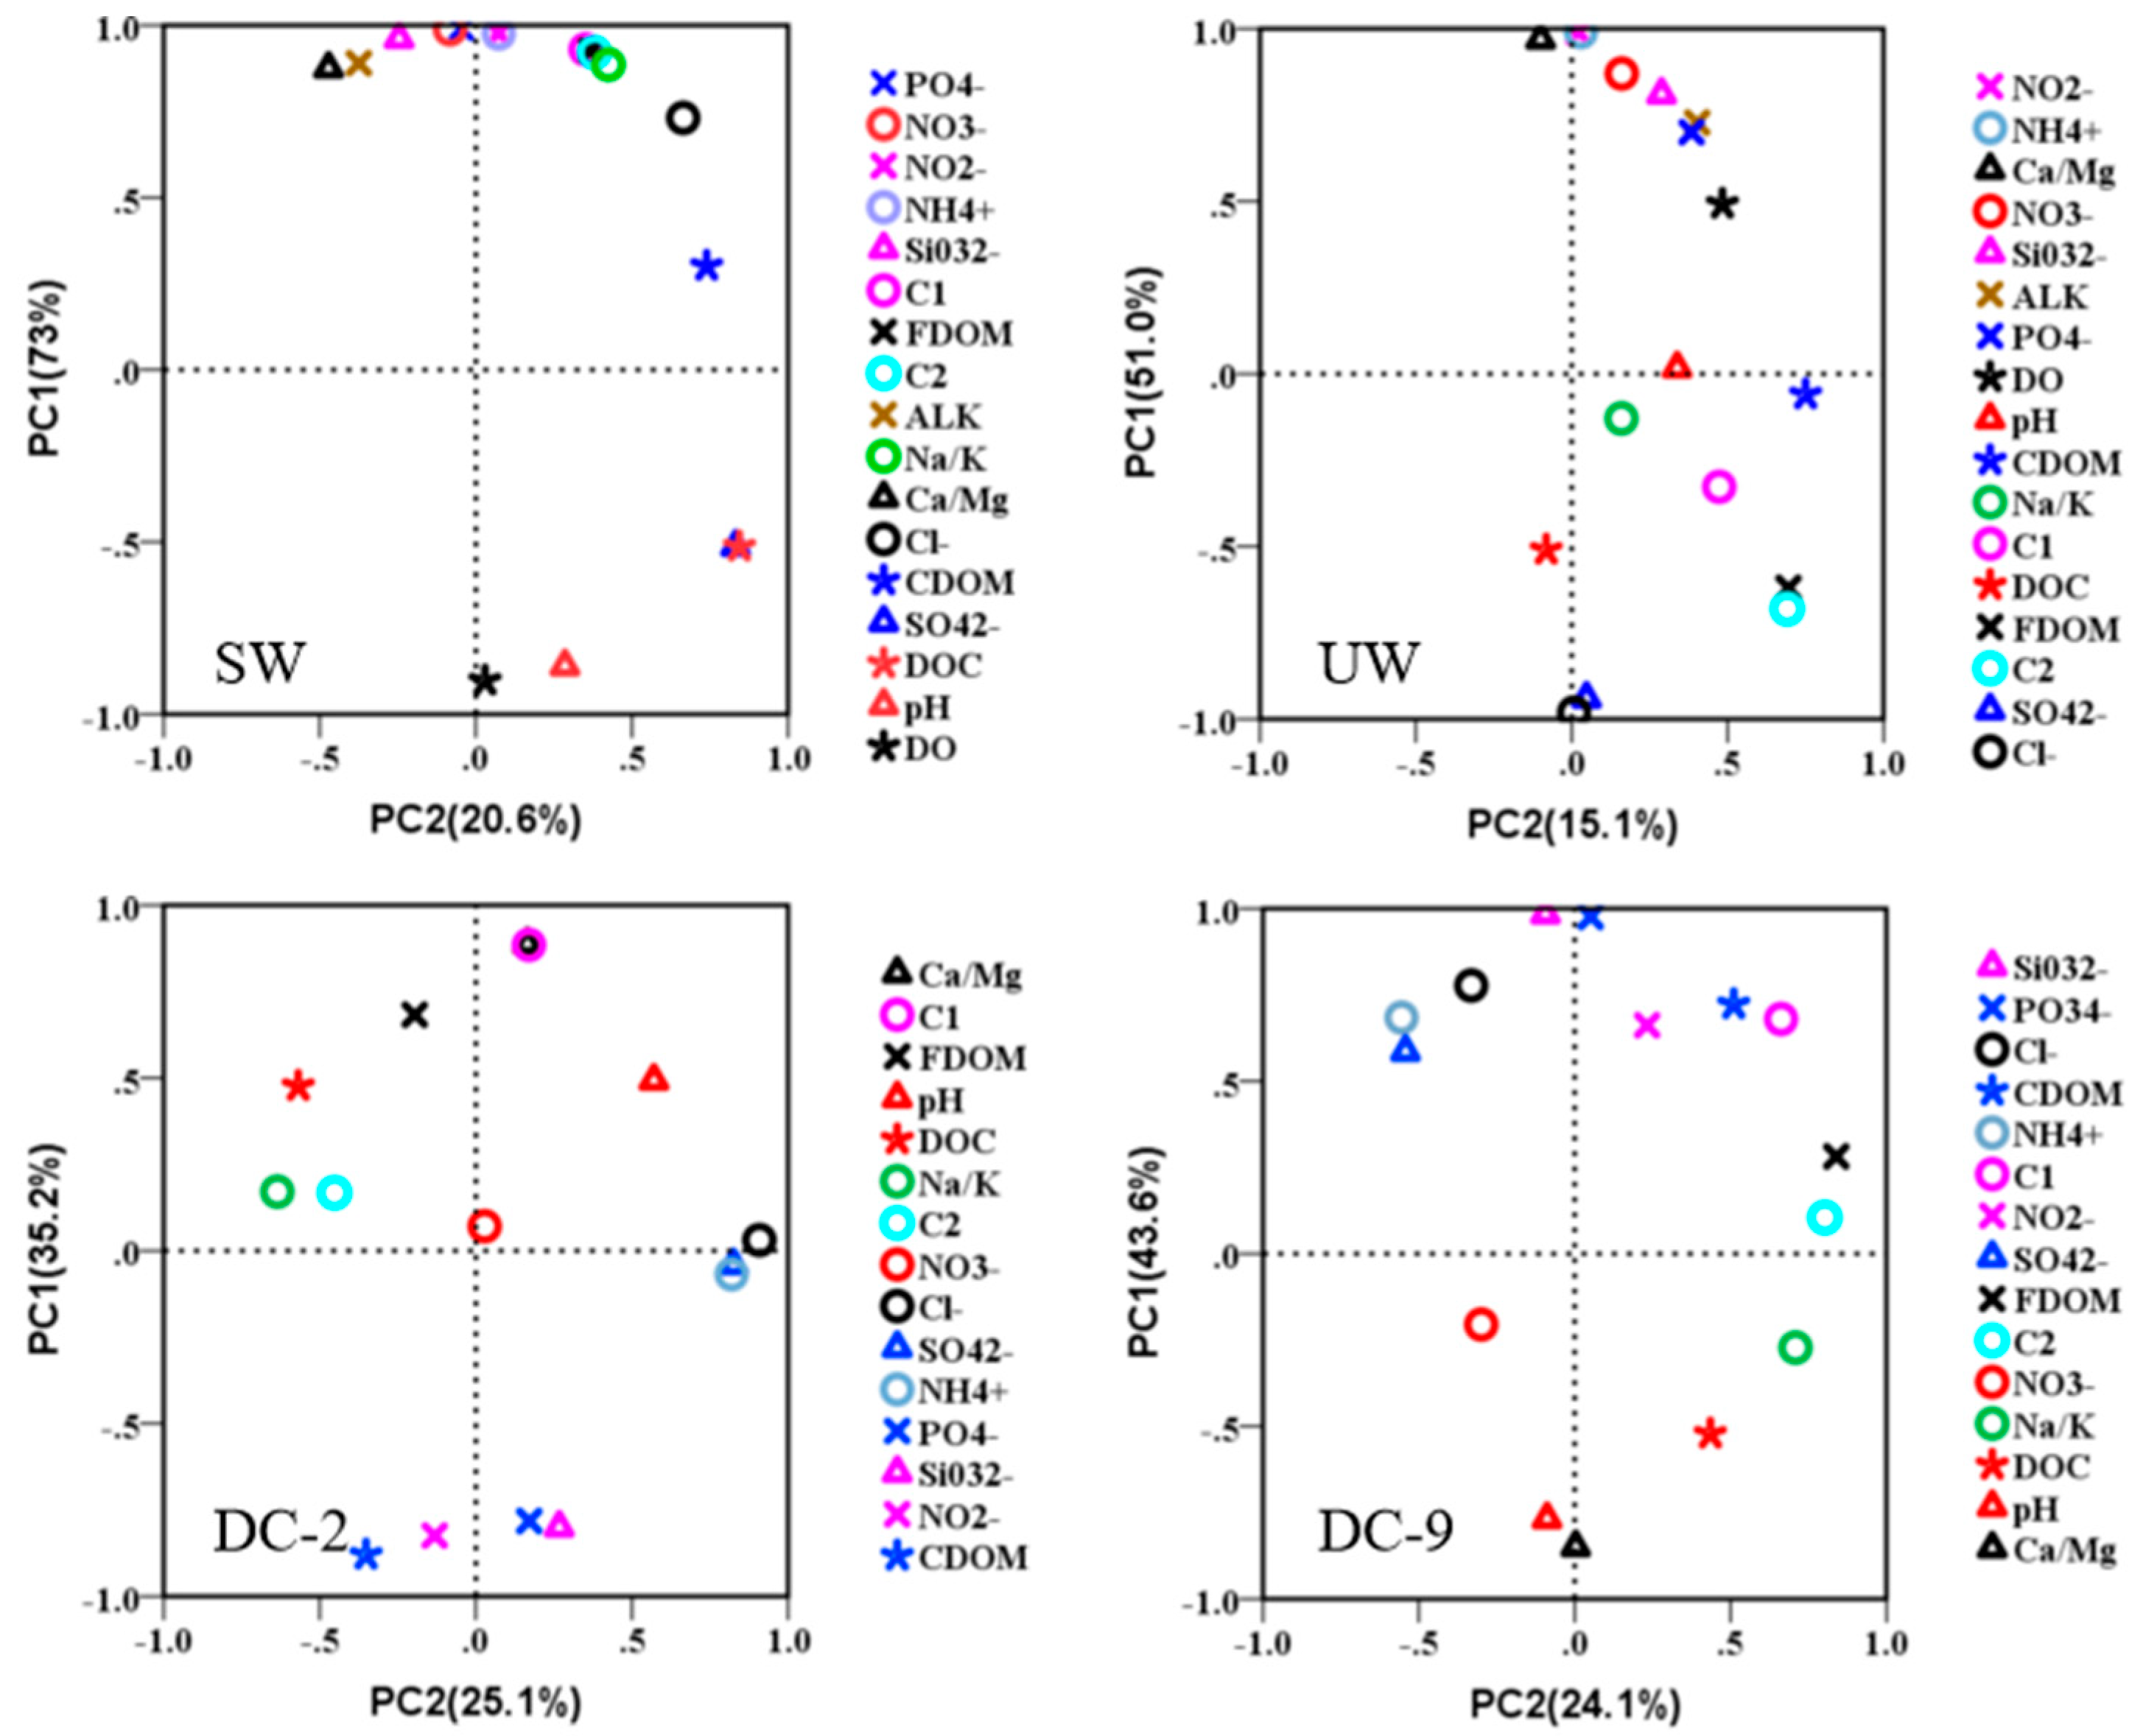
These ingredients were categorized into two primary components based on principal component analysis, and PC1 took a higher quotient. Closer to one on the vertical line indicates the stronger correlations with PC1 (
Figure 5). Principal component analysis revealed that such nutrients as N species, Si and P, FDOM, and mineral elements were the principal ingredients in surface water. Particulate degradation was associated with carbonatite and halide rock structures. The formation of encapsulation of bacterial/algal cells into mineral lattice or input from ground runoff resulted in a high score of PC1 and a low score of PC2 in surface water based on principal component analysis (
Figure 5). DOC ranged from 5.01 to 6.08 in underlying water, with a highest value of 6.08 mg C·L
−1 at site DC-2 and a minimum of 5.01 at DC-4. HCO
3− and did not show any correlation to pH and DO; thus, it seemed that a series of biogeochemical processes of organic matter were irrelevant to mineral disintegration. As illustrated in
Figure 5, PC1 was mainly composed of N, P, Si, and Ca/Mg in the underlying water, and they originated from disintegration of carbonatite minerals but significantly anti-correlated with SO
42− and Cl
−, fully demonstrating that S-/Cl-associated halide was transformed microbially into carbonatite or that mineralogical rearrangement happened. DOM therefore was produced and consumed during a series of complicated reactions.
In the pore water of site DC-2, positive correlations between DOC and the fluorescent intensity of the protein-like substance (protein-like intensity and DOC, R
2 = 0.77, P ≤ 0.01) were observed, demonstrating that DOM was mainly the product of bacterial activities, and the vertical distribution of protein-like components manipulated the overall profile of DOM. DOC ranged from 3.1 to 11.81 mg C∙L
−1, and it abruptly went up to 11.81 mg C∙L
−1 at 29 cm from 3.58 mg C∙L
−1 at 24 cm and remained almost unchanged at any other depths. Microbes were observed to bind sediment using extracellular polysaccharides and occurred in patchy distributions within sediments [
43]. SiO
32−, NO
2−, and PO
43− were observed as highest in 9 cm deposits on the surface with 20.52, 0.73, and 0.84 mg·L
−1, respectively. DOM formation and N, P, and Si mobilization in pore water referred to early diagenetic reactions mediated by bacteria [
16] (
Figure 5). Ratios of Ca/Mg showed the highest value yet of 3.54 at 44 cm depth and changed conversely to the above mentioned nutrients (
Figure 5). Moreover, it showed that CDOM originated from encapsulation disintegration of POM-carbonatite with microbial mediation in terms of negative correlations between CDOM and ratios of Ca/Mg (R
2 = −0.73, P ≤ 0.01). CDOM changed positively with Mg dissolution rate relative to that of Ca from mineral detritus and had stronger affinity to Mg than Ca. NO
2−, as the electron acceptor, probably played a particularly active role for FDOM production in that, when NO
2- rose to a peak of 727.77 μg∙L
−1 at 6 cm depth, FDOM instead dropped to a trough of 90.76 QSU. Percentages of CDOM in DOC or FDOM in CDOM showed significantly negative or positive correlations to ratios of Ca/Mg. This result indicated that quotients of organic components in DOC were related to decomposition of POM, which was complexed or encapsulated into mineral particles.
DOC in pore water at DC-9 exhibited a profile decreasing in the upper layer and increasing in the deep layer, and the minimum was 2.67 mg C·L
−1 at 29 cm. DOC gradually accumulated along the deposition column with attenuation of sulfate-reducing bacteria behaviors. The profile trends for quotas of FDOM in CDOM were just like those of dissolved Ca in Mg (FDOM/CDOM and Ca/Mg, R
2 = 0.67, P ≤ 0.01), suggesting that the relative amount of fluorescent components in chromophores was closely associated with lattice structures of carbonatite minerals. In contrast to pore water at DC-2, PC1 of high score was negatively correlated to ratios of Ca/Mg, whereas it was positively correlated to PO
43−, SiO
32−, and CDOM (
Figure 5). This result was attributed to the dynamics of P-, Si-consuming rate, and Ca-dissolving rate relative to Mg. P, Si, CDOM, and Ca/Mg were homologous from mineral disintegration during diagenesis [
9,
10,
21]. Although values of Ca/Mg increased along the deposition column, the growth rate of ratios still remained unchanged or even slightly attenuated instead of increasing. Two slopes of regression equations in models of both growth rates were 0 and 0.03. Comparatively, the growth rates of CDOM and dissolved P and Si were significantly elevated (
Figure 5). Thus, the analysis suggested that DOM in Dianchi Lake waters was correlated closely and significantly with water chemistry and nutrients.
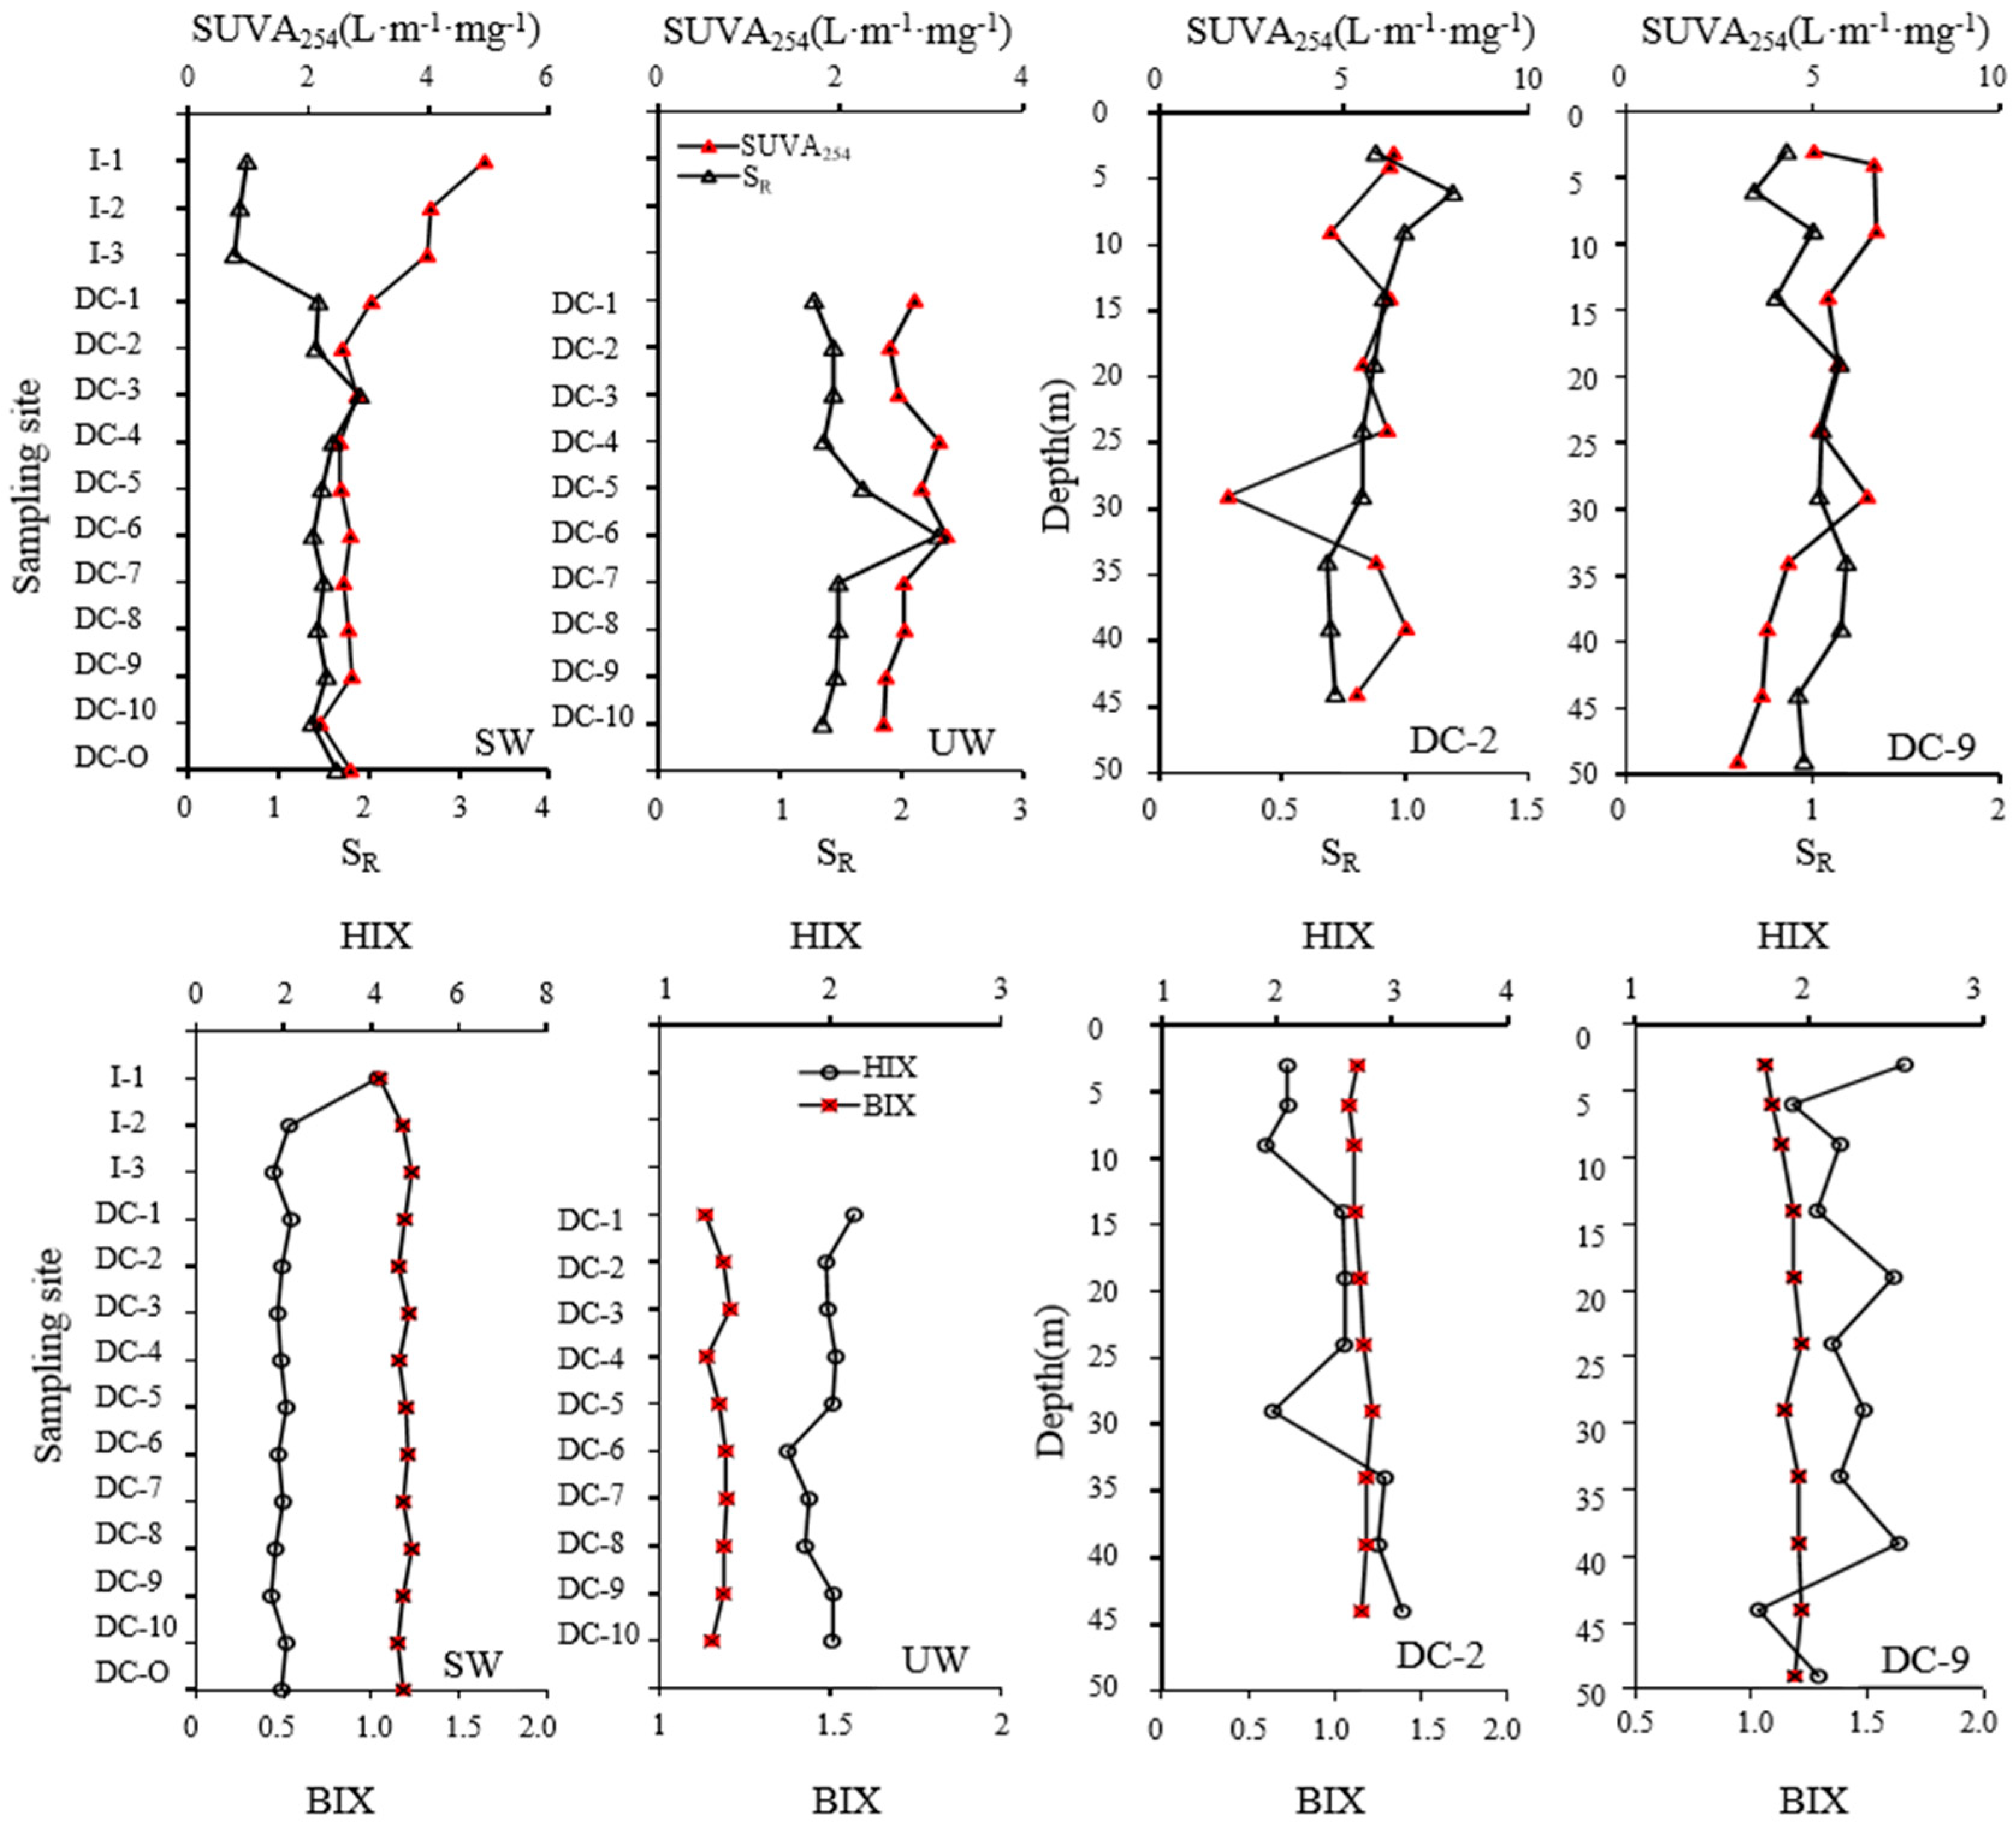
3.4. Optical Characterization of DOM for Tracing Moieties Conversion in Dianchi Lake Waters
SUVA
254 was used to characterize the moieties of aromaticity and double-bond structures. SUVA
260 was indicative of hydrophobic moiety in DOM. Molecules of aromaticity and double-bond conformation constituted the primary part in hydrophobic fractions [
44]. E
253/203 denoted a species of substituted groups and the degree of substitution on aromatic rings. Percentages of FDOM or CDOM in DOC varied identically to the parameters SUVA
254 and SUVA
260 (R
2 = 0.92, P ≤ 0.01), whereas the percentages varied conversely to E
253/203 (R
2 = −0.82, P ≤ 0.01). Percentages of these two moieties in DOM amounted to up to 31.65 QSU∙L∙(mg C)
−1, 0.87 L∙m
−1∙(mg C)
−1 at inlets. It suggested that the structures and the properties of DOM were regulated by the quotients of FDOM and CDOM in DOC. Aromaticity and hydrophobicity decreased with FDOM and CDOM percentages in attenuating DOM. SUVA
254 decreased quickly from 4.92 at inlets to 3.05 L∙m
−1 (mg C)
−1 at DC-2, whereas E
253/203 values increased initially from 0.01 at inlets to 0.13 at DC-2 and thereafter kept constant. Higher percentages simplified substituted groups on aromatic rings, aliphatic chains were considered the principal substituted types, and structures of DOM became firmer in the central water area compared to that at inlets. Aromaticity and hydrophobicity attenuated as HIX decreased (
Figure 6), mainly due to biological activities being more frequent at the central lake region than at inlets from data of BIX. C1 of FDOM and CDOM did not originally correlate with each other, but their proportions in DOC varied identically (R
2 = 0.74, P ≤ 0.01) with higher levels of 12.10 QSU∙L∙(mg C)
−1 and 0.87 L∙m
−1∙(mg C)
−1 at inlets, demonstrating that they were produced and accumulated in specific proportions. The proportions of C1/CDOM controlled the size of organic fractions (C1/CDOM and S
R, R
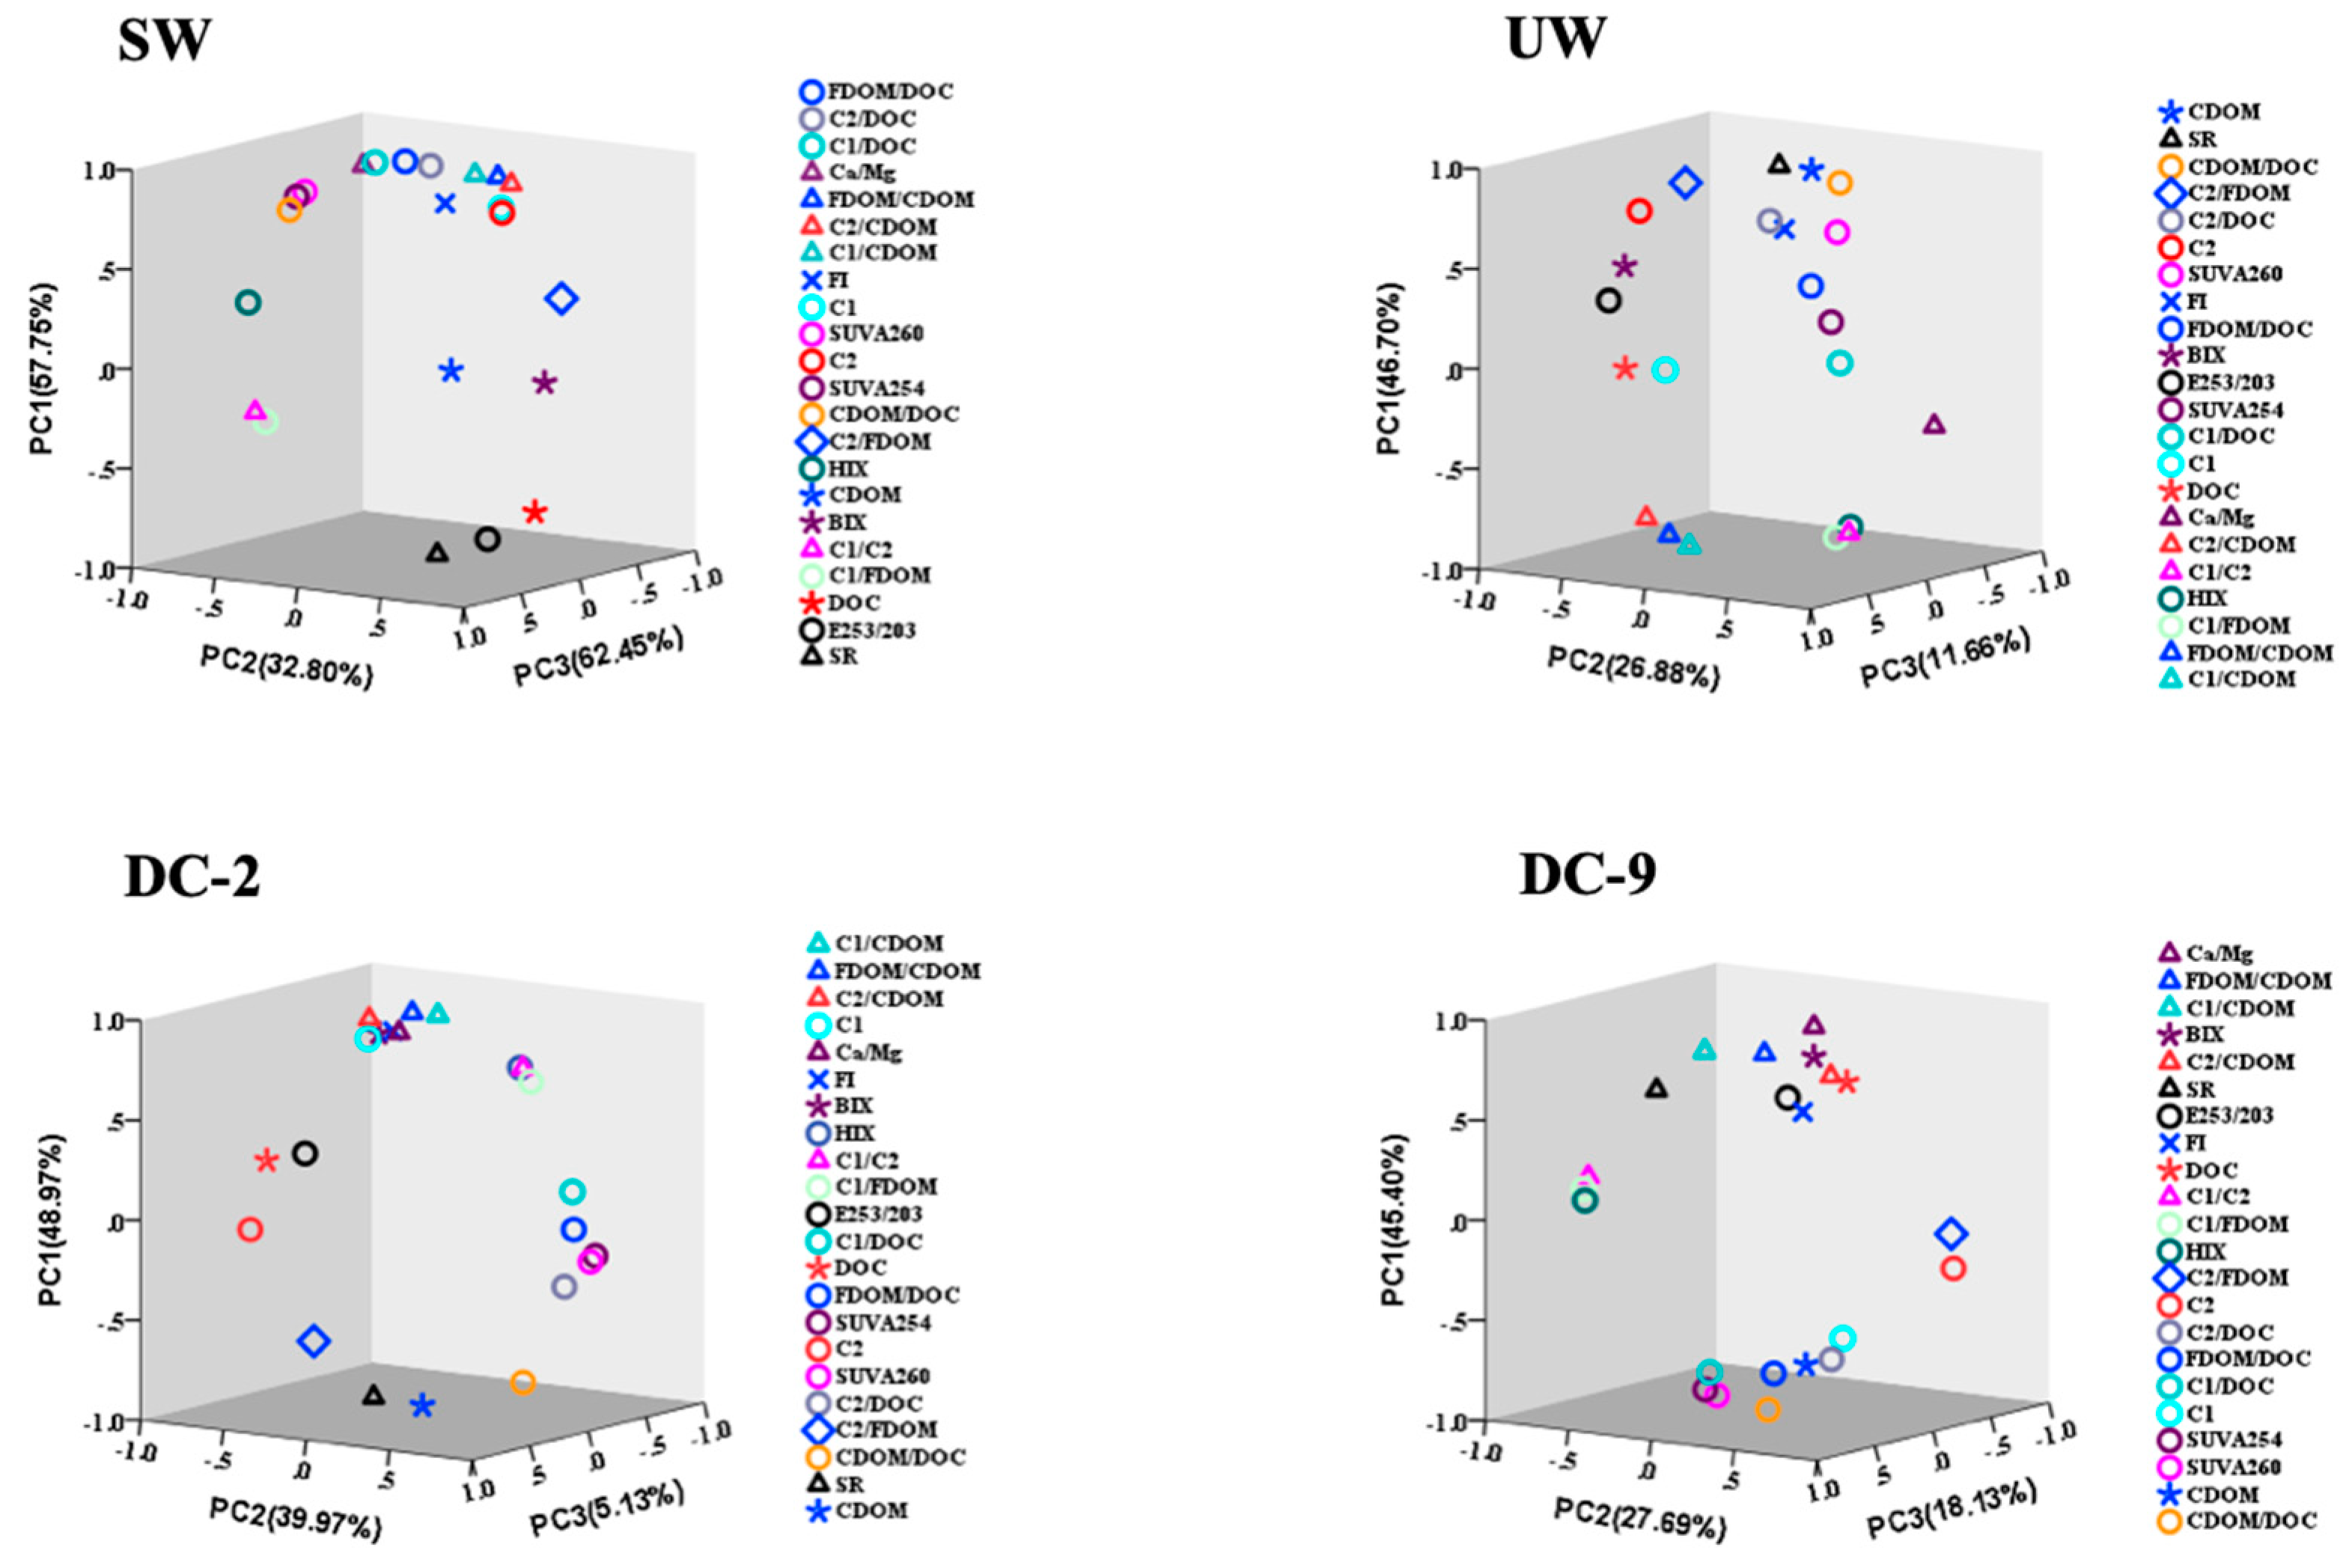
2 = −0.76, P ≤ 0.01) that molecular weight was relatively lower than that of inlets. In
Figure 7, PC1 was mainly represented by aromaticity and hydrophobicity of water, which was regulated by percentages of CDOM or even FDOM in DOC. S
R and E
253/203 values increased with these optical properties attenuated, and molecular weight of DOM and properties decreased, whereas molecular structure became firmer and less susceptible to be utilized by microbes from inlets to the central water area. DOM from fresh terrestrial plants/anthropogenic wastes should have had a high score of PC1 due to elevated proportions of CDOM in DOC at inlets but a low score of PC2 due to microbial humification by utilizing proteins in FDOM (
Figure 7).
SUVA
254 and SUVA
260 in underlying water were highest at site DC-6 with 3.16 and 2.99 L·(mg C·m)
−1, respectively, and abruptly dropped to minimums at DC-10 for SUVA
254 and SUVA
260 with 2.47 and 2.30 L·m
−1·(mg C)
−1. The aromaticity and the hydrophobicity of DOM were determined by the percentages of CDOM in DOC (CDOM/DOC and SUVA, R
2 = 0.84, P ≤ 0.01). CDOM/DOC displayed an increasing-decreasing horizontal trend, and the highest value was 0.72 L·m
−1·(mg C)
−1 at DC-6. The S
R value exhibited a consistent trend with CDOM/DOC (R
2 = 0.78, P ≤ 0.01) and the opposite trend with C1/CDOM (R
2 = 0.78, P ≤ 0.01)
, expounding non-chromophores in DOM and the fluorophores in CDOM, which resulted in higher molecular weight. Then, bio-utilization of DOM reduced and humification elevated. PC1 had a high score, mainly due to CDOM percentages in DOC (specifically protein-like percentages in DOC). PC2 occupied the lower score precisely due to humification being decreased and fluorophores being bio-transformed into non-fluorophores [
17,
33].
SUVA
254 and SUVA
260 averaged 5.50 and 4.89 L·(mg C·m)
−1 in pore water at site DC-2, dropping dramatically to troughs at 29 cm sediment depth with 1.87 and 1.64 L·(mg C·m)
−1. SUVA values and FDOM/DOC had peak values at 39 cm with 6.69 and 5.79 L·m
−1·(mg C)
−1 and 38.9 QSU·L·(mg C)
−1. Percentages of FDOM in DOC had a similar profile to values of SUVA
254 and SUVA
260 (R
2 = 0.92, P ≤ 0.01). The results indicated that fluorescent substances regulated properties of DOM greatly in biogeochemical processes; the larger percentages of fluorescent components in DOM resulted in the more stable properties of DOM. FDOM quotients in DOM regulated aromaticity and hydrophobicity of DOM, and the frequency of microbiota behavior was reflected in the percentages of fluorescent components in chromophores with the result that more frequent activities of microbiota resulted in higher percentages for FDOM in CDOM, especially percentages of C2 in CDOM (BIX and C2/CDOM, R
2 = 0.8, P ≤ 0.01). It explained that microbiota behaviors were mainly reflected in the protein-like fluorescence in chromophores, and non-fluorescent fractions in CDOM were also transformed into fluorescent fractions with microbial mediation [
2,
12]. This result showed that humic substances originated in part from microbial activities, and protein-like fractions were indeed transformed into humic fractions from anti-correlations of quotient data for C1/FDOM and C2/FDOM. Meanwhile, non-chromophores in DOM were also bio-available from the data between the ratios of CDOM/DOC and BIX. Molecular weight of DOM increased gradually under intense metabolic behaviors of microbiota along the deposition column, and bio-aggregation was mainly low molecular weight reflected in percentages of FDOM in CDOM (specifically in quotients of C1/CDOM). Intense microbial metabolism resulted in molecular size shrinking within 6 cm of the surface layer sediments such that the S
R reached the peak value of 1.19 at 6 cm depth, and thereafter molecular weight started to grow (BIX and S
R, R
2 = −0.65, P ≤ 0.01). PC1 for optical properties significantly correlated with FDOM percentages positively in DOC as well as hydrophobicity and aromaticity of DOM.
In the pore water of site DC-9, percentages of FDOM in DOC showed positive correlations to SUVA values, and aromaticity and hydrophobicity attenuated with decreasing quotients of fluorophores in DOC along the deposition column (FDOM/DOC and SUVA. R
2 = 0.86, P ≤ 0.01) (
Figure 7). In contrast to pore water at DC-2, SUVA
254 reached up to 6.47 at 30 cm deposition depth (
Figure 6). BIX was regulated by ratios of FDOM/CDOM—specifically by quotients of C2/CDOM—which indicated that whatever the humic or the non-fluorophores’ transformation to proteins in CDOM were, both provided abundant bioavailable fractions and contributed a great deal to bio-activities [
17]. Meanwhile, transformation from chromophores of non-fluorescence emission to non-chromophores also resulted in more active biological behaviors (CDOM and BIX, R
2 = −0.69, P ≤ 0.01). The molecular weight of DOM was mainly related to humic percentages in CDOM [
16], demonstrating that the high molecular weights of non-fluorophores in CDOM were degraded along the deposition column, and humic-like DOM was mainly composed of low molecular weight components. PC1 was dominated primarily by CDOM percentage in DOC. When this proportion was elevated, aromaticity and hydrophobicity of DOM increased with it, as did molecular weight, whereas this high proportion for CDOM in DOC created low microbial-associated performances on surface sediment of 9 cm. Non-fluorescent fractions in CDOM and non-chromophores in DOC were both bio-available (
Figure 7).
These optical indexes not only depicted the biogeochemical mobility and the transformation, they were also associated with lake eutrophication. Optical parameters were used to indicate the trophic state of the reservoir, and it was found that SUVA
254 and HIX had a good relationship with the modeled trophic state index. These optical indices reflected the trophic state of natural water [
12]. HIX showed a converse trend to BIX in surface and underlying water (R
2 = −0.76, P ≤ 0.01) in that they were regulated by C1/FDOM and C2/FDOM, and these two components were mutually converted. HIX in the underlying and the pore water at DC-2 also had a consistent relationship with molecular weight, and higher humification resulted in higher molecular weight (
Figure 7). In effect, molecular weight increased with depth mainly due to bio-aggregation in pore water at DC-9. Percentages of CDOM in DOC played an important role in predominating aromaticity, hydrophobicity, and molecular weight except for the pore water at DC-2. Terrestrial aromaticity SUVA
254 was regulated by humic components in DOC except for the underlying water. Bio-activities in water above the deposition layer could intervene in the conversion of proteins and humic-like components in FDOM [
11,
17], which were observed from correlations between BIX and percentages of C2/FDOM, whereas bio-interventions in pore water were limited to conversions between proteins and humic-like substances, fluorophores, and non-fluorophores in CDOM [
3,
35]. Except for high bio-availability and intermolecular transformation, bio-activities (BIX) seemed to intervene in the production of cations (Ca/Mg) and organic ingredients (C2/CDOM) in pore water DC-2 and DC-9 (
Figure 7). Molecular weights in water were regulated by percentages of C1 in CDOM. Generally, higher humic quotients in CDOM caused higher molecular weight, but pore water at DC-9 was an exception in that molecular weight decreased with increasing quotients C1/CDOM along the deposition column.


