Abstract
Based on 1260 tap water samples gathered monthly and 136 surface water samples collected seasonally in the eastern margin of the Qinghai–Tibet Plateau, the local tap water line, the basic spatiotemporal characteristics of tap water isotopes, and their indication for water source under different water supply modes were discussed, linking the local tap water supply and water source information. A new tap water isotopes data set based on dense sampling sites was established, which was reliable for the analysis of tap water isotope features, tap water supply management, and tap water sources. The main conclusions are: (1) The local tap water lines in Gannan and Longnan are δ2H = (7.06 ± 0.17) δ18O + (3.24 ± 1.75) (r2 = 0.81, p < 0.01) and δ2H = (5.66 ± 0.09) δ18O + (−8.12 ± 0.82) (r2 = 0.82, p < 0.01), respectively. (2) The annual mean δ2H and δ18O in tap water show an increasing trend from southwest to northeast. The seasonal differences of δ2H and δ18O in tap water in Gannan and Longnan are small. (3) The correlation of tap water isotopes with those in main source water is high, while that of isotopes in tap water with those in non-water source is low. Under the central water supply mode by local tap water company, tap water isotopes in Gannan where groundwater is the direct water source show weak connection with those in surface water and precipitation, and those in tap water in Longnan with surface water as main source water reveal good connection with isotopes in surface water. Under mixed water supply modes, tap water isotopes indicate that surface water is the main tap water source in Gannan and Longnan with multiple water sources.
1. Introduction
Tap water isotopes are well proven to be essential indicators [1,2,3,4,5,6,7,8,9,10] for studies in many fields [10,11,12,13,14,15,16,17,18,19,20,21,22], including hydrology, ecology, climatology, forensic, and so on. With the development of isotope methods, isotopes have been gradually applied to tap water research [23,24,25,26,27,28,29,30,31,32]. At present, studies on isotopes in tap water [33,34] throughout the world are relatively few. Their study areas have mainly involved the United States of America (e.g., the San Francisco Bay Area [31], the Salt Lake Valley of northern Utah [30], western and the whole United States [35,36,37]), South Africa [30], and China [34,38]. The main research contents include basic features (e.g., spatial and temporal variations, local tap water line) of tap water isotopes, tap water source, the applicability of tap water to relevant fields, and so on. These studies have enriched the knowledge of tap water isotope features, tap water supply mode and management strategy of local water resources.
At present, studies of tap water isotopes in China can be seldom found, except for reports on isotopes in tap water throughout China [34,38]. Features of tap water isotopes and their relationship with precipitation isotopes were exhibited. The water supply systems in China, which have a vast territory, are complex [39]. Further studies of tap water isotopes based on dense sampling sites are needed to finely explore the isotopic composition of tap water and its indication for water source, especially in areas with multiple water supply modes.
In southern Gansu Province, eastern margin of Qinghai–Tibet Plateau, different water supply modes, including central water supply (e.g., supplied by rural drinking water safety project, supplied by tap water company) and decentralized water supply, coexist in the Gannan Tibetan Autonomous Prefecture (Gannan) and Longnan. In the existing studies in China [34,38,40], only four tap water sampling points were involved in Gannan and Longnan, which cannot accurately reflect the local tap water isotope landscape, seasonal differences, and the significance of water source indication. In this study, isotopes in 1396 water samples (tap water samples: 1260; surface water samples: 136) were analyzed, and the local tap water line, the basic spatiotemporal characteristics of isotopes, and indication for water source under different water supply modes were discussed, combining the field survey data about water supply and sources. This research is beneficial for understanding tap water isotopes, water supply, and water source determination.
2. Study Area
Areas analyzed in this study were located in southern Gansu, including the Gannan Tibetan Autonomous Prefecture (Gannan) and Longnan (Figure 1). Gannan is one of the ten Tibetan Autonomous Prefectures in China and located between 100°46′–104°44′ E and 33°06′–36°10′ N, with an area of 4.02 × 10⁴ km2. The elevation in Gannan is between 1100 and 4900 m, mainly above 3000 m. The temperature difference between day and night is large. There are more than 120 rivers or streams flowing in Gannan, such as the Yellow River, Tao River, Da Xia River, Pai-lung River, and so on. Longnan is situated between 104°01′–106°35′ E and 32°35′–34°32′ N, with an area of 2.79 × 10⁴ km2. Longnan is the only region in Gansu which belongs to the Yangtze River system and has a subtropical climate. High mountains, river valley, hills, and basins are interlaced in Longnan.
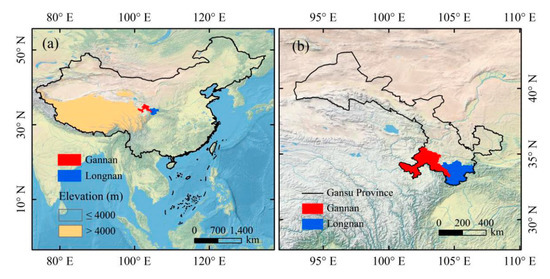
Figure 1.
Study area in this study. (a) Location of Gannan and Longnan in China. (b) Location of Gannan and Longnan in Gansu Province. The satellite-derived land cover base map derived from Natural Earth (http://www.naturalearthdata.com). Spatial distribution of elevation came from Shuttle Radar Topography Mission 90M Resolution Raw Elevation Data (SRTMDEM 90M; http://www.gscloud.cn/sources/?cdataid=302&pdataid=10).
3. Data and Method
3.1. Collection of Water Samples
Surface water and tap water samples were gathered by field work of our team in southern Gansu from May 2017 to April 2018. Cold tap water was collected into bottles after running the tap for 10 s [41]. Fresh surface water was collected from rivers, streams, or mountain springs flowing in southern Gansu. Tap water samples were gathered monthly from May 2017 to April 2018 (except for June 2017). Surface water samples were collected 5 times seasonally between May 2017 and April 2018 (in May 2017, July 2017, October 2017, January 2018, and April 2018). Sampling sites had relatively complete geographical coverage in southern Gansu, covering all the counties and districts governed by Gannan and Longnan (Figure 2). As Gannan and Longnan are located in mountainous areas, tap water samples were gathered along the winding roads in the mountains, which link residential areas. The total number of tap water and surface water samples were 1260 and 136, respectively. Information of all water samples is summed up in Table 1. In the division of four seasons, spring includes March, April and May, and summer includes June, July and August, and autumn includes September, October and November, and winter includes December, January (in the nest year) and February (in the nest year).
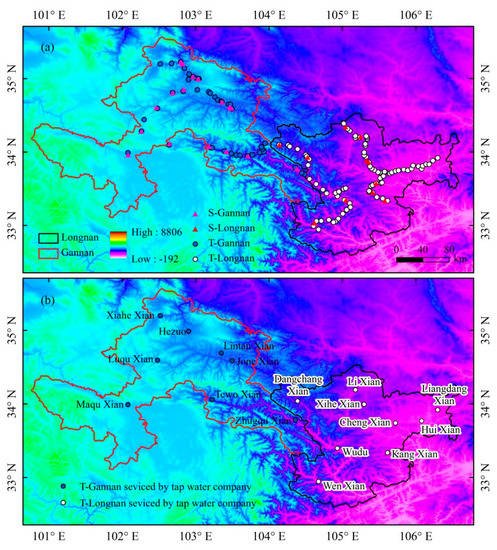
Figure 2.
Spatial distribution of sampling sites in this study. (a) All of the tap water (T) and surface water (S) sampling sites in Gannan and Longnan. (b) Tap water sampling sites supplied centrally by tap water company in Gannan and Longnan (Table S1 in Supplementary Materials).

Table 1.
Information of all collected water samples in Gannan and Longnan.
3.2. Experimental Analysis
δ2H and δ18O in water samples were analyzed by a liquid water isotope analyzer (DLT-100, developed by the Los Gatos Research company of the United States) [42] at the Northwest Normal University. In the test, three standard samples (standard No. 3: δ2H: −96.4 ± 0.5‰, δ18O: −13.10 ± 0.15‰; standard No. 4: δ2H: −51.0 ± 0.5‰, δ18O: −7.69 ± 0.15‰; standard No. 5: δ2H: −9.5 ± 0.5‰, δ18O: −2.80 ± 0.15‰; provided by the LGR company) and six gathered water samples were considered as one group. Every sample was tested for six injections. Data of the first two needles were discarded because of the isotope memory effect, and values of the last four needles were calculated as final results [43,44]. The measurement uncertainties for δ18O and δ2H were no more than 0.2‰ and 0.6‰. Results tested were relative to the Vienna Standard Mean Ocean Water (VSMOW).
In Equation (1), Rsample presents the ratio of 2H/1H (18O/16O) in water samples. Rstandard shows the ratio of 2H/1H (18O/16O) in the VSMOW.
3.3. Other Data
Precipitation isotope data used in this paper were detected from a global data product, the Regionalized Cluster-based Water Isotope Prediction (RCWIP, Grabiszyńska, Poland) model version 1.00 [45,46,47,48,49], providing estimated δ2H and δ18O in precipitation (annual and monthly values). The reliability of this precipitation isotope database in China has been verified to be good [38].
3.4. Tap Water Isoscape Simulation and Error Test Methods
Based on the existing studies about the isoscapes in different water bodies (e.g., tap water and precipitation) [31,45,50,51,52], seven regression models combining spatial (including latitude (L, °), longitude (O, °), and elevation (E, m)) and meteorological factors (e.g., average temperature and precipitation) (Table 2) were selected and compared to develop the isoscape of tap water in southern Gansu. The Shuttle Radar Topography Mission 90M Resolution Raw Elevation Data (SRTMDEM 90M) were applied in isoscape models. Meteorological parameters, including average temperature (T; °C), precipitation (P; mm), wind speed (S; m/s), water pressure (V; kPa), and solar radiation (R; kJ/(m2·day)), with 30 s spatial resolution involved in these models were selected from WorldClim-Global Climate Data (version 2) [53]. Simulation results for all of the seven regression models were evaluated based on adjusted determination coefficient (radj2), mean absolute error (MAE), mean bias error (MBE), and root mean square error (RMSE) (Table 3). Models 6 and 7 were selected for the simulation of δ2H and δ18O, respectively, as the optimal model. The simulated contour combined regression estimation and interpolated residuals with the Kriging method [36].
Table 2.
Regression models for the estimation of tap water isoscape in Gannan and Longnan.
Table 3.
Equations of regression models for δ2H and δ18O in tap water in Gannan and Longnan.
4. Result
4.1. Basic Characteristics of Tap Water Isotopes
4.1.1. Local Tap Water Line
Figure 3 shows the local tap water line (LTWL), local surface water line (LSWL), and local meteoric water line (LMWL) in Gannan and Longnan. Global meteoric water line (GMWL), δ2H = 8 δ18O + 10 [55], is also presented in Figure 3. The LTWLs in Gannan and Longnan are δ2H = (7.06 ± 0.17) δ18O + (3.24 ± 1.75) (r2 = 0.81, p < 0.01) and δ2H = (5.66 ± 0.09) δ18O + (−8.12 ± 0.82) (r2 = 0.82, p < 0.01), respectively. Lower slopes can be seen in the LTWLs in Gannan and Longnan compared to the GMWL proposed by Craig [55] and Gourcy et al. (δ2H = (8.14 ± 0.02) δ18O + (10.9 ± 0.2), r = 0.98) [56] (in the Student’s t-test, p > 0.05) [10]. The slopes of the LTWLs in Gannan and Longnan are also lower than the Chinese tap water line δ2H = (7.57 ± 0.04) δ18O + (5.07 ± 0.38) (r2 = 0.93, p < 0.01) (in the Student’s t-test, p > 0.05) [10], newly calculated combining two exciting data sets of Chinese tap water isotopes (base on monthly tap water isotope values) [34,38]. This may be as a result of differences in climate and evaporation ratios in water source areas [57]. The slopes of LTWLs, LSWLs, and LMWLs are all higher in Gannan than those in Longnan.
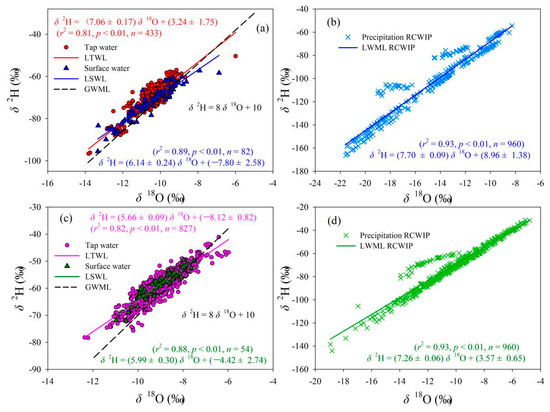
Figure 3.
Relationships between δ2H and δ18O in tap water, surface water, and precipitation in Gannan and Longnan; (a,b) Gannan, (c,d) Longnan. (GMWL: Global meteoric water line; LMWL: Local meteoric water line; LTWL: Local tap water line; LSWL: Local surface water line; n: Number of water samples or grid sites).
4.1.2. Spatial Pattern
The simulated tap water isoscape in Gannan and Longnan is exhibited in Figure 4 and Figure S1 (in Supplementary Materials). From southwest to northeast, the annual mean δ2H and δ18O show an increasing trend on the whole. In southwest Gannan, isotopes are the lowest within Gannan, with δ2H values lower than −85.0‰ and δ18O lower than −11.0‰. In the north and east parts of Gannan, annual mean δ2H and δ18O in tap water are the highest within Gannan, with some δ2H values higher than −75.0‰ and δ18O higher than −10.0‰. In most parts of Gannan, the annual mean values of δ2H range from −85.0 to −65.0‰ and those of δ18O are lower than −11.0‰. Isotopes in Longnan are higher than those in Gannan in general. In most parts of Longnan, the annual mean values of δ2H are higher than −65.0‰ and those of δ18O are higher than −10.0‰. The annual mean values of δ2H in tap water in the east part of Longnan are the highest (δ2H higher than −55.0‰), and those of δ18O in southeast Longnan are the highest (δ18O higher than −8.0‰). The simulated residuals for δ2H and δ18O are in Figure 4c,d. In most parts of Gannan and Longnan, residuals for δ2H range between −2.0 and 2.0‰, and those for δ18O are from −0.6 to 0.6‰. A jackknife procedure was applied to report the isoscape uncertainties (Figure 5). Each sampling site supplied centrally by tap water company (Figure 2, Table S1 in Supplementary Materials) in Gannan and Longnan was removed separately to simulate the isotope landscape. Correction between estimated and observation annual mean values of δ2H and δ18O is showed in Figure 5. The equations of δ2H and δ18O are close to y = x. The values of r2 for the equations of δ2H and δ18O are 0.85 and 0.93, respectively. The simulated water isotope landscape map has a good accuracy.
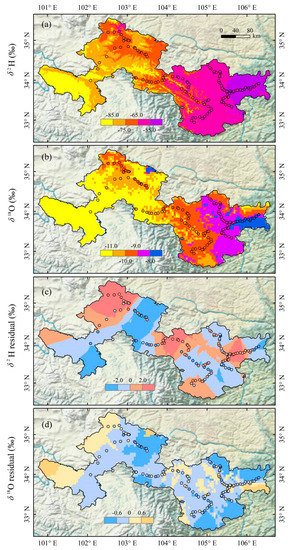
Figure 4.
Spatial variations of annual mean values of δ2H ((a), ‰) and δ18O ((b), ‰) and residuals for δ2H ((c), ‰) and δ18O ((d), ‰) in tap water in Gannan and Longnan. Residuals equal to the observation values minus the estimated values.
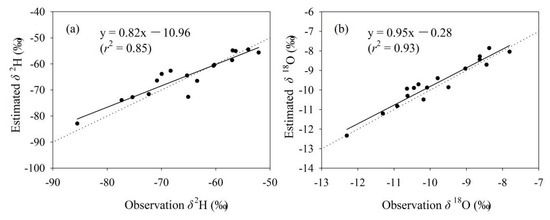
Figure 5.
Correction between estimated and observation annual mean values of δ2H ((a), ‰) and δ18O ((b), ‰) in tap water at the sampling sites supplied centrally by tap water company (Table S1 in Supplementary Materials) in Gannan and Longnan. The dotted line is y = x.
4.1.3. Temporal Variation
Differences of isotope between two adjacent seasons (Δδ2H and Δδ18O, ‰) at every sampling site were calculated (Figure 6). On the whole, Δδ2H and Δδ18O between two adjacent seasons in Gannan and Longnan are small. The values of Δδ2H between two adjacent seasons mainly range from −3.0 to 2.0‰ (red and purple sampling sites in Figure 6a,c,e,g). The values of Δδ18O between spring and winter mainly vary from 0 to 0.5‰ (purple and dark purple sampling sites in Figure 6h), and those of Δδ18O between other two adjacent seasons are mainly from −0.5 to 0.2‰ (red and purple sampling sites in Figure 6b,d,f). Table 4 shows the seasonal and annual mean δ2H and δ18O in Gannan and Longnan. The highest seasonal mean δ2H in Gannan and Longnan both appear in summer. The annual mean δ2H and δ18O in Gannan are both lower than those in Longnan.
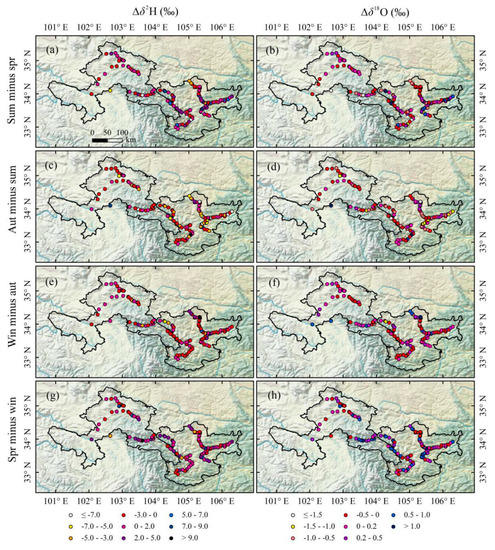
Figure 6.
Differences for δ2H and δ18O (that is, Δδ2H and Δδ18O, ‰) in tap water in two adjacent seasons at each sampling site in Gannan and Longnan; (a,b) summer minus spring, (c,d) autumn minus summer, (e,f) winter minus autumn, (g,h) spring minus winter.
Table 4.
Seasonal and annual mean δ2H and δ18O in tap water at all sampling sites in Gannan and Longnan.
4.2. Comparison of Isotopes in Tap Water under Different Water Supply Modes with Those in Precipitation and Surface Water
4.2.1. Under the Mode of Central Water Supply by Local Tap Water Company
To detect the connection of tap water isotopes under different water supply modes with other water bodies, tap water samples under the mode of centralized water supply by local tap water companies in Gannan and Longnan (Figure 2b, Table S1 in Supplementary Materials) were selected and analyzed. On the whole, the correlation of isotopes between tap water supplied centrally by local water companies and precipitation is weak in Gannan and Longnan (Table 5). The correlation coefficients at most sampling sites are less than 0.5. In Figure 7, the correlation coefficients in the fitting equations for δ2H and δ18O between tap water and surface water in Gannan (r < 0.5) are smaller than those in Longnan (r > 0.5). Relatively speaking, weak connection of isotopes can be seen between tap water and surface water in Gannan, while better connection presents in Longnan.
Table 5.
Correlation coefficients (r) of monthly δ2H and δ18O between tap water and precipitation under the mode of central water supply by local tap water companies in Gannan and Longnan.
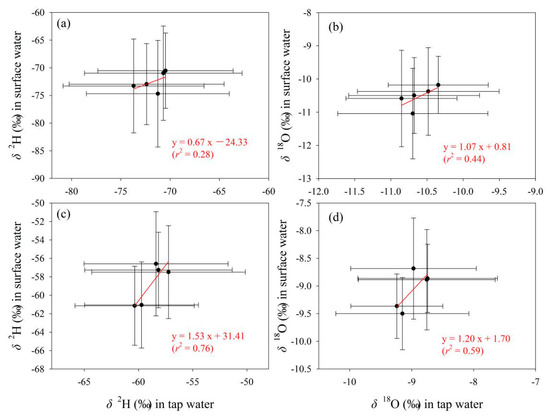
Figure 7.
Relationship of δ2H and δ18O (‰) in tap water under the mode of centralized water supply by local tap water companies with those in surface water in Gannan (a,b) and Longnan (c,d). Solid circles and error bars show the arithmetic average and standard deviation, respectively.
4.2.2. Under Mixed Tap Water Supply Modes
The relationship between isotopes in tap water under mixed water supply modes (based on all tap water samples) and those in other two water bodies in Longnan and Gannan was analyzed in detail in terms of temporal variation, numerical difference, and correlation. In general, the temporal features of isotopes between in tap water under mixed water supply modes and precipitation show great differences (Figure 8). The monthly δ2H in Gannan and Longnan change little throughout the year, and so are the δ18O values. Isotopes in precipitation in Gannan are higher in summer, with lower values in winter. In Longnan, the seasonal mean δ2H and δ18O in precipitation are the highest in spring (δ2H: −53.7‰, δ18O: −7.8‰) and the lowest (δ2H: −82.0‰, δ18O: −11.6‰) in winter. The isotopic seasonal differences of surface water are small, so are tap water (Figure 9). The lowest seasonal values δ2H (−74.7‰) and δ18O (−11.0‰) in surface water in Gannan present in autumn. The highest seasonal values δ2H (−57.1‰) and δ18O (−8.8‰) in surface water in Longnan appear in spring.
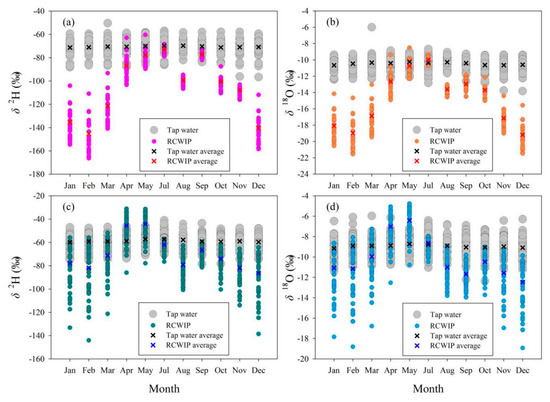
Figure 8.
Comparison of monthly δ2H and δ18O (‰) between tap water and precipitation in Gannan (a,b) and Longnan (c,d).
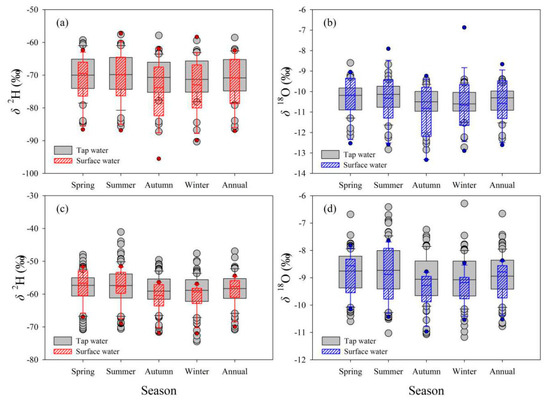
Figure 9.
Comparison of seasonal and annual δ2H and δ18O (‰) between tap water and surface water in Gannan (a,b) and Longnan (c,d). The top and bottom of the box exhibit the 75th and 25th percentiles, the line in the box signs the 50th percentile (median), whiskers mark the 10th and 90th percentiles; points below and above the whiskers indicate lower than the 10th and higher than 90th percentiles, respectively.
Numerical differences of tap water isotopes with precipitation are much larger than those with surface water (Figure 10). Differences of monthly mean δ2H in tap water with that in precipitation in Gannan and Longnan mainly range from 0 to 30.0‰ (Figure 10a), and those for δ18O mainly range from −2.0 to 4.0‰ (Figure 10b). The differences of monthly mean δ2H and δ18O between tap water and precipitation in Gannan are larger than those in Longnan (Figure 10a,b). The differences of seasonal mean δ2H in tap water with surface water in Gannan and Longnan mainly range from −1.0 to 3.0‰ (Figure 10c), and those for δ18O mainly range from −0.1 to 0.4‰ (Figure 10d). Differences of seasonal mean δ2H between surface water and tap water in Gannan are larger than those in Longnan (Figure 10c,d).
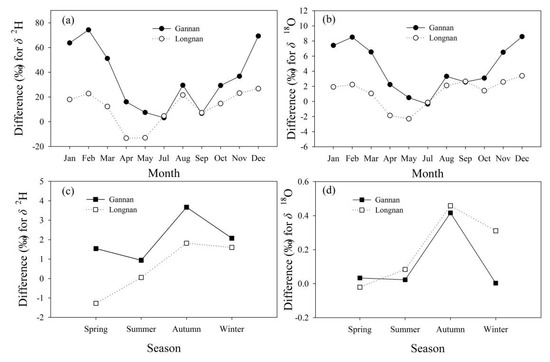
Figure 10.
Differences (‰) of δ2H and δ18O in tap water with precipitation and surface water in Gannan and Longnan. (a,b) tap water minus precipitation, (c,d) tap water minus surface water.
The relationships of δ2H and δ18O in tap water with those in the other two water bodies are presented in Figure 11 and Figure 12, respectively. Overall, tap water isotopes show better correlation with surface water than precipitation. As δ2H and δ18O values in surface water increase, those in tap water show an upward trend (Figure 12). In contrast, with the increasing of δ2H and δ18O in precipitation, those in tap water do not show a uniform changing trend (Figure 11). For tap water and precipitation, the correlation coefficients in the fitting equations for δ2H and δ18O are all less than 0.5 in Gannan and Longnan (Figure 11). To tap water and surface water, those for δ2H and δ18O are all larger than 0.7 (Figure 12).
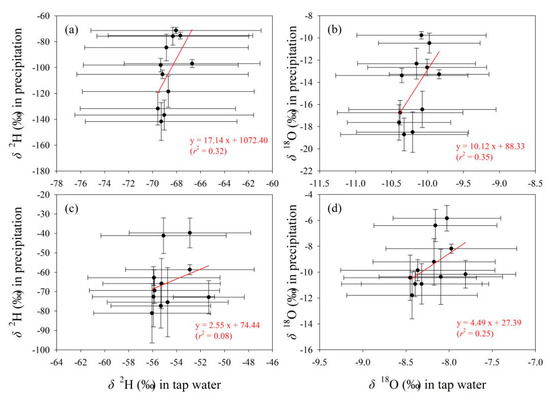
Figure 11.
Relationship of δ2H and δ18O (‰) between tap water and precipitation in Gannan (a,b) and Longnan (c,d). Solid circles and error bars show the arithmetic average and standard deviation, respectively.
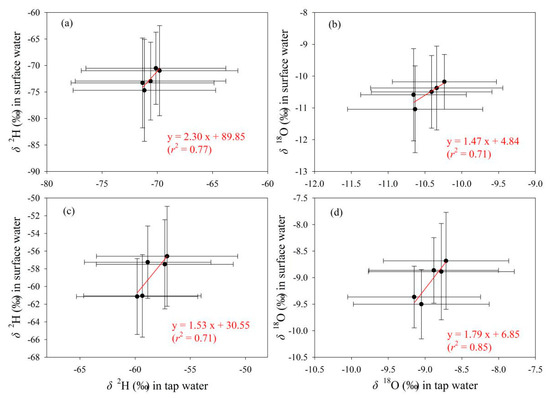
Figure 12.
Relationship of δ2H and δ18O (‰) between tap water and surface water in five seasonal sampling times in Gannan (a,b) and Longnan (c,d). Solid circles and error bars show the arithmetic average and standard deviation, respectively.
5. Discussion on Water Source Information of Tap Water Isotopes
Under the mode of central water supply by local tap water companies, for tap water isotopes, weak connection can be seen in Gannan with isotopes in precipitation and surface water, while tap water isotopes in Longnan present better correlation with surface water isotopes. According to water supply information from tap water companies and our field investigation data about water source, groundwater and surface water are the main tap water sources in Gannan and Longnan, respectively, under the this mode of water supply. Correlation of tap water isotopes with isotopic composition of main water source is high, while that with isotopic composition of non-water source is low.
Under mixed tap water supply modes, in Gannan and Longnan, tap water isotopes both show better correlation with isotopic composition of surface water, including seasonal variations, numerical differences, and correlation. On the basis of our field investigation data, tap water sampling sites with surface water as water source account for larger proportion, both in Gannan and Longnan, compared with other water sources (precipitation and groundwater). It can be found that isotopes in tap water can well indicate the main water source, in the case of multiple water sources.
6. Conclusions
The isotopic composition in tap water shows great significance for the understanding of local natural and humanistic environment background, water supply management, and regional water resources. In this study, δ2H and δ18O in 1260 tap water and 136 surface water samples were analyzed to exhibit the spatiotemporal characteristics of tap water isotopes and their water source signals under different water supply modes. Main results are: The LTWLs in Gannan and Longnan are δ2H = (7.06 ± 0.17) δ18O + (3.24 ± 1.75) (r2 = 0.81, p < 0.01) and δ2H = (5.66 ± 0.09) δ18O + (−8.12 ± 0.82) (r2 = 0.82, p < 0.01), respectively. Isotopes in tap water show an increasing trend from southwest to northeast, and their seasonal differences are small. Correlation of tap water isotopes with isotopic composition of main water source is high, while that with isotopic composition of non-water source is low. Under the central water supply mode by local tap water companies, tap water isotopes in Gannan where groundwater is the direct water source show weak connection with isotopes in surface water and precipitation, and for tap water isotopes in Longnan where surface water is the main water source, good connection present with surface water isotopes. Under mixed water supply modes, tap water isotopes indicate that surface water is the main source of tap water in Gannan and Longnan. Isotopic composition of tap water can well indicate the main water source, in the case of multiple water sources.
Supplementary Materials
The following are available online at https://www.mdpi.com/2073-4441/11/12/2578/s1: Table S1. Information of tap water sampling sites serviced by tap water companies among all the tap water sampling sites in Gannan and Longnan; Figure S1. Spatial variations of annual mean values of d-excess (‰) in tap water in Gannan and Longnan. The map of d-excess was calculated according to d-excess = δ2H − 8 δ18O, based on the maps of δ2H and δ18O.
Author Contributions
Sample collection, H.M. and C.C.; experimental analysis and writing—original draft preparation, M.D.; writing—review and editing, S.W. and R.G.; funding acquisition, M.Z.
Funding
This research was supported by the National Natural Science Foundation of China (No. 41701028), and the Scientific Research Program of Higher Education Institutions of Gansu Province (No. 2018C-02).
Acknowledgments
The authors are very thankful for the team partners’ help during the processes of sample collection and experiment analysis.
Conflicts of Interest
The authors declare no conflict of interest.
References
- Killingley, J.S.; Newman, W.A. 18O fractionation in barnacle calcite: A barnacle paleotemperature equation. J. Mar. Res. 1982, 40, 893–902. [Google Scholar]
- Gat, J.R. Oxygen and hydrogen isotopes in the hydrologic cycle. Annu. Rev. Earth Planet. Sci. 1996, 24, 225–262. [Google Scholar] [CrossRef]
- Roden, J.S.; Lin, G.G.; Ehleringer, J.R. A mechanistic model for interpretation of hydrogen and oxygen isotope ratios in tree-ring cellulose. Geochim. Cosmochim. Acta 2000, 64, 21–35. [Google Scholar] [CrossRef]
- Harvey, F.E.; Sibray, S.S. Delineating ground water recharge from leaking irrigation canals using water chemistry and isotopes. Ground Water 2001, 39, 408–421. [Google Scholar] [CrossRef]
- Yepez, E.A.; Williams, D.G.; Scott, R.L.; Lin, G. Partitioning overstory and understory evapotranspiration in a semiarid savanna woodland from the isotopic composition of water vapor. Agric. For. Meteorol. 2003, 119, 53–68. [Google Scholar] [CrossRef]
- Burnett, A.W.; Mullins, H.T.; Patterson, W.P. Relationship between atmospheric circulation and winter precipitation delta O-18 in central New York State. Geophys. Res. Lett. 2004, 31, L22209. [Google Scholar] [CrossRef]
- Williams, D.G.; Cable, W.; Hultine, K.; Hoedjes, J.C.B.; Yepez, E.A.; Simonneaux, V.; Er-Raki, S.; Boulet, G.; de Bruin, H.A.R.; Chehbouni, A. Evapotranspiration components determined by stable isotope, sap flow and eddy covariance techniques. Agric. For. Meteorol. 2004, 125, 241–258. [Google Scholar] [CrossRef]
- West, J.B.; Bowen, G.J.; Cerling, T.E.; Ehleringer, J.R. Stable isotopes as one of nature’s ecological recorders. Trends Ecol. Evol. 2006, 21, 408–414. [Google Scholar] [CrossRef]
- Ehleringer, J.R.; Bowen, G.J.; Chesson, L.A.; West, A.G.; Podlesak, D.W.; Cerling, T.E. Hydrogen and oxygen isotope ratios in human hair are related to geography. Proc. Natl. Acad. Sci. USA 2008, 105, 2788–2793. [Google Scholar] [CrossRef]
- Boschetti, T.; Cifuentes, J.; Iacumin, P.; Selmo, E. Local Meteoric Water Line of Northern Chile (18 S—30 S): An application of error-in-variables regression to the oxygen and hydrogen stable isotope ratio of precipitation. Water 2019, 11, 791. [Google Scholar] [CrossRef]
- Gat, J.R.; Bowser, C.J.; Kendall, C. The contribution of evaporation from the Great Lakes to the continental atmosphere: Estimate based on stable isotope data. Res. Lett. 1994, 21, 557–560. [Google Scholar] [CrossRef]
- Hobson, K.A.; Atwell, L.; Wassenaar, L.I. Influence of drinking water and diet on the stable-hydrogen isotope ratios of animal tissues. Proc. Natl. Acad. Sci. USA 1999, 96, 8003–8006. [Google Scholar] [CrossRef]
- Gibson, J.J.; Edwards, T.W.D. Regional water balance trends and evaporation-transpiration partitioning from a stable isotope survey of lakes in northern Canada. Glob. Biogeochem. Cycles 2002, 16, 1026. [Google Scholar] [CrossRef]
- Bowen, G.J.; Wassenaar, L.I.; Hobson, K.A. Global application of stable hydrogen and oxygen isotopes to wildlife forensics. Oecologia 2005, 143, 337–348. [Google Scholar] [CrossRef]
- Kelly, S.; Heaton, K.; Hoogewerff, J. Tracing the geographical origin of food: The application of multi-element and multi-isotope analysis. Trends Food Sci. Technol. 2005, 16, 555–567. [Google Scholar] [CrossRef]
- McGuire, K.J.; McDonnell, J.J.; Weiler, M.; Kendall, C.; McGlynn, B.L.; Welker, J.M.; Seibert, J. The role of topography on catchment–scale water residence time. Water Resour. Res. 2005, 41, W05002. [Google Scholar] [CrossRef]
- West, A.G.; Hultine, K.R.; Burtch, K.G.; Ehleringer, J.R. Seasonal variations in moisture use in a pinon-juniper woodland. Oecologia 2007, 153, 787–798. [Google Scholar] [CrossRef]
- Worden, J.; Noone, D.; Bowman, K.; Beer, R.; Eldering, A.; Fisher, B.; Gunson, M.; Goldman, A.; Herman, R.; Kulawik, S.S.; et al. Importance of rain evaporation and continental convection in the tropical water cycle. Nature 2007, 445, 528–532. [Google Scholar] [CrossRef]
- Hawkins, H.; Hettasch, H.; West, A.G.; Cramer, M.D. Hydraulic redistribution by Protea “Sylvia” (Proteaceae) facilitates soil water replenishment and water acquisition by an understorey grass and shrub. Funct. Plant Biol. 2009, 36, 752–760. [Google Scholar] [CrossRef]
- Brooks, J.R.; Barnard, H.R.; Coulombe, R.; McDonnell, J.J. Ecohydrologic separation of water between trees and streams in a Mediterranean climate. Nat. Geosci. 2010, 3, 100–104. [Google Scholar] [CrossRef]
- Bowen, G.J.; Kennedy, C.D.; Henne, P.D.; Zhang, T. Footprint of recycled water subsidies downwind of Lake Michigan. Ecosphere 2012, 3, 1–16. [Google Scholar] [CrossRef]
- Brienen, R.J.W.; Helle, G.; Pons, T.L.; Guyot, J.L.; Gloor, M. Oxygen isotopes in tree rings are a good proxy for Amazon precipitation and El Nino-Southern Oscillation variability. Proc. Natl. Acad. Sci. USA 2012, 109, 16957–16962. [Google Scholar] [CrossRef]
- Bowen, G.J.; Winter, D.A.; Spero, H.J.; Zierenberg, R.A.; Reeder, M.D.; Cerling, T.E.; Ehleringer, J.R. Stable hydrogen and oxygen isotope ratios of bottled waters of the world. Rapid Commun. Mass Spectrom. 2005, 19, 3442–3450. [Google Scholar] [CrossRef] [PubMed]
- Brenčič, M.; Vreča, P. Identification of sources and production processes of bottled waters by stable hydrogen and oxygen isotope ratios. Rapid Commun. Mass Spectrom. 2006, 20, 3205–3212. [Google Scholar] [CrossRef] [PubMed]
- Bong, Y.S.; Ryu, J.S.; Lee, K.S. Characterizing the origins of bottled water on the South Korean market using chemical and isotopic compositions. Anal. Chim. Acta 2009, 631, 189–195. [Google Scholar] [CrossRef]
- Chesson, L.A.; Valenzuela, L.O.; O’Grady, S.P.; Cerling, T.E.; Ehleringer, J.R. Hydrogen and oxygen stable isotope ratios of milk in the United States. J. Agric. Food Chem. 2010, 58, 2358–2363. [Google Scholar] [CrossRef]
- Chesson, L.A.; Valenzuela, L.O.; O’Grady, S.P.; Cerling, T.E.; Ehleringer, J.R. Links between purchase location and stable isotope ratios of bottled water, soda, and beer in the United States. J. Agric. Food Chem. 2010, 58, 7311–7316. [Google Scholar] [CrossRef]
- Dotsika, E.; Poutoukis, D.; Raco, B.; Psomiadis, D. Stable isotope composition of Hellenic bottled waters. J. Geochem. Explor. 2010, 107, 299–304. [Google Scholar]
- Kim, G.E.; Shin, W.J.; Ryu, J.S.; Choi, M.S.; Lee, K.S. Identification of the origin and water type of various Korean bottled waters using strontium isotopes. J. Geochem. Explor. 2013, 132, 1–5. [Google Scholar] [CrossRef]
- Li, S.; Levin, N.E.; Chesson, L.A. Continental scale variation in 17O-excess of meteoric waters in the United States. Geochim. Cosmochim. Acta 2015, 164, 110–126. [Google Scholar] [CrossRef]
- West, A.G.; February, E.C.; Bowen, G.J. Spatial analysis of hydrogen and oxygen stable isotopes (“isoscapes”) inground water and tap water across South Africa. J. Geochem. Explor. 2014, 145, 213–222. [Google Scholar] [CrossRef]
- Jameel, Y.; Brewer, S.; Good, S.P.; Tipple, B.J.; Ehleringer, J.R.; Bowen, G.J. Tap water isotope ratios reflect urban water system structure and dynamics across a semi-arid metropolitan area. Water Resour. Res. 2016, 52, 1–20. [Google Scholar] [CrossRef]
- Tipple, B.J.; Jameel, Y.; Chau, T.H.; Mancuso, C.J.; Bowen, G.J.; Dufour, A.; Chesson, L.A.; Ehleringer, J.R. Stable hydrogen and oxygen isotopes of tap water reveal structure of the San Francisco Bay Area’s water system and adjustments during a major drought. Water Res. 2017, 119, 212–224. [Google Scholar] [CrossRef] [PubMed]
- Zhao, S.; Hu, H.; Tian, F.; Tie, Q.; Wang, L.; Liu, Y.; Shi, C. Divergence of stable isotopes in tap water across China. Sci. Rep. 2017, 7, 43653. [Google Scholar] [CrossRef] [PubMed]
- Good, S.P.; Kennedy, C.D.; Stalker, J.C.; Chesson, L.A.; Valenzuela, L.O.; Beasley, M.M.; Ehleringer, J.R.; Bowen, G.J. Patterns of local and nonlocal water resource use across the western US determined via stable isotope intercomparisons. Water Resour. Res. 2014, 50, 8034–8049. [Google Scholar] [CrossRef]
- Bowen, G.J.; Ehleringer, J.R.; Chesson, L.A.; Stange, E.; Cerling, T.E. Stable isotope ratios of tap water in the contiguous United States. Water Resour. Res. 2007, 43, 399–407. [Google Scholar] [CrossRef]
- Landwehr, J.M.; Coplen, T.B.; Stewart, D.W. Spatial, seasonal, and source variability in the stable oxygen and hydrogen isotopic composition of tap waters throughout the USA. Hydrol. Process. 2014, 28, 5382–5422. [Google Scholar] [CrossRef]
- Wang, S.; Zhang, M.; Bowen, G.J.; Liu, X.; Du, M.; Chen, F.; Qiu, X.; Wang, L.; Che, Y.; Zhao, G. Water source signatures in the spatial and seasonal isotope variation of Chinese tap waters. Water Resour. Res. 2018. [Google Scholar] [CrossRef]
- Jiang, Y. China’s water security: Current status, emerging challenges and future prospects. Environ. Sci. Policy 2015, 54, 106–125. [Google Scholar] [CrossRef]
- Du, M.; Zhang, M.; Wang, S.; Chen, F.; Zhao, P.; Zhou, S.; Zhang, Y. Stable Isotope Ratios in Tap Water of a Riverside City in a Semi-Arid Climate: An Application to Water Source Determination. Water 2019, 11, 1441. [Google Scholar] [CrossRef]
- Clark, I.; Fritz, P. Environmental Isotopes in Hydrogeology; CRC Press: New York, NY, USA, 1997; p. 328. [Google Scholar]
- Newman, B.; Tanweer, A.; Kurttas, T. IAEA Standard Operating Procedure for the Liquid-Water Stable Isotope Analyser, Laser Procedure; IAEA Water Resources Programme; IAEA: Vienna, Austria, 2009; p. 27. [Google Scholar]
- Lis, G.; Wassenaar, L.I.; Hendry, M.J. High-precision laser spectroscopy D/H and 18O/16O measurements of microliter natural water samples. Anal. Chem. 2008, 80, 287–293. [Google Scholar] [CrossRef] [PubMed]
- Lyon, S.W.; Desilets, S.L.E.; Troch, P.A. A tale of two isotopes: Differences in hydrograph separation for a runoff event when using δD versus δ18O. Hydrol. Process. 2009, 23, 2095–2101. [Google Scholar] [CrossRef]
- Terzer, S.; Wassenaar, L.I.; Araguás-Araguás, L.J.; Aggarwal, P.K. Global isoscapes for δ18O and δ2H in precipitation: Improved prediction using regionalized climatic regression models. Hydrol. Earth Syst. Sci. 2013, 17, 4713–4728. [Google Scholar] [CrossRef]
- IAEA (International Atomic Energy Agency). Regionalized Cluster-Based Water Isotope Prediction (RCWIP). 2018. Available online: http://www-naweb.iaea.org/napc/ih/IHS_resources_rcwip.html (accessed on 25 April 2019).
- IAEA/WMO (International Atomic Energy Agency/World Meteorological Organization). Water Isotope System for Data Analysis, Visualization and Electronic Retrieval (WISER). 2017. Available online: https://nucleus.iaea.org/wiser (accessed on 12 March 2019).
- Christner, E.; Kohler, M.; Schneider, M. The influence of snow sublimation and meltwater evaporation on δD of water vapor in the atmospheric boundary layer of central Europe. Atmos. Chem. Phys. 2017, 17, 1207–1225. [Google Scholar] [CrossRef]
- Seltzer, A.M.; Buizert, C.; Baggenstos, D.; Brook, E.J.; Ahn, J.; Yang, J.-W.; Severinghaus, J.P. Does δ18O of O2 record meridional shifts in tropical rainfall? Clim. Past 2017, 13, 1323–1338. [Google Scholar] [CrossRef]
- Bowen, G.J.; Revenaugh, J. Interpolating the isotopic composition of modern meteoric precipitation. Water Resour. Res. 2003, 39. [Google Scholar] [CrossRef]
- Lykoudis, S.P.; Argiriou, A.A. Gridded data set of the stable isotopic composition of precipitation over the eastern and central Mediterranean. J. Geophys. Res. 2007, 112, D18107. [Google Scholar] [CrossRef]
- Liu, Z.; Tian, L.; Chai, X.; Yao, T. A model-based determination of spatial variation of precipitation δ18O over China. Chem. Geol. 2008, 249, 203–212. [Google Scholar] [CrossRef]
- Fick, S.E.; Hijmans, R.J. WorldClim 2: New 1-km spatial resolution climate surfaces for global land areas. Int. J. Climatol. 2017, 37, 4302–4315. [Google Scholar] [CrossRef]
- Liu, J.; Song, X.; Yuan, G.; Sun, X.; Yang, L. Stable isotopic compositions of precipitation in China. Tellus B Chem. Phys. Meteorol. 2014, 66, 22567. [Google Scholar] [CrossRef]
- Craig, H. Isotopic variations in meteoric waters. Science 1961, 133, 1702–1703. [Google Scholar] [CrossRef] [PubMed]
- Gourcy, L.L.; Groening, M.; Aggarwal, P.K. Stable oxygen and hydrogen isotopes in precipitation. In Isotopes in the Water Cycle: Past, Present and Future of Developing Science; Aggarwal, P.K., Gat, J.R., Froehlich, K.F.O., Eds.; Springer: Dordrecht, The Netherlands, 2005; pp. 39–51. [Google Scholar] [CrossRef]
- Salati, E.; Dall’ Olio, A.; Matsui, E.; Gat, J.R. Recycling of water in the Amazon basin: An isotopic study. Water Resour. Res. 1979, 15, 1250–1258. [Google Scholar] [CrossRef]


© 2019 by the authors. Licensee MDPI, Basel, Switzerland. This article is an open access article distributed under the terms and conditions of the Creative Commons Attribution (CC BY) license (http://creativecommons.org/licenses/by/4.0/).