Article

The Effects of Land Use and Climate Change on the Water Yield of a Watershed in Colombia

by
Sandra R. Villamizar
*,
Sergio M. Pineda
and
Gustavo A. Carrillo
Department of Civil Engineering, Universidad Pontificia Bolivariana, Bucaramanga 681007, Colombia
*
Author to whom correspondence should be addressed.
Water 2019, 11(2), 285; https://doi.org/10.3390/w11020285
Submission received: 21 December 2018 / Revised: 28 January 2019 / Accepted: 30 January 2019 / Published: 6 February 2019
(This article belongs to the Special Issue Current and Emerging Issues Surrounding Water in the Americas )

Abstract

:
Land use and climate are two determinant factors of water yield within a watershed. Understanding the effects of these two variables is key for the decision-making process within watersheds. Hydrologic modeling can be used for this purpose and the integration of future climate scenarios to calibrated models widens the spectrum of analysis. Such types of studies have been carried out in many areas of the world, including the Amazon Basin of South America. However, there is a lack of understanding on the effect of land use/land cover and climate change on Andean watersheds of this continent. Our study focused on the evaluation of water yield under different land use and climate scenarios using the semi-distributed hydrological model known as the Soil and Water Assessment Tool (SWAT) model. We worked on the Tona watershed (Colombia, South America), the most important source of water for a metropolitan population. Our results compared water yield estimates for historical conditions (1987–2002) with those of future combined scenarios for land use and climate for the 2006–2050 period. The modeling effort produced global estimates of water yield (average annual values) and, at the subwatershed level, identified strategic areas on which the protection and conservation activities of water managers can be focused.

1. Introduction

Water yield is defined as the net amount of water flowing past a point on a stream during a given period [1]. It is also understood as the average amount of water produced by the watershed from contributions of surface, lateral, and ground water over a certain time period [2]. From the ecosystem services perspective, water yield represents the potential provision of fresh water for food production, hydropower generation or drinking water [3]. All of these are key for the sustainment of rural and urban communities. Over the years, many studies have been dedicated to evaluating the driving factors of water yield within a given area. Land use/land cover (LULC) change is a key factor that has been studied from diverse perspectives [4,5,6,7,8,9,10,11]. Reforestation appears to have a decreasing effect on runoff (via increase in evapotranspiration—ET) at the small catchment scale and an increasing effect on precipitation and water availability at larger scales since ET returns water to the atmosphere and favors, given adequate conditions, precipitation (P) [7]. The magnitude of water yield changes, due to changes in vegetation (relative to the flow under the original vegetation type), appears to be more drastic during low flow seasons, and the time to reach a new equilibrium after the LULC changes depends on the type of change (afforestation, deforestation or regrowth), taking more than five years to reach it in some cases [11].
Climate change and climate variability have a significant effect on river discharge, extreme events, and on the availability of water for various human needs [12,13,14,15,16,17,18,19,20]. Worldwide, many studies have evaluated the impact of climate change on specific regions and review efforts or large-scale studies provide a means to understand the “big picture.” For example, in Europe, analysis of observations indicate a general increase in extreme precipitation but no significant trends for extreme streamflow, while modeling efforts based on climate projections confirm the general increase in extreme precipitation and show large impacts (positive and negative changes) on peak flows [19]. Recent findings from Betts et al. [12] show the spatial global trends in extreme precipitation and hydrologic events and point out the importance of limiting global warming because, at 2 °C, some countries could reach unprecedented levels of water scarcity. Food security will face serious challenges because there will be freshwater limitations in important irrigated regions of North America (Western United States) and Asia (China; West, South, and Central Asia), while substantial investment in irrigation infrastructure will be required in areas (Northern/Eastern United States, parts of South America, Europe, and Southeast Asia) that could compensate for the net increase in irrigation required [18]. For all purposes, however, these types of studies have an intrinsic uncertainty. Evaluation of the results for 12 large river basin studies shows that the choice of global climate model (GCM) contains the largest share of uncertainty in the projections (57%), followed by the choice of representative concentration pathway (RCP) (27%) and the choice of hydrological model (16%) [13].
The combined effect of land use and climate change is of special interest from the watershed management perspective. Understanding it continues to be a challenge because water yield is the convolution of the two factors, generating positive, negative, and even neutral feedbacks [21]. The answer to this problem is so far case-specific [22,23,24,25], but some studies have proposed generalizations [21,26]. A search for the available peer-reviewed literature on this topic for Colombian Andean watersheds was unfruitful. However, there are some studies that deal with related issues such as the role of land use and soils on regulating flow [27], the particular hydrological processes of the humid tropics [28], or the relationship between perception of water scarcity and observed climate, land use, and demographic changes [29].
For the case of strategic watersheds (urban water supply or agricultural watersheds), regardless of size, it is critical to have not only a calibrated model that simulates, at some level, the dynamics of the hydrological cycle within the watershed, but also to evaluate scenarios that can support the decision-making process. This is especially true when managers need to decide about land purchasing and conservation practices oriented toward maximization of water yield. The Soil and Water Assessment Tool model (SWAT) has become a well-known and globally used model to study hydrologic processes within watersheds and to evaluate their water availability and quality under present and future conditions [30,31,32,33]. Many SWAT studies are dedicated to analyzing a hydrologic response under these changing conditions [4,34,35,36,37]; however, most of them have been carried out in regions other than tropical South America (Brazil being an exception [38]). In Colombia, there is a knowledge base developed by CIAT (International Center for Tropical Agriculture) that has mostly been distributed through oral presentations and reports [39]. There is also the work developed at the undergraduate and graduate levels that has resulted in academic manuscripts that have not gone through the formal peer-review publication process (see, for example, [40]). Recently, Hoyos et al. [41] worked on the evaluation of the effects of drought length and land cover on streamflow recovery at a Colombian Caribbean watershed. More formal research is needed to be able to derive general conclusions about the potential impact of climate and land use changes in this region of South America.
SWAT has gained worldwide recognition because it can be used to evaluate water and sediment yield, and some water quality parameters, under present conditions, under management scenarios, or under future climate conditions, with spatial and temporal resolutions that depend on data availability and the purposes of the particular studies. The availability of information required as inputs for the model (i.e., long-term series of climate, updated land use/land cover maps, detailed soils data, sediment and nutrient data, etc.) determines not only the quality of the outputs but also the regions where it has been used the most (in order: North America and Europe, Asia and Africa, Latin America (except Brazil)). Various challenges exist for Colombia (and possibly for many of the Latin American countries) in this aspect because of the institutional disconnect that makes it difficult to find, access, and use the kind of data necessary to run a typical SWAT model.
We present here the work developed for the Tona watershed, the main source of water for a medium size metropolitan area in Colombia (South America). Our hypothesis was that not only climate but also land use changes determine water yield within this tropical Andean region. We worked together with local environmental and water management agencies to set up a SWAT model for this watershed. This allowed us to obtain annual and monthly estimates of water yield, at the watershed and subwatershed scale, for six scenarios that incorporated two future climates and three LULC types. Our methodology describes the study site, a detailed process of the model setup (including data preparation and model calibration and validation), and the definition of the future scenarios. Within the results we present the estimates of water yield for the calibrated model (current LULC and historic climate) and for the six different future scenarios. Our points of discussion focus on (1) the validity and efficiency of our calibrated model, (2) the role of precipitation patterns, topography, and LULC on the spatial distribution of water yield for the calibrated model, and (3) key aspects for watershed management derived from the modeled future scenarios.

2. Materials and Methods

2.1. Study Site

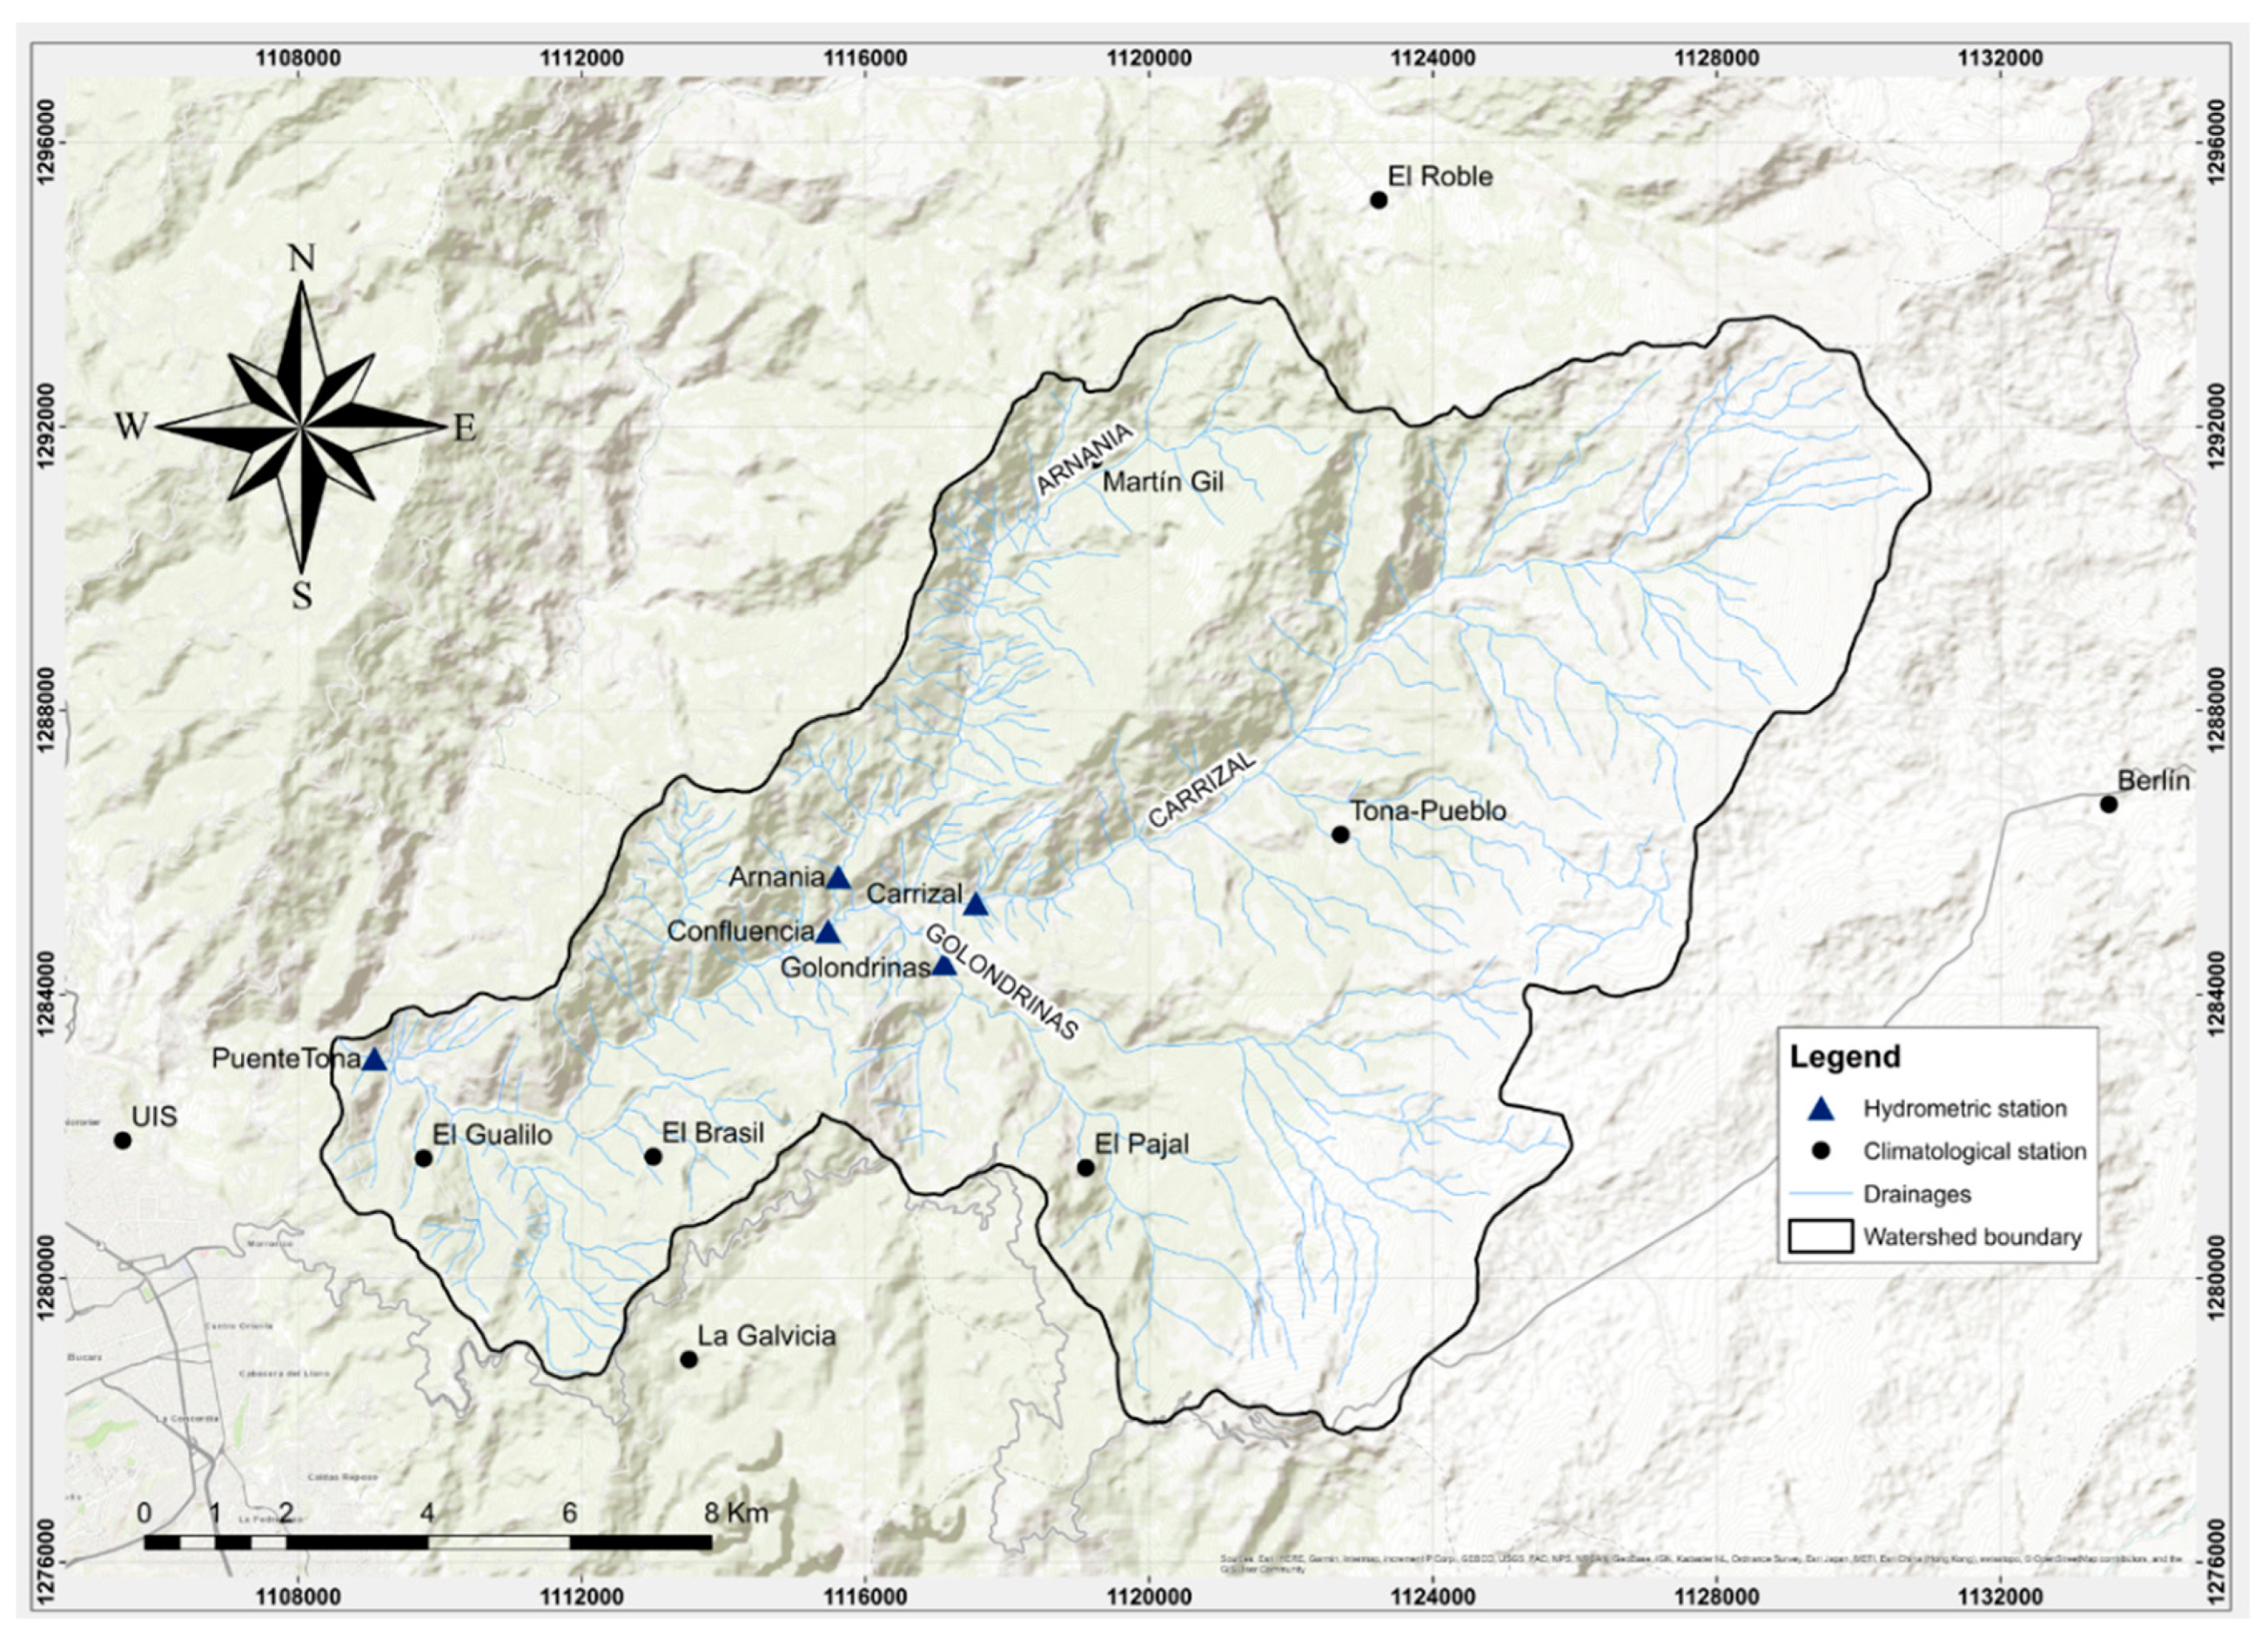
The Tona watershed is situated in the northeast side of Colombia with its headwaters located within the western limits of the Berlín–Santurbán páramo ecosystem, reaching elevations of up to 3850 m.a.s.l. Despite its small size (192.5 km2), this watershed plays an important role on the provision of water for the metropolitan area of Bucaramanga (1,142,000 inhabitants), currently contributing approximately 55% of the resource handled by the main water company, the Metropolitan Aqueduct of Bucaramanga, AMB (Acueducto Metropolitano de Bucaramanga), with an expanded service expected by the end of 2019 after the construction of the Bucaramanga Reservoir and associated conveyance infrastructure (regulation of additional 1200 lps). The watershed has three main drainages (Arnania, Carrizal, and Golondrinas), which form the Tona River in the lower part of the basin (see Figure 1).
The environmental and territorial management plan for the watershed (called from here on “POAT” due to the document’s initials in Spanish), formulated in 2012 [42], provides reference information for this study area. The watershed has a medium elevation of 2270 m and a rugged relief with an average slope of 55.7%. The main geological features of this watershed are the hills of metamorphic and igneous composition and a system of faults in the north–south direction, located on the western end. The watershed has a bimodal precipitation regime with wet periods occurring in March–May and September–November (average monthly values ranging between 130 and 300 mm). The driest conditions occur during the December–February period (average monthly values ranging between 30 and 100 mm). On an annual basis, the average precipitation for the watershed is 1400 mm but there is a distinctive spatial pattern: the highest precipitation occurs at the north and south-central areas (1900–2000 mm), the lowest precipitation occurs at the eastern side of the watershed (900 mm), corresponding to the area of highest elevations and páramo ecosystem, and the middle range values of precipitation occur at the western side of the watershed (1300 mm) (see Figure S1). Seasonal variations of temperature for this tropical watershed are not as noticeable as the spatial variations due to its topography (elevations range from 800 m.a.s.l. on the western side of the watershed to 3850 m.a.s.l. on the eastern side, see Figure S2). According to the elevations, the spatial variation of average annual temperature ranges from 23 °C on the western side to 8 °C on the eastern side of the watershed. Finally, annual average potential evapotranspiration (PET) calculated through different methods in the POAT has a spatial distribution that ranges from 1300 mm on the western side of the watershed to 840 mm on the eastern side.

2.2. Data for the SWAT Model of the Tona Watershed

The information required to feed and run the SWAT model for the Tona watershed resulted from the integration of different sources. Local stakeholders provided site-specific information such as the POAT and hydroclimatic time series for stations located within the watershed. A national environmental institution provided additional historical climate records for stations located within the area of influence of the Tona watershed. Finally, we used time series of downscaled climate models from NASA to run the future scenarios. The local environmental agency, CDMB (Corporación Autónoma Regional para la Defensa de la Meseta de Bucaramanga), provided electronic files (maps and supporting information) of the POAT study, which includes key spatial data: topography, hydrography, LULC, and soils. The development of these maps followed established methodologies and used primary and secondary information [42]. We produced raster files (digital elevation model—DEM, LULC, soils) from the original maps (scale 1:25000) using ArcGIS tools and following the guidelines of Tobler (1987) [43], which recommends users to “divide the denominator of the map scale by 1000 to get the detectable size in meters. The resolution is one half of this amount.” The pixel size of our raster maps is 12.5 m by 12.5 m (see Figures S2–S4).
The soils raster map for the Tona watershed (and associated properties) resulted from a combination of the information provided by the POAT, with information for the area from the ISRIC-WISE soil database [44] and parameters calculated using the SPAW (Soil-Plant-Atmosphere-Water Field and Pond Hydrology) software [45]. The POAT document provided a soils classification by subwatershed (divisions shown in Figure 1), assigning to each of them 3–4 soil horizons with their corresponding depths (mm), textures, and grain size distribution (%). This information, though useful, was not enough to comply with the SWAT database requirements. We incorporated additional necessary properties based on the ISRIC-WISE soil database (soil unit CO56) and calculated values of moist bulk density (Mg m−3 or g cm−3), available water capacity of the soil layer (mm H2O mm soil−1), and saturated hydraulic conductivity (mm h−1) with SPAW. This effort resulted in the addition of 14 new categories to the SWAT soil database corresponding to each of the 14 subwatersheds within the study site (see Figure S3 and Table S1).
The LULC raster map derived from an adaptation of the land use map from the POAT to the crop types available in the SWAT crop database and on previous studies [46,47]. The Tona watershed has various types of LULC categorized, in general, as follows: agricultural land and grazing land (49.9%), forest (33.4% natural forest and 5.1% protection plantation forest), special forms of vegetation (11.4%), and only 0.2% of urban land. The 5.1% protection plantation forest corresponds to land purchased by the water company (AMB) in an effort to conserve and protect the watershed. This value has increased in the last years and AMB plans to keep purchasing and/or working with locals to promote conservation practices in the watershed. We added a new category to the SWAT crop database to include the tropical páramo vegetation category (“FESP”), following recommendations received from CIAT personnel [48]. Table 1 and Figure S4 present the LULC for the Tona watershed with their corresponding SWAT codes.
Hydroclimatic data required for site description, model set up, calibration and validation originated upon request from three agencies: the Colombian Institute of Hydrology, Meteorology and Environmental Studies (IDEAM) [49], CDMB [50], and AMB [51] (see Figure 2 and Table S2). Analysis of the information and discussion with agency personnel allowed us to identify the time window (years 1987–2002) and the stations for which the information was complete and in the best possible quality conditions. We used maximum and minimum daily temperature data from stations Berlín and UIS; daily precipitation from stations Berlín, UIS, Tona-Pueblo, Galvicia, and Brasil; and mean daily flow from station Puente Tona. We could not use data for the Arnania, Carrizal, and Golondrinas hydrometric stations because only after 2011 did AMB start to use technically adequate monitoring strategies at these upstream stations. To be able to use the Puente Tona station data in the calibration process, we added an amount of 1.26 m3 s−1 to the reported values, which is equivalent to the average of the total water withdrawals for the 2003–2016 period.
To run the future climate scenarios, we used daily inputs of precipitation and temperature (maximum and minimum) obtained from downscaled projections for representative concentration pathways (RCP) 4.5 and 8.5 of the MIROC5 model, which has been previously identified as a valid model for Colombia [52,53]. The work of Gómez and Rodríguez [54] revised the performance for both the precipitation and the temperature of 36 models within Assessment Reports 4 and 5 (AR4 and AR5) for the country, finding that four models of AR4 (ECHAM5, HADCM3, ECHO-G, CGCM2.3.2) and three models of AR5 (HadGEM2-ES, MIROC5, MPI-ESM-LR) reported satisfactory results for both precipitation and temperature. To be consistent with the temporal resolution of the model inputs of the calibration process and, aiming at using models distributed within the Coupled Model Intercomparison Project Phase 5 (CMIP5), we looked for sources of downscaled climate data for the previously mentioned models. NASA Earth Exchange Global Daily Downscaled Projections (NEX-GDDP) [55] offers bias-corrected daily scenarios of 21 models for RCP 4.5 and 8.5, with a resolution of 0.25 degrees (25 × 25 km), with a time series of maximum and minimum temperature and precipitation for 1950–2005 for the retrospective run and 2006–2099 for the prospective run. The models available within this platform for our specific needs are MIROC5 and MPI-ESM-LR. The comparison between the time series of the retrospective runs of each of the two climate models (MIROC5 and MPI-ESM-LR) and the observed climate data for the period 1987–2002, resulted in MIROC5 having less statistical error (by means of calculation of bias, concordance index, root mean square error, Pearson correlation) when using monthly values of the parameters of interest (precipitation, maximum and minimum temperature) for the evaluation [54]. Figure S5 shows the location of the Tona watershed with respect to the center of pixels of the NEX-GDDP project raster.

2.3. SWAT Model Setup for the Tona Watershed

We used GIS tools to prepare all the spatial information and reconfigured the time series information to obtain SWAT-ready files. It was important to prepare each file in the required format and, for the spatial data, be sure to use the same spatial reference (MAGNA Colombia Bogotá) as well as the same pixel size for the case of the raster files (12.5 × 12.5 m). All the input files are available in the Figshare repository “SWAT Modeling for the Tona Watershed” [56]. Table 2 shows the general description of the different inputs for the model. The file names shown in the table correspond to the files stored in the Figshare repository.
We used the ArcSWAT interface [57] for the model set up. Following the recommended procedure, we generated 14 subwatersheds with 183 hydrologic response units (after HRU refinement). We added elevation bands to subwatersheds having elevations greater than 1000 m.a.s.l. We used observed daily precipitation and temperature data and installed a world weather database to help generate time series of relative humidity, solar radiation, and wind speed. We generated all of the model’s tables and edited some of them in an attempt to obtain better model inputs before running it for the first time: (1) Change of the potential evapotranspiration (PET) method to Hargreaves. This change resulted in a global PET similar to values reported by the Colombian Climatological Atlas [58] (average annual values between 1000 and 1400 mm year−1), direct calculations carried out in the POAT through the use of different methods, and mean annual values reported by MODIS products [59]. (2) Modification of baseflow parameters (ALPHA_BF and ALPHA_BF_D) at the subwatershed level based on the discharge data available and the use of a baseflow filter. This filter was developed by Arnold et al. [60] and available through the SWAT’s website. (3) Global change of the TLAPS factor to a value of –6 °C/km. This change implies a decrease in temperature with increasing elevation for the subwatersheds with elevation bands.
The first model run required a definition of periods for model calibration and validation. Based on data availability, we defined these periods as shown in Table 3. We decided to obtain the model outputs on a monthly interval based on the thesis that there may be a large uncertainty on the mean daily discharge data, which was collected only twice a day by trained, local individuals.
For any window of time, and at a given spatial scale (HRU, subwatershed, or watershed), SWAT calculates water yield (WYLD), the net amount of water that leaves the spatial unit and contributes to streamflow in a reach, as the difference between the Total Flow generated and the Losses and Abstractions that occur:
WYLD = Q surf + Q lat + Q gw tloss pond   abstractions
where Q surf is the amount of surface runoff (mm), Q lat is the amount of lateral flow (mm), Q gw is the amount of return flow from groundwater (mm), tloss refers to losses from the channel via transmission to the side and bottom (mm), and pond abstractions refer to any water that is lost to natural or artificial impoundments (mm).

2.4. Model Calibration and Validation

We carried out a combined strategy for the calibration process. First, we attempted to execute a global automatic calibration using the SWAT-CUP tool [61] and finalized with manual calibration using ArcSWAT’s Manual Calibration Helper. For the entire process, we compared the monthly model outputs with the average monthly discharge data at the Puente Tona station, which is located at the closing point of the watershed (see Figure 2). The automatic calibration required the identification of a series of key parameters to calibrate and their suggested range of values. Through the literature review process, we identified 23 parameters that could be important for our study site (see Table S3). We ran many iterations (each having 500–1000 simulations) trying to narrow down the sensitive model parameters and adequate ranges of values for each of them. To check on the evolution of the calibration process, we monitored two SWAT-CUP indicators (r-factor and p-factor) and three objective functions (Nash-Sutcliffe (NSE), PBIAS, and R2).
The r-factor and p-factor indicators are related to the 95% prediction uncertainty (95PPU), a probability band that represents the family of model outputs after running a large number of simulations (500–1000) for a given iteration with SWAT-CUP. Ideally, p-factor, the percentage of observed discharge data that falls within the 95PPU band, should be close to 1; the r-factor, representing the thickness of the 95PPU band, should be a small number, near or less than 1. Following the recommendations of Moriasi et al. [62], we aimed to obtain an NSE greater than 0.5, a PBIAS between the ±25 range, and an R2 tending to 1. After many iterations with still unsatisfactory results for the indicators, we moved to a manual calibration, based on the advances reached with the automatic calibration process. One by one, we changed parameter values and attempted to move from global changes to subwatershed changes. We observed how those changes resulted in improvement in NSE, PBIAS, and R2 statistics. The updated model with these final values was used for the validation process for the period 1998–2002.

2.5. Future Scenarios

We used the calibrated model to obtain estimates of water yield for the historical conditions and a set of scenarios that combined future climate and land use changes. The future climate was simulated by the daily time series of precipitation and temperature (maximum and minimum) of the MIROC5 model for RCP 4.5 and 8.5, for the 2006–2050 period. For land use, we focused on the simulation of scenarios from the water manager perspective, which implies that there is a trend to conservation on this strategic watershed. We proposed that watershed managers could have three different scenarios. Scenario A: LULC as present conditions. Scenario B: a less strict path to conservation, with an LULC proposal that balances conservation and production. In this scenario, transitory crops switch to permanent crops (BANA to COFF), natural and cultivated pastures switch to natural forms of vegetation and planted forest (PAST, SPAS to MESQ, PINE), mixed lands switch to permanent crops, silvopastoral, and natural forms of vegetation (RYEG, SWRN to COFF, RNGB, MESQ), and current silvopastoral practices switch to natural forms of vegetation (RNGB to MESQ) (see Columns 1–3 of Table 4). Scenario C: a more strict path to conservation/protection that changes most of the current LULC to forest (BANA, PAST, RNGB, RYEG, SPAS, SWRN to FRST) and allows, in some areas, the transition of mixed crops to silvopastoral practices and natural forms of vegetation (RYEG to RNGB, MESQ) (see Columns 4–6 of Table 4). The “Subwatersheds” columns in Table 4 indicate the areas where changes happened for each of the two scenarios. The “Land Use Update” tool of ArcSWAT allowed us to apply the LULC changes for the B and C scenarios. Tables S4–S6 provide more clarity on the extension of these changes by showing the areas (ha) and corresponding percentage of the total area of the watershed, for each of the LULC scenarios. Figure S6 provides a visual comparison of the three LULC scenarios.
To test our hypothesis that both climate and land use have an impact on the watershed’s water yield, we ran our model under six different future scenarios that combined one climate and one LULC. The effective simulation period for the future scenarios was 2010 to 2050 and the outputs of the model runs had a monthly interval (see Table 5).

3. Results

The initial model run in ArcSWAT for the historical period (1987–2002) produced very poor statistics (NSE = −1.96, PBIAS = −2.54, and R2 = 0.09) when comparing monthly model outputs and mean monthly discharge (m3 s−1) at the Puente Tona station. The automatic calibration, using SWAT-CUP, improved them but not to a satisfactory level (NSE = 0.31, PBIAS = 0.4, and R2 = 0.32; p-factor = 0.5 and r-factor = 0.58); Figure S7 shows the results for the last iteration executed. The main advantage of the automatic calibration process was that it simultaneously helped to narrow the windows for all the parameter ranges (see Figure S7c). These new ranges were the starting point when moving to a manual calibration process that improved the statistics to acceptable values (NSE = 0.48, PBIAS = 0.18, and R2 = 0.48); Table S7 shows the parameter multipliers used for the manual calibration within ArcSWAT. Figure 3 shows the comparison between observed and modeled discharge at the Puente Tona station. Although the calibrated model can simulate the general trend of the observed flows, there are still important differences between the two lines, especially for the simulation of large flows. This needs to be addressed in future studies. Furthermore, the error metrics for the validation period were not satisfactory (NSE = −1.23, PBIAS = 32.87, and R2 = 0.07). We present our reasoning for these poor results within the discussion section.

3.1. Water Yield for the Calibrated Model

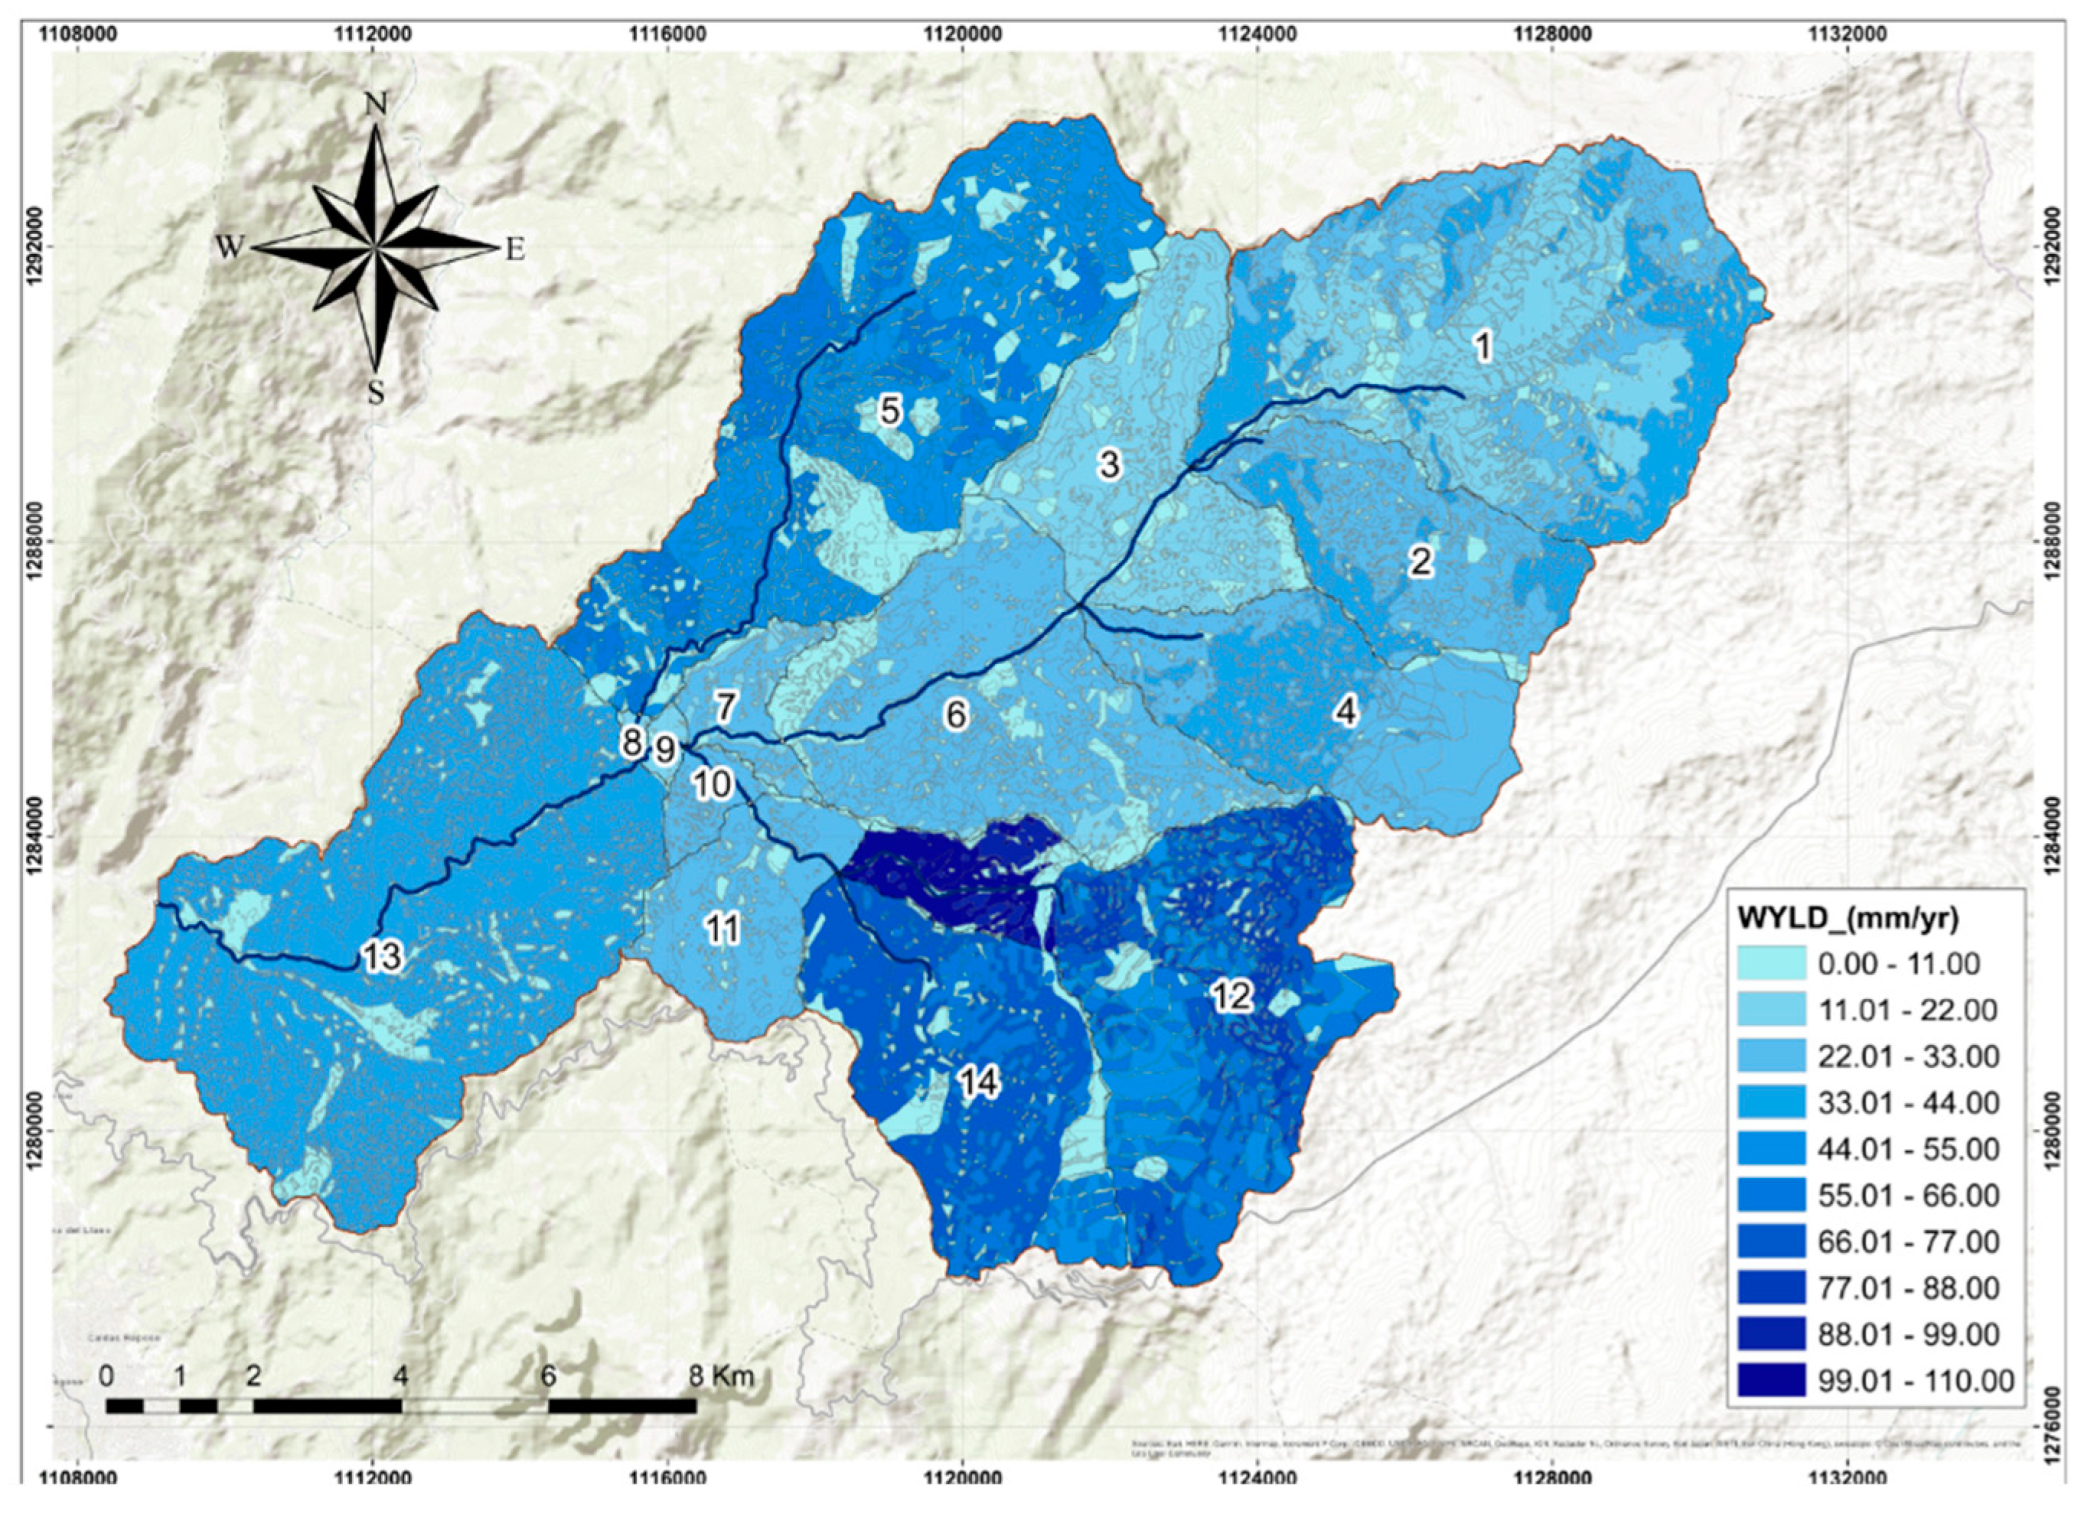
The calibrated model provides estimates of average annual water yield for the historical period. At the watershed scale, the average annual water yield is 495.5 mm year−1 with contributions of 10.9 mm year−1 from surface runoff, 156.0 mm year−1 from lateral flow, and 328.6 mm year−1 from groundwater contributions (shallow and deep aquifer). No transmission losses or pond abstractions are accounted for in this case. The significant contribution of groundwater is consistent with the baseflow analysis where contributions from groundwater averaged 69%. At the HRU level (see Figure 4), the spatial distribution of water yield shows that HRUs within subwatersheds 12 and 14 (Golondrinas drainage area) hold the largest average annual values (larger than 66 mm year−1), followed by those located in subwatershed 5 (Arnania drainage area) with values in the 33–66 mm year−1 range. The rest of the HRUs (Carrizal and lower Tona drainage areas) have the lowest average annual water yield (less than about 33 mm year−1).

3.2. Water Yield for Future Scenarios

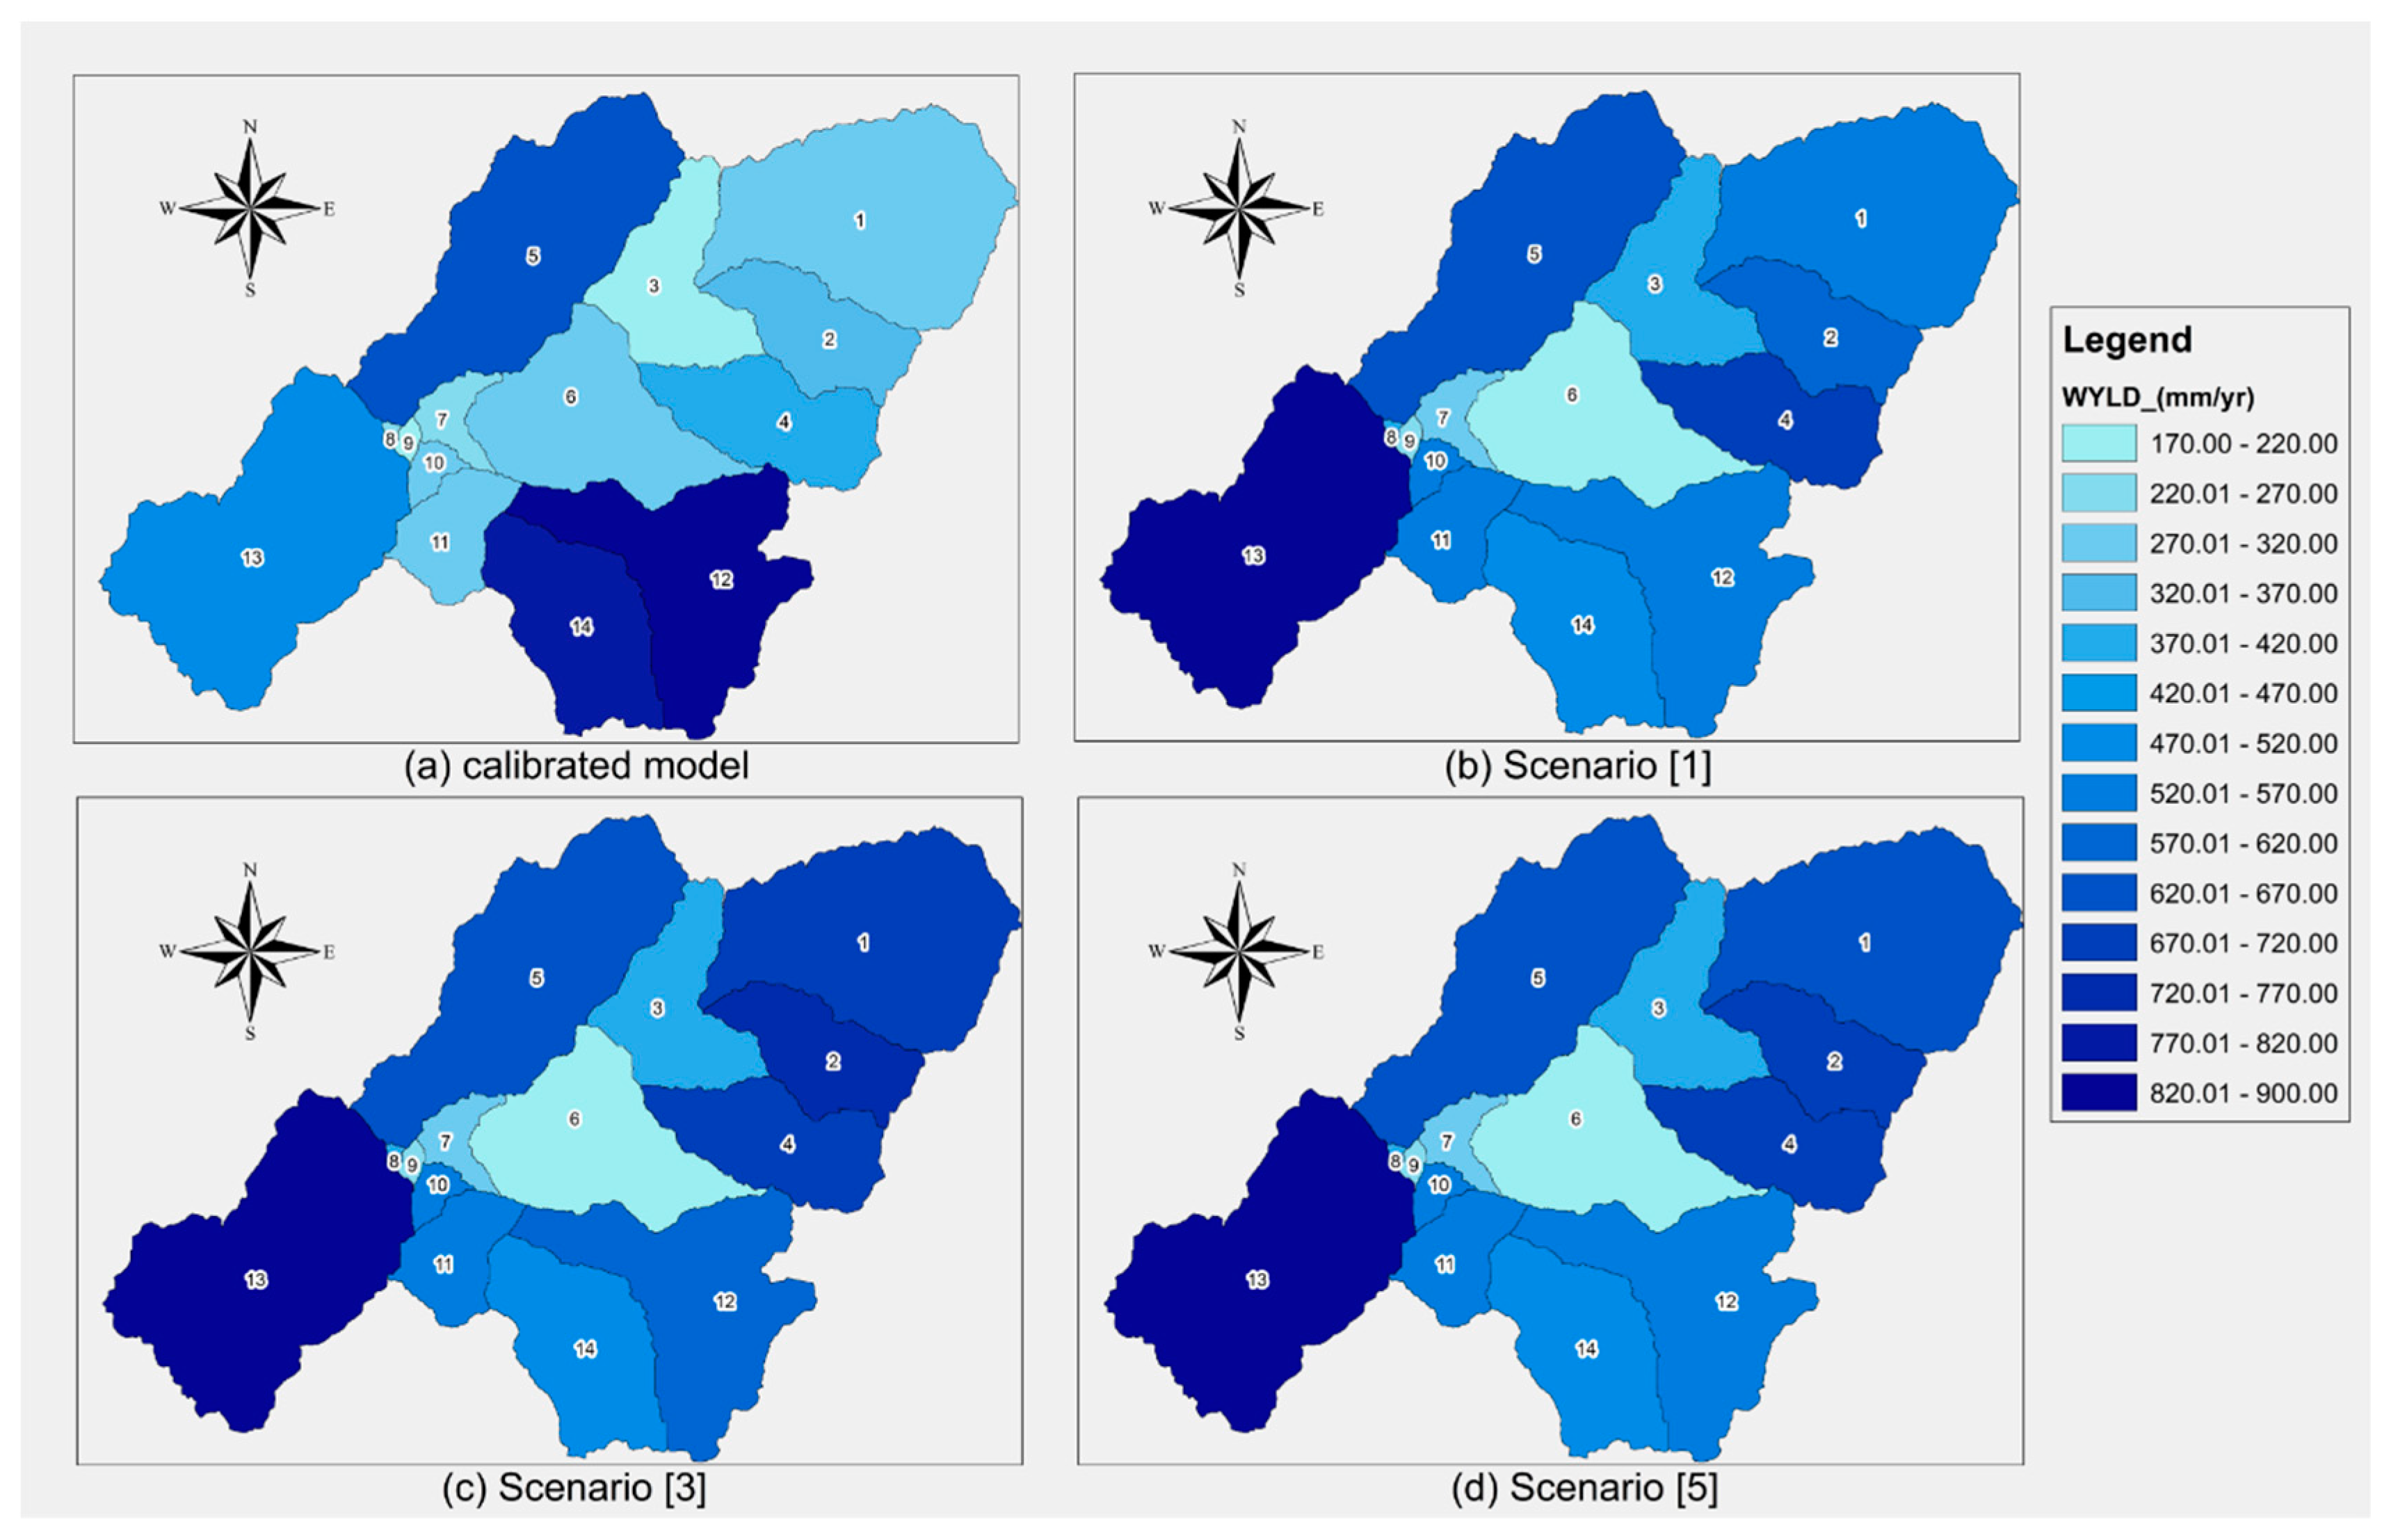
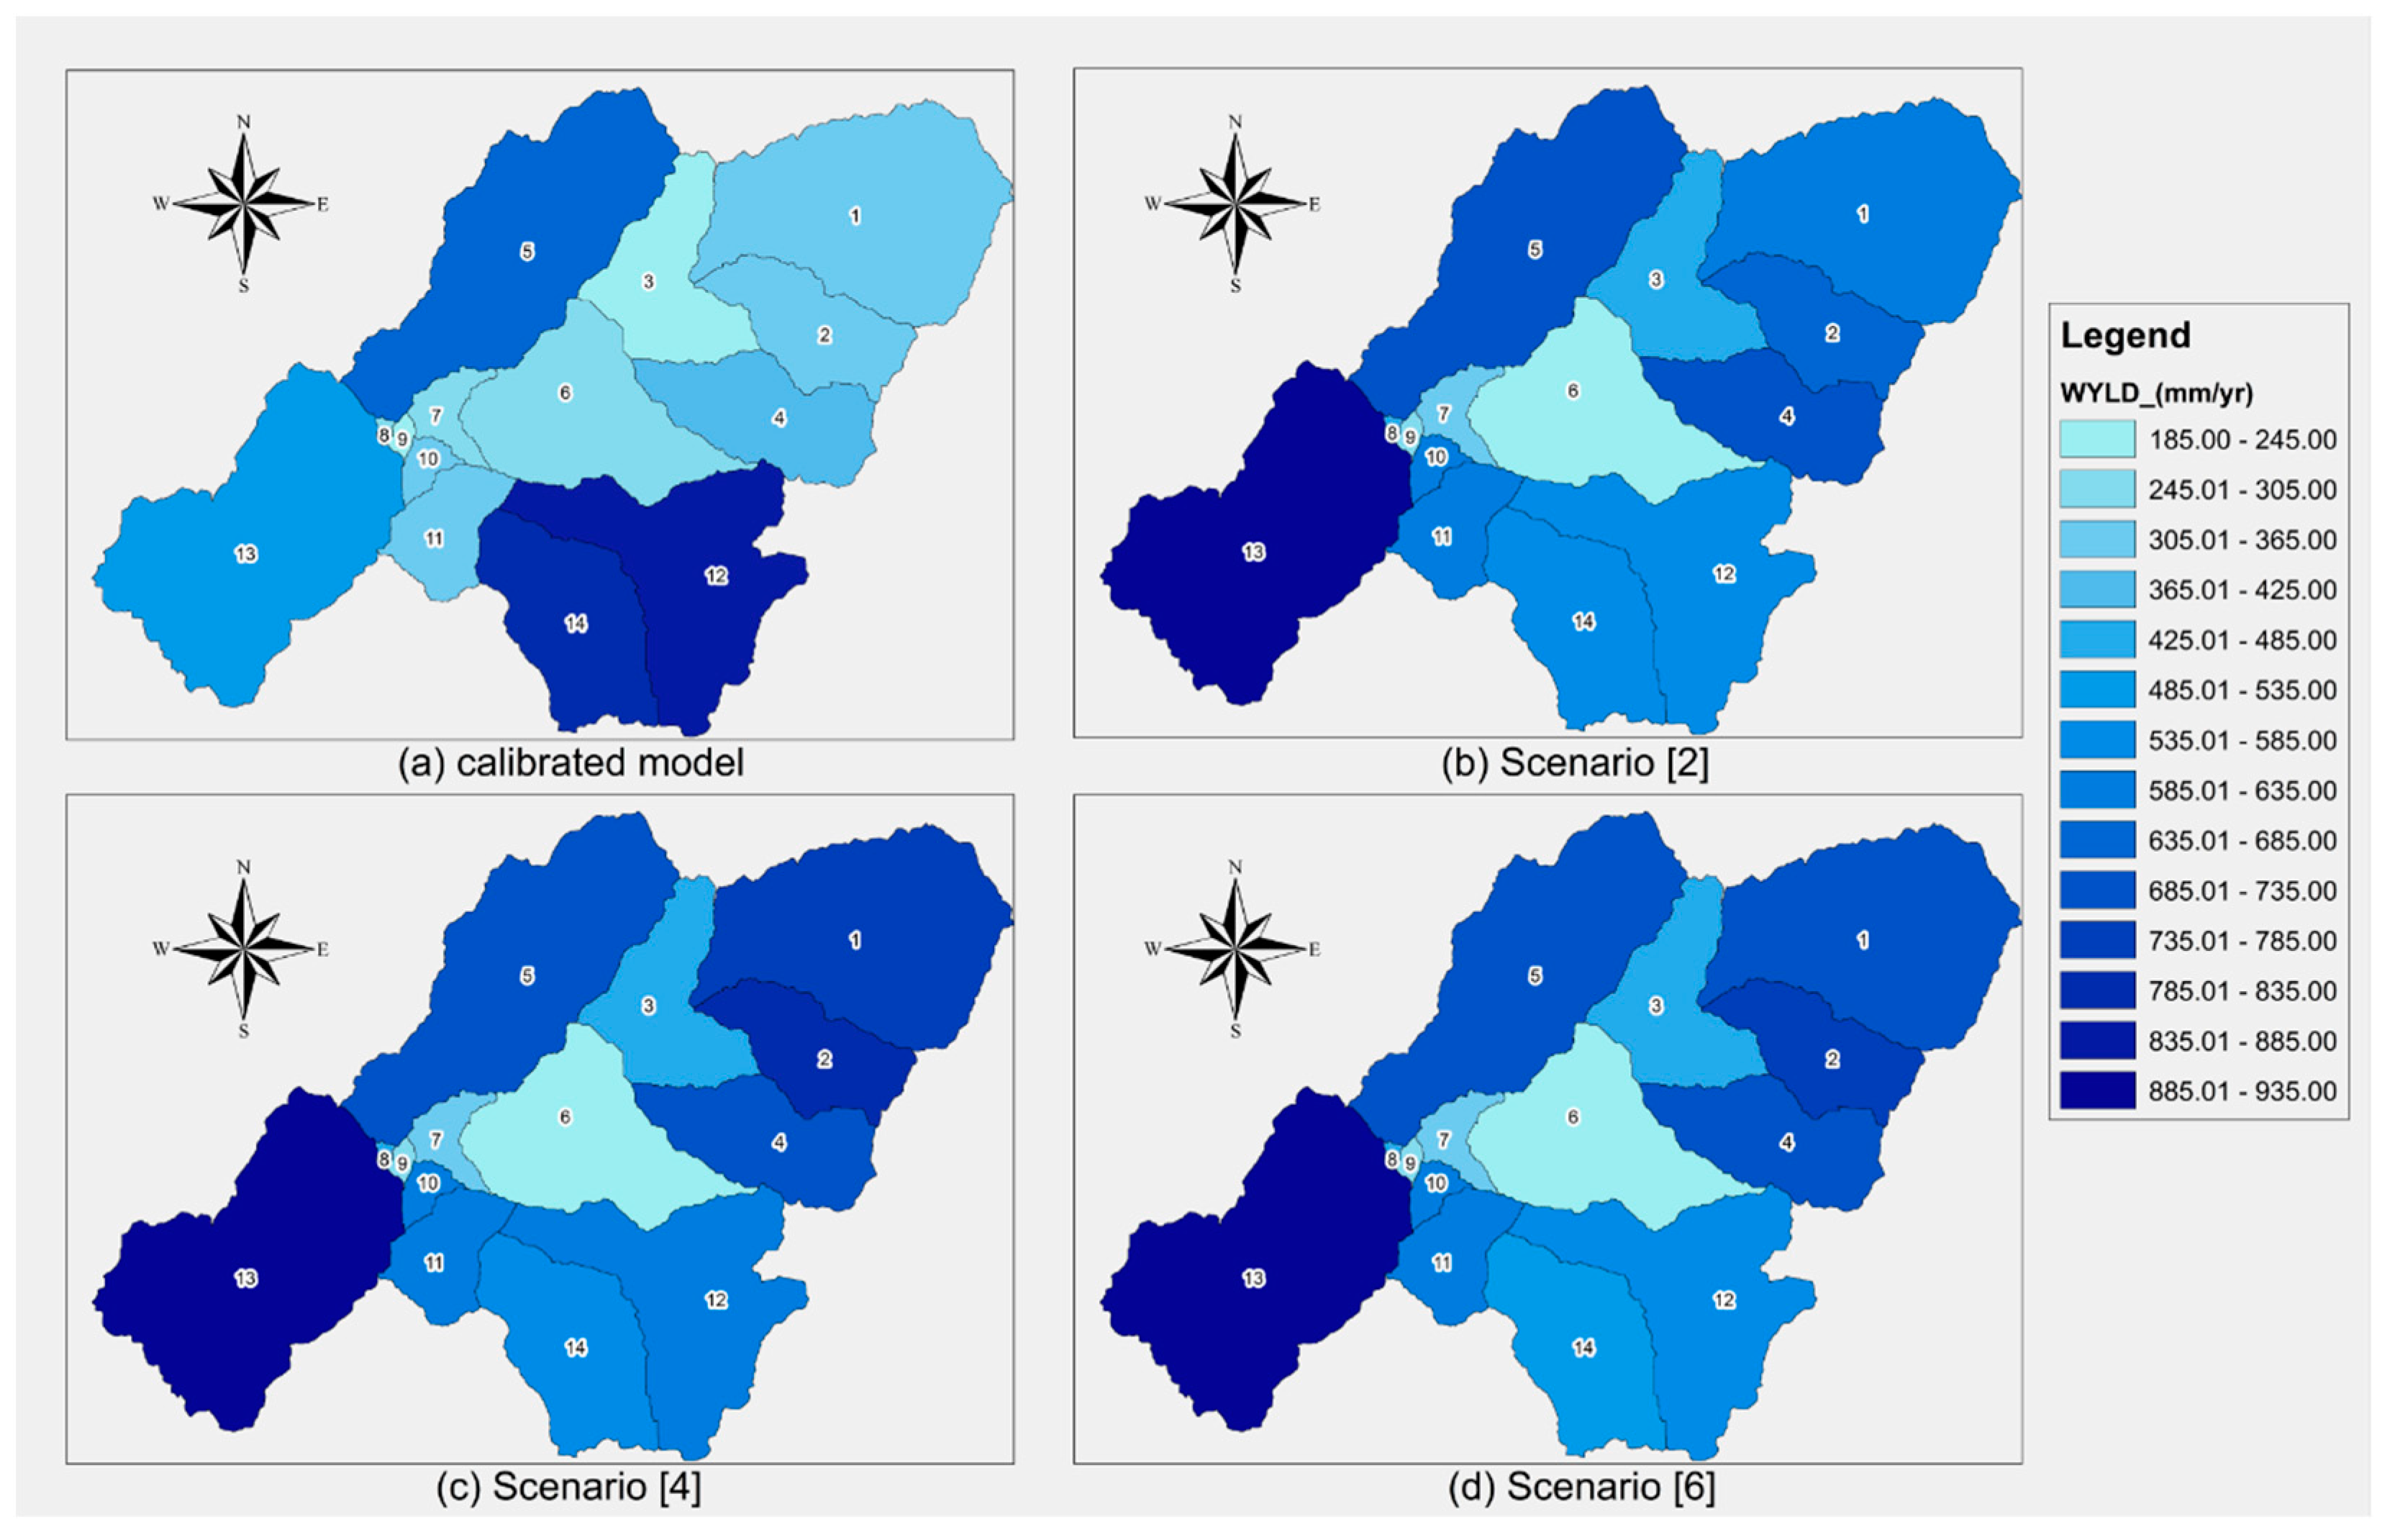
To evaluate the estimates of water yield for the future scenarios, we first focus on global results (watershed scale) and then look at spatially distributed values at the subwatershed level. In terms of precipitation, historical records show an average annual precipitation for the watershed of 1148.8 mm, while a future climate of RCP 4.5 presents an average annual precipitation of 1334.8 mm and RCP 8.5 reports an average annual precipitation of 1400.0 mm; a 16.2% and a 21.9% increase with respect to the historical records, respectively. The increase in precipitation for the future scenarios consistently results in increases in the average annual water yield (see Table 6). Furthermore, when looking at the effect of land use changes, LULC Scenario B ({3} and {4}) result in greater water yield estimates compared to LULC Scenario C ({5} and {6}). Considering LULC Scenario A as baseline conditions, there is an average increase of 5.8% for LULC Scenario B with respect to LULC Scenario A, while only a 2.9% average increase for LULC Scenario C.
The average annual water yield by subwatershed shows shifts in the spatial distribution for the different modeled scenarios. The effect of the new climate is evident when looking at Panels (a) and (b) of Figure 5 (RCP 4.5 climate) and 6 (RCP 8.5 climate). For these two figures, Panels (a) correspond to water yield distribution by subwatershed for the calibrated model for the historical observed climate, while Panels (b) correspond to spatial water yield for the current land use but for a future climate (Scenarios {1} or {2}). We do not discuss here about changes between Panels (a) and (b) of these two figures because they depend on two different sources of climate (historical climate records for Panel (a) and downscaled climate model for Panel (b)). Instead, we focus on the changes occurring between Panels (b), (c), and (d). Panel (c) shows water yield for Scenarios {3} and {4}, and Panel (d) show water yield for Scenarios {5} and {6}.
Future climate RCP 4.5 generates a range of annual water yield by subwatershed between 170 and 900 mm year−1 (see Figure 5), while the range for future climate RCP 8.5 is between 185 and 935 mm year−1 (see Figure 6). When looking at the effects of LULC change for a given climate with respect to baseline conditions, some subwatersheds show none to very small changes (from subwatersheds 3 to 11, 13, and 14). The major changes (more than 10% with respect to baseline conditions) occur in the headwaters of the Carrizal and Golondrinas drainage areas (subwatersheds 1, 2, and 12). The actual values of water yield by subwatershed for each of the future scenarios are in Table S8.

4. Discussion

The SWAT model calibration work allowed us to simulate the observed discharge at the closing point of the Tona watershed to an acceptable level. The error metrics for the calibration process were in the “satisfactory” category according to Moriasi et al. (2007) [62] and a T-test between observed and calibrated flows (1990–1997) confirmed no significant difference between means for these two data sets (t = 0.036, df = 157, P = 0.971). The “unsatisfactory” results of the validation period (1999–2002) were confirmed by the T-test (t = 4.833, df = 89, P = 5.58 × 10⁻⁶) between observed and modeled flows. Because the model in its current version is weak at simulating large flows, we attribute the very poor error metrics of the validation period to the coincidence between a short period for this modeling phase (1999–2002) and the occurrence of a La Niña event that started in the June–August trimester of 1998 and ended on the January–March trimester of 2001 [63]. For the level of performance rating of our model, having a longer period for validation would have averaged out this condition of large flows and potentially resulted in better error metrics for the validation phase. The uncertainty of the discharge estimates in our study relates with the modeling effort of Siqueira et al. (2018) [64], which, for continental South America, using gauging station data and a “regions of parameter sets” calibration strategy, had satisfactory fits (NSE > 0.6) between modeled and observed values for 55% of the gauging stations evaluated. Some of the lower fits were located in regions strongly influenced by orography. For the case of the Colombian Andes, the fits were highly variable with only 45% of the stations having good performance ratings (NSE > 0.6).
Increasing the model efficiency will require further work on many aspects, such as improving the quality of model inputs, obtaining better site parameters to include within the model, and using better observed discharge data and a longer time series for the calibration and validation processes. We anticipate that modeling efforts done in other Central and South American countries could face similar challenges. We see that the lack of integration between agencies and the absence of standardized policies for data collection and processing, at the national level, have a direct influence on the quality and continuity of key climate and river discharge information. In our case, these issues narrowed down our time window for watershed modeling and reduced the amount of stations that we could use (hydrometric and pluviometric). It is also indispensable that local agencies understand the value of the information that they collect, the importance of making it available, and the potentiality of that information for producing new knowledge and facilitating their decision-making processes.
The spatial distribution of water yield at the Tona watershed for the historical conditions (see Figure 4) follows the average annual precipitation pattern defined by the isohyet lines (see Figure S1). Using the Martin Gil precipitation station would probably have increased the water yield for the HRUs in the Arnania drainage area (precipitation data for this station was unavailable for our study period). Given the precipitation conditions defined by the time series available for the study period, we see that LULC played an important role on water yield. For example, HRUs with natural and cultivated pastures (PAST and SPAS) located at the high-elevation subwatersheds (1, 2, 5, and 14) had low water yield with respect to other uses in these subwatersheds. Wooded pastures (RNGB) had a mixed effect: relatively higher water yield for HRUs within subwatershed 5 and lower for HRUs within subwatersheds 1 and 12. Ranges of water yield for planted forest (PINE) were similar to those of forest (FRST) and brush (MESQ) on the headwaters of the Arnania drainage area (subwatershed 5), similar to MESQ for subwatersheds 1 and 2 and, in other areas of the watershed, water yield for PINE resulted in relatively less water yield (compared to water yield of other LULC within each subwatershed). The role of LULC on water yield was harder to identify at the lower elevation areas of the watershed. It is critical to continue working on the understanding of the dependencies between soils, slope, and LULC to better inform watershed management operations within this watershed.
Our proposal of the future scenarios is directly related to a watershed management application: a water company that needs to work on watershed conservation/protection practices on its supplying watershed and that needs to make informed decisions. We did not consider pessimistic LULC scenarios because that is not a possibility for the agency (practically or legally). LULC Scenario A considered the watershed continuing the same type of current activities while Scenarios B and C looked for conservation/protection in two different ways. Scenario B aimed for a “natural” transition to recovery of the upper areas of the watershed while still allowing for selected forms of agroforestry land at the higher elevations and selected forms of agricultural land at the lower elevations. Scenario C aimed for the typical concept of reforestation throughout the higher elevations of the watershed and allowed for certain types of agroforestry and agricultural land at the lower elevations. The future climate scenarios covered two realistic possibilities: RCP 4.5 and RCP 8.5. Because there is no evidence that a significant reduction of greenhouse gas emissions will occur any time soon, we decided to dismiss the possibility of using optimistic climate scenarios.
Despite the uncertainties associated with the model calibration and the potential errors associated with the selection of a climate model for the watershed [13], running the combined future scenarios ({1} through {6}) helped to identify key aspects for watershed management. First, more water may be entering the watershed as precipitation. Our model reported an increase in mean annual precipitation of 16.2% for RCP 4.5 and 21.9% for RCP 8.5. This result is consistent with the JULES ecosystem-hydrology model of Betts et al. (2018) [12], which shows a tendency toward increased runoff in our study region. Second, it is vital that watershed managers understand the processes that connect the physical properties of the watershed and the activities that happen in it. Our study focused on LULC as a determinant of water yield. We used Scenarios {1} and {2} (corresponding to LULC Scenario A and future climates for RCP 4.5 and 8.5) as a baseline for Scenarios {3} and {5} and Scenarios {4} and {6}, respectively, to evaluate the difference between two strategies for conservation/protection of the watershed. By doing this, we avoided uncertainties related to climate. Our results (see Table 6) found that both LULC strategies (Scenarios B and C) increased water yield, but Scenario B had a larger percent increase with respect to baseline conditions. When examining the actual ET reported by each of the scenarios, we found that, while for LULC Scenario B there was a similar increase in both water yield and actual ET, this was not the case for LULC Scenario C, where the percent increase in actual ET was larger than the percent increase in water yield. These results are consistent with the postulate that reforestation or afforestation have a decreasing effect on runoff via increase of evapotranspiration at the small catchment scale [7].
The spatial variation of water yield by subwatershed under the different scenarios showed that significant (more than 10%) water yield increases occurred only at particular subwatersheds. Further investigation of the LULC changes at these watersheds (1, 2, and 12) revealed that the increases were related to changes from natural and cultivated pastures (PAST and SPAS) to the proposed LULC (brush or forest) at the headwaters of the Carrizal and Golondrinas drainage areas. Similar changes at lower elevation watersheds did not produce significant changes in water yield. These results suggest that it is possible for water managers at the Tona watershed (and any other watershed where a similar exercise was carried out) to determine the types of LULC changes and the locations within the study area where specific changes would result in a desired condition. This is consistent with the idea that watershed management practices may be more successful when supported with modeling tools [65,66].

5. Conclusions

The results of this paper confirm our initial hypothesis that not only climate but land use changes determine water yield within this Andean watershed. Using a semi-distributed hydrologic model, we were able to identify how these two factors could affect water yield at the watershed and subwatershed scale. Even though climate is not a factor that can be directly controlled by water managers, LULC is. Our results show that different approaches to LULC changes for a given climate, generated different estimates of water yield. For both factors, however, in terms of watershed management decisions, it is evident that there needs to be expert input so that the most adequate climate model is used and there is an advanced understanding of the role that different types of LULC play on the dynamics of the hydrologic cycle of the watershed. The use of a physical hydrologic model such as SWAT can help significantly with this task.
Even with the difficulties that we had on the calibration process of the Tona watershed and the uncertainties related to the future climate data, our model identified, at the HRU level, the areas within the watershed with the highest and lowest water yield. For the future combined scenarios, we singled out subwatersheds where land use changes result in actual increases of the local water yield: subwatersheds 1 and 2 for the Carrizal drainage area and subwatershed 12 for the Golondrinas drainage area, all of which are located in the headwaters. These results are important because the large size of these subwatersheds (with respect to the total area of the Tona watershed) imply that they will have an important contribution to the main channel’s discharge. Our results also suggest the necessity to carefully evaluate, through modeling, the effect of certain land use changes on water yield. In our case, the future LULC scenarios had a “conservation” objective with two different strategies. In the end, both increased the water yield, but one (Scenario B) was more effective because there were fewer losses through evapotranspiration.

Supplementary Materials

The following are available online at https://www.mdpi.com/2073-4441/11/2/285/s1, Figure S1. Isohyet lines of average annual precipitation for the Tona watershed, Figure S2. Digital elevation model of the Tona watershed, Figure S3. Soils map of the Tona watershed, Figure S4. Land use / land cover (LULC) map of the Tona watershed, Figure S5. Location of the Tona watershed with respect to centers of pixel of the NEX-GDDP project, Figure S6. Land use scenarios A (top), B (center), and C (bottom) for the study, Figure S7. Results of the last iteration for the automatic calibration of the Tona watershed (Puente Tona Station) using SWAT-CUP; Table S1. Fourteen new soil categories added to the SWAT soils database, Table S2. Stations with climatic and hydrological data available for the Tona watershed, Table S3. Initial calibration parameters used for SWAT-CUP, Table S4. Areas (ha) by subwatershed for LULC Scenario A, Table S5. Areas (ha) by subwatershed for LULC Scenario A, Table S6. Areas (ha) by subwatershed for LULC Scenario A, Table S7. Results of the last iteration for the automatic calibration of the Tona watershed using SWAT-CUP, Table S8. Water yield (WYLD) by subwatershed for the future scenarios.

Author Contributions

Conceptualization, S.R.V. and S.M.P.; Methodology, S.R.V.; Validation, S.R.V. and S.M.P.; Formal Analysis, S.R.V. and G.A.C.; Investigation, S.R.V. and G.A.C.; Resources, S.M.P.; Writing—Original Draft Preparation, S.R.V. and G.A.C.; Writing—Review & Editing, S.R.V., S.M.P., and G.A.C.; Visualization, S.R.V. and G.A.C.; Supervision, S.R.V. and S.M.P.; Project Administration, S.R.V.; Funding Acquisition, S.R.V. and S.M.P.

Funding

This research was funded by Universidad Pontificia Bolivariana, grant number [086-0117-2300].

Acknowledgments

The authors acknowledge the support given by Acueducto Metropolitano de Bucaramanga (AMB) and Corporación Autónoma Regional para la Defensa de la Meseta de Bucaramanga (CDMB). Both institutions provided key information for the development of the project and were always kind and receptive to the authors requests.

Conflicts of Interest

The authors declare no conflict of interest. The funders had no role in the design of the study; in the collection, analyses, or interpretation of data; in the writing of the manuscript; or in the decision to publish the results.

References

  1. USDA Natural Resources Conservation Service Chapter 20 Watershed Yield. In National Engineering Handbook; Part 630; Volume Hydrology; USDA: Washington, DC, USA, 2009.
  2. Lüke, A.; Hack, J. Comparing the Applicability of Commonly Used Hydrological Ecosystem Services Models for Integrated Decision-Support. Sustainability 2018, 10, 346. [Google Scholar] [CrossRef]
  3. Tallis, H. Natural Capital: Theory and Practice of Mapping Ecosystem Services; Oxford University Press: Oxford, UK, 2011; ISBN 978-0-19-958899-2. [Google Scholar]
  4. Guzha, A.C.; Rufino, M.C.; Okoth, S.; Jacobs, S.; Nóbrega, R.L.B. Impacts of land use and land cover change on surface runoff, discharge and low flows: Evidence from East Africa. J. Hydrol. Reg. Stud. 2018, 15, 49–67. [Google Scholar] [CrossRef]
  5. Zhang, M.; Liu, N.; Harper, R.; Li, Q.; Liu, K.; Wei, X.; Ning, D.; Hou, Y.; Liu, S. A global review on hydrological responses to forest change across multiple spatial scales: Importance of scale, climate, forest type and hydrological regime. J. Hydrol. 2017, 546, 44–59. [Google Scholar] [CrossRef]
  6. Dias, L.C.P.; Macedo, M.N.; Costa, M.H.; Coe, M.T.; Neill, C. Effects of land cover change on evapotranspiration and streamflow of small catchments in the Upper Xingu River Basin, Central Brazil. J. Hydrol. Reg. Stud. 2015, 4, 108–122. [Google Scholar] [CrossRef]
  7. Ellison, D.; Futter, M.N.; Bishop, K. On the forest cover–water yield debate: From demand- to supply-side thinking. Glob. Chang. Biol. 2012, 18, 806–820. [Google Scholar] [CrossRef]
  8. Molina, A.; Vanacker, V.; Balthazar, V.; Mora, D.; Govers, G. Complex land cover change, water and sediment yield in a degraded Andean environment. J. Hydrol. 2012, 472–473, 25–35. [Google Scholar] [CrossRef]
  9. Little, C.; Lara, A.; McPhee, J.; Urrutia, R. Revealing the impact of forest exotic plantations on water yield in large scale watersheds in South-Central Chile. J. Hydrol. 2009, 374, 162–170. [Google Scholar] [CrossRef]
  10. Schilling, K.E.; Jha, M.K.; Zhang, Y.-K.; Gassman, P.W.; Wolter, C.F. Impact of land use and land cover change on the water balance of a large agricultural watershed: Historical effects and future directions. Water Resour. Res. 2008, 44. [Google Scholar] [CrossRef]
  11. Brown, A.E.; Zhang, L.; McMahon, T.A.; Western, A.W.; Vertessy, R.A. A review of paired catchment studies for determining changes in water yield resulting from alterations in vegetation. J. Hydrol. 2005, 310, 28–61. [Google Scholar] [CrossRef]
  12. Betts, R.A.; Alfieri, L.; Bradshaw, C.; Caesar, J.; Feyen, L.; Friedlingstein, P.; Gohar, L.; Koutroulis, A.; Lewis, K.; Morfopoulos, C.; et al. Changes in climate extremes, fresh water availability and vulnerability to food insecurity projected at 1.5 °C and 2 °C global warming with a higher-resolution global climate model. Phil. Trans. R. Soc. A 2018, 376, 20160452. [Google Scholar] [CrossRef]
  13. Krysanova, V.; Hattermann, F.F. Intercomparison of climate change impacts in 12 large river basins: Overview of methods and summary of results. Clim. Chang. 2017, 141, 363–379. [Google Scholar] [CrossRef]
  14. Li, Z.; Huang, G.; Wang, X.; Han, J.; Fan, Y. Impacts of future climate change on river discharge based on hydrological inference: A case study of the Grand River Watershed in Ontario, Canada. Sci. Total Environ. 2016, 548–549, 198–210. [Google Scholar] [CrossRef]
  15. Sorribas, M.V.; Paiva, R.C.D.; Melack, J.M.; Bravo, J.M.; Jones, C.; Carvalho, L.; Beighley, E.; Forsberg, B.; Costa, M.H. Projections of climate change effects on discharge and inundation in the Amazon basin. Clim. Chang. 2016, 136, 555–570. [Google Scholar] [CrossRef]
  16. Mehta, V.M.; Mendoza, K.; Daggupati, P.; Srinivasan, R.; Rosenberg, N.J.; Deb, D. High-Resolution Simulations of Decadal Climate Variability Impacts on Water Yield in the Missouri River Basin with the Soil and Water Assessment Tool (SWAT). J. Hydrometeor. 2015, 17, 2455–2476. [Google Scholar] [CrossRef]
  17. Yan, D.; Werners, S.E.; Ludwig, F.; Huang, H.Q. Hydrological response to climate change: The Pearl River, China under different RCP scenarios. J. Hydrol. Reg. Stud. 2015, 4, 228–245. [Google Scholar] [CrossRef]
  18. Elliott, J.; Deryng, D.; Müller, C.; Frieler, K.; Konzmann, M.; Gerten, D.; Glotter, M.; Flörke, M.; Wada, Y.; Best, N.; et al. Constraints and potentials of future irrigation water availability on agricultural production under climate change. Proc. Natl. Acad. Sci. USA 2014, 111, 3239–3244. [Google Scholar] [CrossRef] [PubMed]
  19. Madsen, H.; Lawrence, D.; Lang, M.; Martinkova, M.; Kjeldsen, T.R. Review of trend analysis and climate change projections of extreme precipitation and floods in Europe. J. Hydrol. 2014, 519, 3634–3650. [Google Scholar] [CrossRef]
  20. Schewe, J.; Heinke, J.; Gerten, D.; Haddeland, I.; Arnell, N.W.; Clark, D.B.; Dankers, R.; Eisner, S.; Fekete, B.M.; Colón-González, F.J.; et al. Multimodel assessment of water scarcity under climate change. Proc. Natl. Acad. Sci. USA 2014, 111, 3245–3250. [Google Scholar] [CrossRef] [PubMed]
  21. Zhang, L.; Cheng, L.; Chiew, F.; Fu, B. Understanding the impacts of climate and landuse change on water yield. Curr. Opin. Environ. Sustain. 2018, 33, 167–174. [Google Scholar] [CrossRef]
  22. Caldwell, P.V.; Miniat, C.F.; Elliott, K.J.; Swank, W.T.; Brantley, S.T.; Laseter, S.H. Declining water yield from forested mountain watersheds in response to climate change and forest mesophication. Glob. Chang. Biol. 2016, 22, 2997–3012. [Google Scholar] [CrossRef] [PubMed]
  23. Creed, I.F.; Spargo, A.T.; Jones, J.A.; Buttle, J.M.; Adams, M.B.; Beall, F.D.; Booth, E.G.; Campbell, J.L.; Clow, D.; Elder, K.; et al. Changing forest water yields in response to climate warming: Results from long-term experimental watershed sites across North America. Glob. Chang. Biol. 2014, 20, 3191–3208. [Google Scholar] [CrossRef] [PubMed]
  24. Yang, Q.; Tian, H.; Friedrichs, M.A.M.; Liu, M.; Li, X.; Yang, J. Hydrological Responses to Climate and Land-Use Changes along the North American East Coast: A 110-Year Historical Reconstruction. JAWRA J. Am. Water Resour. Assoc. 2014, 51, 47–67. [Google Scholar] [CrossRef]
  25. Sun, G.; McNulty, S.G.; Myers, J.A.M.; Cohen, E.C. Impacts of Multiple Stresses on Water Demand and Supply Across the Southeastern United States1. JAWRA J. Am. Water Resour. Assoc. 2008, 44, 1441–1457. [Google Scholar] [CrossRef]
  26. Zhou, G.; Wei, X.; Chen, X.; Zhou, P.; Liu, X.; Xiao, Y.; Sun, G.; Scott, D.F.; Zhou, S.; Han, L.; et al. Global pattern for the effect of climate and land cover on water yield. Nat. Commun. 2015, 6, 5918. [Google Scholar] [CrossRef] [PubMed]
  27. Roa-García, M.C.; Brown, S.; Schreier, H.; Lavkulich, L.M. The role of land use and soils in regulating water flow in small headwater catchments of the Andes. Water Resour. Res. 2011, 47. [Google Scholar] [CrossRef]
  28. Wohl, E.; Barros, A.; Brunsell, N.; Chappell, N.A.; Coe, M.; Giambelluca, T.; Goldsmith, S.; Harmon, R.; Hendrickx, J.M.H.; Juvik, J.; et al. The hydrology of the humid tropics. Nat. Clim. Chang. 2012, 2, 655–662. [Google Scholar] [CrossRef]
  29. Murtinho, F.; Tague, C.; de Bievre, B.; Eakin, H.; Lopez-Carr, D. Water Scarcity in the Andes: A Comparison of Local Perceptions and Observed Climate, Land Use and Socioeconomic Changes. Hum. Ecol. 2013, 41, 667–681. [Google Scholar] [CrossRef]
  30. Merwade, V.; Baffaut, C.; Bieger, K.; Boithias, L.; Rathjens, H. Featured Series Introduction: SWAT Applications for Emerging Hydrologic and Water Quality Challenges. JAWRA J. Am. Water Resour. Assoc. 2017, 53, 67–68. [Google Scholar] [CrossRef]
  31. van Griensven, A.; Ndomba, P.; Yalew, S.; Kilonzo, F. Critical review of SWAT applications in the upper Nile basin countries. Hydrol. Earth Syst. Sci. 2012, 16, 3371–3381. [Google Scholar] [CrossRef]
  32. Krysanova, V.; Arnold, J.G. Advances in ecohydrological modelling with SWAT—A review. Hydrol. Sci. J. 2008, 53, 939–947. [Google Scholar] [CrossRef]
  33. Gassman, P.W.; Reyes, M.R.; Green, C.H.; Arnold, J.G. The soil and water assessment tool: Historical development, applications, and future research directions. Trans. Asabe 2007, 50, 1211–1250. [Google Scholar] [CrossRef]
  34. Reshmidevi, T.V.; Nagesh Kumar, D.; Mehrotra, R.; Sharma, A. Estimation of the climate change impact on a catchment water balance using an ensemble of GCMs. J. Hydrol. 2018, 556, 1192–1204. [Google Scholar] [CrossRef]
  35. Lee, S.; Yeo, I.-Y.; Sadeghi, A.M.; McCarty, G.W.; Hively, W.D.; Lang, M.W.; Sharifi, A. Comparative analyses of hydrological responses of two adjacent watersheds to climate variability and change using the SWAT model. Hydrol. Earth Syst. Sci. 2018, 22, 689–708. [Google Scholar] [CrossRef]
  36. Xu, H.; Brown, D.G.; Steiner, A.L. Sensitivity to climate change of land use and management patterns optimized for efficient mitigation of nutrient pollution. Clim. Chang. 2018, 147, 647–662. [Google Scholar] [CrossRef]
  37. Paul, M.; Rajib, M.A.; Ahiablame, L. Spatial and Temporal Evaluation of Hydrological Response to Climate and Land Use Change in Three South Dakota Watersheds. JAWRA J. Am. Water Resour. Assoc. 2017, 53, 69–88. [Google Scholar] [CrossRef]
  38. de Almeida Bressiani, D.; Gassman, P.W.; Fernandes, J.G.; Garbossa, L.H.P.; Srinivasan, R.; Bonumá, N.B.; Mendiondo, E.M. Review of Soil and Water Assessment Tool (SWAT) applications in Brazil: Challenges and prospects. Int. J. Agric. Biol. Eng. 2015, 8, 9–35. [Google Scholar]
  39. Tapasco, J.; Quintero, M.; Uribe, N.; Valencia, J.; Calderón, S.; Romero, G.; Ordóñez, D.A.; Álvarez, A.; Sanchez-Aragon, L.; Ludeña, C.E. Impactos Económicos del Cambio Climático en Colombia: Recurso Hídrico; Banco Interamericano de Desarrollo/Inter-American Development Bank: Washington, DC, USA, 2015. [Google Scholar]
  40. Castañeda Morales, Y. Modelación del Efecto del Cambio de Uso del Suelo en la Cuenca del Rio Coello, Bajo Escenario de Cambio Climático, A Través De La Aplicación Del Modelo Hidrológico SWAT (Soil And Water Assessment Tool); Universidad Distrital: Bogotá, Colombia, 2017. [Google Scholar]
  41. Hoyos, N.; Correa-Metrio, A.; Jepsen, S.M.; Wemple, B.; Valencia, S.; Marsik, M.; Doria, R.; Escobar, J.; Restrepo, J.C.; Velez, M.I. Modeling Streamflow Response to Persistent Drought in a Coastal Tropical Mountainous Watershed, Sierra Nevada De Santa Marta, Colombia. Water 2019, 11, 94. [Google Scholar] [CrossRef]
  42. GRADEX Plan de Ordenamiento Ambiental Territorial Microcuenca río Tona; Corporación de Defensa de la Meseta de Bucaramanga: Bucaramanga, Colombia, 2012.
  43. Tobler, W. Measuring spatial resolution. In Proceedings of the International Workshop on Geographic Information Systems, Beijing, China, 2–6 June 1987; Volume 48. [Google Scholar]
  44. Batjes, N.H. Harmonized soil profile data for applications at global and continental scales: Updates to the WISE database. Soil. Use Manag. 2009, 25, 124–127. [Google Scholar] [CrossRef]
  45. SPAW Download Page. Available online: https://hrsl.ba.ars.usda.gov/SPAW/SPAWDownload.html (accessed on 6 August 2018).
  46. Valencia Gómez, J. Estimated Calibration Parameters in SWAT Model for Andean Watersheds. In Proceedings of the 2013 International SWAT Conference, Toulouse, France, 15–19 July 2013. [Google Scholar]
  47. Uribe Rivera, N.; Valencia Gómez, J. Impacto del Uso de la Tierra en la Generación de Caudales y Sedimentos: Caso Cuenca del Rí­o Tunjuelo—Cundinamarca—Observatorio Ambiental de Bogotá; International Center for Tropical Agriculture: Santiago de Cali, Colombia, 2010; p. 67. [Google Scholar]
  48. Valencia Gómez, J.; Nuevos Usos del Suelo en SWAT—Solicitud de Orientación. Personal communication, 2017.
  49. Instituto de Hidrología, Meteorología y Estudios Ambientales Solicitud de Información—IDEAM. Available online: http://www.ideam.gov.co/solicitud-de-informacion (accessed on 11 December 2018).
  50. CDMB Applied Research Committee for Environmental Management of the CDMB—CIAGA. Available online: http://www.cdmb.gov.co/web/sitios-de-interes-ambiental/ciaga (accessed on 11 December 2018).
  51. Acueducto Metropolitano de Bucaramanga S.A. E.S.P. Conócenos. Available online: http://www.amb.com.co:8081/wp_contenido/ (accessed on 11 December 2018).
  52. Palomino-Lémus, R.; Córdoba-Machado, S.; Gámiz-Fortis, S.R.; Castro-Díez, Y.; Estéban-Parra, M.J. Statistical downscaling of summer precipitation in Colombia. In Proceedings of the Cambio Climático y Cambio Global, Almería, España, 28–30 October 2014; p. 10. Available online: http://aeclim.org/wp-content/uploads/2016/02/Cambio-Climatico-y-Cambio-Global.pdf (accessed on 1 February 2019).
  53. Bonilla-Ovallos, C.A.; Mesa Sánchez, O.J. Validación de la precipitación estimada por modelos climáticos acoplados del proyecto de intercomparación CMIP5 en Colombia. Rev. Acad. Colomb. Cienc. ExactasFísicas Y Nat. 2017, 41, 107–118. [Google Scholar] [CrossRef]
  54. Gómez Estupiñán, D.F.; Rodríguez Buitrago, A.D. Aplicabilidad de datos Climatológicos Escalados Para la Modelación Hidrológica de la Cuenca del río Tona en Santander; Universidad Pontificia Bolivariana: Floridablanca, Santander, Colombia, 2018. [Google Scholar]
  55. National Aeronautics and Space Administration Advancing Research and Applications with NASA Climate Model Data. Available online: https://cds.nccs.nasa.gov/nex-gddp/ (accessed on 8 August 2018).
  56. Sandra, R. Villamizar SWAT Modeling for the Tona Watershed. Available online: https://figshare.com/projects/SWAT_modeling_for_the_Tona_Watershed/37520 (accessed on 15 August 2018).
  57. ArcSWAT. Available online: https://swat.tamu.edu/software/arcswat/ (accessed on 6 August 2018).
  58. Atlas Interactivo—Climatológico—IDEAM. Available online: http://atlas.ideam.gov.co/visorAtlasClimatologico.html (accessed on 6 August 2018).
  59. Numerical Terradynamic Simulation Group. Available online: http://www.ntsg.umt.edu/project/project/modis/mod16.php (accessed on 15 December 2018).
  60. Arnold, J.G.; Allen, P.M.; Muttiah, R.; Bernhardt, G. Automated Base Flow Separation and Recession Analysis Techniques. Groundwater 1995, 33, 1010–1018. [Google Scholar] [CrossRef]
  61. SWAT-CUP. Available online: https://swat.tamu.edu/software/swat-cup/ (accessed on 6 August 2018).
  62. DMoriasi, N.; Arnold, J.G.; van Liew, M.W.; Bingner, R.L.; Harmel, R.D.; Veith, T.L. Model Evaluation Guidelines for Systematic Quantification of Accuracy in Watershed Simulations. Trans. ASABE 2007, 50, 885–900. [Google Scholar] [CrossRef]
  63. Center, N.C.P. NOAA’s Climate Prediction Center. Available online: http://origin.cpc.ncep.noaa.gov/products/analysis_monitoring/ensostuff/ONI_v5.php (accessed on 11 August 2018).
  64. Siqueira, V.A.; Paiva, R.C.D.; Fleischmann, A.S.; Fan, F.M.; Ruhoff, A.L.; Pontes, P.R.M.; Paris, A.; Calmant, S.; Collischonn, W. Toward continental hydrologic–hydrodynamic modeling in South America. Hydrol. Earth Syst. Sci. 2018, 22, 4815–4842. [Google Scholar] [CrossRef]
  65. Yalew, S.G.; Pilz, T.; Schweitzer, C.; Liersch, S.; van der Kwast, J.; van Griensven, A.; Mul, M.L.; Dickens, C.; van der Zaag, P. Coupling land-use change and hydrologic models for quantification of catchment ecosystem services. Environ. Model. Softw. 2018, 109, 315–328. [Google Scholar] [CrossRef]
  66. McColl, C.; Aggett, G. Land-use forecasting and hydrologic model integration for improved land-use decision support. J. Environ. Manag. 2007, 84, 494–512. [Google Scholar] [CrossRef] [PubMed]
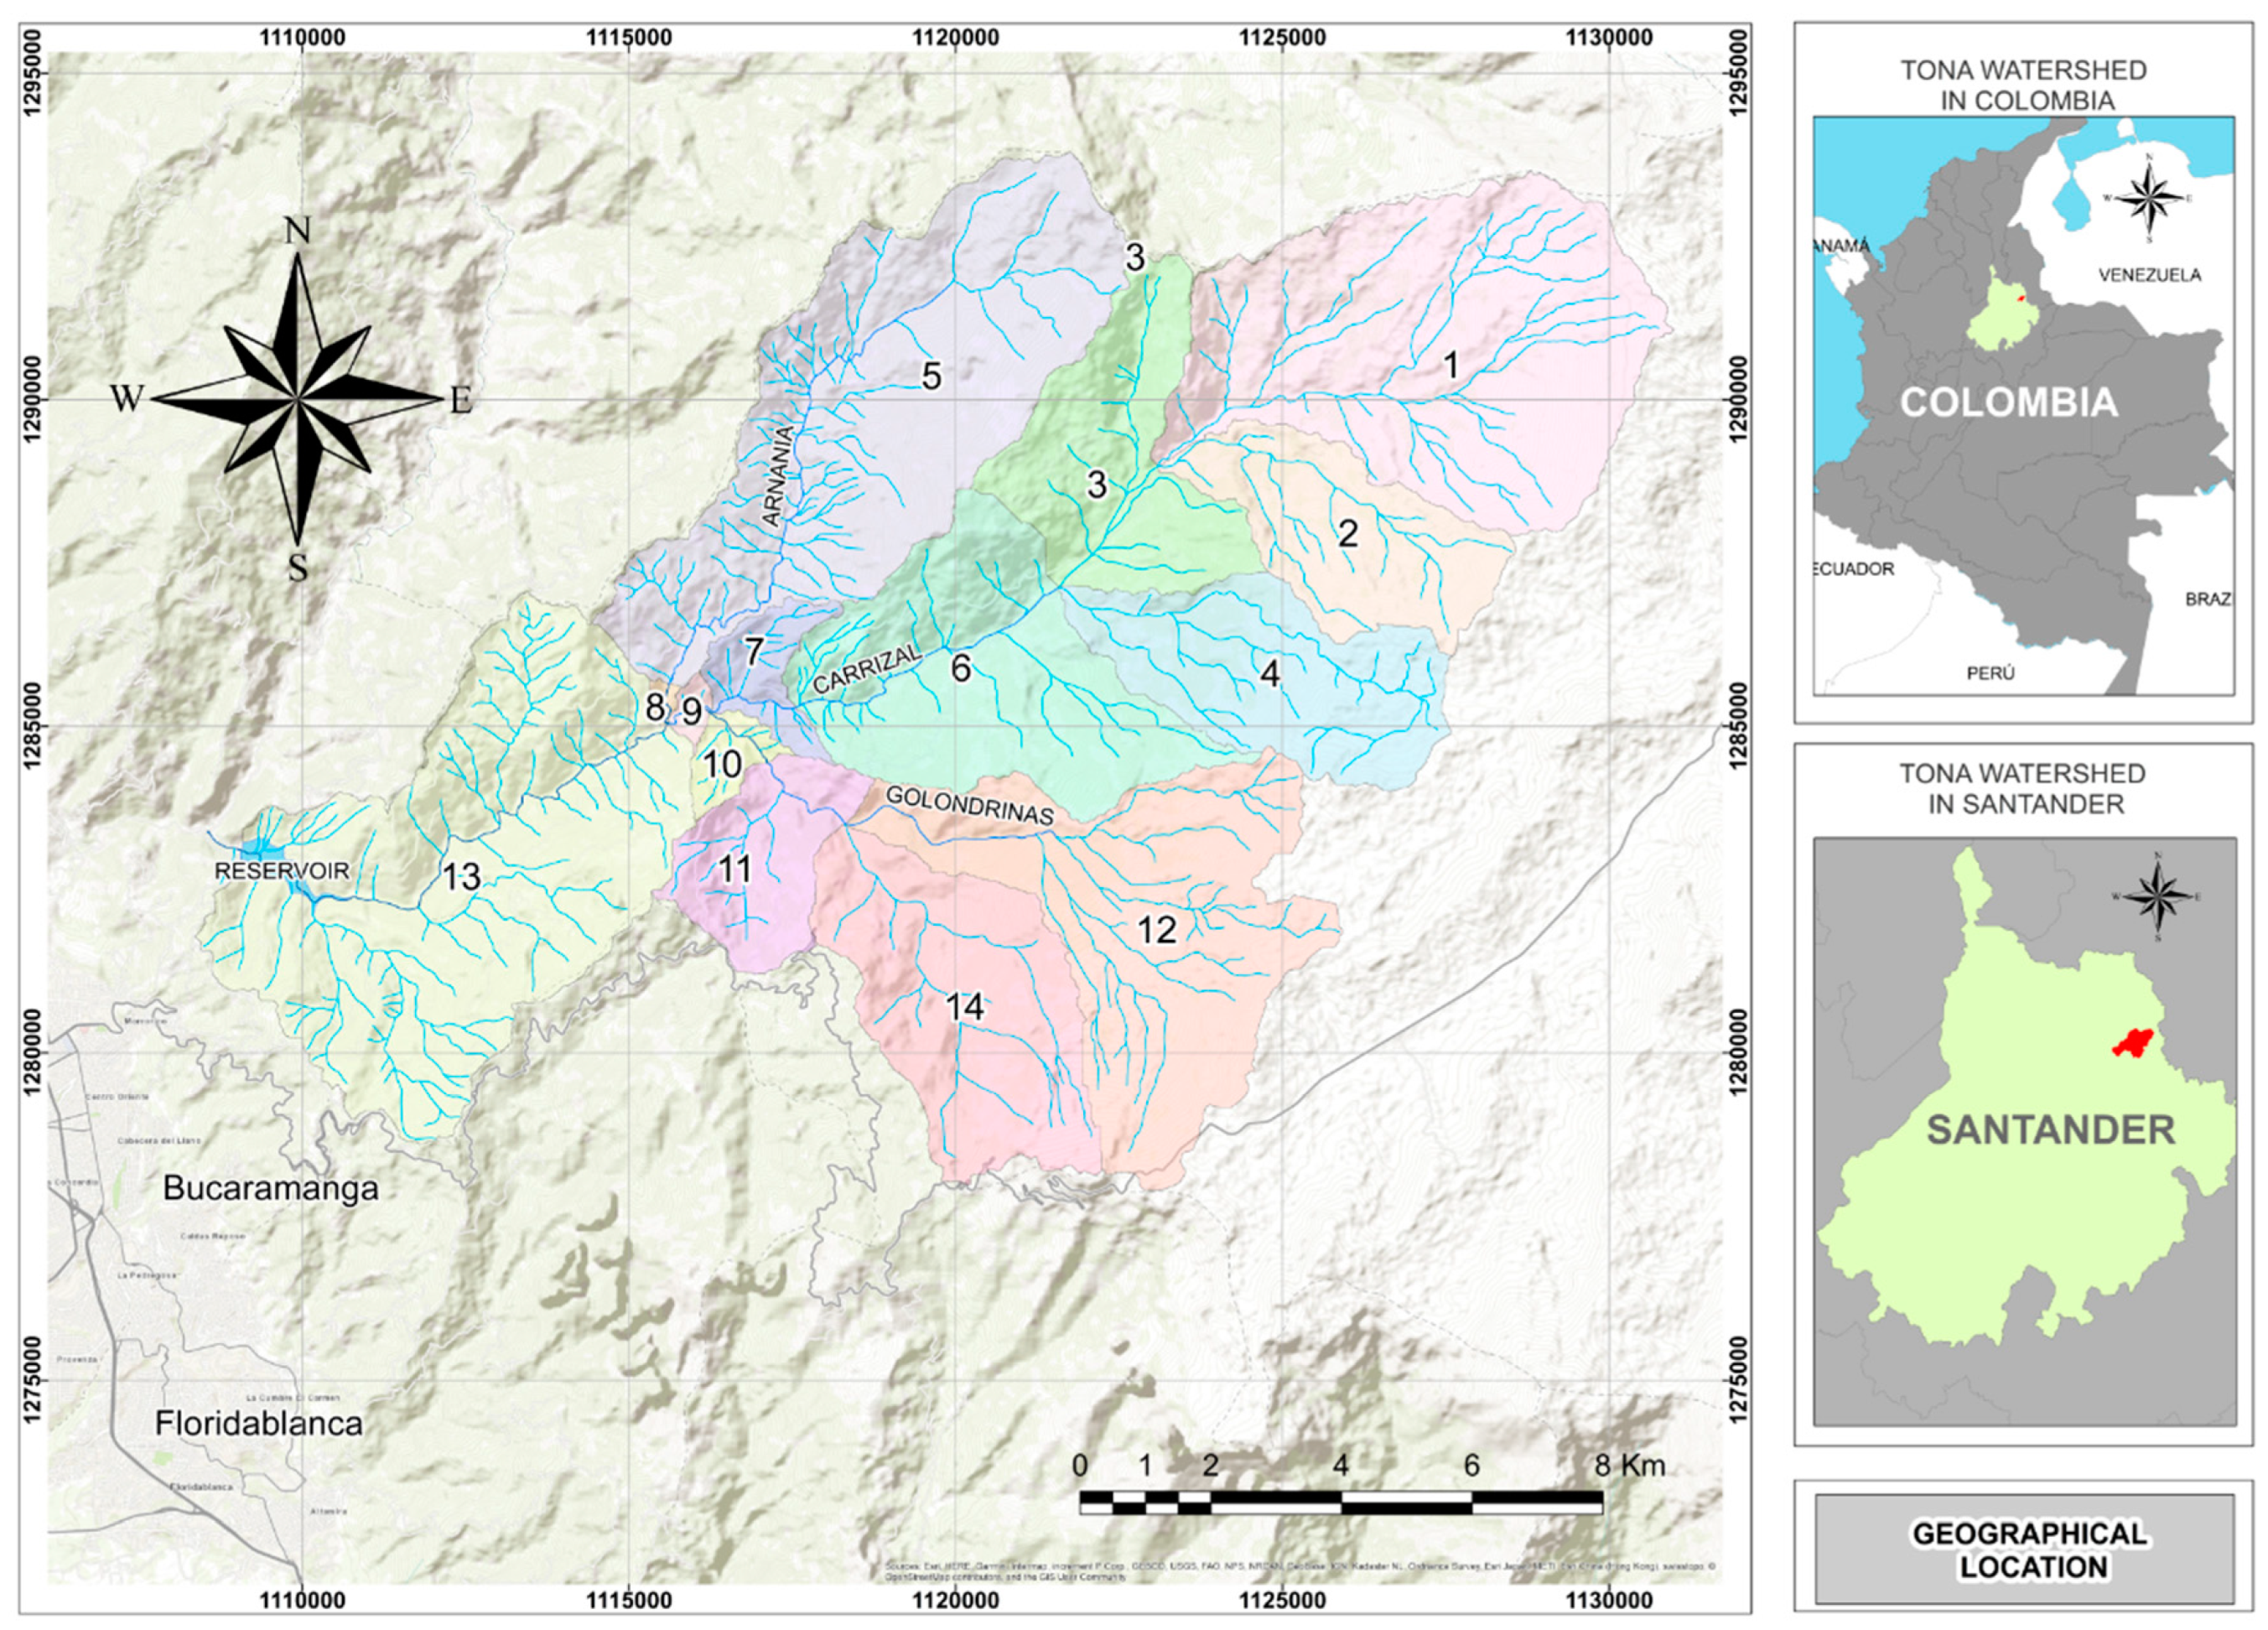
Figure 1. Geographical location of the Tona watershed. Right panels show in red the location of the watershed within the Country and the State. Left area shows the location of the watershed, the Tona river’s main tributaries, and the location of the new reservoir, at the lowest elevations of the watershed. Texts indicate the location of two of the cities that benefit from the Tona river’s water (Bucaramanga and Floridablanca). The numbers and different colors represent a subwatershed division for the study area. The coordinate system corresponds to the local projection for the site (MAGNA Colombia Bogotá—EPSG: 3116).
Water 11 00285 g001
Figure 2. Location of hydrometric and climatological stations in the area of influence of the Tona watershed. Black circles represent the location of the climatological stations and blue triangles represent the location of hydrometric stations. Table S3 shows details on the agency providing the information, geographical location of the stations, type of information, and period of available data.
Water 11 00285 g002
Figure 3. Observed (blue) vs. modeled (red) monthly discharge data at the Puente Tona station for the calibrated model.
Water 11 00285 g003
Figure 4. Average annual water yield in the Tona watershed (mm year−1) by the hydrologic response unit (HRU).
Water 11 00285 g004
Figure 5. Average annual water yield by subwatershed under future climate RCP 4.5: (a) water yield for the calibrated model, (b) water yield for Scenario {1}, (c) water yield for Scenario {3}, and (d) water yield for Scenario {5}.
Water 11 00285 g005
Figure 6. Average annual water yield by subwatershed under future climate RCP 8.5: (a) water yield for the calibrated model, (b) water yield for Scenario {2}, (c) water yield for Scenario {4}, and (d) water yield for Scenario {6}.
Water 11 00285 g006
Table 1. Land use/land cover (LULC) for the Tona watershed.
POAT LULC Assigned Swat Code 1Definition
ConstructionsUrban landURBNResidential
Agricultural landTransitory cropsBANABananas
Permanent cropsCOFFCoffee
Natural pasturesPASTPasture
Cultivated pasturesSPASSummer pasture
Crops and pasturesRYEGPatterns of permanent crops and pastures
Shrub and cropsSWRNPatterns of permanent crops, pastures and natural areas
Agroforestry landWooded pasturesRNGBRange-brush
Permanent and/or semi-permanent crops with shadeORCDOrchard
ForestSecondary ForestFRSTForest-Mixed
BrushMESQHoney mesquite—Shrub and/or herbaceous vegetation associations
Planted forestPINEPine
Special forms of vegetationPáramo vegetationFESPPáramo and subpáramo vegetation
Grassy brushMESQHoney mesquite—Shrub and/or herbaceous vegetation associations
Barren landRocky outcropBARRBarren land
1 Based on predominant crop according to the POAT, and previous studies [46,47].
Table 2. Inputs for the Soil and Water Assessment Tool (SWAT) model of the Tona watershed.
ItemFormatFile NameDescription
Digital elevation modelESRI GRIDdemDigital elevation model of the watershed
Land cover/land useESRI GRIDlulc Map of land use and land cover (LULC) of the watershed
Land use look up tabledBaselulctTable associating the watershed’s LULC with SWAT’s LULC database
SoilsESRI GRIDsoilMap of soils for the watershed
Soil look up tabledBasesoiltTable associating the watershed’s soil types with SWAT’s soils database
Precipitation gauge location tableASCIIpcptonaTable with the geographic coordinates of the precipitation stations
Daily precipitation data tableASCIIpbrasil, pgalvic, pberlin, ptonapu, puisideTables containing the daily time series of precipitation for each of the stations
Temperature gauge location tableASCII tmptonaTable with the geographic coordinates of the temperature stations
Daily temperature data tableASCIIpberlin, puisideTables containing the daily time series of precipitation for each of the stations
Gauging station points location tabledBasestrflowtonaTable with the projected and geographic coordinates of the gauging stations
Masking fileESRI GRIDamaskMap with the definition of the watershed’s boundary—helps on automatic watershed delineation
Burn-in fileShapeBurnInMap containing the watershed’s drainages—helps on automatic delineation of drainages
Table 3. Time windows for model calibration and validation.
CharacteristicCalibrationValidation
Simulation period1987–1997 (11 years)1998–2002 (5 years)
Warm-up years (NYSKIP)1987–1989 (3 years)1998 (1 year)
Effective period1990–1997 (8 years)1999–2002 (4 years)
Interval of model outputMonthlyMonthly
Table 4. Land use/land cover (LULC) changes for future scenarios B and C. 1
ColumnScenario C
Current LULCLULC Changes SubwatershedsCurrent LULCLULC ChangesSubwatersheds
BANACOFF13BANAFRST13
PASTMESQ1,2,3,6,13,14PASTFRST1,2,3,5,6,13,14
PASTPINE5RNGBFRST1,5,12,13
RNGBMESQ1,5,12,13RYEGFRST2,3,5,6,11,12,13,14
RYEGCOFF13RYEGMESQ7
RYEGMESQ2,3,5,6,7RYEGRNGB8
RYEGRNGB8,9,10,11,12,14SPASFRST1,12,14
SPASMESQ1,12,14SWRNFRST3,4,6
ORCDMESQ6ORCDFRST6
SWRNMESQ3,4,6
1Table 1 shows the definitions of the LULC codes for the Tona watershed.
Table 5. Description of the future scenarios.
ScenariosTime Windows for Model Runs
ScenarioLULC + ClimateCharacteristicTime Period
{1}Scenario A + RCP 4.5Simulation period2006–2050 (45 years)
{2}Scenario A + RCP 8.5Warm-up years 2006–2009 (4 years)
{3}Scenario B + RCP 4.5Effective period2010–2050 (41 years)
{4}Scenario B + RCP 8.5Interval of model outputMonthly
{5}Scenario C + RCP 4.5
{6}Scenario C + RCP 8.5
Table 6. Average annual water yield (WYLD) and actual ET estimates at the watershed scale for future scenarios 1.
Climate Scenario
RCP 4.5 (P = 1334.80 mm)RCP 8.5 (P = 1400 mm)
LULC ScenarioWYLD
(mm year−1)
Actual ET
(mm year−1)
WYLD
(mm year−1)
Actual ET
(mm year−1)
A{1}
588.3
{1}
653.2
{2}
627.6
{2}
665.1
B{3}
622.1
(5.9%)
{3}
687.3
(5.2%)
{4}
662.6
(5.6%)
{4}
700.1
(5.3%)
C{5}
605.2
(2.9%)
{5}
684.2
(4.8%)
{6}
646.0
(2.9%)
{6}
697.4
(4.9%)
1 P refers to the average annual precipitation for the corresponding climate scenario; numbers within braces refer to the ID of the future combined scenario; actual ET refers to actual evapotranspiration obtained for each model run; percentages in parentheses show the increase of water yield or actual ET for Scenarios {3} and {5} with respect to Scenario {1}, and Scenarios {4} and {6} with respect to Scenario {2}.