Abstract
In Sahelian countries, a vast number of people are still affected every year by flood despite the efforts to prevent or mitigate these catastrophic events. This phenomenon is exacerbated by the incessant population growth and the increase of extreme natural events. Hence, the development of flood management strategies such as flood hazard mapping and Early Warning Systems has become a crucial objective for the affected nations. This study presents a comprehensive hazard assessment of the Nigerien reach of the Sirba River, the main tributary Middle Niger River. Hazard thresholds were defined both on hydrological analysis and field effects, according to national guidelines. Non-stationary analyses were carried out to consider changes in the hydrological behavior of the Sirba basin over time. Data from topographical land surveys and discharge gauges collected during the 2018 dry and wet seasons were used to implement the hydraulic numerical model of the analyzed reach. The use of the proposed hydraulic model allowed the delineation of flood hazard maps as well the calculation of the flood propagation time from the upstream hydrometric station and the validation of the rating curves of the two gauging sites. These significative outcomes will allow the implementation of the Early Warning System for the river flood hazard and risk reduction plans preparation for each settlement.
1. Introduction
Recent years have been characterized worldwide by an increasing number of flood events and flood-related effects [1,2]. An alarming case is the high frequency of flooding events in the Middle Niger River Basin (MNRB) during the last 20 years [3,4,5]. Sahelian rivers have shown an increase in discharge since the early 1990s leading to the catastrophic floods registered in the past decade [6,7]. Since Tarhule at al. [8] highlighted that extreme floods represent a crucial issue for Sahelian countries, many researchers claimed that the increasing occurrence of extreme rainfall events and the reduced water-holding capacity of the soil are at the origin of more severe floods [9,10,11]. Flow time series of Sahelian rivers showed a remarkable increase of the annual maximum of discharge that necessarily needs to be considered in the evaluation of hydrological variables over time [12,13]. The change in frequency of extreme events was firstly addressed using non-stationary methodologies by Aich at al. [14] and then by Wilcox at al. [15] for the main rivers of the MNRB.
The high pace of population growth generated a negative feedback such as a systematic deforestation that converted the savannah into fields providing cereals, firewood and building timber [16,17] and the occupation of the flood-prone areas with new settlements.
In Niger, recent outlines report that during the last 15 years the number of people and their property affected by flooding events have drastically increased [18]. These events have raised the awareness of administrations towards the necessity of developing flood management strategies such as hazard mapping and early warning systems [19].
The state of the art of the flood hazard literature in European countries is very unbalanced compared to that one of developing countries. African studies often focus just on economic aspects of flood risk [20,21] or evaluate the flood hazard on a regional level [22,23]. Only in a few cases there is an accurate analysis based on hydraulic aspects [24]. European rivers are specifically analyzed following the European Flood Directive 2007/60 [25] and statistical, hydraulic and GIS tools are used for flood hazard and flood risk mapping [26,27,28,29].
The present work provides the flood hazard assessment on 108 km of the Nigerien reach of the Sirba River which is the most populated stretch of the main tributary of the MNRB. To achieve the objective, an in-depth local hydraulic analysis based on the application of advanced statistics and a hydraulic numerical model was carried out [30].
This methodology followed two main steps: the definition of hazard thresholds and the flood hazard mapping of each hazard scenarios. Firstly, hazard thresholds were statistically calculated and referred to field effects adopting the color codification of the Nigerien guidelines [31]. The statistical analysis allowed to connect the probability of occurrence to each threshold. The non-stationary method was fundamental to evaluate the evolution of return levels over time, implicitly considering hydrological changes highlighted in the updated flow time series of Garbey Kourou [32]. Secondly, a hydraulic numerical model was implemented to simulate different hazard scenarios related to each threshold. The model was based on a detailed topography and was calibrated with data obtained from topographical surveys and field measurements of discharge. Each simulation allowed to delineate the flood-prone areas summarized in flood hazard maps. Furthermore, the hydraulic model was used to evaluate the flood propagation time along the analyzed reach and validate the rating curves of the two Nigerien gauging sites of the Sirba River.
Adopting advanced statistical approaches and the consolidate hydraulic practice, the methodology used in this work could represents a guideline for the flood hazard evaluation of that countries affected by intensive hydrological changes. This study has a strategic importance because provides the first flood hazard mapping on the Sirba River and offers basic data for the implementation of an Early Warning System for the flood alert. These outputs will be a precious resource both for the research community and for decision makers to develop risk reduction plans and urban planning.
The work is structured as follows: Section 2 presents the materials focusing on the study area, hydrologic dataset, and topography used in this research. Section 3 describes methods used for hazard threshold definition and hydraulic numerical modeling. Section 4 sets out results and related discussions. Section 5 contains the conclusions and future perspectives.
2. Materials
2.1. Study Area
This study was conducted on the Sirba River, the major tributary of the MNRB in term of discharge. Sirba is a cross-border river basin covering an area of approximately 39,000 km2 in the Sahelian strip between Burkina Faso (BF) and Niger (NE). The main physical features of both the watershed and river are listed in Table 1. One note is the flatness of the bedrock Sahelian peneplane and the low river-bed slope [32].

Table 1.
Physical features of the Sirba River Basin and of the Sirba River.
The basin, located between the isohyets 400 and 700 mm, is characterized by a Sahelian semiarid climate. The clime of this area comprised two well-defined seasons, the dry season (October–May) and the rain season (June–September) [33,34]. The Sirba River’s hydrology is strongly related to the monsoon season. In fact, it has an intermittent flow and it is dry for about six months a year.
The Sirba River begins its main course in Niger downstream of the confluence between its main tributaries (Yali, Faga, and Koulouko rivers) coming from the headwater in Burkina Faso (Figure 1).
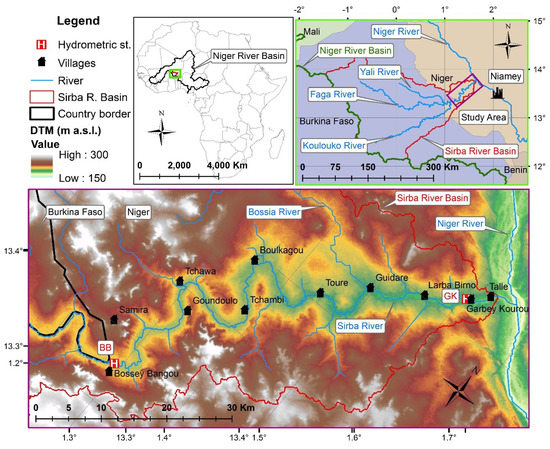
Figure 1.
The geographical framework of the Sirba River. Enlargement: the analyzed reach of the Sirba River and main riverine villages. Top left: the continental overview of the Niger River Basin. Top right: the Sirba River basin in the context of the Middle Niger River Basin. Sources of layers: hydrologic data from HydroSHEDS [35,36], geographical data from Niger data portal [37].
The flood scenarios were computed towards a hydraulic model covers 108 km of the Nigerien reach of the Sirba River comprised between the national border with Burkina Faso and the confluence into the Niger River.
The river reach contains two automatic gauging stations: Bossey Bangou (BB) and Garbey Kourou (GK). BB station was located a few hundred meters downstream the national boundary and GK station is located 8 km upstream the confluence into the Niger River [32].
2.2. Data
The analyses in this study were conducted using the data regarding the hydrology of the Sirba River and the topographic data (digital terrain model and topographical surveys) required for the implementation of the hydraulic numerical model.
2.2.1. Hydrologic Dataset
The series of data regarding flow measurements and flood reports were collected from different sources.
The Sirba flow data were registered in the Garbey Kourou gauging station at a daily resolution, considering the discharge time series from 1956 to the end of the wet season 2018, recently updated by Tamagnone at al. [32]. The values of annual maximum discharges (AMAX) show a marked trend highlighting the non-stationarity of the time series (Figure 2).
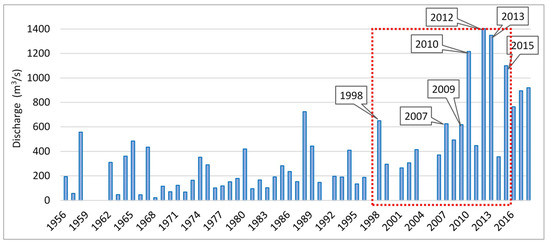
Figure 2.
Time series of annual maximum discharge (AMAX) of the gauging station of Garbey Kourou [32]; in the red dotted box are reported the years analyzed in the ANFD.
Moreover, this work also considers the data coming from the new hydrometric station of Bossey Bangou using the discharge time series recorded from June 2018 and 7 discharge measurements realized in the past wet season.
Sahelian countries have shown a significant increase in flooding events in recent decades and especially in recent years [7,38,39]. This phenomenon motivates the Nigerien departments to collect all the data regarding floods from 1998 in a national database, called ANADIA (Adaptation to climate change, disaster prevention and agricultural development for food security) Niger Flood Database (ANFD). Unfortunately, the lack of a standardized protocol for on-site surveys led to an incomplete and non-detailed dataset [18].
2.2.2. Topography
The geometry of the area was initially defined by the HydroSHEDS (Hydrological data and maps based on SHuttle Elevation Derivatives at multiple Scales). It is a hydrologically conditioned elevation model with a resolution of 0.00083° that approximately corresponds at 100 m for the analyzed area. This Digital Terrain Model (DTM) was made for Africa in 2006 by the US Geological Survey (USGS) in Shuttle Radar Topography Mission (SRTM) data [35,36,40].
Unfortunately, the geometric information of the HydroSHEDS DTM was inappropriate for the implementation of the hydraulic model because the resolution corresponded to the width of the Sirba River (i.e., 100 m). The “Intermap World 10 DTM” provided by Harris Geospatial on the 2000 km2 of the Nigerien reach of the Sirba River was acquired. This DTM was built using four satellite data sources (SRTM 90, SRTM 30, ASTER, and GTOPO30) taken in the years from 2005 to 2011 [41,42,43].
Two campaigns of topographical surveys were conducted on the field to gather high-resolution data for the building and the calibration of the hydraulic model of the Sirba River. In particular, two high-precision Global Navigation Satellite System (GNSS) surveys were carried out in February 2018 and in September 2018. The first survey was performed to measure the river cross-sections in the dry-period and the second to evaluate the water surface elevation necessary for the model calibration.
The first GNSS survey consisted of the characterization of numerous transversal sections of the Sirba River bed at one-kilometer distance. The study area is lacking in GNSS permanent stations [44] and known-coordinates points, which makes ineffective most of the common GNSS survey techniques. A Real Time Kinematic (RTK) survey in master-rover modality was realized to overcome these constraints and the station receiver information was post-processed with Precise Point Positioning (PPP) technique [45,46]. The data were collected with two GNSS dual frequency receivers (Stonex S10) during the dry season, when the river is at the minimum of its water content and its bed easier detectable. 18 base stationing positions were placed along 100 km of Sirba River, between the border with the Burkina Faso and the confluence in the Niger River (Figure 3). Despite the critic conditions, in 10 days it was possible to measure 103 cross-sections along 100 km of river. Moreover, a second GNSS survey was conducted with the same methods for the characterization of the hydraulic levels in important cross-sections of the rivers (main villages, gauging stations, confluence, and hydraulic structure). The PPP was performed using an online free service provided by the Canadian Government [47]. The obtained results had an average precision of 2 cm on East component, 8 cm on North component and 4 cm on the Up component.
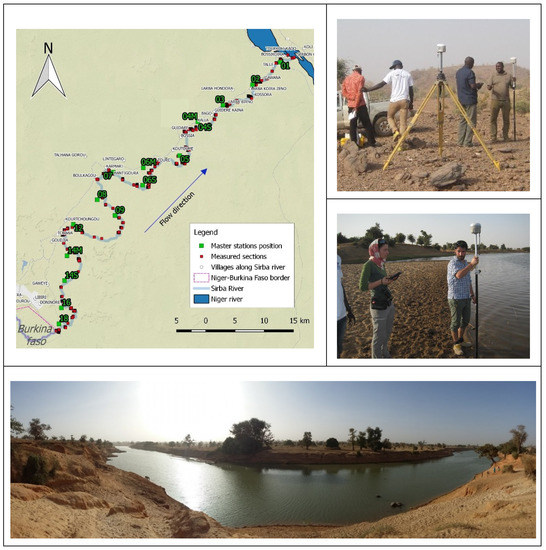
Figure 3.
Above left: area of the topographical surveys: the green squares indicate the 18 stations along the river, while the red ones the sections along the river. Above right: the GNSS devices STONEX S10. Middle right: the topographical survey conducted on the field. Below: Panoramic view of the Sirba River near the village of Larba Birno.
3. Methods
The methodology implemented in this work and proposed for similar case study is resumed in the workflow summarized in Figure 4.
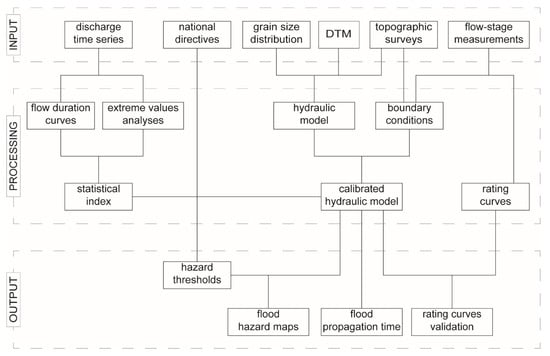
Figure 4.
Workflow: Data collection (input); elaboration of collected data (processing) and outcomes of the work (output).
3.1. Hazard Threshold Definition
It has become increasingly important to define index and design indications regarding floods and river management [48]. The marked trend and non-stationarity of the historical series for the Sirba gives standard statistical analyses based on the assumption that the data is stationary a low confidence level. For accurate flood hazard evaluation, updated indicators of the level of flood hazard are required [15,32].
In the following sections, several metrics are defined as indices for a corresponding flood hazard. First, flood hazard categories are presented that correspond to varying field effects produced on riverine villages. Next, statistical tools are used: (1) the non-stationary Generalized Extreme Value (GEV) distributions to evaluate flood return time according to the most up-to-date information; (2) the Flow Duration Curves (FDC) in order to evaluate homogeneous periods of the historical flow series. The use of varying approaches allows for a robust definition of the flood hazard.
3.1.1. Field Effects
The hazard thresholds were defined, following an analysis based on the field effects in the riverine villages, in accordance with the official flood hazard scenarios used in the Niger Republic for the city of Niamey. The thresholds were defined, in the early 2000s, by a multidisciplinary team composed by national department (Ministry of Hydraulic, Ministry of Agriculture, Directorate of Meteorology and civil protection) and regional authority (Agrhymet Regional Center and Niger Basin Authority) [31].
The classification consists of the four flood hazard scenarios:
- -
- Normal condition (green): the characteristic flow of the river with no effects on the riverine activities;
- -
- Yellow alert: frequent flood of the river that slightly affects human activities. It could cause damages to fish nets, water pumps and livestock watering on the river;
- -
- Orange alert: severe flood of the river that has a significant impact on the human life. It can cause damages to the low-altitude houses and avoid access to the wells closest to the river banks;
- -
- Red alert: catastrophic flood that represents a high hazard source for human life. It can cause big damages to a vast portion of the riverine villages with likely human losses.
3.1.2. Statistical Analyses
The updated discharge time series for the Sirba River (1956–2018) presented by Tamagnone at al. [32] showed that recent extreme flows were much greater in magnitude than in the original series due to inaccuracies in the rating curves. A Non-Stationary Generalized Extreme Value (NSGEV) model was fitted to the Annual Maximum (AMAX) of the updated data series using the same methodology as described by Wilcox at al. [15] to explore the implications on extreme flow characteristics. First, the NSGEV for the updated series is compared to the one before the updating, to show the influence of rating curve accuracy on the estimation of the trend in extreme values. Second, the NSGEV is compared to a Stationary GEV (SGEV) fit to the updated data to evaluate the risks of ignoring the non-stationarity of the dataset. Third the FDC were computed in the last homogeneous period (2009–2018) in the GK flow series [32].
In the following chapters the calculated return levels will be called S-RT (Stationary Return Time) and NS-RT (Non-Stationary Return Time).
The GEV distribution is designed to represent the distribution of block maxima values, in this case AMAX. The parameters of the GEV (μ, σ, ξ) can be varied according to given criteria to account for non-stationarity. for the NSGEV method, the parameters vary according to a temporal covariate (e.g., the parameters of the GEV distribution are different for each year).
The advantage of the NSGEV distribution is that it can be used to calculate non-stationary return levels. For this study, the return level for a given flow threshold is calculated using an NSGEV and compared with the return time calculated using a stationary GEV. These results are used as indices for the different flood hazard scenarios. An SGEV was also calibrated on the updated data series and compared with the NSGEV. The μ and σ parameters largely exceed the stationary values during the most recent years.
3.2. Hydraulic Numerical Model
Flood-prone areas have been computed through a hydraulic numerical model implemented with the use of the HEC-RAS software v5.0.6 (Hydrologic Engineering Center–River Analysis System) [49,50]. HEC-RAS is a physical-based software, developed by the US Army Corps of Engineers, on the fully De Saint Venant equations [51,52,53]. The model was performed with a 1-D configuration, based on 147 river’s cross-sections.
3.2.1. Geometry
The geometry of the hydraulic model was based on three data sources described as follows: (1) a DTM with a resolution of 10 m; (2) the topographical survey of the river bed. The geometry of the river bed was created through the linear interpolation of the surveyed cross-sections following the thalweg thanks to the RAS Mapper, the GIS tool of HEC-RAS [53]. Then, it was merged with the floodplain topography derived from the other two aforementioned DTM in the ArcGIS environment [50]. The high-resolution DTM was useful to both evaluate the river behavior and the floodplain inundations.
The geometry also included the hydraulic structures, within the Sirba River, consisted of only the Farié Bridge. It presented five piers into the channel and the three concrete box culverts embedded in the road embankment on the left overbank (Figure 5).
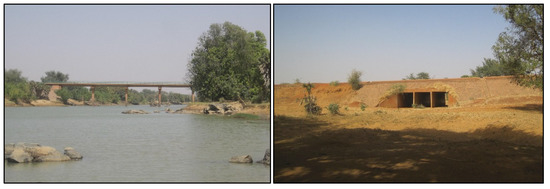
Figure 5.
Left: The Farié bridge on the Sirba River. Right: the culvert with three opening placed on the left overbank.
3.2.2. Flow and Boundary Conditions
Hydraulic simulations were carried out adopting two different flow regimes described as follows:
- -
- Steady flow: discharge values corresponding to the different hazard thresholds were used to evaluate the extension of the flood-prone areas. The discharge values are summarized in Table 5;
- -
- Unsteady flow: four artificial hydrographs have been run in the hydraulic model to calculate the flood peak propagation time. Each hydrograph was shaped following a gaussian curve according the duration with the temporal extent of 2012 flood event (the highest discharge ever measured) and the peak equal to the hazard thresholds (Figure 6).
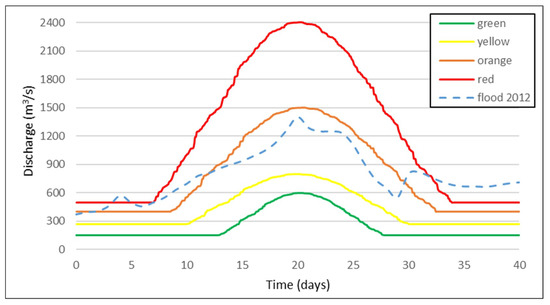 Figure 6. Artificial hydrographs used in the unsteady flow simulations for the flood propagation time for the four hazard scenarios and the hydrograph of the 2012 flood event.
The boundary conditions were established at the upstream and the downstream limits. The upstream boundary condition respected the upstream slope (24 cm/km) by entering the normal depth condition. The downstream boundary conditions totally depended on the Niger River water level. The hydraulic level of the confluence and the hydrometric zero of the Niamey hydrometric station were considered to respect this condition. The same hydraulic jump was assumed for each flow conditions of the Sirba River due to the similarity of Niger River cross-sections in Niamey and in Farié (width of about 300 m with a similar floodplain) (Figure 7).
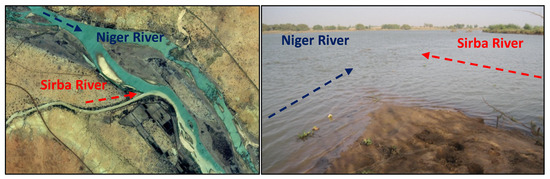
Figure 7.
Left: aerial view of the Sirba-Niger confluence (source google earth [54]: 6 June 2008) with the Farié bridge. Right: photography of the confluence Sirba-Niger on 8 September 2018.
3.2.3. Roughness and Calibration
The roughness definition of the hydraulic numerical model was carried out operating on the choice of the best Manning’s coefficient able to replicate the real flow friction. Different Manning’s coefficients were adopted distinguishing between the river channel and floodplain. For floodplain, the roughness coefficients were extracted from river engineering manual present in the literature [55,56,57]. The roughness of the river bed was instead evaluated, considering several factors affecting the flow friction, using the procedure explained by Chow [51]:
The surface roughness n0 depends on the size and shape of grains of sediments. The granulometry of the channel was evaluated using an object detection algorithm [58,59] which analyzed the photographs taken during the land surveys of the past dry season. A typical grain size distribution of sediments along the Sirba River bed showed the presence of coarse material with a mean size of 22 mm (Figure 8). The Manning’s coefficient related to the aforementioned distribution was calculated using a formulation that finds its origin from the Strickler approach, the Irmay’s equation [60]:
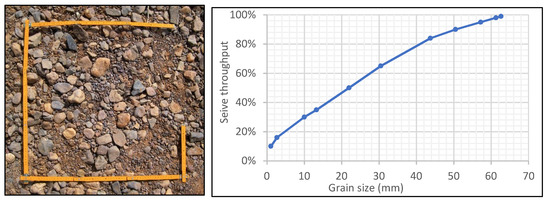
Figure 8.
Representative grain size distribution of sediments along the Sirba River.
The other parameters were extracted from the book Open-Channel Hydraulics [51] (Table 2).
Table 2.
Values assumed for the calculation of the roughness coefficient of the river bed.
The Manning’s coefficients used to simulate the roughness of each zone of the analyzed river reach are collected in Table 3, according to literary values used for natural rivers [55,56,57].
Table 3.
Manning’s coefficients used in the hydraulic model.
The above-listed roughness coefficients are the result of the process of calibration of the hydraulic model. It was conducted using as verification data: (1) the stage/discharge measured at 11 river cross-sections during the survey made on September 2018 and (2) the historical water level of the 2012 flood marked on a tree in Bossey Bangou village. In the calibration process, it was found the channel and floodplain roughness coefficients that gave the best correspondence between water level measured and simulated for each cross-section. The cross-section number (XS) represents the distance, in km, from the section until the confluence into the Niger River.
The altitude differences (∆H) between the measured water surface elevation (WSE) and the hydraulic model results (Table 4) was sufficiently small to ensure the reliability of the model and its capability to simulate the real behavior of the river.
Table 4.
WSE (in meter above sea level) of the water level measured (MEAS) in September 2018, simulated (SIM) and difference, in meter, between measured and modeled discharge (∆H) for the detected river cross-section (XS). The blue values are referred to a marker for the 2012 flood level.
4. Results and Discussion
4.1. Hazard Thresholds
The hazard thresholds fixed for the different flow conditions of the Sirba River respected both the statistical analysis and the field effects on the main riverine settlements according to the classification of national flood hazard scenarios used by the Niger Republic [31]. The hazard thresholds in Table 5 are shown with the maximum discharge related to each scenario and the statistical index related to both FDC [32] and (stationary and non-stationary) GEV. These thresholds are related to the magnitude of the flooding event and damages on human settlements and are referred the following values:
Table 5.
Hazard thresholds for the different flow conditions of the Sirba River.
- -
- The normal condition was considered for the flow below the threshold of 600 m3/s that correspond at the Q15 (the discharge meanly exceeded 15 days a year) and the S-RT5;
- -
- The frequent flood comprised the flow in the range 600–800 m3/s where 800 m3/s is related both to FDC (Q5) and GEV analyses (S-RT10 and NS-RT2);
- -
- The severe flood varied from 800 to 1500 m3/s and corresponded to a flood with S-RT30 years that became a NS-RT5, a little greater than the major measured flood event of 2012;
- -
- The catastrophic flood covered up to 2400 m3/s that is the flood event with S-RT equal to 100 years. After the non-stationary analysis, it was ten times more likely (NS-RT10).
The hazard thresholds identified for the Sirba River are consistent with European Flood Directive, but some differences can be highlighted. The three thresholds identified in the European Flood Directive [25,61,62,63]: (1) totally depend on hydrological analyses; (2) are related to return levels of 20/50 years (high frequency), 100/200 years (low frequency) and 500 years (rare frequency). The European Flood Directive overlooked the lower thresholds (normal condition and frequent flood) while the computed thresholds considered field effects and neglected rare events. The lower thresholds are very important in developing countries with high population growth and lack of urban planning since they may consistently affect rural activities [64]. The events with high return level were not considered because of the connected discharges were not representative of the physical behavior of the river basin.
4.1.1. Generalized Extreme Value Analysis
The selected NSGEV model, by Wilcox et al. [15], for the original Garbey Kourou time series was double linear (i.e., with different slopes before and after a break point) for both the μ (central tendency) and σ (dispersion) parameters. The model choice was confirmed for the updated series with high significance (alpha < 0.001) over fewer complex models.
The analysis of GEV time variation shown the break point for μ was 1996 for both series. The break point for σ was 2003 for the original series and 2006 for the new series. This may be due to either the new data or boundary effects; the methodology separated the break point from the end of the data series by 10 years, so the break point 2006 would not have been identified in the original series which arrive only to 2015.
Both μ and σ have a rising trend since 1996, which indicates an increase in magnitude and variability of extreme events as discussed by Amogu at al. and Descroix at al. [3,4]. The magnitude of the trend is much greater in the updated series. The shape parameter (ξ) is higher in the updated series but has a larger confidence interval. This indicates the most extreme (rare) values risk to be even greater than before, but with more uncertainty (Figure 9).
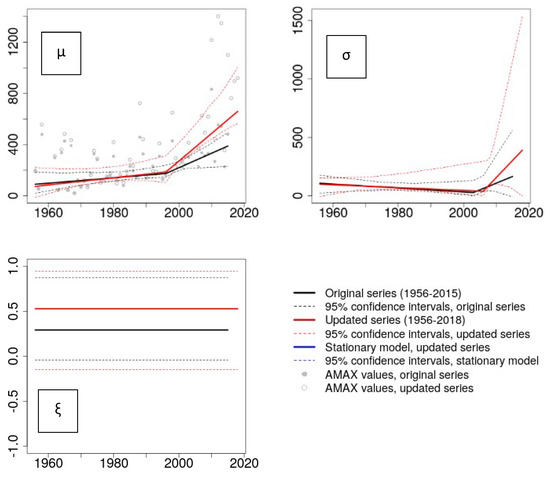
Figure 9.
Time variation of the GEV parameters for both the old and the updated discharge time series: top left μ (central tendency) parameter, top right σ (dispersion) parameter and bottom left ξ (shape) parameter.
The influence of considering non-stationary parameters can be seen in Figure 10. This figure shows the trends for the return levels of 2 and 20 years. The return levels calculated with the NSGEV show an increase of several hundred m3/s even for short return time (2-year) in the last 20 years. In all cases, non-stationary return levels for recent years were well above stationary return levels (Figure 10 and Figure 11). Confidence intervals were large and increasingly large for longer return levels. With the 2-year and 5-year return levels, there was high confidence that the current non-stationary values exceeded the return levels calculated as if the river discharge were stationary. Results were less clear starting from the 10-year return level. The range of uncertainty for the 20-year return level, given a non-stationary model, indeed encompassed the range of values included from the stationary model. This demonstrated the challenge of estimating the value of a given return level in a non-stationary context due to the exceptionally high uncertainty.
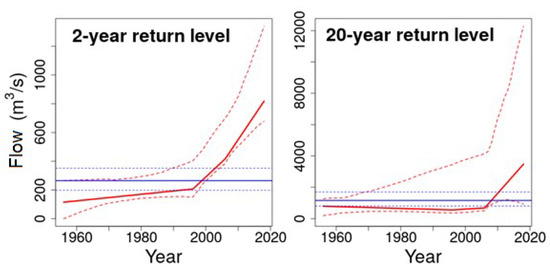
Figure 10.
Stationary and non-stationary return time (RT) for the Garbey Kourou flow series for RT 2 (left) and 20 (right) years: in solid line the RT (red = NS, blue = ST), in dotted red the 95% confidence interval (red = NS, blue = ST).
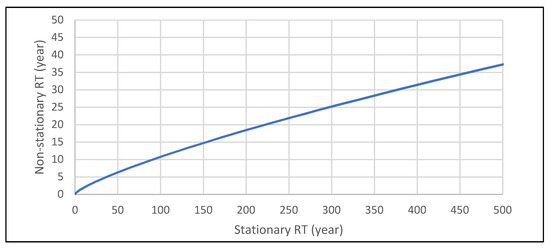
Figure 11.
The relation between non-stationary and stationary RT for the year 2018.
The comparison between stationary and non-stationary return levels underlined that with equal discharge, non-stationary values were ten times higher than the S-RT (Figure 11) [15,65]. This behavior is justified by the substantial increase of the AMAX values in the last two decades and by the very steep trend of this increase [32].
The application of the non-stationary methodology allowed to implicitly consider ongoing changes of the drivers that are strongly affecting the hydrological behavior and the change in frequency of extreme events [15,32]. Until now, the scientific community did not really understand which driver, between climate or land use/cover changes, more influence the hydrological evolution of Sahelian rivers [3,4,5,7,9,14].
4.1.2. Historical Flood Analysis
Floods impacts on the human settlement are a complex system based not only on physical factors (hydrology and river behavior) but also on social factors (urban development, people growing rate and awareness of the flood risk) [66,67,68].
An analysis, based both on the ANFD and on the time series of maximum flow, allows identifying the worst events on the riparian villages of the Sirba River. The effects on the villages are not directly proportional to the magnitude of the flood, considering the first discharge threshold of 600 m3/s (Table 6).
Table 6.
Villages affected by year at each flooding events (Qmax > 600 m3/s), during the period 1998–2015, and the total number of people living in these villages (ND = Not Detected event).
Even though a lack in the record for the events of 1998 and 2012 some significant considerations could be made:
- most of the events (six out of seven) in recent years (nine out of 18) are emphasizing the increased significance of recent flood events also for the Sirba River;
- adaptation and flood awareness produce a decrease of the damage related to a certain discharge: the flooding event of 2010 (with the maximum recorded discharge until that year) affected more than 20,000 people while the higher event of 2013 affected half of the people (10,000). The same behavior is noticeable compared to the flood of 2007 and the higher event of 2015. The decrease of damages was due to the displacement of settlements after flooding events. The reallocation was noticed both during local surveys and participative meetings with inhabitants.
4.2. Flood Hazard Scenarios
Flood hazard mapping of the Sirba River represents the direct assessment of the degree of hazard exposition to which riverine populations are subjected.
Results from hydraulic simulation show an extension of flood-prone areas between 30 km2 of the green scenario up to the 77 km2 of the red scenario (Table 7). These outcomes demonstrate that in any case floods cannot watered vast areas beside the river due to the carved morphology of the Sirba valley.
Table 7.
Total flood-prone areas and percentage increment from the normal condition to the different flood hazard scenarios.
The bulk of the receptors are on the left bank of the Sirba River (houses, community services, infrastructures, fields and vegetable gardens) while on the right bank the receptors are essentially made up of fields and orchards, but no settlement is affected.
The normal condition (green scenario) does not interfere at all with human activities. The frequent flood (yellow scenario) could create some problems usually related to the livestock safety or to the damage on the human tools used on or near the river (fish nets, water pumps, pirogues). The severe flood (orange scenario) affects gardens, orchards, gardens, the lower sector of the villages and it is very significant also because in some cases it could compromise the use of the wells for drinkable water. The catastrophic flood (red scenario) inundates the lowest portion of the riverine villages and affects hundreds of houses even if the percentage of affected villages is never above 10% of their surface. Flood exposure of the main settlements along the Sirba River is quite the same perhaps because the memory of the severe flood of 2012 is still alive. This flood destroyed a large part of the low-altitude houses and caused damages until the limit of the orange threshold.
Tallé presents different features than other settlements and is the only case where the red scenario interest more than 10% of the populated surface (Figure 12). This village is located a few kilometers from the national (paved) road Niamey-Téra and near the confluence Sirba-Niger, where access to irrigation water is possible throughout the year, this settlement is naturally suited to commercial horticultural activities and rice farming. Here demographic growth is restless, and the new households are often built in the flood exposure areas.
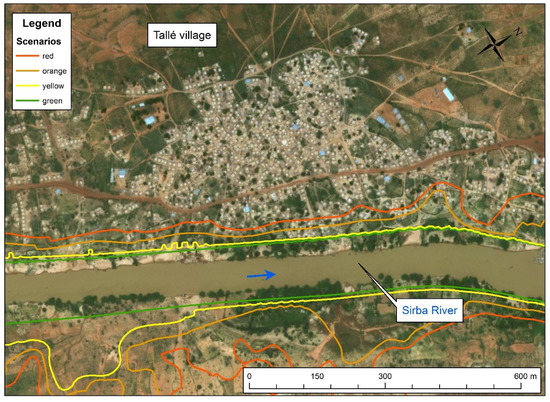
Figure 12.
Flood hazard map in the village of Tallé: green: normal condition, yellow: annual flood, orange: severe flood and red: catastrophic flood. Base map aerial view (source ArcGIS world imagery [70]: 10 July 2016).
Analogous case is the catastrophic floods occurred in Niamey in 2012 and 2013, both events had a similar magnitude. Even if the dynamics are slightly different in the capital city, the flood in 2013 watered the same areas as the year before and destroyed the new settlements immediately re-built as a consequence of the strong population growth [7,69].
A more detailed analysis of the vulnerability of receptors will be the subject of future work and will allow the definition of the mitigation measures. The materialization of graduated mast (with the level of the four scenarios) and the draft of risk reduction plan will be performed for each village to improve the awareness of flood hazard. Mitigation or adaptation measures will be determined on the base of a cost-benefit analysis and will include: (1) the reallocation of settlements or gardens; (2) the improvement of building techniques; (3) the creation of limited sections of levees.
A supplementary scenario was performed to evaluate the amount of the backwater caused by the high-water level of Niger River during the Guinean flood of January 2019. This level indicates that Niger River level could regurgitate the 8-last km of the Sirba River reach (until the downstream boundary of the village of Garbey Kourou). This extent, confirmed by field measurements, allowed to identify the flood hazard caused by the Guinean backwater coming from the Niger River. This flood did not affect the household but destroyed many gardens between the Tallé village and the Sirba-Niger confluence.
4.3. Evaluation of Hydrometric Station Rating Curves
The hydraulic model allowed to validate the rating curves and evaluate the application range of the computed equations. This technique was applied for two rating curves: Garbey Kourou, calculated in Tamagnone et al. [32], and the new one of Bossey Bangou, computed following a power-law with two parameters [32,71]:
Table 8 shows the parameter figures of the Rating Curve (RC) equation for Garbey Kourou e Bossey Bangou. The comparison between the computed rating curves and the curves extracted from the hydraulic model shows a good match between the two curves (Figure 13). It allows appreciation of the hydraulic model as a reliable simulator of the natural behavior of the river also for flood conditions. The alignment between the two curves enables extension of the RC ranges of application above the major field measurement (Figure 13). The application range of the GK rating curve can be considered valid up to 5 m, while the range of BB rating curve is extendable up to 8 m. The behavior of BB RC has an optimal alignment with the model outcome, while the GK RC underlines a mismatching possibly causing an overestimation of discharges above 5 m. The unaligned trend displayed in Figure 13a is probably caused by the complex geometry downstream the GK station. It is characterized by the presence of a stone island that influences the river flow by creating a backwater. It caused complications also in model calibration. To overpass these problems, high-flow field measurements must be done to improve the reliability of the GK RC with for a wider application range.
Table 8.
Coefficients and application ranges of the rating curves equations of the Bossey Bangou and Garbey Kourou gauging sites.
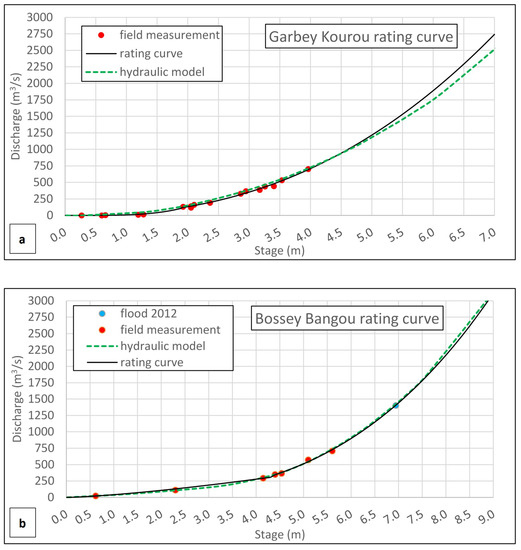
Figure 13.
The two gauging stations of the Sirba River: (a) Garbey Kourou; (b) Bossey Bangou. Comparison between the rating curve (continuous black line), field measurements of stage/discharge (red points), the level of 2012 flood (blue point) and the rating curves computed with the hydraulic model (dotted green line).
Considering that discharge observations are strongly related to the quality of the rating curve equation, the uncertainty of the rating curve might lead to significant errors [32,72,73]. For these reasons, the quality of rating curves should be periodically controlled and updated with on-site measurements, as well as, confirmed by hydraulic models. Moreover, the hydraulic modeling was able to extend the stage range of validity of the calculated equation above the maximum field measurement. In particular, the GK and BB rating curves were validated up to respectively 20% and 40% above the maximum field measurement.
4.4. Flood Propagation Time
The flood propagation time is the flow peak transit time from the gauging station of Bossey Bangou until the downstream villages. These times are crucial for the implementation of the early warning system of the Sirba River. The peak propagation velocity depends not only on geometric factors but also on the river discharge: the higher the discharge, the faster the flux, and hence the less the peak transit time. In the Sirba River, the mean flow velocity varies from 0.97 m/s, in the normal condition, to 1.13 m/s of the catastrophic scenarios. The yellow and orange scenarios were characterized by a velocity of respectively 0.98 and 1.01 m/s, little higher than the normal condition.
Table 9 shows the peak transit time for the severe inundation (Q = 1500 m3/s) which can reflect what happened during the flood in 2012. The flow peak transit time is 29 hours for the entire reach. This means that the warning can be sent with an anticipation of about one day for the biggest villages in the downstream river reach (Touré, Guidare, Larba Birno, Garbey Kourou and Tallé) and of about 10 hours for the upstream villages. This notice was considered enough for the flood procedure alert but not adequate for the traditional communication system of the national structures devoted to flood alert. In other words, to make faster the communication of the alert to the Sirba riverine villages using the Bossey Bangou notice, the early warning system needs to also include a direct village-to-village communication mechanism.
Table 9.
Flood propagation time [h] from the Bossey Bangou gauging station: L is the distance from the upstream gauging station and XS is the number of the corresponding cross-section.
The limited waring time from the Bossey Bangou gauging station to the main villages is expected to be the biggest challenge of an Early Warning System on the Sirba River. This weak point could be emphasized by the feeble internet network in the country. To solve this problem two different ways could be feasible: (1) the installation of new gauging stations in the headwater; (2) the use of hydrological models able to predict the river flow some days in advance [74,75]. For the first option, additional field work and supplementary investments would be needed but the system might guarantee higher accuracy than the use of hydrological models. In fact, these models are strongly affected by the uncertainty of meteorological input [76,77].
5. Conclusions
Considering increasing-attention that flooding events attract on the Sahelian countries, this research was designed to evaluate the flood exposure of the riverine population of the Sirba River. This represents an important step for the operability of an early warning system against floods. After the identification of the hazard thresholds, this study computed the flood hazard scenarios using a hydraulic numerical model on the 108 km river reach.
The hazard thresholds were defined, in accord with the national code of Nigerien flood alert, for four scenarios (green, yellow, orange, and red). They were identified on the field effects and then related to an index based on statistical analysis of the flow series. The application of the non-stationary method to compute the occurrence probability of flood events became fundamental in the Sahelian framework where the climate changes are drastically modifying the river hydrology. The results of the analysis showed that the probability of occurrence of an extreme event deriving from the non-stationary approach was about ten times higher than that considering the stationary approach (e.g., S-RT = 100 years ≅ NS-RT = 10 years). This resulted even though the confidence level of the non-stationary analysis was very low for high RT.
The flood scenarios showed that only the low sector of the villages was exposed to the flood hazard and a flooding event smaller or equal to the historical maximum flood of 2012 would not cause considerable damages on the villages. This effect is due to adaptation to the flood events caused by the recent phenomenon. Flood scenarios can be used by local administrations for urban planning avoiding new settlements in flood-prone areas. Indeed, flood hazard maps, with the scenario extents, will be shared with local administrations as a base for local planning. This information is very useful in a developing context where the urban system is not completely fixed and the population growth is very high, thus enhancing the awareness of the new inhabitant. Moreover, the association of flood scenarios with the national alert code constitutes a powerful decision-making tool for early warning.
Additional results of this study were the validation of the rating curves of the Sirba hydrometric stations and the computation of the flow peak transit time. The rating curve validation and the extension of the application range enhanced the reliability of the flow computed in the gauging stations of Bossey Bangou and Garbey Kourou. The flood propagation time was an essential result for the early warning system that will be implemented on the Sirba River. The short notice between the Bossey Bangou gauging station and the downstream villages is the major challenge that could be solved only with the installation of new gauging stations in the headwater. Alternatively, a possible solution could be the use of a hydrological model that predicts the river flow discharge some days before.
Future developments of this study will explore the implementation of the early warning system and the integration with the hydrological model results to increase the notice time in the villages. Moreover, a detailed study on the exposure and vulnerability will be conducted on riverine villages to exhaustively evaluate the flood risk in terms of economic and social losses.
Author Contributions
G.M.: methodology, data collection, on-site measurements, analysis and elaboration of data, writing—original draft.; P.T.: methodology, on-site measurements, analysis and elaboration of data, writing—original draft; C.W.: methodology, analysis and elaboration of data, writing—original draft.; E.B.: on-site measurements, analysis and elaboration of data, writing—original draft; A.P.: methodology, supervision, validation, writing—review and editing; T.V.: methodology, supervision, validation, writing—review and editing; G.P.: methodology, supervision, validation, writing—review and editing; M.H.I.: methodology, data collection, on-site measurements, supervision, validation, writing—review and editing; M.T.: supervision, validation, writing—review and editing; V.T.: supervision, validation, writing—review and editing; M.R: methodology, supervision, on-site measurements, validation, writing—review and editing.
Funding
This research was funded by the ANADIA2.0 Project (Adaptation to climate change, disaster prevention and agricultural development for food security) by the Italian Agency for Development Cooperation, the Institute of Biometeorology of the National Research Council of Italy (IBIMET_CNR), the Interuniversity Department of Regional and Urban Studies and Planning of the Polytechnic and University of Turin (DIST-POLITO), the National Directorate for Meteorology of Niger (DMN) and the Directorate for Hydrology of Niger (DH).
Acknowledgments
The authors would like to thank the Italian Agency for Development Cooperation for supporting the ANADIA 2.0 project and the actions that allowed the development of this assessment. We would like to express our deepest gratitude to Kateillou Gaptia Lawan (DMN) and Souradji Issa (Gotheye Agricultural Department Directorate) for the support in data collection campaigns.
Conflicts of Interest
The authors declare no conflict of interest.
References
- Berghuijs, W.R.; Aalbers, E.E.; Larsen, J.R.; Trancoso, R.; Woods, R.A. Recent changes in extreme floods across multiple continents. Environ. Res. Lett. 2017, 12, 114035. [Google Scholar] [CrossRef]
- Nka, B.N.; Oudin, L.; Karambiri, H.; Paturel, J.E.; Ribstein, P. Trends in floods in West Africa: Analysis based on 11 catchments in the region. Hydrol. Earth Syst. Sci. 2015, 19, 4707–4719. [Google Scholar] [CrossRef]
- Amogu, O.; Descroix, L.; Yéro, K.S.; Le Breton, E.; Mamadou, I.; Ali, A.; Vischel, T.; Bader, J.-C.; Moussa, I.B.; Gautier, E.; et al. Increasing River Flows in the Sahel? Water 2010, 2, 170–199. [Google Scholar] [CrossRef]
- Descroix, L.; Genthon, P.; Amogu, O.; Rajot, J.L.; Sighomnou, D.; Vauclin, M. Change in Sahelian Rivers hydrograph: The case of recent red floods of the Niger River in the Niamey region. Glob. Planet. Chang. 2012, 98–99, 18–30. [Google Scholar] [CrossRef]
- Aich, V.; Liersch, S.; Vetter, T.; Andersson, J.C.M.; Müller, E.N.; Hattermann, F.F. Climate or land use? - Attribution of changes in river flooding in the Sahel zone. Water Switz. 2015, 7, 2796–2820. [Google Scholar] [CrossRef]
- Descroix, L.; Mahé, G.; Lebel, T.; Favreau, G.; Galle, S.; Gautier, E.; Olivry, J.C.; Albergel, J.; Amogu, O.; Cappelaere, B.; et al. Spatio-temporal variability of hydrological regimes around the boundaries between Sahelian and Sudanian areas of West Africa: A synthesis. J. Hydrol. 2009, 375, 90–102. [Google Scholar] [CrossRef]
- Descroix, L. Processus et enjeux d’eau en Afrique de l’Ouest soudano-sahélienne; Editions des archives contemporaines: Paris, France, 2018; ISBN 978-2-8130-0314-0. [Google Scholar]
- Tarhule, A. Damaging rainfall and flooding: The other Sahel hazards. Clim. Chang. 2005, 72, 355–377. [Google Scholar] [CrossRef]
- Descroix, L.; Guichard, F.; Grippa, M.; Lambert, L.; Panthou, G.; Mahé, G.; Gal, L.; Dardel, C.; Quantin, G.; Kergoat, L.; et al. Evolution of Surface Hydrology in the Sahelo-Sudanian Strip: An Updated Review. Water 2018, 10, 748. [Google Scholar] [CrossRef]
- Panthou, G.; Vischel, T.; Lebel, T. Recent trends in the regime of extreme rainfall in the Central Sahel. Int. J. Climatol. 2014, 34, 3998–4006. [Google Scholar] [CrossRef]
- Mahe, G.; Paturel, J.-E.; Servat, E.; Conway, D.; Dezetter, A. The impact of land use change on soil water holding capacity and river flow modelling in the Nakambe River, Burkina-Faso. J. Hydrol. 2005, 300, 33–43. [Google Scholar] [CrossRef]
- Paturel, J.-E.; Ouedraogo, M.; Servat, E.; Mahe, G.; Dezetter, A.; Boyer, J.-F. The concept of rainfall and streamflow normals in West and Central Africa in a context of climatic variability. Hydrol. Sci. J. 2003, 48, 125–137. [Google Scholar] [CrossRef]
- Amani, A.; Paturel, J.-E. Le projet de révision des normes hydrologiques en Afrique de l’Ouest et Afrique Centrale. La Météorologie 2017. [Google Scholar] [CrossRef]
- Aich, V.; Koné, B.; Hattermann, F.F.; Paton, E.N. Time series analysis of floods across the Niger River Basin. Water Switz. 2016, 8, 165. [Google Scholar] [CrossRef]
- Wilcox, C.; Vischel, T.; Panthou, G.; Bodian, A.; Blanchet, J.; Descroix, L.; Quantin, G.; Cassé, C.; Tanimoun, B.; Kone, S. Trends in hydrological extremes in the Senegal and Niger Rivers. J. Hydrol. 2018, 566, 531–545. [Google Scholar] [CrossRef]
- Tiepolo, M.; Tarchiani, V. Risque et adaptation climatique dans la région Tillabéri, Niger; L’Harmattan: Paris, France, 2016; ISBN 978-2-343-08493-0. [Google Scholar]
- Fiorillo, E.; Maselli, F.; Tarchiani, V.; Vignaroli, P. Analysis of land degradation processes on a tiger bush plateau in South West Niger using MODIS and LANDSAT TM/ETM+ data. Int. J. Appl. Earth Obs. Geoinformation 2017, 62, 56–68. [Google Scholar] [CrossRef]
- Fiorillo, E.; Crisci, A.; Issa, H.; Maracchi, G.; Morabito, M.; Tarchiani, V. Recent Changes of Floods and Related Impacts in Niger Based on the ANADIA Niger Flood Database. Climate 2018, 6, 59. [Google Scholar] [CrossRef]
- Erena, S.H.; Worku, H.; De Paola, F. Flood hazard mapping using FLO-2D and local management strategies of Dire Dawa city, Ethiopia. J. Hydrol. Reg. Stud. 2018, 19, 224–239. [Google Scholar] [CrossRef]
- Adeloye, A.J.; Mwale, F.D.; Dulanya, Z. A metric-based assessment of flood risk and vulnerability of rural communities in the Lower Shire Valley, Malawi. Proc. Int. Assoc. Hydrol. Sci. 2015, 370, 139–145. [Google Scholar] [CrossRef]
- Odunuga, S.; Adegun, O.; Raji, S.A.; Udofia, S. Changes in flood risk in Lower Niger–Benue catchments. Proc. Int. Assoc. Hydrol. Sci. 2015, 370, 97–102. [Google Scholar] [CrossRef]
- Ghile, Y.B.; Taner, M.Ü.; Brown, C.; Grijsen, J.G.; Talbi, A. Bottom-up climate risk assessment of infrastructure investment in the Niger River Basin. Clim. Change 2014, 122, 97–110. [Google Scholar] [CrossRef]
- Nkeki, F.N.; Henah, P.J.; Ojeh, V.N. Geospatial Techniques for the Assessment and Analysis of Flood Risk along the Niger-Benue Basin in Nigeria. J. Geogr. Inf. Syst. 2013, 5, 123–135. [Google Scholar] [CrossRef]
- Robi, M.A.; Abebe, A.; Pingale, S.M. Flood hazard mapping under a climate change scenario in a Ribb catchment of Blue Nile River basin, Ethiopia. Appl. Geomat. 2018, 11, 1–14. [Google Scholar] [CrossRef]
- Smith, R. Directive 2008/94/EC of the European Parliament and of the Council of 22 October 2008; Official Journal of the European Union: Bruxelles, Belgium, 2007; pp. 423–426. [Google Scholar]
- Paprotny, D.; Morales-Nápoles, O.; Jonkman, S.N. Efficient pan-European river flood hazard modelling through a combination of statistical and physical models. Nat. Hazards Earth Syst. Sci. 2017, 17, 1267–1283. [Google Scholar] [CrossRef]
- Salman, A.M.; Li, Y. Flood Risk Assessment, Future Trend Modeling, and Risk Communication: A Review of Ongoing Research. Nat. Hazards Rev. 2018, 19, 04018011. [Google Scholar] [CrossRef]
- Alfieri, L.; Salamon, P.; Bianchi, A.; Neal, J.; Bates, P.; Feyen, L. Advances in pan-European flood hazard mapping. Hydrol. Process. 2014, 28, 4067–4077. [Google Scholar] [CrossRef]
- Barredo, J.I.; de Roo, A.; Lavalle, C. Flood risk mapping at European scale. Water Sci. Technol. 2007, 56, 11–17. [Google Scholar] [CrossRef]
- Jha, A.K.; Bloch, R.; Lamond, J. Cities and Flooding: A Guide to Integrated Urban Flood Risk Management for the 21st Century; The World Bank: Washington, DC, USA, 2012; ISBN 978-0-8213-8866-2. [Google Scholar]
- Niger Basin Authority. Available online: http://www.abn.ne/ (accessed on 4 March 2019).
- Tamagnone, P.; Massazza, G.; Pezzoli, A.; Rosso, M. Hydrology of the Sirba River: Updating and Analysis of Discharge Time Series. Water 2019, 11, 156. [Google Scholar] [CrossRef]
- Tiepolo, M.; Bacci, M.; Braccio, S. Multihazard Risk Assessment for Planning with Climate in the Dosso Region, Niger. Climate 2018, 6, 67. [Google Scholar] [CrossRef]
- Bigi, V.; Pezzoli, A.; Rosso, M. Past and Future Precipitation Trend Analysis for the City of Niamey (Niger): An Overview. Climate 2018, 6, 73. [Google Scholar] [CrossRef]
- Lehner, B.; Verdin, K.; Jarvis, A. HydroSHEDS Technical Documentation v1.0; World Wildlife Fund US: Washington, DC, USA, 2006. [Google Scholar]
- Hydrosheds. Available online: https://hydrosheds.cr.usgs.gov/ (accessed on 5 February 2019).
- Niger Data Portal. Available online: http://niger.opendataforafrica.org/ (accessed on 5 February 2019).
- Aich, V.; Koné, B.; Hattermann, F.F.; Müller, E.N. Floods in the Niger basin — analysis and attribution. Nat. Hazards Earth Syst. Sci. Discuss. 2014, 2, 5171–5212. [Google Scholar] [CrossRef]
- Tschakert, P.; Sagoe, R.; Ofori-Darko, G.; Codjoe, S.N. Floods in the Sahel: An analysis of anomalies, memory, and anticipatory learning. Clim. Change 2010, 103, 471–502. [Google Scholar] [CrossRef]
- Lehner, B.; Verdin, K.; Jarvis, A. New Global Hydrography Derived from Spaceborne Elevation Data. Eos Trans. Am. Geophys. Union 2008, 89, 93. [Google Scholar] [CrossRef]
- Rodríguez, E.; Morris, C.S.; Belz, J.E.; Chapin, E.C.; Martin, J.M.; Daffer, W.; Hensley, S. An Assessment of the SRTM Topographic Products; Technical Report; Jet Propulsion Laboratory: Pasadena, CA, USA, 2005. [Google Scholar]
- Tachikawa, T.; Kaku, M.; Iwasaki, A.; Gesch, D.; Oimoen, M.; Zhang, Z.; Danielson, J.; Krieger, T.; Curtis, B.; Haase, J.; et al. ASTER Global Digital Elevation Model Version 2 – Summary of Validation Results; ASTER GDEM Validation Team: Tokyo, Japan, 2011. [Google Scholar]
- Danielson, J.J.; Gesch, D.B. Global Multi-resolution Terrain Elevation Data 2010 (GMTED2010); US Geological Survey: Reston, VA, USA, 2011; 34.
- International GNSS Service (IGS). Available online: http://www.igs.org/network (accessed on 11 March 2019).
- Bisnath, S.; Wells, D.; Dodd, D. Evaluation of commercial carrier phase-based WADGPS services for marine applications. In Proceedings of the Institute of Navigation GPS/GNSS 2003, Portland, OR, USA, 9–12 September 2003. [Google Scholar]
- Kouba, J.; Héroux, P. GPS Solutions; Wiley: Hoboken, NJ, USA, 2001; ISSN 1080-5370. [Google Scholar]
- Natural Resource Canada. Available online: http://www.nrcan.gc.ca/home (accessed on 13 March 2019).
- Andersson, J.C.M.; Ali, A.; Arheimer, B.; Gustafsson, D.; Minoungou, B. Providing peak river flow statistics and forecasting in the Niger River basin. Phys. Chem. Earth Parts ABC 2017, 100, 3–12. [Google Scholar] [CrossRef]
- Shrestha, S.; Lohpaisankrit, W. Flood hazard assessment under climate change scenarios in the Yang River Basin, Thailand. Int. J. Sustain. Built Environ. 2017, 6, 285–298. [Google Scholar] [CrossRef]
- Zeleňáková, M.; Fijko, R.; Labant, S.; Weiss, E.; Markovič, G.; Weiss, R. Flood risk modelling of the Slatvinec stream in Kružlov village, Slovakia. J. Clean. Prod. 2019, 212, 109–118. [Google Scholar] [CrossRef]
- Chow, Te Ven Open-Channel Hydraulics; McGraw-Hill: New York, NY, USA, 1959.
- Ligget, J.A.; Cunge, J.A. Numerical methods of solution of the unsteady flow equations; Water Resources Pubblications: Denver, CO, USA, 1975. [Google Scholar]
- Brunner, G.W. HEC-RAS River Analysis System: Hydraulic Reference Manual Version 5.0; US Army Corps of Engineers-Hydrologic Engineering Center (HEC): Davis, CA, USA, 2016. [Google Scholar]
- Google Earth. Available online: https://earth.google.com/web/ (accessed on 5 February 2019).
- Barnes, H.H. Roughness Characteristics of Natural Channel; United States Geological Survey: Washington, DC, USA, 1967.
- Hicks, D.M.; Mason, P.D. Roughness Characteristics of New Zeland Rivers; Water Resources Survey DSIR Marine and Freshwater: Wellington, New Zeland, 1991; ISBN 0-477-02608-7. [Google Scholar]
- Mays, L.W. Water Resources Engineering; Wiley: Hoboken, NJ, USA, 2010; ISBN 978-0-470-46064-1. [Google Scholar]
- Detert, M.; Weitbrecht, V. Automatic object detection to analyze the geometry of gravel grains–a free stand-alone tool. In River Flow; Taylor & Francis Group: London, UK, 2012; pp. 595–600. ISBN 978-0-415-62129-8. [Google Scholar]
- Detert, M.; Weitbrecht, V. User guide to gravelometric image analysis by BASEGRAIN. Adv. River Sediment Res. 2013, 1789–1796. [Google Scholar]
- Irmay, S. On steady Flow Formulas in Pipes and Channels. In Proceedings of the IAHR 3rd Congress, Grenoble, France, 5–7 September 1949. [Google Scholar]
- Decreto Legislativo 23 febbraio 2010. Available online: https://www.minambiente.it/sites/default/files/dlgs_23_02_2010_49.pdf (accessed on 5 May 2019).
- Mostert, E.; Junier, S.J. The European flood risk directive: challenges for research. Hydrol. Earth Syst. Sci. Discuss. 2009, 6, 4961–4988. [Google Scholar] [CrossRef]
- Tsakiris, G. Critical Technical Issues on the EU Flood Directive. European Water 2009, 29, 39–51. [Google Scholar]
- FANFAR. Available online: http://fanfar.eu/ivp/ (accessed on 5 February 2019).
- Salas, J.D.; Obeysekera, J. Revisiting the Concepts of Return Period and Risk for Nonstationary Hydrologic Extreme Events. J. Hydrol. Eng. 2014, 19, 554–568. [Google Scholar] [CrossRef]
- Bertilsson, L.; Wiklund, K.; de Moura Tebaldi, I.; Rezende, O.M.; Veról, A.P.; Miguez, M.G. Urban flood resilience–A multi-criteria index to integrate flood resilience into urban planning. J. Hydrol. 2018. [Google Scholar] [CrossRef]
- Horn, F.; Elagib, N.A. Building socio-hydrological resilient cities against flash floods: Key challenges and a practical plan for arid regions. J. Hydrol. 2018, 564, 125–132. [Google Scholar] [CrossRef]
- Bodoque, J.M.; Díez-Herrero, A.; Amerigo, M.; García, J.A.; Olcina, J. Enhancing flash flood risk perception and awareness of mitigation actions through risk communication: A pre-post survey design. J. Hydrol. 2019, 568, 769–779. [Google Scholar] [CrossRef]
- Sighomnou, D.; Descroix, L.; Genthon, P.; Mahé, G.; Moussa, I.B.; Gautier, E.; Mamadou, I.; Vandervaere, J.P.; Bachir, T.; Coulibaly, B.; et al. La crue de 2012 à Niamey: Un paroxysme du paradoxe du Sahel? Sci. Chang. Planetaires-Secheresse 2013, 24, 3–13. [Google Scholar]
- Arcgis Web Imagery. Available online: http://sampleserver1.arcgisonline.com/ArcGIS/rest/services/Specialty/ESRI_StateCityHighway_USA/MapServer (accessed on 5 February 2019).
- Herschy, R.W. Streamflow Measurement; Taylor & Francis: New York, NY, USA, 2009; ISBN 0-203-9139-4. [Google Scholar]
- Baldassarre, G.D.; Montanari, A. Uncertainty in river discharge observations: a quantitative analysis. Hydrol. Earth Syst. Sci. 2009, 13, 913–921. [Google Scholar]
- Juston, J.; Jansson, P.-E.; Gustafsson, D. Rating curve uncertainty and change detection in discharge time series: case study with 44-year historic data from the Nyangores River, Kenya: Rating curve uncertainty and change detection in discharge time series. Hydrol. Process. 2014, 28, 2509–2523. [Google Scholar] [CrossRef]
- Alfieri, L.; Burek, P.; Dutra, E.; Krzeminski, B.; Muraro, D.; Thielen, J.; Pappenberger, F. GloFAS – global ensemble streamflow forecasting and flood early warning. Hydrol. Earth Syst. Sci. Discuss. 2012, 9, 12293–12332. [Google Scholar] [CrossRef]
- Andersson, J.C.M.; Arheimer, B.; Traoré, F.; Gustafsson, D.; Ali, A. Process refinements improve a hydrological model concept applied to the Niger River basin. Hydrol. Process. 2017, 31, 4540–4554. [Google Scholar] [CrossRef]
- Douinot, A.; Roux, H.; Dartus, D. Modelling errors calculation adapted to rainfall – Runoff model user expectations and discharge data uncertainties. Environ. Model. Softw. 2017, 90, 157–166. [Google Scholar] [CrossRef][Green Version]
- Koriche, S.A.; Rientjes, T.H.M. Application of satellite products and hydrological modelling for flood early warning. Phys. Chem. Earth Parts ABC 2016, 93, 12–23. [Google Scholar] [CrossRef]


© 2019 by the authors. Licensee MDPI, Basel, Switzerland. This article is an open access article distributed under the terms and conditions of the Creative Commons Attribution (CC BY) license (http://creativecommons.org/licenses/by/4.0/).