Article

Contribution of Internal Nutrients Loading on the Water Quality of a Reservoir

1
Center for Climate/Environment Change Prediction Research, Ewha Womans University, 52, Ewhayeodae-gil, Seodaemun-gu, Seoul 03760, Korea
2
Department of Health and Environment, Hallym Polytechnic University, 48, Janghak-gil, Dong-myeon, Chuncheon-si, Gangwon-do 24210, Korea
3
Agriculture and Life Sciences Research Institute, Kangwon National University, 1 Gangwondaehak-gil, Chuncheon-si, Gangwon-do 24341, Korea
4
Department of Regional Infrastructure Engineering, Kangwon National University, 1 Gangwondaehak-gil, Chuncheon-si, Gangwon-do 24341, Korea
5
Department of Environmental Science and Engineering, Ewha omans University, 52, Ewhayeodae-gil, Seodaemun-gu, Seoul 03760, Korea
*
Author to whom correspondence should be addressed.
Water 2019, 11(7), 1409; https://doi.org/10.3390/w11071409
Submission received: 20 May 2019 / Revised: 5 July 2019 / Accepted: 5 July 2019 / Published: 9 July 2019
(This article belongs to the Special Issue GIS-Based Hydrology and Water Quality Modeling)

Abstract

:
Sediment plays an important role in the water quality of a lake by acting as both a nutrient source and sink. The amount of phosphorus and nitrogen in the water depends on the internal load from the sediment as well as the external load. To estimate the effects of sediment load on the water quality of a reservoir, we applied a three-dimensional hydrodynamic and transport model based on the benthic chamber experimental results at Euiam Lake, South Korea. As shown in the sensitivity analysis results, the eutrophication period could be significantly extended by a change of phosphorus flux rates from the sediments. The increased phosphorus flux from the sediments intensifies the algal growth of Euiam Lake, which could cause serious algal bloom during spring and fall. This study provides information on nutrient concentrations in the sediment of Euiam Lake, verifies the role of the sediment as a source or sink of nutrients, and evaluates the effect of sediment release of nutrients and contaminants on water quality. This research is a useful tool in determining the effects of internal load in lakes and establishing the operation guideline for sediment management in order to maintain feasible water quality for beneficial use.

1. Introduction

Eutrophication is a well-known problem in lakes which results in high phytoplankton production and negative impacts on aquatic ecosystems with severe water quality problems [1,2,3,4]. It is caused by excessive nutrients from a highly populated watershed which discharges organic matter, heavy metals, and nutrients that have great potential to impair water quality [5,6]. As nutrient loading, especially phosphorus (P) and nitrogen (N), is considered the principal limiting factor for phytoplankton production in lakes [7,8], the control of P loading is essential to enhance lake-water quality.
The amount of phosphorus in water depends on the internal load from the sediment as well as the external load. Sediment plays an important role in lake-water quality by acting as both a nutrient source and sink. The accumulated pollutants in the sediment can be a consistent nutrient loading to the overlying water column [9,10,11]. The importance of sediment-derived P (sediment-released P or internal P load) becomes especially obvious in lakes with recently reduced external P load. The accumulation of external P load in the sediments tends to function as a long-term P source to the lake, especially large shallow lake such as Okeechobee [12,13,14]. The amount of sediment-released P depends on the duration and areal extent of anoxia and on the rate at which P is liberated from the anoxic sediment surface [15,16].
Many studies have been conducted to observe the significance of the internal nutrient source (internal P load) in response to changes in environmental factors. However, only a few studies have focused on the importance of internal nutrients load in regulating nutrient levels in the whole lake. Recirculation of elements from sediment to the water column depends on the morphological (mean depth) [17,18,19], physical (meteorological condition, advection flow, velocity, and thermal stratification) [20,21,22,23], chemical (dissolved oxygen and redox potential) [9,24,25,26] and biological (bioturbation) [15,27,28] characteristics of the water body. Therefore, to estimate the contribution of nutrients released from sediment with respect to the control of water quality of the whole lake, it is necessary to investigate the fate and transport of nutrients using the method which counts on the physical, chemical, and biological characteristics of a water body. Various studies have been attempted to quantify the role of sediment-derived nutrients and water as nutrient sources, but they have not been able to produce definitive results. The movement of nutrients through the sediment–water interface, called benthic flux, depends on the upward flow of pore water caused by hydrostatic pressure, molecular diffusion by concentration gradient, and mixture or resuspension of sediment and water by bioturbation and water turbulence [29]. It is also controlled by dissolved oxygen (DO) levels, pH values, and temperature in the overlying water. Therefore, linking a benthic flux to a water quality model should provide more insight into the effects of benthic fluxes to more accurately quantify nutrient concentration within an entire reservoir system where physical, chemical, and biological properties are variable.
In this study, we examined the role of the sediment as a source or sink of nutrients and evaluated the effect of sediment release on nutrients and contaminants on water quality in a hydrodynamically complex water body, Euiam Lake in South Korea. To represent temporal and spatial variations in the nutrient concentrations of the reservoir, a three-dimensional time variable model was applied. Based on the model results, the following is determined and discussed: (1) the role of benthic fluxes on the water quality of the reservoir and (2) the extent of benthic fluxes to which the water quality exceeds the criteria. This research is a useful tool in determining the effects of internal load in lakes and establishing the operation guideline for sediment management in order to maintain feasible water quality for beneficial use.

2. Materials and Methods

2.1. Study Area

Euiam Lake is an artificial lake formed by the construction of the Euiam Dam as a hydraulic power generation plant in South Korea (37°52′53″ N, 127°42′07″ E). The lake drains an area of 7708 km2 and has a surface area of 15 km2, a storage capacity of 8.0 × 10⁷ m3, a mean depth of 3.7 m and a maximum depth of 13.4 m. The water level in the lake is normally maintained within 71.5 m mean sea level to secure an effective head for generation of electric power. Euiam Lake has two main incoming flows, the Chuncheon Dam and the Soyanggang Dam release of the Han River. The Soyanggang Dam has a total storage capacity of 2.9 × 10⁹ m3 and plays an important role in power generation, flood control, and water supply. Discharge of the Soyanggang Dam is constant with little seasonal variation. During the monsoon season (from July to September), rainfall and inflow of the Soyanggang Dam increase, but the outflow is relatively small. Discharge of the Chuncheon Dam, on the other hand, shares characteristics with inflow patterns. The difference in reservoir volume, watershed area, lake shape, and discharge pattern of the Chuncheon Dam and the Soyanggang Dam are relatively small compared to the flow rate of the lake volume, which significantly affects the hydrodynamics and water quality characteristics in Euiam Lake. Additionally, several islands in the center of the lake make it more difficult to mix the incoming flows sufficiently by separating the lake into two parts. Overall, Euiam Lake can be represented as a hydrological complex water body because of these topographical and hydrological properties. Therefore, it is difficult to analyze the water plume and mixing pattern due to the difference of the two dams regarding the amount of outflow and water temperature (Figure 1).
The points of water quality management of the Han River are important areas of interest because Euiam Lake is located in the upstream of Paldang Lake for the water supply of metropolitan areas, and algal blooms occur frequently. Over the last few decades, population growth coupled with urban and industrial development in the watershed has led to a deterioration of water quality. The most serious water quality problem in this lake is eutrophication, which causes algal blooms during high temperature, strong solar radiation, and low precipitation periods. Major pollutant sources are from the Chuncheon sewage treatment plant (STP), and Gonggicheon and include domestic sewage, industrial wastewater, and urban and agricultural runoff.
The temperature, conductivity, DO, and water quality of Euiam Lake are highly variable by season, especially during the summer monsoon period. The thermal stratification is observed every year near the dam, and lasts from August to October. Nitrogen concentration increases when the flow rate is low and phosphorus concentration increases when the initial flow rate increases or extreme drought persists. Tap water problems in 2011 were caused by the cyanobacteria and odor-inducing substances such as Geosmin flourished in early winter. In 2012, after the rainy season, green algae spread to the downstream water bodies of Euiam Lake [30]. In order to enhance the water quality of the reservoir, numerous water quality management practices have been applied, such as the construction of sewage treatment plant and regulation of land development for the removal of external pollutant loading. Despite the success of various efforts, the possibility of water quality problems is high, and the water quality is still not good enough for supplying drinking water [31,32,33].

2.2. Benthic Chamber Experiment

Sediment samples were collected on 5 September 2013 using acrylic cores to observe nutrient movement through the water–sediment interface. The details of the core sampler were explained in a previous research [34]. The bottom water (20 L) was also collected from the same location, filtered through pre-combusted GF/F filters, and stored in dark glass bottles. The sediment and water samples were placed in an ice box immediately after collection. Argon gas was diffused into the overlying water through a Teflon tube for the anaerobic experiments. The dissolved oxygen concentration in the overlying water was maintained below 2 mg L−1 during the incubation. The experiment was carried out at room temperature (22 ± 5 °C) but not in the dark. Thus, some light might penetrate the overlying water.
To analyze ammonia (NH3-N), nitrate (NO3-N), and phosphate (PO4-P) of the water sample, 500 mL of water were taken daily for 20 days (EPA method 350.1, 352.1, and 365.1) compensated by adding the original filtered bottom water to the chambers. The chemical composition of bottom water was as follows; pH is 8.27, DO is 8.43 mg L−1, ammonia is 0.063 mg L−1, nitrate is 0.079 mg L−1, and phosphate is 0.018 mg L−1. The filtered bottom water was stored in the cold (4 °C) and dark to minimize potential changes to its properties. The benthic flux at the sediment–water interface is defined as the mass of chemical species flowing unit of sediment surface during unit time. The benthic flux can be calculated by
Flux ( mg · m 2 · d 1 ) = ( C t n + 1 × V 1 ) ( C t n × ( V 1 V 2 ) + C 0 × V 2 ) ( t n + 1 t n ) × A
where A is the surface area of the sediment–water interface in the benthic chamber (m2), and n is the number of samples, (tn+1 − tn) is time interval (d), C0 is initial concentration (mg L−1), Ct is related to the concentration (mg L−1) measured in water from the benthic chamber at the time t (day), and V1 and V2 are volumes before sampling and after sampling of the benthic chamber (Liter), respectively.

2.3. Model Application

The Generalized Longitudinal–Lateral–Vertical Hydrodynamics and Transport (GLLVHT) model developed by Edinger and Buchak [35,36,37] was applied to Euiam Lake. The hydrodynamic and transport relationships used in the GLLVHT model are developed from the horizontal momentum balance, continuity, constituent transport, and the equation of state. The horizontal momentum balances for the horizontal velocity components, U and V in the x and y coordinate horizontal directions, with z taken positively downward are
U t = g z x g ρ z z ( ρ x ) z U U x U V y U W z + x ( A x U x ) + y ( A y U y ) + z ( A z U z ) f V + S M x
V t = g z x g ρ z z ( ρ y ) z U V x V V y V W z + x ( A x V x ) + y ( A y V y ) + z ( A z V z ) f U + S M y
where U, V, and W are the velocity components (m s−1) in each of the x, y, and z directions; g is the gravitational acceleration (m s−2); r is the density (kg m−3); t the time (s); z’ is the free surface elevation (m); and Ax, Ay, and Az are the momentum dispersion coefficients (m2 s−1) in each of the x, y, and z directions.
Local continuity for the vertical velocity component W (m s−1) is
W t = U x V y
Vertically integrated continuity for the free surface elevation, z’, is
z t = z h ( U x ) dz z h ( V y ) dz
where h is the water depth (m).
The constituent transport relationship for n number of constituents (for example, salinity, dye, and sediment) is
C n t = UC n x V C n y WC n z + ( D x C n x ) x + ( D y C n y ) y + ( D z C n z ) z + H C n
where Cn is the concentration (g m−3) of constituent n; Dx, Dy, and Dz are the constituent dispersion coefficients (m2 s−1) in each of the x, y, and z directions; and Hn is the source or sink term (g m−3 s−1).
The Equation of state relating density, ρ, to constituents is
ρ = f ( C 1 , C 2 , , C n , T )
These relationships have six unknowns (U, V, W, z’, r and Cn) in six Equations, assuming that the momentum and constituent dispersion coefficients (Ax, Ay, Az, Dx, Dy, and Dz) can be evaluated from velocities and the density structure.
The GLLVHT model is suitable for representing irregular boundaries because it uses a curvilinear computational grid method. It has been successfully applied to identify the causes of water quality problems in various hydraulic environments and to find solutions [11,37,38,39,40,41]. The GLLVHT model is built into the Generalized Environmental Modeling System for Surfacewaters (GEMSS) and serves as an integrated system for hydraulics to support a three-dimensional, time-varying modeling system. In this study, GLLVHT-WQDPM (Water Quality Dissolved Particulate Model) model, which is an extension of the EUTRO5 model, was applied to examine water quality properties. This water quality model treats dissolved and particulate forms of carbonaceous biochemical oxygen demand (CBOD), organic nitrogen (ON), and organic phosphorus (OP) as separate-state variables and includes zooplankton excretion as a source of particulates [37]. A process diagram for WQDPM is provided in Figure 2, and the details of model equations are given in a previous research [42].
The GEMSS model was applied to Euiam Lake, considering lake geographic characteristics and available data of boundary condition. It is necessary to use the GIS themes of shorelines and depths to generate a computational grid of the three-dimensional model by GRIDGEN, a generating tool in the GEMSS system. Overall, the horizontal grid was composed of 579 surface active cells and the elevation is varied from 47.4 m to 80.0 m. There are 22 vertical layers with a uniform thickness of 1.5 m resolution. The model grids were considered to reproduce in detail the discharge location of the Chuncheon STP aggregate island shape and water body shape of large and small islands in the lake.
The boundary conditions for the model were set up with meteorological condition, inflows, and dam outflows, and intake stations. Hourly meteorological data, such as air and dew point temperature (°C), wind speed (m s−1) and direction (degrees), solar radiation (MJ m−2), cloud cover (tenths), and air pressure (hPa), were gathered from the weather monitoring station of Korea Meteorological Administration (KMA, http://www.kma.go.kr) at Chuncheon. As incoming boundary conditions for hydrodynamic modeling, two main inflows (the Chuncheon and Soyanggang Dam release), Gonggicheon, six tributaries (T1–T6), and Chuncheon STP effluent, as well as precipitation were applied. Hydrologic data and daily operations data from upstream dam release were obtained from Water Resources Management Information System (WAMIS, http://www.wamis.go.kr). Flow data of Gonggicheon and six tributaries were estimated by specific discharge measurement based on the Euiam watershed area and flow. Daily effluent volumes of STP were from the operation. The outflow conditions are the release of the Euiam Dam and two intake stations. Daily discharge data through the Euiam Dam were estimated by balancing the water budget on the basis of precipitation, flow rates from the incoming flows, intake volumes in the lake, and water levels of the lake. Daily water level data were obtained from the dam operation records of the WAMIS. Daily intake volumes for drinking water supply were obtained from the operation records at each intake station. Water quality data were collected monthly by national water quality monitoring program of Ministry of Environment (ME, http://water.nier.go.kr) in Korea and had been interpolated for the boundary conditions.

2.4. Statistical Evaluation of Calibration and Verification

In order to evaluate the prediction performance of the model, we considered root mean square error (RMSE), mean absolute percentage error (MAPE), and Nash–Sutcliffe Efficiency (NSE) of the observed and simulated values. The ideal values of statistical tests such as RMSE and MAPE are 0 or closer to 0. A model is more efficient when NSE is closer to 1. They are respectively calculated as
R M S E =   i = 1 m ( O b s i M o d i ) 2 m
M A P E =   1 m i = 1 m ( | O b s i M o d i O b s i | )
N S E =   1 i = 1 m ( O b s i M o d i ) 2 i = 1 m ( O b s i O b s i ¯ ) 2
where O b s i is the observed data in time i, M o d i is the simulate data in time i, O b s i ¯ is the mean observed data and m is the number of data.

3. Results and Discussion

3.1. Nutrient Release Fluxes from the Sediment

The physical and chemical characteristics of the sediments used in this experiment are fully explained in a previous research [43]. Sediments were dominantly composed of sandy loam at depths of 0–5 cm and sand at depths of 5–15 cm. To observe nutrient movement through the water–sediment interface, benthic chamber experiment was carried out [34]. The value of nutrient release fluxes fluctuated throughout the experimental period. Positive values indicate the release of chemical species from the sediment into the overlying water and negative values indicate vice versa. The movement of nutrients at the sediment–water interface is controlled by the environment condition, such as temperature, dissolved oxygen (DO), pH, redox potential, and biological activity [44].
The overall fluxes obtained from this study are as follows: ammonia is −7.915 to −0.074 mg m−2 d−1, nitrate is −17.940 to 1.209 mg m−2 d−1, and phosphate is 0.049 to 9.993 mg m−2 d−1. The phosphate fluxes obtained in this experiment were almost positive throughout the experimental period except for a few negative values. Negative fluxes were obtained for ammonia and nitrate. Generally, ammonia flux has positive value and nitrate flux has negative value. However, negative fluxes of ammonia and nitrate in this experiment suggests that nitrification is dominant in the overlying water which transports a larger amount of nitrate toward the sediments and with a small amount of ammonia back to the upper water layer. The values obtained in this experiment are compared with nitrogen and phosphorus flux ranges measured in other studies conducted in the lake. The nutrient fluxes values of this experiment are generally of the same order of magnitude as values found in the other studies (Figure 3) [45,46,47,48,49].

3.2. Model Calibration and Verification

The hydrodynamic and water quality model was calibrated using data in the normal year (2013) based on the standardized precipitation index (SPI) [50]. Calibration was conducted by tuning appropriate model parameters to match model prediction and measured data as best as possible. The measured data were obtained from the national water quality monitoring stations of the Korean Ministry of Environment (KME) (Figure 1). After trial-and-error processes to get the best fit of the measured data, adjusted parameters within acceptable ranges were obtained and summarized in Table 1. As this table shows, the calibrated values of all coefficients fall within the typical ranges recommended in the literature [51,52,53,54,55]. Especially, for the calibration of nitrogen and phosphorus, the average value of nutrient release fluxes obtained from the benthic chamber experiment was used as follows: ammonia is −0.921 mg m−2 d−1, nitrate is −1.522 mg m−2 d−1, and phosphate is 1.295 mg m−2 d−1. The model was verified against the data measured during dry year (2014), which is under quite different hydrological conditions from the year of model calibration to test the ability of the model to simulate the hydrodynamic system at various weather and flow conditions. The reaction coefficients of the model were kept the same as those determined from the model calibration. From these results, it can be seen that the model in this study area indicates the annual cycle of hydrodynamics and water quality tendency.
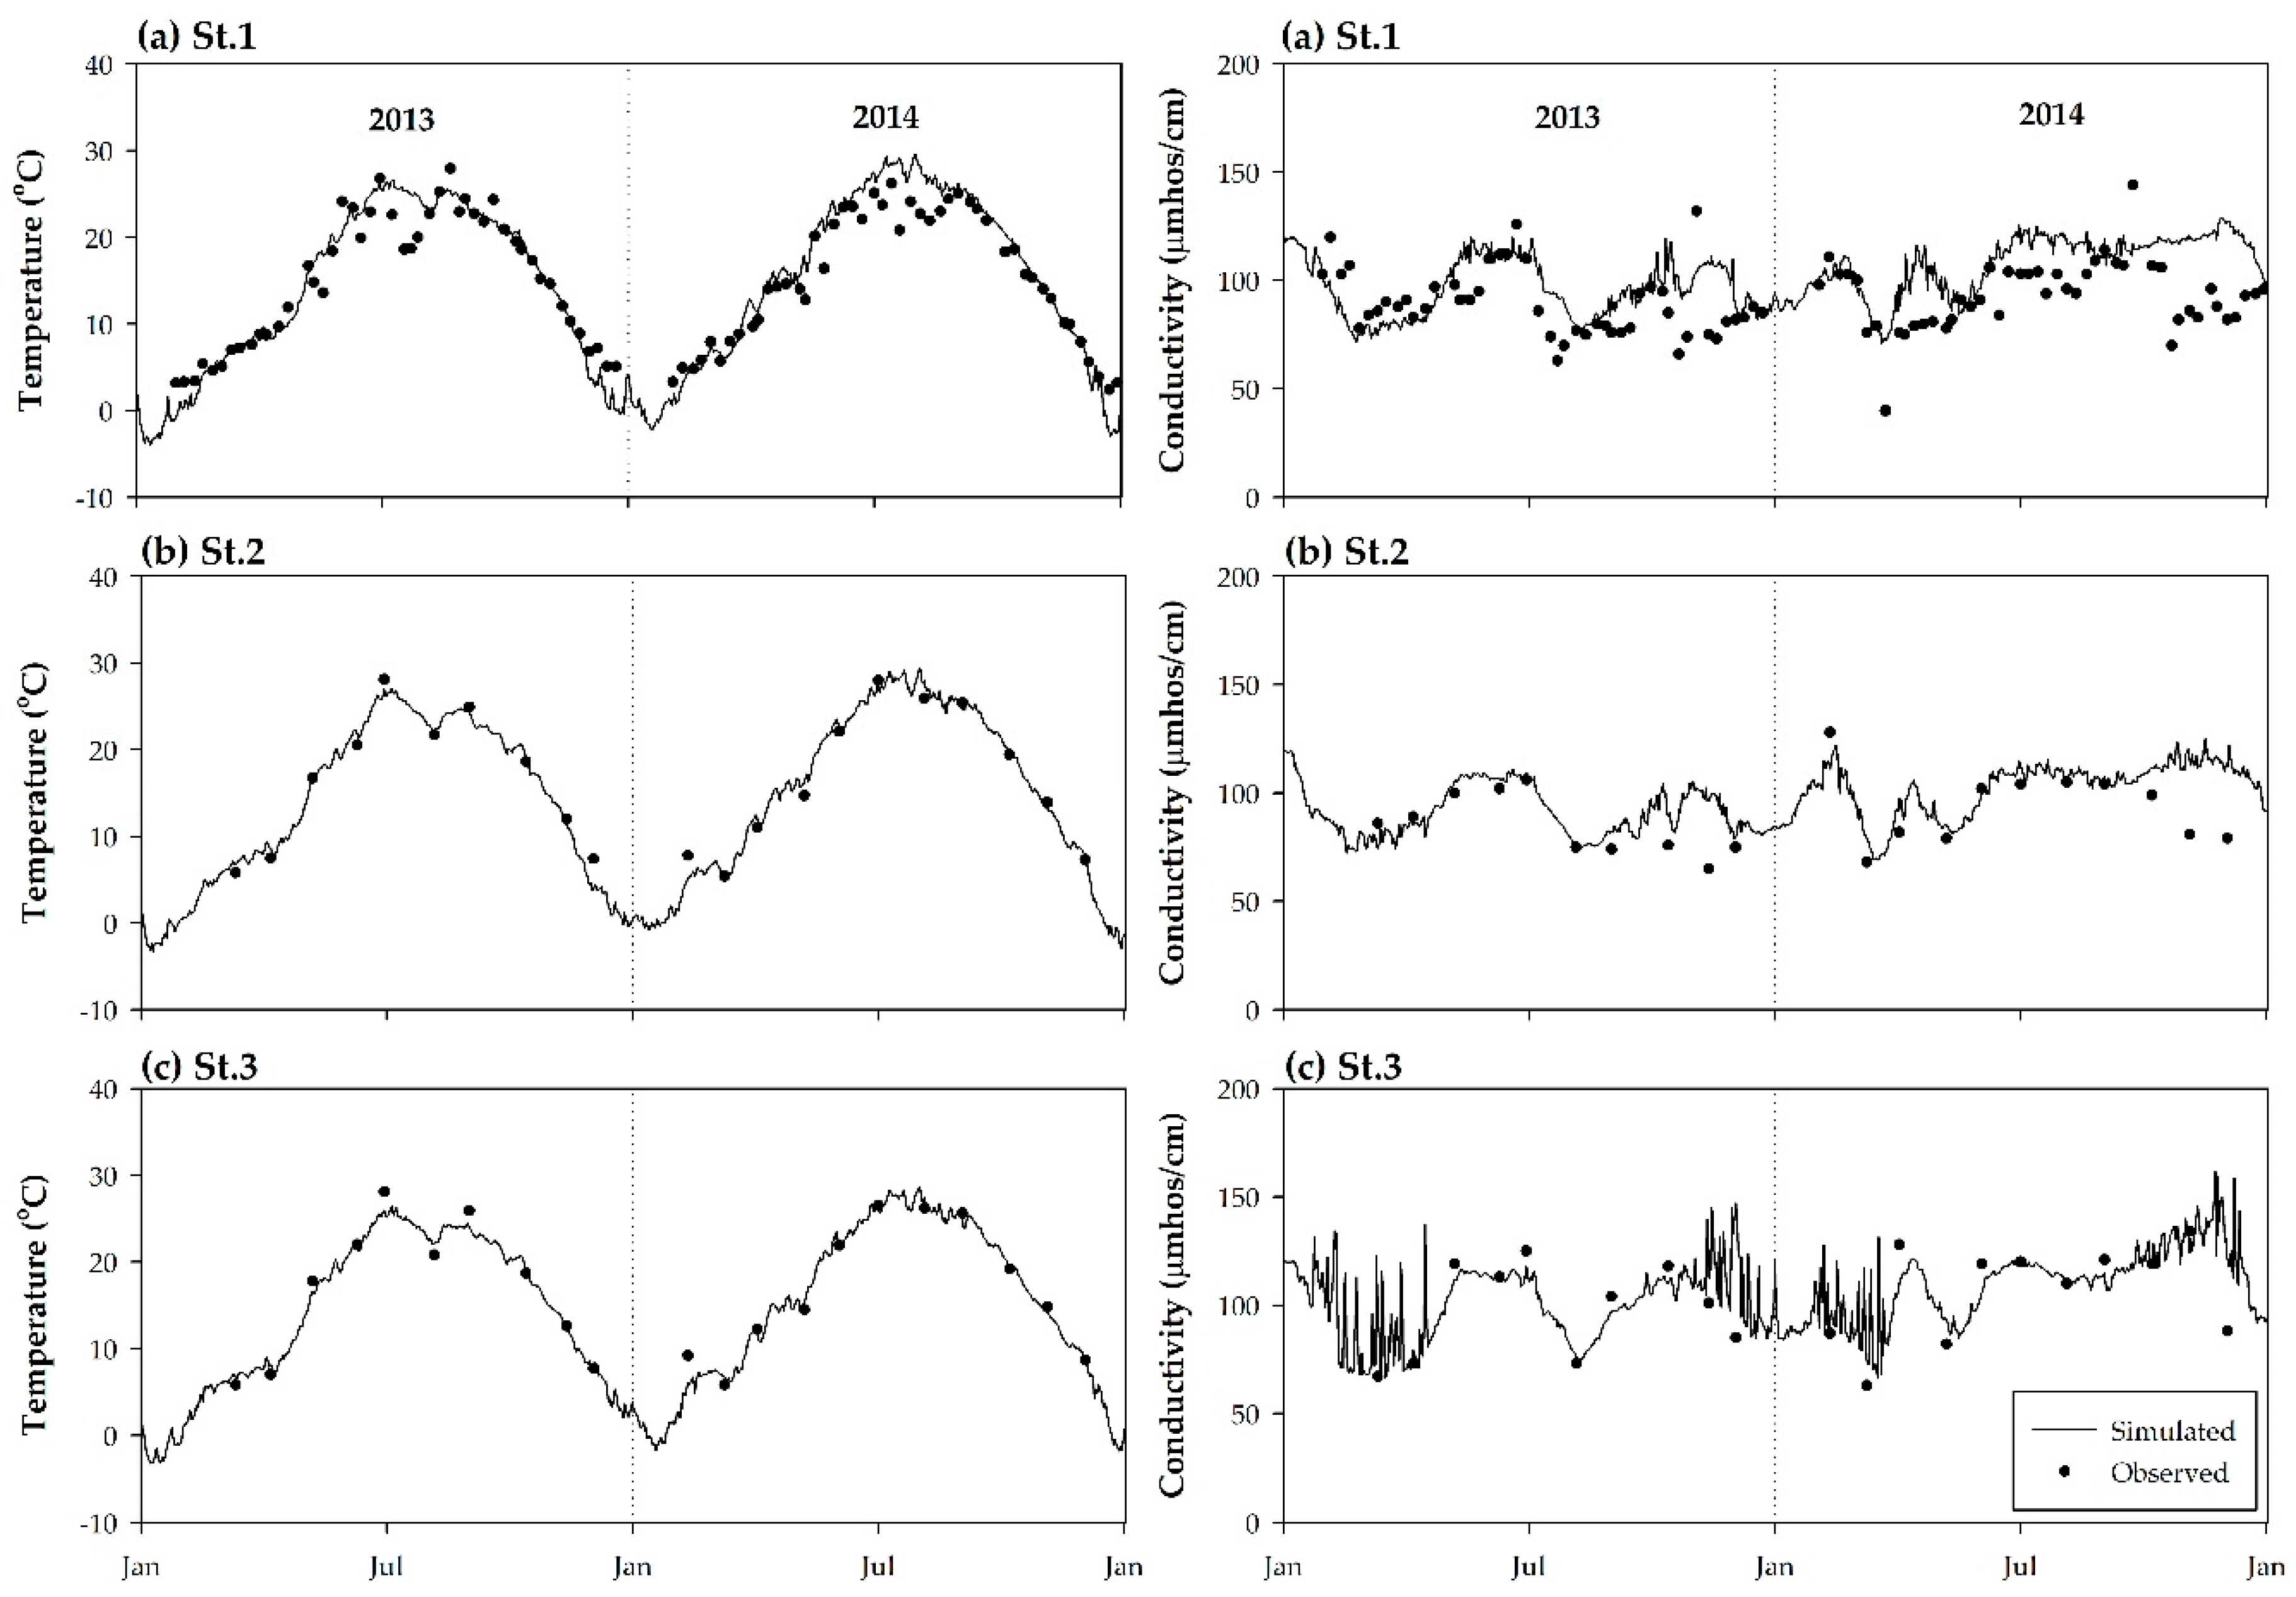
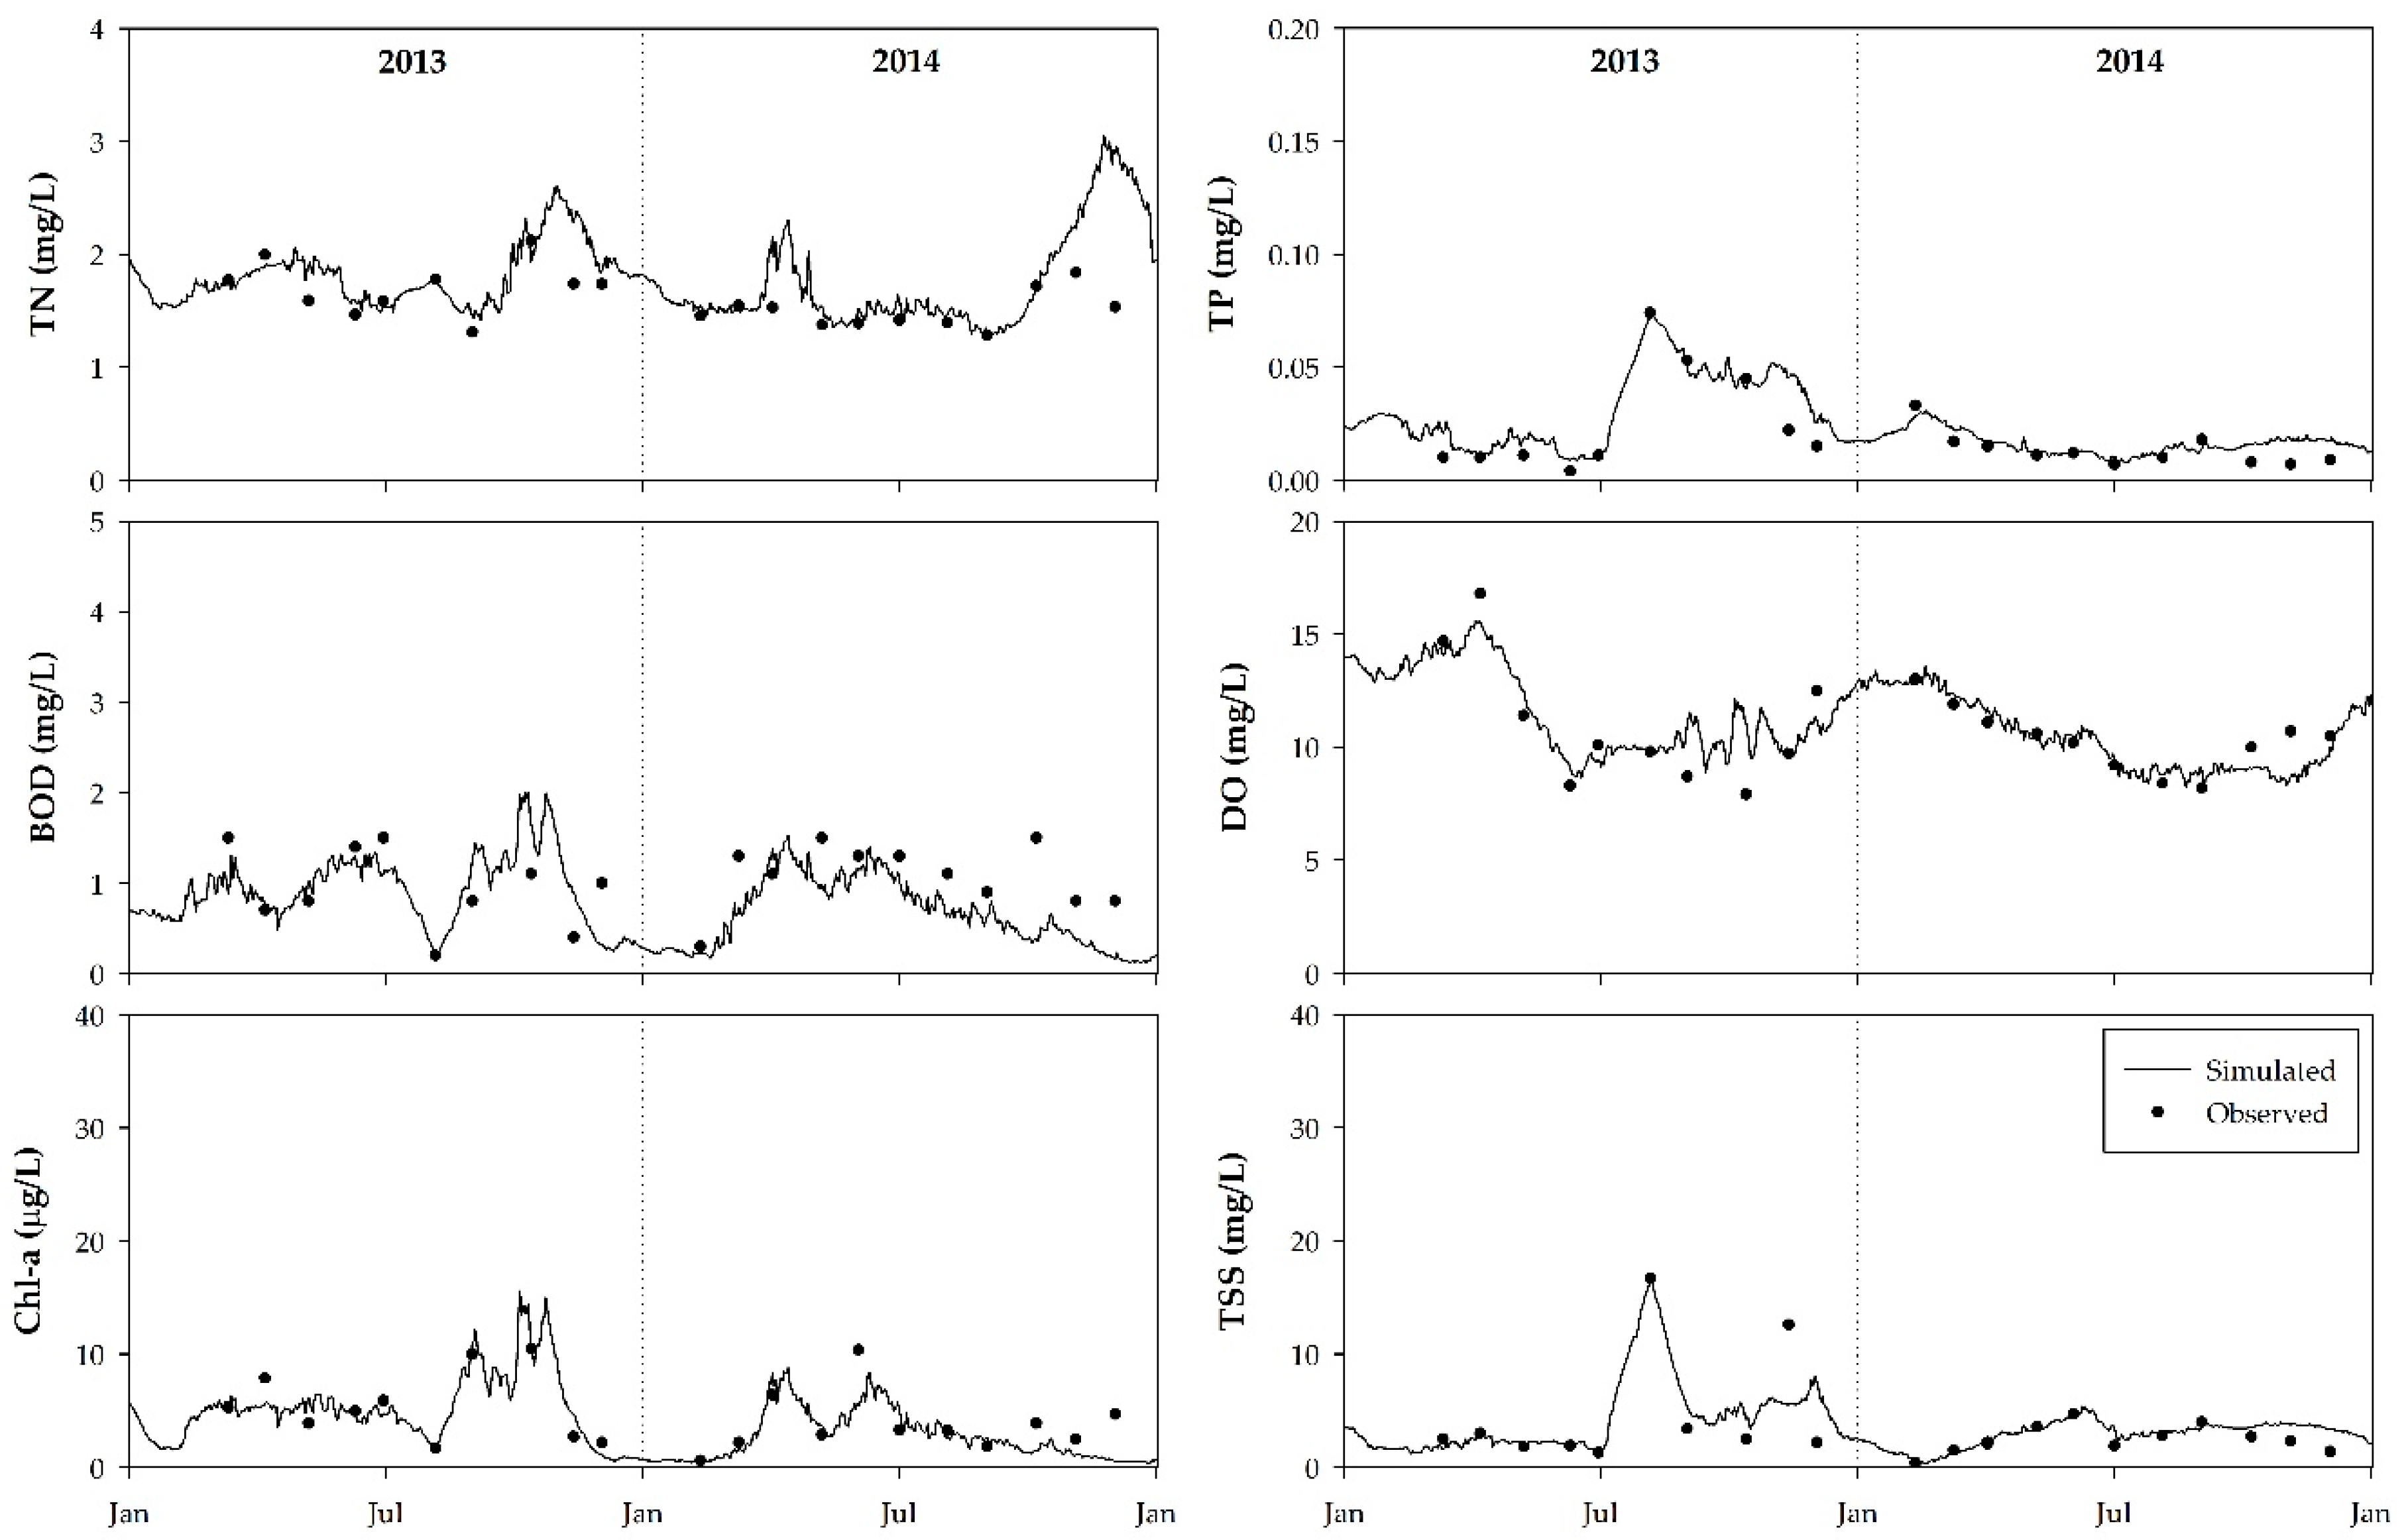
Figure 4, Figure 5, Figure 6 and Figure 7 show the model calibration results for water temperature, conductivity, and water qualities at the surface. The water quality parameters included BOD, DO, nitrogen, and phosphorus series, chlorophyll a (Chl-a) and total suspended solids (TSS). RMSR, MAPE, and NSE of the observed and simulated values were used to evaluate the ability of model prediction and summarized in Table 2.
The RMSE values of temperature in 2013 and 2014 are from 0.37 to 0.44 °C, and from 0.36 to 0.39 °C, respectively. The MAPE values of temperature in 2013 and 2014 are from 6.5 to 20.0%, and from 6.4 to 21.4%, respectively. The NSE values of temperature in 2013 and 2014 are from 0.88 to 0.98, and from 0.87 to 0.98, respectively. The NSE values are more than 0.85, which indicates the thermal simulation results of this model are acceptable. Some errors could be attributed to the difference between surface water temperature of the model in winter being affected by the atmosphere and the observed temperature below the surface water. The RMSE values of conductivity in 2013 and 2014 are from 2.35 to 7.21 μs cm−1, and from 3.19 to 5.64 μs cm−1, respectively. The MAPE values of conductivity in 2013 and 2014 are from 9.5 to 16.9%, and from 11.1 to 21.5%, respectively. The NSE values of conductivity in 2013 and 2014 are from 0.18 to 0.67, and from 0.06 to 0.57, respectively. The electric conductivity depends on the concentration of ions present in the water, such that it could indirectly describe the characteristics of the water body and be used as an indicator of mixing pattern. The conductivity calibration and verification results show that this model simulates well the mixing behavior of the flows. The model results of water temperature and conductivity are generally in good agreement with the field measurements of all stations, except for sometimes at St.1, which is due to the fact that St.1 is located in the mixing zone of the Chuncheon Dam and the Soyanggang Dam. Therefore, it was hydraulically complex and unstable, and model results were overestimated, especially during the monsoon periods. St.2 and St.3 are directly affected by the discharge of the upstream dam, so the data have large fluctuations.
The model calibration results for the surface layer indicated that the simulated water quality values were generally in good agreement with the observed data in most stations, except for St.1. This discrepancy can be explained the fact that St.1 is located in the mixing zone of Chunchoen Dam and Soyanggang Dam inflows, and Euiam Dam Release, which would have highly variable water quality. The model verification results indicated that reasonable agreement existed between the model results and the field measurements, except for the water quality discrepancy at St.1. The BOD and Chl-a concentration at St.1 in 2014 were underestimated so that the NSE values is negative. This discrepancy is presumably due to the influence of additional external inflows that were not considered in the algal growth mechanism after July. In future studies, it is necessary to investigate the vertical distribution of mixing patterns and algal growth characteristics in Euiam Lake.

3.3. Assessment of Water Quality Affected by Sediment Flux

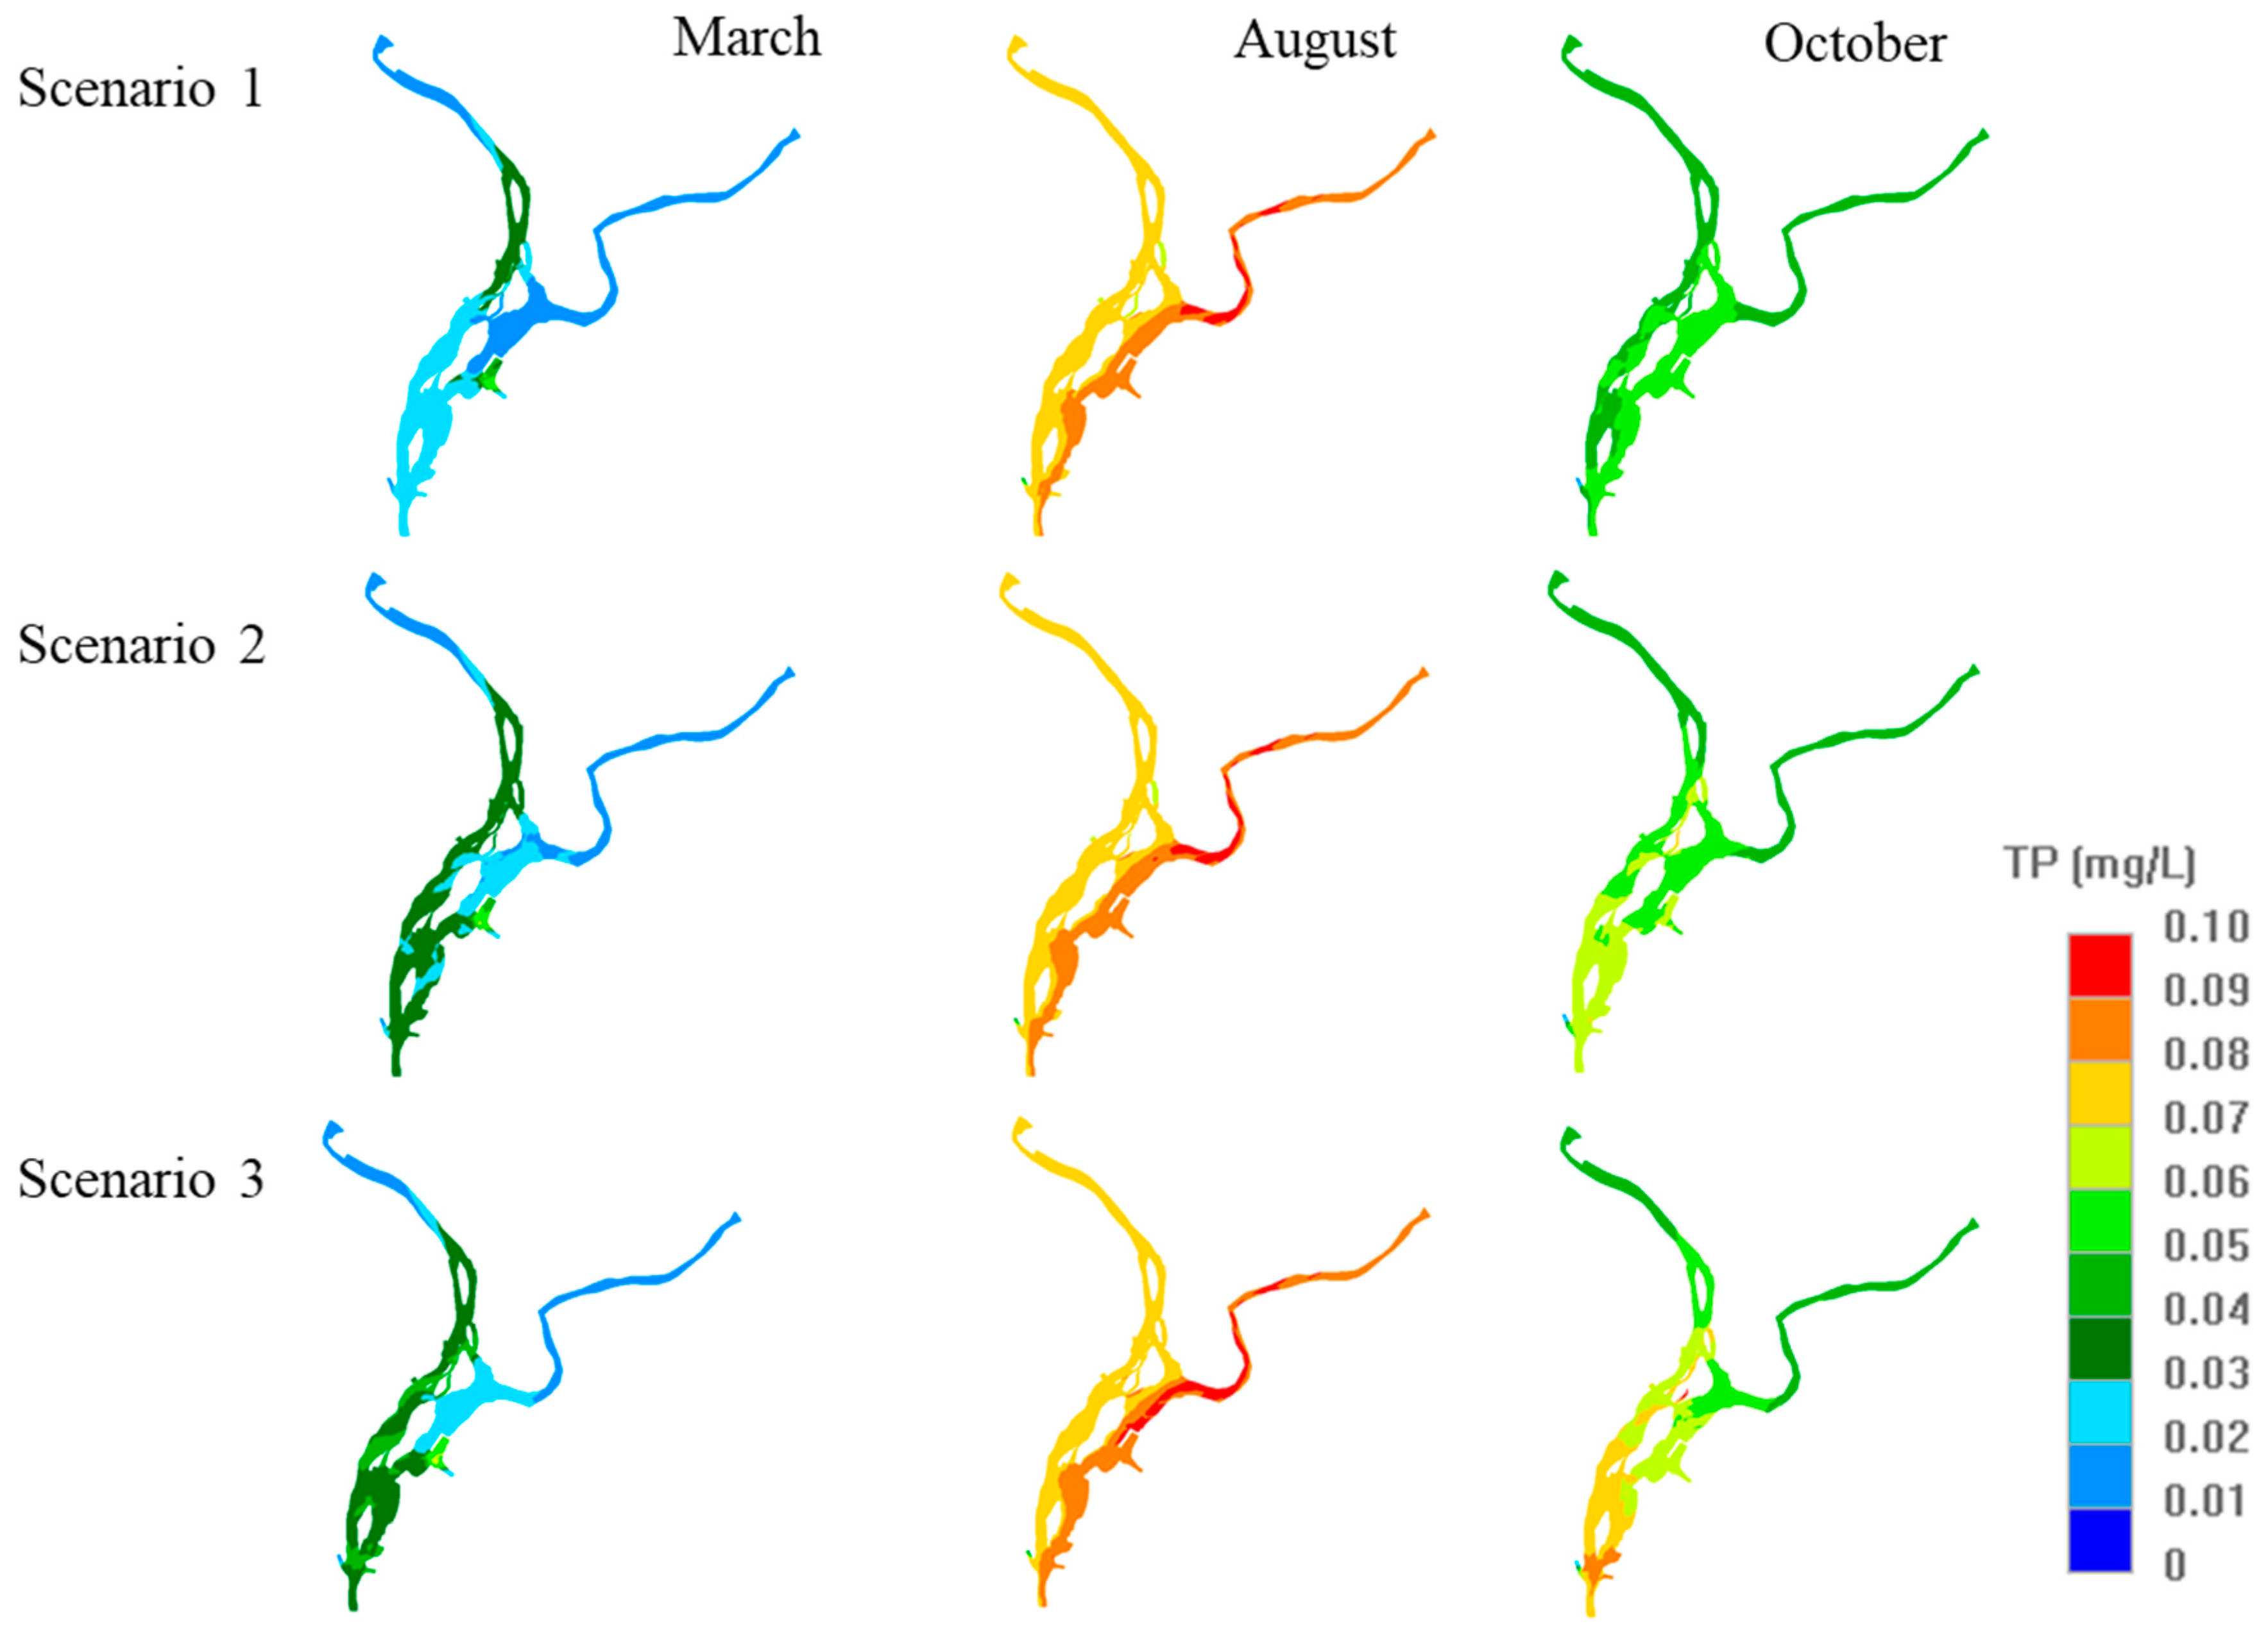
Figure 8 and Figure 9 show the seasonal distribution of TP and Chl-a concentration according to the change of phosphate flux rates. Sensitivity analysis of sediment fluxes on the water quality of Euiam Lake was conducted using the calibrated model. We used the minimum value (0.049 mg P m−2 d−1), the 50-percentile value (5.00 mg P m−2 d−1) and maximum (9.993 mg P m−2 d−1) values of phosphate flux for Scenarios 1–3, respectively. The calibration results indicate that TP concentration has a similar tendency to the outflow of the Chuncheon Dam and the Soyanggang Dam in spring and is only slightly higher at the Gonggicheon inlet. The TP concentration is relatively high in the Chuncheon Dam outflow in March and the Soyanggang Dam outflow in August, and there was no difference in the two main influent concentrations in October. The sensitivity analysis of sediment release flux showed that the TP concentration increased significantly during spring (to May) and fall (from September) and was significantly influenced by sediment release flux. Especially in August, the TP concentration of the Soyanggang Dam is high spatially, and the concentration in the right side of Euiam Lake increases greatly as the sediment flux rate increases. In October, the TP concentration of total phosphorus is high at the entrance of the Euiam Dam. It could be seen that the intensity of Chl-a growth varies with the increase and change of the sediment release fluxes. As a result of scenario analysis, there was no significant change in Chl-a concentration in spring and a slight increase on the left side of the Chuncheon Dam. It shows that Chl-a concentration in the Euiam Dam is increased spatially due to the increase of TP concentration and temperature after intensive rainfall. In the Scenario 1 analysis, low Chl-a concentration from the Chuncheon Dam and low sediment flux seem to suppress the algal growth in Euiam Lake. The increased phosphorus flux from the sediments intensifies the algal growth of Euiam Lake, which could cause serious algal bloom during spring and fall.
Figure 10 indicates annual changes in the TP and Chl-a concentrations and assessment of water quality affected by sediment release flux. Based on the model results, we evaluated the trophic status and eutrophication period of the lake in accordance with trophic classification standard [56] and trophic state index (TSI) [57]. The eutrophication period could be significantly extended by the change of phosphorus flux rates from the sediments. The trophic classification system standards classified 0.035 mg L−1 or more TP concentration as eutrophic status and over 0.100 mg L−1 as hypereutrophic status. The TP concentration of the Scenario 1 analysis is estimated have a eutrophic status for more than approximately 140 days. In Scenario 2 analysis, the eutrophication status was increased by 27% from the baseline (Scenario 1) and estimated to be maintained for 180 days. In Scenario 3, it increased by 60% and was evaluated to be over 220 days. However, the annual TP concentration is below 0.100 mg L−1 and is not in hypereutrophic status. According to trophic classification standard, it is eutrophic status if the Chl-a concentration is above 8 μg L−1. In Scenarios 2 and 3, the eutrophic status increases from baseline 35 days to 44 days and 54 days, respectively. Based on 50–60 value of TSI, a Chl-a concentration of 6.4 μg L−1 or more is judged to be in the eutrophic status. It is estimated that the results of Scenarios 1–3 are about 68 days, 78 days, and 115 days, respectively. The annual Chl-a concentration is less than 20 μg L−1 which is not hypereutrophic status. However, the number of days when the TP concentration exceeds the eutrophication standard, 0.024 mg L−1 are 225 days, 284 days, and 323 days, respectively. Especially, when TP concentration is higher than 0.048 mg L−1, the number of days are 97 days, 120 days, and 134 days, respectively. This means that the abundance of nutrients makes it possible for the blue-green algae to grow rapidly if the temperature rises and the water body becomes stagnant.

4. Conclusions

Eutrophication is caused by excessive phosphorus (P) and nitrogen (N) internal or external loading which results in high phytoplankton production and negative impacts on the aquatic ecosystem, with severe water quality problems. To estimate the effects of sediment load on the water quality of the reservoir, we applied a three-dimensional hydrodynamic and transport model based on the benthic chamber experimental results at Euiam Lake, South Korea. The nitrogen and phosphorus release fluxes from the sediment in the present study are generally of the same order of magnitude as values found in most of the literature. After calibration and verification, the model is utilized to estimate the effect of sediment load on the water quality of the reservoir. As shown in the sensitivity analysis results, the eutrophication period could be significantly extended by the change of phosphorus flux rates from the sediments. The increased phosphorus flux from the sediments intensifies the algal growth of Euiam Lake, which could cause serious algal bloom during spring and fall. This study provides information on nutrient concentrations in the sediment of Euiam Lake, verifies the role of the sediment as a source or sink of nutrients, and evaluates the effect of sediment release of nutrients and contaminants on water quality. This research is a useful tool in determining the effects of internal load in lakes and establishing the operation guideline for sediment management in order to maintain feasible water quality for beneficial use.

Author Contributions

H.W.L. performed model simulations and data analysis, and wrote the manuscript; Y.S.L., J.K., and K.J.L. provided technical advice and revision of manuscript; J.H.C. contributed in configuring the text on methods, results, and discussion.

Funding

This research was supported by Basic Science Research Program through the National Research Foundation of Korea (NRF) funded by the Ministry of Education (2018R1A6A1A08025520) and RP-Grant 2014 of Ewha Womans University.

Conflicts of Interest

The authors declare no conflict of interest.

References

  1. Howarth, R.W.; Marino, R. Nitrogen as the limiting nutrient for eutrophication in coastal marine ecosystems: Evolving views over three decades. Limnol. Oceanogr. 2006, 51, 364–376. [Google Scholar] [CrossRef] [Green Version]
  2. Schindler, D.W. Recent advances in the understanding and management of eutrophication. Limnol. Oceanogr. 2006, 51, 356–363. [Google Scholar] [CrossRef] [Green Version]
  3. Sinha, E.; Michalak, A.M.; Balaji, V. Eutrophication will increase during the 21st century as a result of precipitation changes. Science 2017, 357, 405–408. [Google Scholar] [CrossRef] [PubMed] [Green Version]
  4. Søndergaard, M.; Jeppesen, E.; Lauridsen, T.L.; Skov, C.; Van Nes, E.H.; Roijackers, R.; Lammens, E.; Portielje, R. Lake restoration: Successes, failures and long-term effects. J. Appl. Ecol. 2007, 44, 1095–1105. [Google Scholar] [CrossRef]
  5. Granlund, K.; Räike, A.; Ekholm, A.; Rankinen, K.; Rekolainen, S. Assessment of water protection targets for agricultural nutrient loading in Finland. J. Hydrol. 2005, 304, 251–260. [Google Scholar] [CrossRef]
  6. Mozeto, A.A.; Silvério, P.F.; Soares, A. Estimates of benthic fluxes of nutrients across the sediment—Water interface (Guarapiranga reservoir, São Paulo, Brazil). Sci. Total Environ. 2001, 266, 135–142. [Google Scholar] [CrossRef]
  7. Lv, J.; Wu, H.; Chen, M. Effects of nitrogen and phosphorus on phytoplankton composition and biomass in 15 subtropical, urban shallow lakes in Wuhan, China. Limnologica 2011, 41, 48–56. [Google Scholar] [CrossRef] [Green Version]
  8. Moss, B. Cogs in the endless machine: Lakes, climate change and nutrient cycles: A review. Sci. Total. Environ. 2012, 434, 130–142. [Google Scholar] [CrossRef]
  9. Nguyen, H.V.; Maeda, M. Effects of pH and oxygen on phosphorus release from agricultural drainage ditch sediment in reclaimed land, Kasaoka Bay, Japan. J. Water Environ. Technol. 2016, 14, 228–235. [Google Scholar] [CrossRef]
  10. Wang, S.; Jin, X.; Bu, Q.; Jiao, L.; Wu, F. Effects of dissolved oxygen supply level on phosphorus release from lake sediments. Colloid. Surface A 2008, 316, 245–252. [Google Scholar] [CrossRef]
  11. Wu, J.; Buchak, E.M.; Endinger, J.E.; Kolluru, V.S. Simulation of cooling-water discharge from power plants. J. Environ. Manage. 2001, 61, 77–92. [Google Scholar] [CrossRef]
  12. Fisher, M.M.; Reddy, K.R.; James, R.T. Long-term changes in the sediment chemistry of a large shallow subtropical lake. Lake Reserv. Manag. 2001, 17, 217–232. [Google Scholar] [CrossRef]
  13. Fisher, M.M.; Reddy, K.R.; James, R.T. Internal nutrient loads from sediments in a shallow, subtropical lake. Lake Reserv. Manag. 2005, 21, 338–349. [Google Scholar] [CrossRef]
  14. Khare, Y.P.; Naja, G.M.; Stainback, A.; Martinez, R.; Paudel, R.; Van Lent, T. A Phased Assessment of Restoration Alternatives to Achieve Phosphorus Water Quality Targets for Lake Okeechobee, Florida, USA. Water 2019, 11, 327. [Google Scholar] [CrossRef]
  15. Søndergaard, M.; Jensen, J.P.; Jeppesen, E. Role of sediment and internal loading of phosphorus in shallow lakes. Hydrobiologia 2003, 506, 135–145. [Google Scholar] [CrossRef]
  16. Palmer-Felgate, E.J.; Mortimer, R.J.; Krom, M.D.; Jarvie, H.P.; Williams, R.J.; Spraggs, R.E. Internal loading of phosphorus in a sedimentation pond of a treatment wetland: Effect of a phytoplankton crash. Sci. Total Environ. 2011, 409, 2222–2232. [Google Scholar] [CrossRef]
  17. Ahanger, M.A.; Asawa, G.L.; Lone, M.A. Experimental study of sediment transport hysteresis. J. Hydraul. Res. 2008, 46, 628–635. [Google Scholar] [CrossRef]
  18. Montreuil, A.-L.; Levoy, F.; Bretel, P.; Anthony, E.J. Morphological diversity and complex sediment recirculation on the ebb delta of a macrotidal inlet (Normandy, France): A multiple LiDAR dataset approach. Geomorphology 2014, 2019, 114–125. [Google Scholar] [CrossRef]
  19. Waters, K.A.; Curran, J.C. Linking bed morphology changes of two sediment mixtures to sediment transport predictions in unsteady flows. Water Resour. Res. 2015, 51, 2724–2741. [Google Scholar] [CrossRef]
  20. Burger, D.F.; Hamilton, D.P.; Pilditch, C.A. Modelling the relative importance of internal and external nutrient loads on water column nutrient concentrations and phytoplankton biomass in a shallow polymictic lake. Ecol. Model. 2008, 211, 411–423. [Google Scholar] [CrossRef]
  21. Qin, B.; Hu, W.; Gao, G.; Luo, L.; Zhang, J. Dynamics of sediment resuspension and the conceptual schema of nutrient release in the large shallow Lake Taihu, China. Chin. Sci. Bull. 2004, 49, 54–64. [Google Scholar] [CrossRef]
  22. Reddy, K.R.; Fisher, M.M.; Ivanoff, D. Resuspension and diffusive flux of nitrogen and phosphorus in a hypereutrophic lake. J. Environ. Qual. 1996, 25, 363–371. [Google Scholar] [CrossRef]
  23. Schadlow, S.G.; Hamilton, D.P. Effect of major flow diversion on sediment nutrient release in a stratified reservoir. Mar. Freshwater Res. 1995, 46, 189–195. [Google Scholar] [CrossRef]
  24. Hu, W.F.; Lo, W.; Chua, H.; Sin, S.N.; Yu, P.H.F. Nutrient release and sediment oxygen demand in a eutrophic land-locked embayment in Hong Kong. Environ. Int. 2001, 26, 369–375. [Google Scholar] [CrossRef]
  25. Rozan, T.F.; Taillefert, M.; Trouwborst, R.E.; Glazer, B.T.; Ma, S.; Herszage, J.; Valdes, L.M.; Price, K.S.; Luther, G.W., III. Iron-sulfur-phosphrous cycling in the sediments of a shallow coastal bay: Implications for sediment nutrient release and benthic macroalgal blooms. Limnol. Oceanogr. 2002, 47, 1346–1354. [Google Scholar] [CrossRef]
  26. Song, K.; Adams, C.J.; Burgin, A.J. Relative importance of external and internal phosphorus loadings on affecting lake water quality in agricultural landscapes. Ecol. Eng. 2017, 108, 482–488. [Google Scholar] [CrossRef]
  27. He, Y.; Men, B.; Yang, X.; Li, Y.; Xu, H.; Wang, D. Investigation of heavy metals release from sediment with bioturbation/bioirrigation. Chemosphere 2017, 184, 235–243. [Google Scholar] [CrossRef]
  28. Parsons, C.T.; Rezanezhad, F.; O’Connell, D.W.; Cappellen, P.V. Sediment phosphorus speciation and mobility under dynamic redox conditions. Biogeosciences 2017, 14, 3585–3602. [Google Scholar] [CrossRef] [Green Version]
  29. Petersen, W.; Willer, E.; Willamowski, C. Remobilization of trace elements from polluted anoxic sediments after resuspension in oxic water. Water Air Soil Pollut. 1997, 99, 515–522. [Google Scholar] [CrossRef]
  30. Hwang, S.-J.; Sim, Y.-B.; Choi, B.-G.; Kim, K.; Park, C.; Soe, W.; Park, M.-H.; Lee, S.-W.; Shin, J.-K. Rainfall and hydrological comparative analysis of water quality variability in Euiam reservoir, the North-Han River, Korea. Korean J. Limnol. 2017, 50, 29–45. [Google Scholar] [CrossRef]
  31. Jung, S.; Shin, M.; Kim, J.; Eum, J.; Lee, Y.; Lee, J.; Choi, Y.; You, K.; Owen, J.; Kim, B. The effects of Asian summer monsoons on algal blooms in reservoirs. Inland Waters 2016, 6, 406–413. [Google Scholar] [CrossRef]
  32. Choi, J.K.; Min, J.-H.; Kim, D.-W. Three-dimensional algal dynamics modeling study in lake Euiam Based on limited monitoring data. J. Korean Soc. Water Environ. 2015, 31, 181–195. [Google Scholar] [CrossRef]
  33. Lee, G.; Lee, H.W.; Lee, Y.S.; Choi, J.H.; Yang, J.E.; Lim, K.J.; Kim, J. The effect of reduced flow on downstream water systems due to the kumgangsan dam under dry conditions. Water 2019, 11, 739. [Google Scholar] [CrossRef]
  34. Lim, B.; Ki, B.; Choi, J.H. Evaluation of nutrient release from sediments of Artificial Lake. J. Environ. Eng. 2011, 137, 347–354. [Google Scholar] [CrossRef]
  35. Edinger, J.E.; Buchak, E.M. Numerical hydrodynamics of estuaries. In Estuarine and Wetland Processes with Emphasis on Modeling; Hamilton, P., Macdonald, K.B., Eds.; Plenum Press: New York, NY, USA, 1980; pp. 115–146. [Google Scholar]
  36. Edinger, J.E.; Buchak, E.M. Numerical waterbody dynamics and small computers. Proceeding of the ASCE 1985 Hydraulic Division Specialty Conference on Hydraulics and Hydrology in the Small Computer Age, American Society of Civil Engineers, Lake Buena Vista, FL, USA, 12–17 August 1985; pp. 705–710. [Google Scholar]
  37. Edinger, J.E.; Buchak, E.M.; Kolluru, V.S. Modeling flushing and mixing in a deep estuary. Water Air Soil Poll. 1998, 102, 345–353. [Google Scholar] [CrossRef]
  38. Camp, J.S.; LeBoeuf, E.J.; Abkowitz, M.D. Application of an enhanced spill management information system to inland waterways. J. Hazard. Mater. 2010, 175, 583–592. [Google Scholar] [CrossRef]
  39. Lee, H.W.; Park, S.S. A hydrodynamic modeling study to estimate the flushing rate in a large coastal embayment. J. Environ. Manag. 2013, 115, 278–286. [Google Scholar] [CrossRef]
  40. Na, E.H.; Park, S.S. A hydrodynamic modeling study to determine the optimum water intake location in Lake Paldang, Korea. J. Am. Water Resour. As. 2005, 41, 1315–1332. [Google Scholar] [CrossRef]
  41. Na, E.H.; Park, S.S. A hydrodynamic and water quality modeling study of spatial and temporal patterns of phytoplankton growth in a stratified lake with buoyant incoming flow. Ecol. Model. 2006, 199, 298–314. [Google Scholar] [CrossRef]
  42. Edinger, J.E. Waterbody hydrodynamic and water quality modeling. In An Introductory Workbook on Three Dimensional Water Body Hydrodynamics and Water Quality Modeling Including Modeling Software; ASCE Press: Reston, VA, USA, 2001. [Google Scholar]
  43. Ki, B.-M.; Huh, I.A.; Choi, J.H.; Cho, K.S. Relationship of nutrient dynamics and bacterial community structure at the water-sediment interface using a benthic chamber experiment. J. Environ. Sci. Health A 2018, 53, 482–491. [Google Scholar] [CrossRef]
  44. Jiang, X.; Jin, X.; Yao, Y.; Li, L.; Wu, F. Effects of biological activity, light, temperature and oxygen on phosphorus release processes at the sediment and water interface of Taihu Lake, China. Water Res. 2008, 42, 2251–2259. [Google Scholar] [CrossRef]
  45. Youn, S.T.; Koh, Y.K.; Ryu, S.O. Distribution characteristics of surface sediments and metal elements in Hampyong Bay, the southwestern coast of Korea. J. Environ. Sci. Int. 1999, 8, 677–684. [Google Scholar]
  46. Tina, M.-W.; Twilley, R.R. Theory and operation of continuous flow systems for the study of benthic-pelagic coupling. Mar. Ecol. Prog. Ser. 1996, 140, 257–269. [Google Scholar] [Green Version]
  47. Shim, J.H.; Kang, Y.C.; Choi, J.W. Chemical fluxes at the sediment-water interface below marine fish cages on the coastal waters off Tong-young, south coast of Korea. Sea 1997, 2, 151–159. [Google Scholar]
  48. Jeong, H.-Y.; Jo, K.-J. SOD and inorganic nutrient fluxes from sediment in the downstream of the Nakdong River. Korean J. Limnol. 2003, 36, 322–335. [Google Scholar]
  49. Kim, D.-H.; Park, C.-K. Estimation of nutrients released from sediments of Deukryang Bay. J. Korean Environ. Sci. Soc. 1998, 7, 425–431. [Google Scholar]
  50. McKee, T.B.; Doesken, N.J.; Kleist, J. The relationship of drought frequency and duration to time scale. In Proceedings of the Eighth Conference on Applied Climatology; American Meteorological Society: Boston, MA, USA, 1993; pp. 179–184. [Google Scholar]
  51. Ambrose, R.B.; Wool, T.A.; Matrin, J.L. The Water Quality Analysis Simulation Program, WASP5. Part A: Model Documentation, Version 5.10.; U.S. Environmental Protection Agency: Athens, GA, USA, 1993.
  52. Bowie, G.L.; Mills, W.B.; Porcella, D.B.; Campbell, C.L.; Pagenkopt, J.R.; Rupp, G.L.; Johnson, K.M.; Chan, P.W.H.; Gherini, S.A. Rates, Constants and Kinetics Formulation in Surface Water Quality Modeling, 2nd ed.; U.S. Environmental Protection Agency: Athens, GA, USA, 1985; p. 475.
  53. Chapra, S.C. Surface Water-Quality Modeling; McGraw-Hill: New York, NY, USA, 1997; p. 844. [Google Scholar]
  54. Thomann, R.V.; Mueller, J.A. Principle of Surface Water Quality Modeling and Control; Harper Collins Publishers: New York, NY, USA, 1987; p. 644. [Google Scholar]
  55. WDOE (State of Washington Department of Environment). Comprehensive Circulation and Water Quality Study at Budd Inlet, Southern Puget Sound Water Quality Assessment Study; URS Corporation for the Washington State Department of Ecology: Washington, DC, USA, 1986; p. 275.
  56. Vollenweider, R.A.; Kerekes, J.J. Eutrophication of Waters: Monitoring, Assessment and Control; Organization for Economic Cooperation and Development: Paris, France, 1982; p. 156. [Google Scholar]
  57. Cralson, R.E. A trophic state index for lakes. Limnol. Oceanogr. 1977, 22, 361. [Google Scholar] [CrossRef]
Figure 1. Representation of model boundary (Chunchoen Dam, Soyanggang Dam, Gonggicheon, STP, six tributaries (T1–T6), two intake stations, and Euiam Dam release) and the monitoring locations (St. 1, 2, and 3) in the study area.
Water 11 01409 g001
Figure 2. Major water quality interactions in WQDPM.
Water 11 01409 g002
Figure 3. Comparison of nutrient release flux ranges in this experiment and previous studies. (a) PO43− flux (mg P m−2 d−1); (b) NH4+ flux (mg N m−2 d−1); (c) NO3 flux (mg N m−2 d−1).
Water 11 01409 g003
Figure 4. Comparison of observed and simulated temperature and conductivity for calibration (2013) and verification (2014) at (a) St.1, (b) St.2, and (c) St.3.
Water 11 01409 g004
Figure 5. Comparison of observed and simulated water quality for calibration (2013) and verification (2014) at St. 1.
Water 11 01409 g005
Figure 6. Comparison of observed and simulated water quality for calibration (2013) and verification (2014) at St. 2.
Water 11 01409 g006
Figure 7. Comparison of observed and simulated water quality for calibration (2013) and verification (2014) at St. 3.
Water 11 01409 g007
Figure 8. Sensitivity analysis results of seasonal total phosphorus (TP) concentration.
Water 11 01409 g008
Figure 9. Sensitivity analysis results of seasonal Chl-a concentration.
Water 11 01409 g009
Figure 10. Annual changes in the TP and Chl-a concentrations and assessment of water quality affected by sediment flux.
Water 11 01409 g010
Table 1. Values of major model coefficients used in the WQDPM for Euiam Lake.
DescriptionSymbolUnitRangeValue
Phytoplankton
Maximum growth rateK1cday−10.01–4.02.5
Death rateK1Dday−10.015–0.20.015
Endogenous respiration at 20 °CK1Rday−10.05–0.200.1
Half-saturation constant for nitrogenKmNmgN m−310–2013
Half-saturation constant for phosphorusKmPmgP m−31–21
Settling velocity of phytoplanktonVs4m day−10.05–0.50.05
Nitrogen and phosphorus
Nitrification rateK12day−10.09–0.130.11
Denitrification rate at 20 °CK2Dday−10.090.09
Organic nitrogen mineralization rateK71day−10.01–0.150.15
Dissolved organic phosphorus mineralization rate at 20 °CK83day−10.1–0.30.3
Settling velocity of particulate organic nitrogenVs7m day−10.05–0.50.18
Settling velocity of particulate organic phosphorusVs8m day−10.05–0.50.05
CBODand DO
Deoxygenation rate at 20 °CKdday−10.02–0.200.05
Settling velocity of particulate CBODVs5m day−10.05–0.50.05
Table 2. Calibration and verification statistics of temperature, conductivity, and water quality model.
ParameterTemperatureConductivityBODDO
RMSE (℃)MAPE (%)NSERMSE (μs cm−1)MAPE (%)NSERMSE (mg L−1)MAPE (%)NSERMSE (mg L−1)MAPE (%)NSE
2013St.10.3720.00.882.3514.90.180.1571.20.030.2211.90.42
St.20.4410.30.964.419.50.310.1442.20.240.4611.80.72
St.30.376.50.987.2116.90.670.2154.80.630.5010.30.45
2014St.10.3921.40.873.1921.50.060.1860.8−1.150.2913.00.15
St.20.377.50.985.6415.30.270.1640.40.080.245.90.66
St.30.366.40.974.6011.10.570.2742.80.210.317.30.57
ParameterTNTPChl-aTSS
RMSE (mg L−1)MAPE (%)NSERMSE (mg L−1)MAPE (%)NSERMSE (μg L−1)MAPE (%)NSERMSE (mg L−1)MAPE (%)NSE
2013St.10.0513.60.130.00388.50.150.8851.70.060.6111.90.36
St.20.079.60.030.00351.30.820.4224.80.790.9354.20.66
St.30.088.90.510.00565.60.131.9337.50.440.4621.50.37
2014St.10.0516.20.200.00245.60.050.6259.2−1.770.1942.1−0.02
St.20.1418.30.100.00248.30.390.6940.60.180.2841.60.39
St.30.1915.30.320.00238.80.381.3244.60.150.2472.30.77