1. Introduction
Flood disaster is one of the most dangerous natural disasters. In recent years, the management of large rivers has tended to be perfect. However, many small- and medium-sized river basins have not received enough attention in flood control, and hydrological workers cannot issue flood warnings of small- and medium-sized river basins timely. According to incomplete statistics, there are more than 50,000 small- and medium-sized river basins in China, and 85% of the cities are located along the coast of these river basins. The frequent abnormal climate and extreme weather conditions have brought tremendous pressure to flood control in small- and medium-sized river basins these years. Therefore, it is urgent to control flood in small- and medium-sized watersheds. However, many small- and medium-sized watersheds lack corresponding hydrological data, they cannot carry out hydrological analysis, which leads to great difficulties in the management of these watersheds [
1]. In hydrology, hydrological analysis is accomplished by parameter transplantation. The first step of parameter transplantation is analyzing the similarity of these unknown watersheds to find similar watersheds [
2]. Therefore, it is very important to select appropriate and accurate similar watersheds.
Many hydrological scholars have studied basin similarity analysis. Considering that the differences in spatial distribution of some elements in different watersheds will eventually lead to different hydrological characteristics, Wood and Hebson [
3] first proposed the concept of watershed hydrological similarity. Merz et al. [
4] first used attribute similarity method to find similar river basins in order to complete parameter transplantation between similar watersheds in 2004. Young et al. [
5] chose to use distance nearest algorithm for watershed similarity analysis. In 2006, Young et al. carried out a similarity analysis on 260 UK Watersheds with a distance nearest algorithm. Through the analysis of similar watersheds, the parameters of the missing data watersheds were transplanted. Finally, the accuracy of the similar watersheds was verified according to the transplanted results. Zhang and Chiew [
6] consulted the ideas of the former two methods and combined the distance nearest method with the attribute similarity method, which improves the accuracy of watershed similarity analysis. Considering that the concept of watershed similarity is not clearly defined and bounded, we can consider the concept of watershed similarity to be a fuzzy concept. Therefore, Shouyu Chen [
7] proposed the use of fuzzy set method to establish a similar watershed selection model and find similar watersheds. Yaya Song proposed a similar watershed optimization algorithm based on fuzzy weighted recognition model [
8]. In order to minimize the uncertainty in the optimization of hydrological similar watersheds, Ming Zhang [
9] created a maximum entropy optimization model in 2012 by studying the ambiguity and difference in the importance and comprehensive values of the similarity indicators of the data. Li Qisong [
10] and Fan Mengge [
11] combined Principal Component Analysis (PCA), cluster analysis, and watershed similarity again in 2012 and 2015, respectively. Among them, Fan [
11] put forward that the hydrological similar determinants such as multi-year maximum flood peak and flood volume analysis of similar basins should be used to verify the results of similar basin analysis.
Although there have been many related studies, there are still many problems in similarity analysis of small- and medium-sized watersheds. Nowadays, the analysis and determination of similar watersheds basically depends on the artificial decision of hydrological experts. There are many impersonal and inaccurate situations in this way. At present, there is no similar analysis method for small- and medium-sized watersheds, especially clustering ensemble method. Due to the data of small- and medium-sized watersheds often having more characteristic dimensions, the existing watershed similarity analysis methods may not achieve ideal results for such high-dimensional and complex data sets. Therefore, we make full use of the geographical data and hydrological data of small- and medium-sized watersheds and use data mining technology to study and analyze watershed similarity. This paper puts forward a similarity analysis method of small- and medium-sized watershed based on clustering ensemble. The contributions of this paper are as follows:
- (1)
This paper proposes a novel cluster ensemble model to analyze the similarity problem of small- and medium-sized watersheds.
- (2)
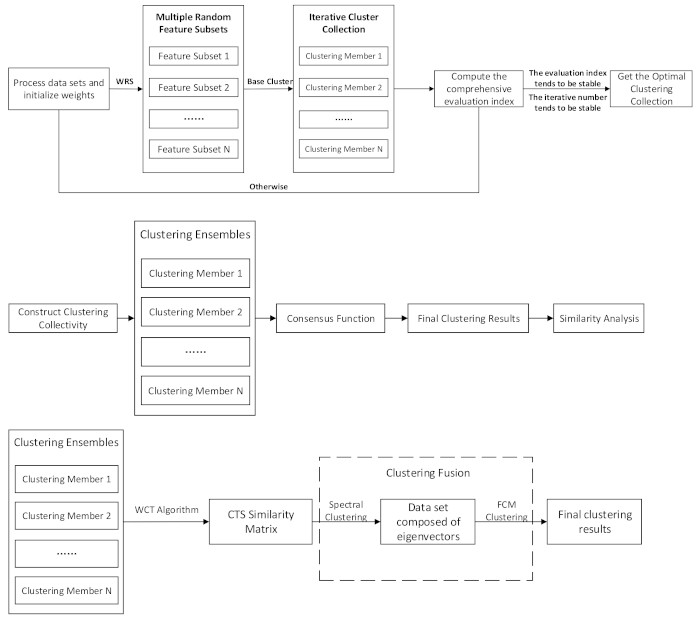
For small- and medium-sized watershed data, we propose an iterative clustering collective construction algorithm based on weighted random sampling (WRS-CCE) to construct clustering groups with high clustering quality and difference.
- (3)
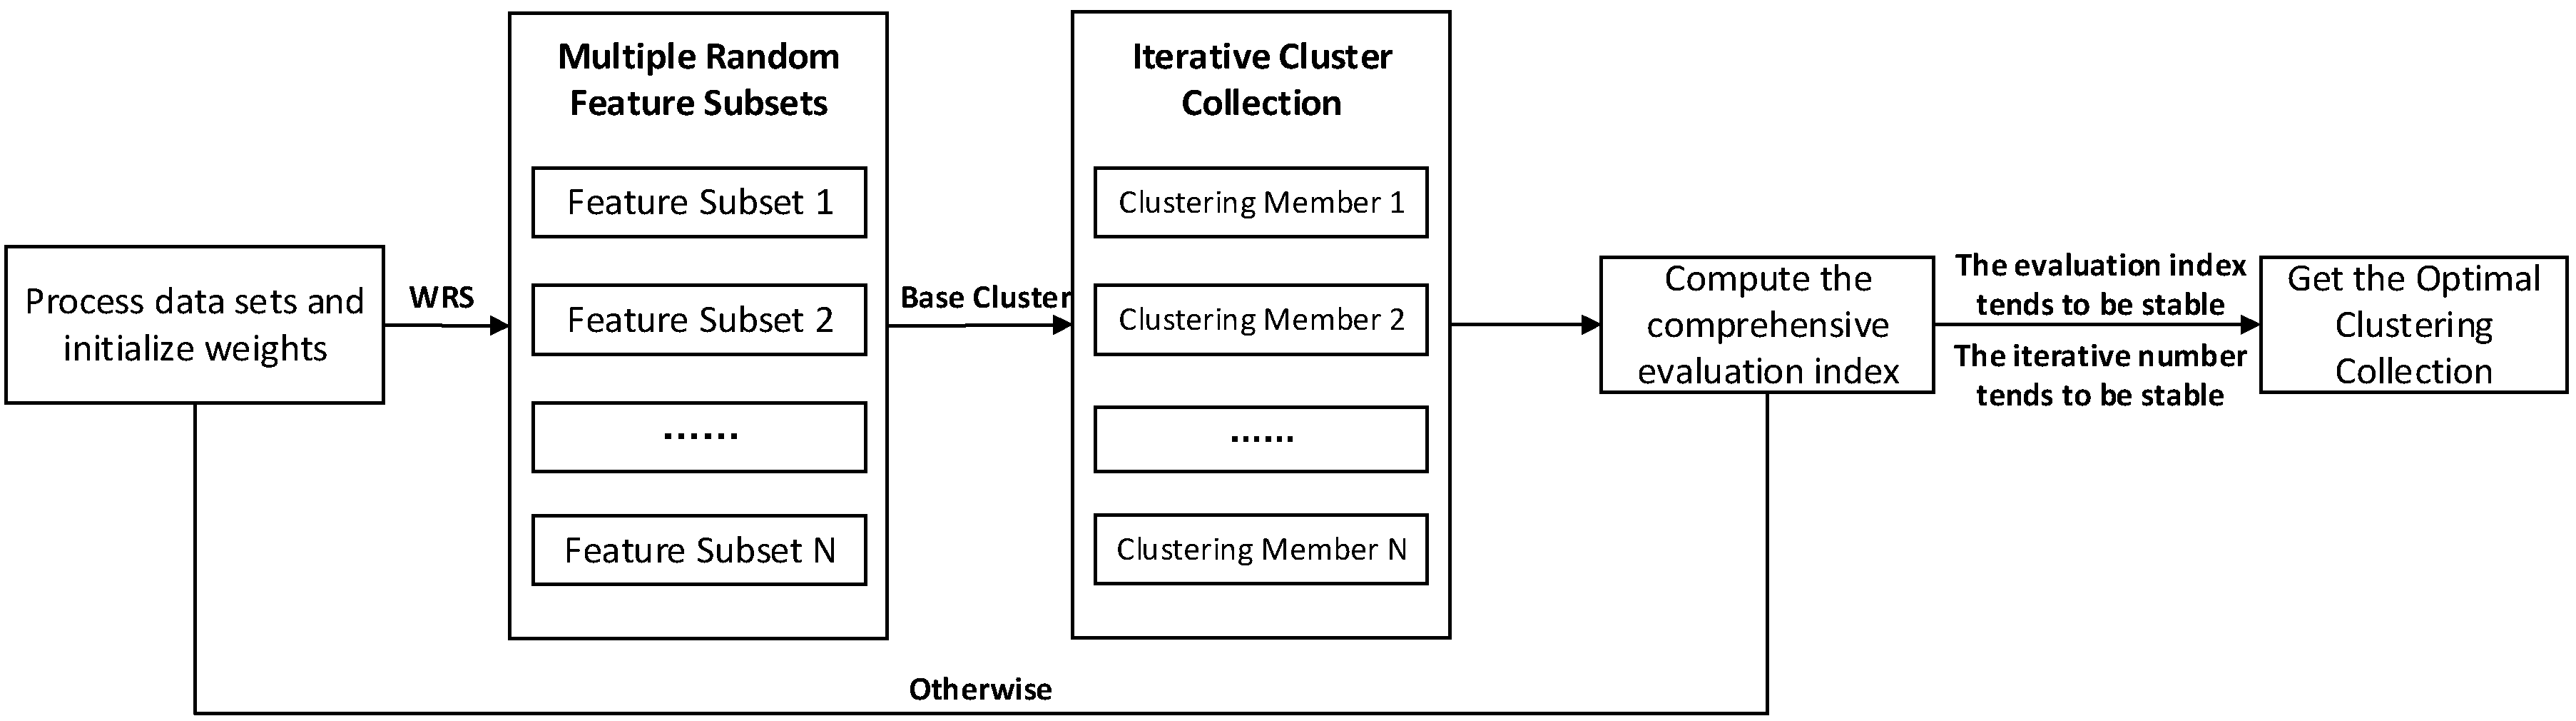
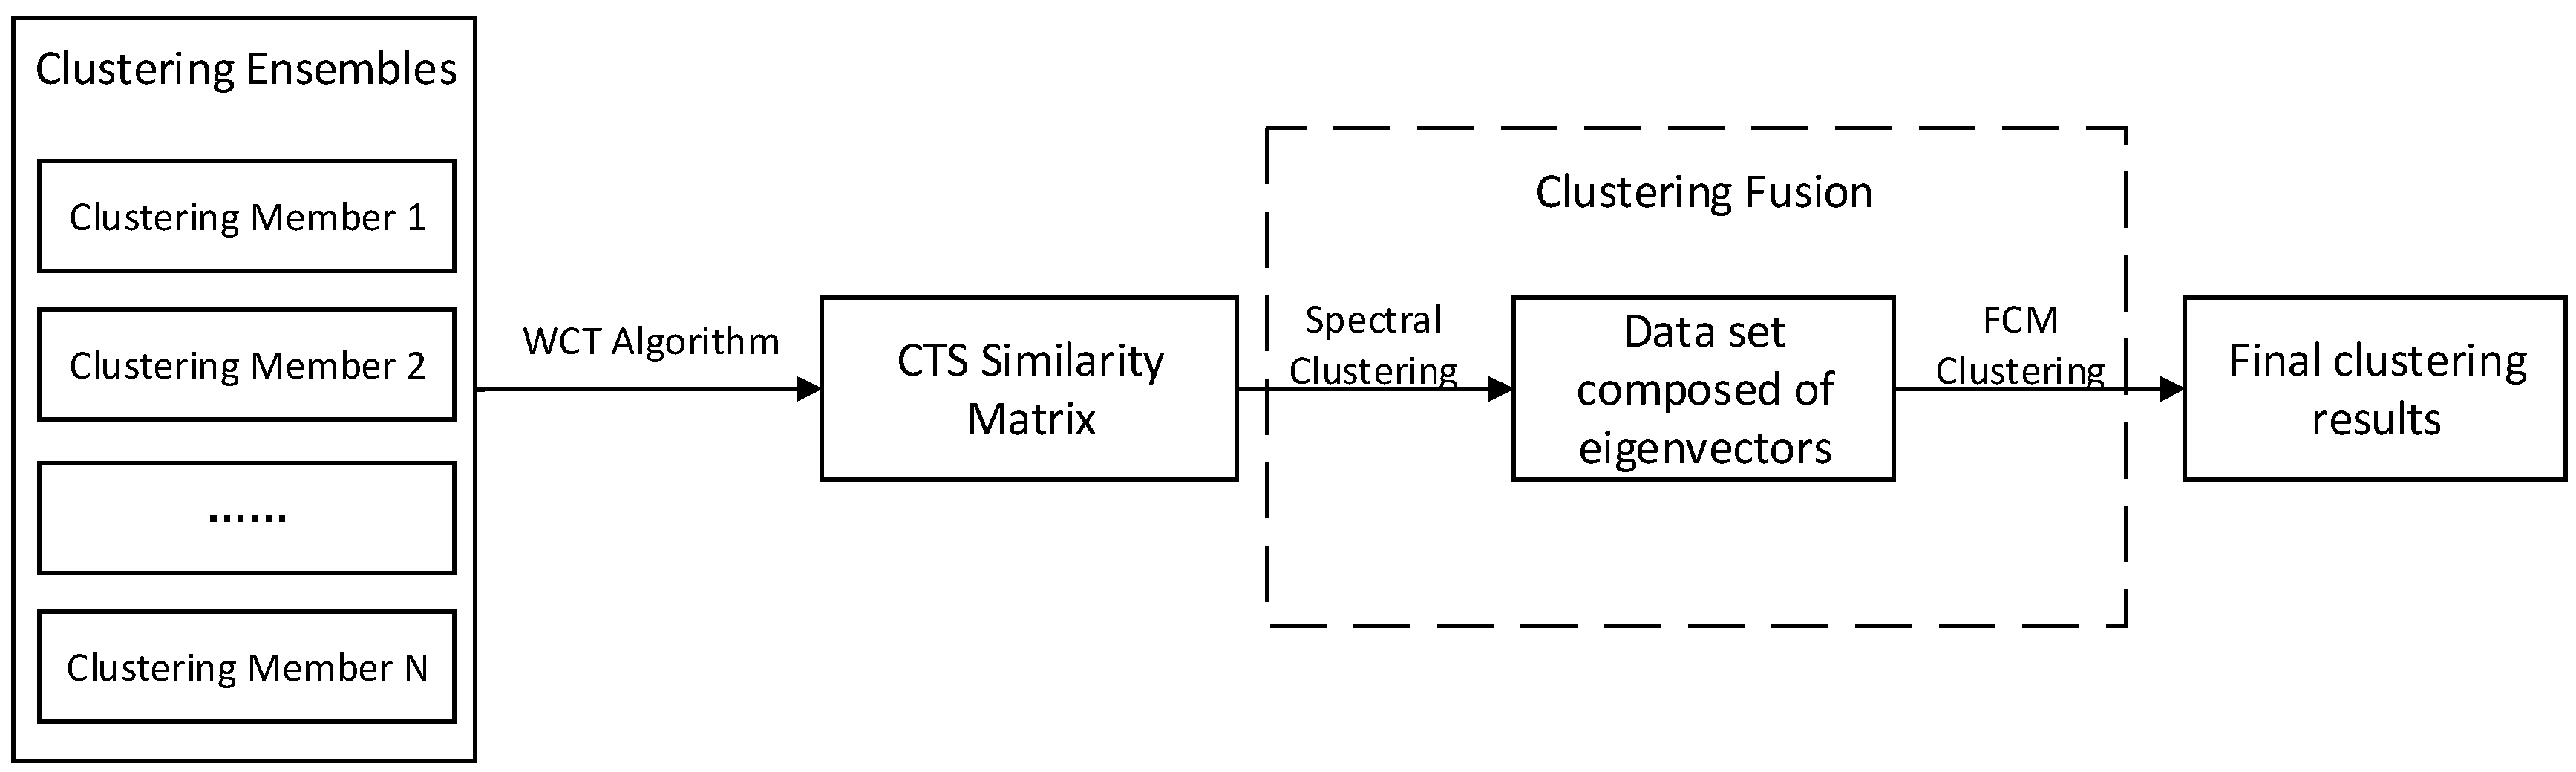
For small- and medium-sized watershed clustering groups, we design the corresponding consensus function. We use the connected triple similarity matrix (CTS) as the input matrix of spectral clustering algorithm and combine it with fuzzy C-means (FCM) method to get the final clustering results.
- (4)
A comprehensive evaluation index (OCQ-NMI) based on quality and diversity is proposed to screen clusters with high quality and diversity in multiple iterations.
The structure of this paper is as follows:
Section 2 introduces the basic theories;
Section 3 describes the model scheme based on clustering ensemble;
Section 4 carries out experimental analysis;
Section 5 summarizes the conclusions.
4. Experiment and Analysis
Small and medium watershed-sized datasets: Generally, the watershed with a drainage area of less than 1 square kilometer is a small and medium watershed, while the water conservancy department in China stipulates that the watershed with a drainage area of less than 50 square kilometers is a small and medium watershed [
1].
This paper uses the Digital Elevation Models (DEM) data of Jiangxi as the original data, the resolution is 90 m, with 6708 rows and 5889 columns, totaling nearly 40 million grid cells, and its geographic longitude and latitude range is 24.488927–30.079224 in the north latitude and 113.575079–118.482839 in the East longitude.
Firstly, according to the screening criteria stipulated by the Ministry of Water Resources in China, the small- and medium-sized watersheds with catchment area less than 50 square kilometers are selected from the DEM data, and then according to the 27 evaluation indicators (
Table 1) proposed in
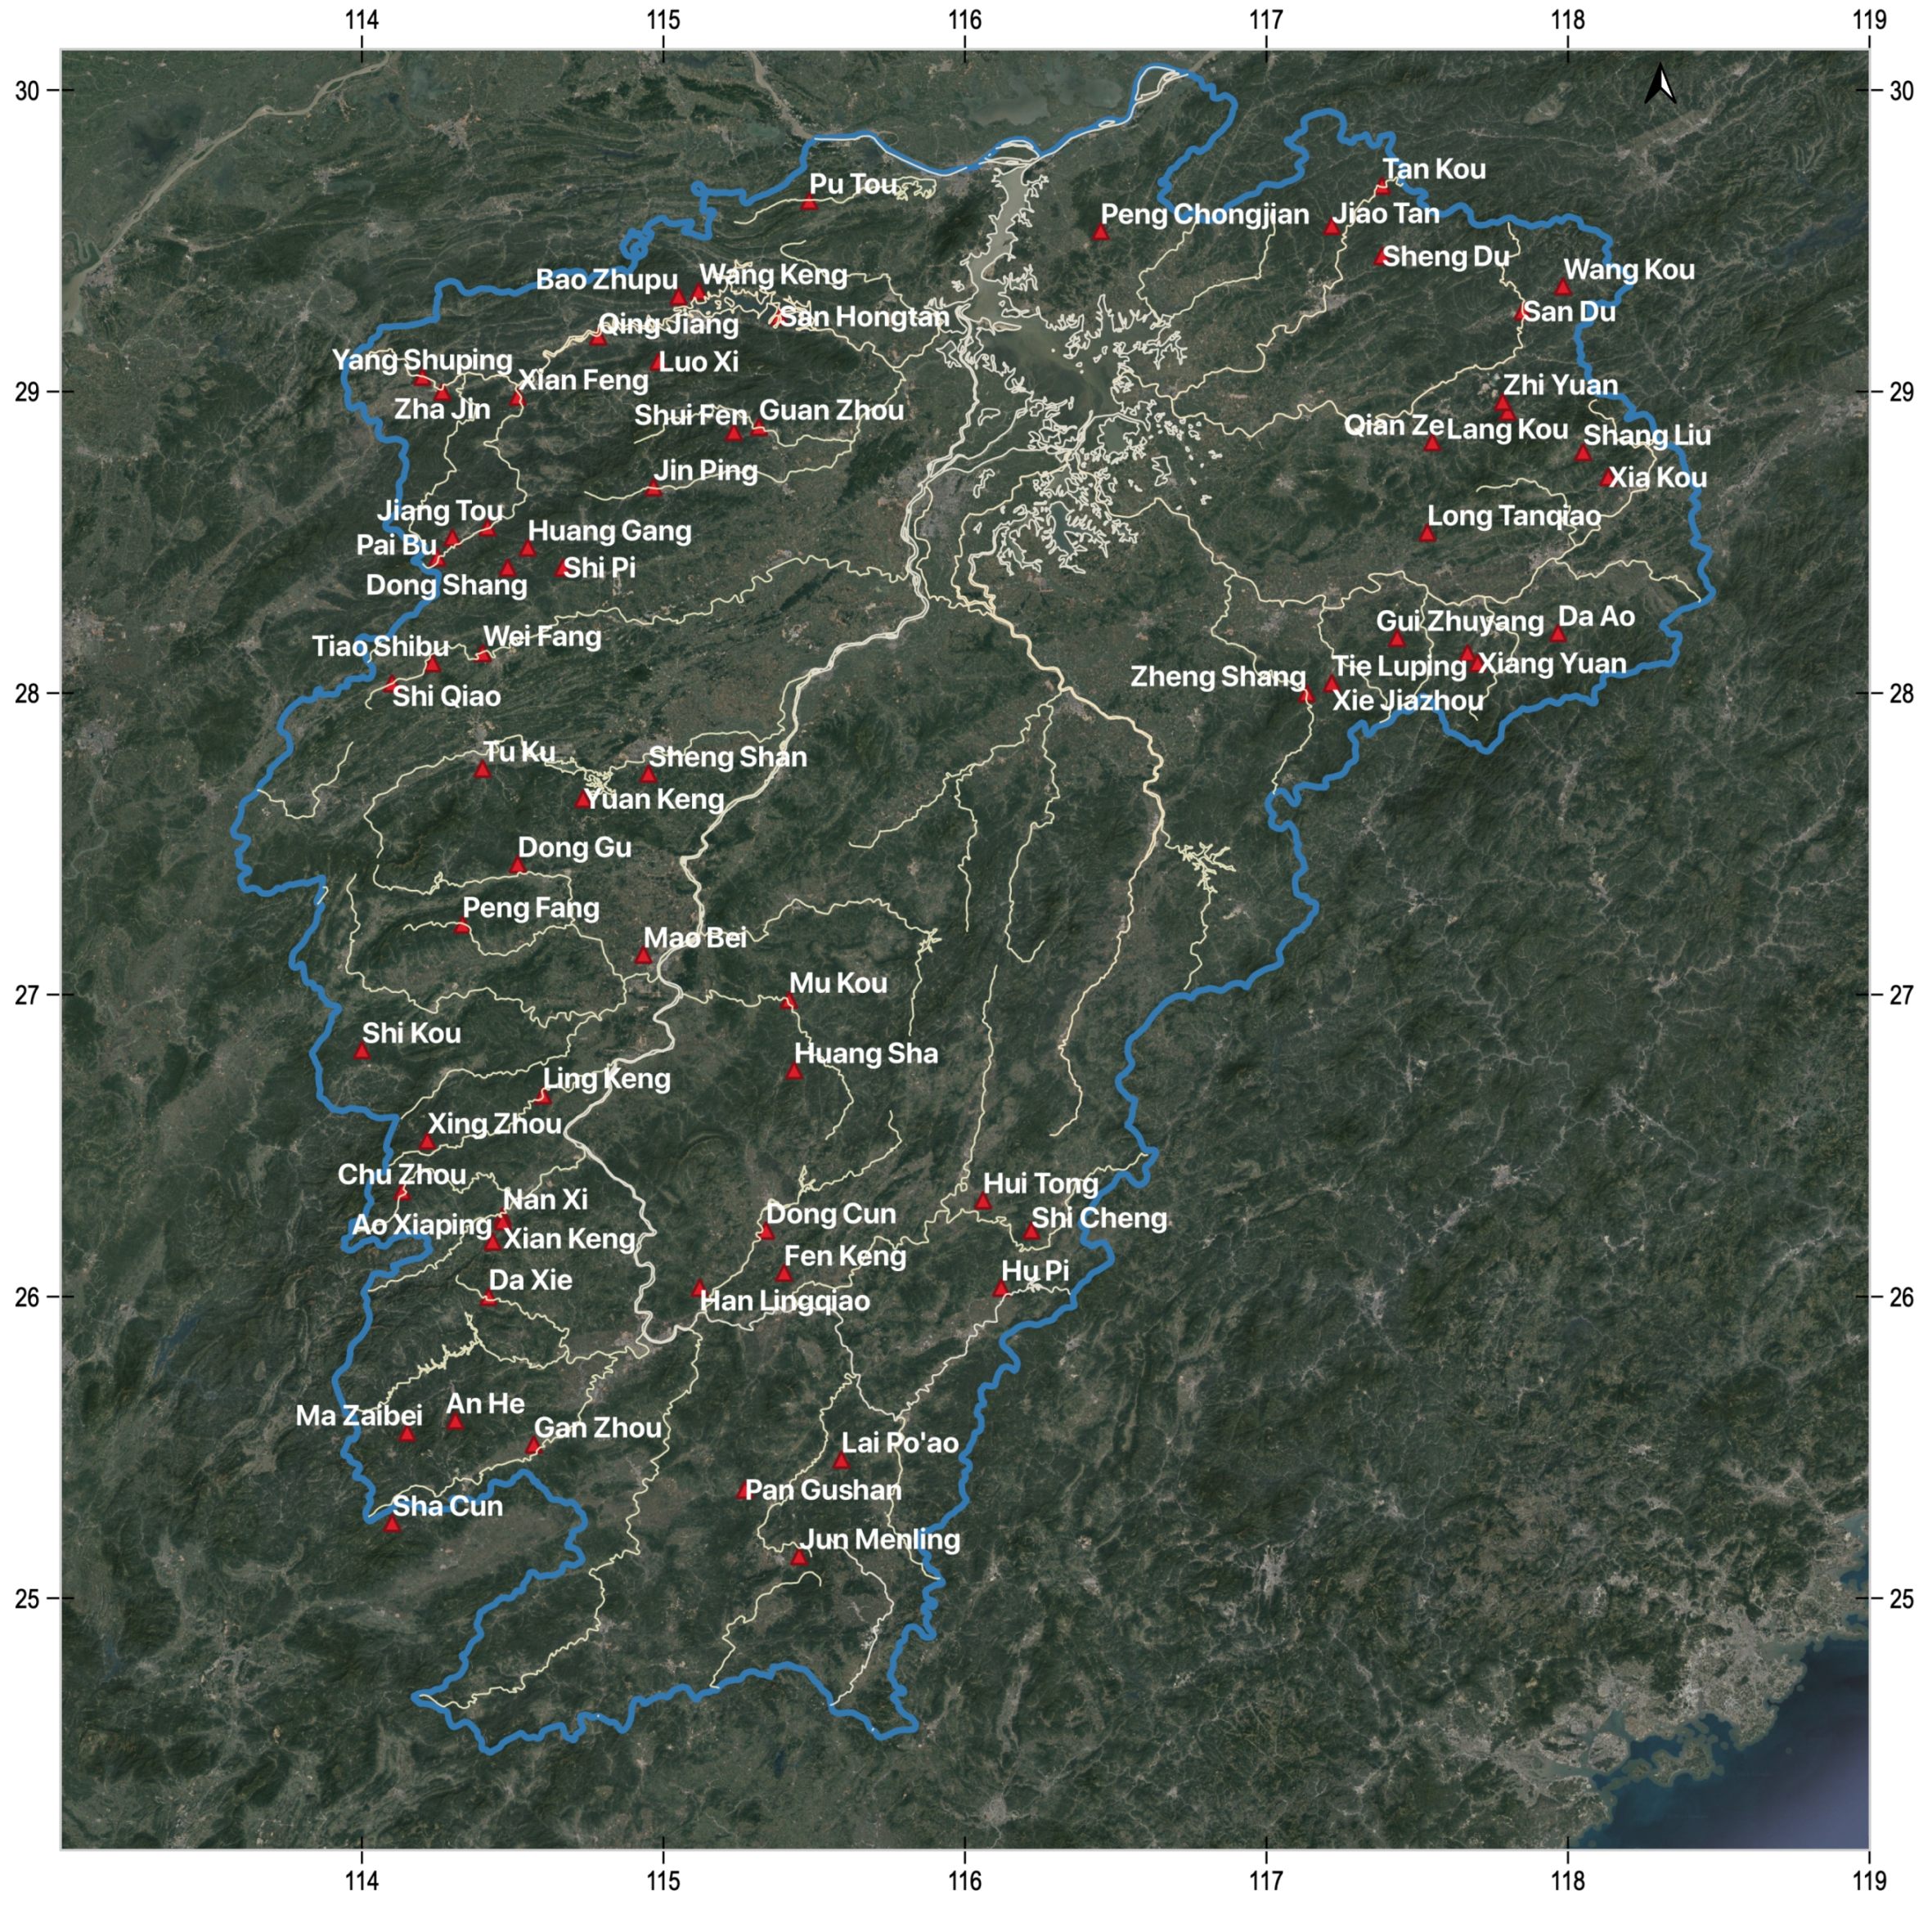
Section 2.1, we select 69 small- and medium-sized watersheds (
Figure 5) with complete data from the hydrological database. Since the data set contains 69 watersheds and 27 characteristic indexes, the size of the data set is
Considering that the magnitudes of the various feature indicators in the data set are too different, the dataset is selected to be normalized. The data of each dimension is processed to the same magnitude, and finally the
small and medium watershed dataset which can be directly used in the small and medium watershed similarity analysis experiment is obtained.
We conduct two groups of experiments. The first group of experiments is to construct clustering collectives, including several groups of comparative experiments. The second group of experiments is to carry out cluster fusion, including the construction of similarity matrix and similarity analysis.
Experiment 1: Construct Clustering Collectives
(1) Comparison of and
First, we generate clustering groups by the traditional clustering ensemble generation algorithm based on and , aiming to illustrate the superiority of in the small and medium watershed datasets.
The specific content is to call and multiple times on the input data set to obtain multiple clustering results. These clustering results are cluster members, which together form a clustering group. Then, the obtained clustering ensemble use evaluation indexes are calculated and compared. Considering that and will result in different results due to the random selection of the initial center point, the comparison is made here by averaging after multiple experiments. The specific parameters of the algorithm are as follows:
Input data: data collection of small and medium watersheds in Jiangxi Province;
Number of cluster members I: 10;
Experiment according to the above parameter settings, and the final result is shown in
Table 2:
From the
Table 2, we can see that when
is used as the basic clustering algorithm, the clustering quality of the generated cluster members is better. It is because that the small- and medium-sized watershed data set used as the experimental input contains some noise points. We verify that the 27-dimensional small and medium watershed data set is reduced to a two-dimensional data set and then mapped to the map through MDS. For details, see
Figure 6 below. This experiment can explain that the special performance of
not affected by noise points improves the clustering quality of each cluster member in the clustering ensemble to some extent.
Since the center point of
is selected from the points in the dataset, it can be seen from the
Table 2 that the difference between cluster members finally generated by the
algorithm is much smaller than that obtained by
and the OCQ-NMI index obtained by the traditional algorithm based on
is slightly lower than that based on
. However, we need to find a method which can get results with high clustering quality and not affected by noise points to improve the clustering group quality. So, we choose
algorithm. Aiming at the difference between cluster members, the method of constructing feature subsets by random sampling can effectively increase the difference among cluster members in the cluster group.
(2) Comparison of different clustering group construction algorithm
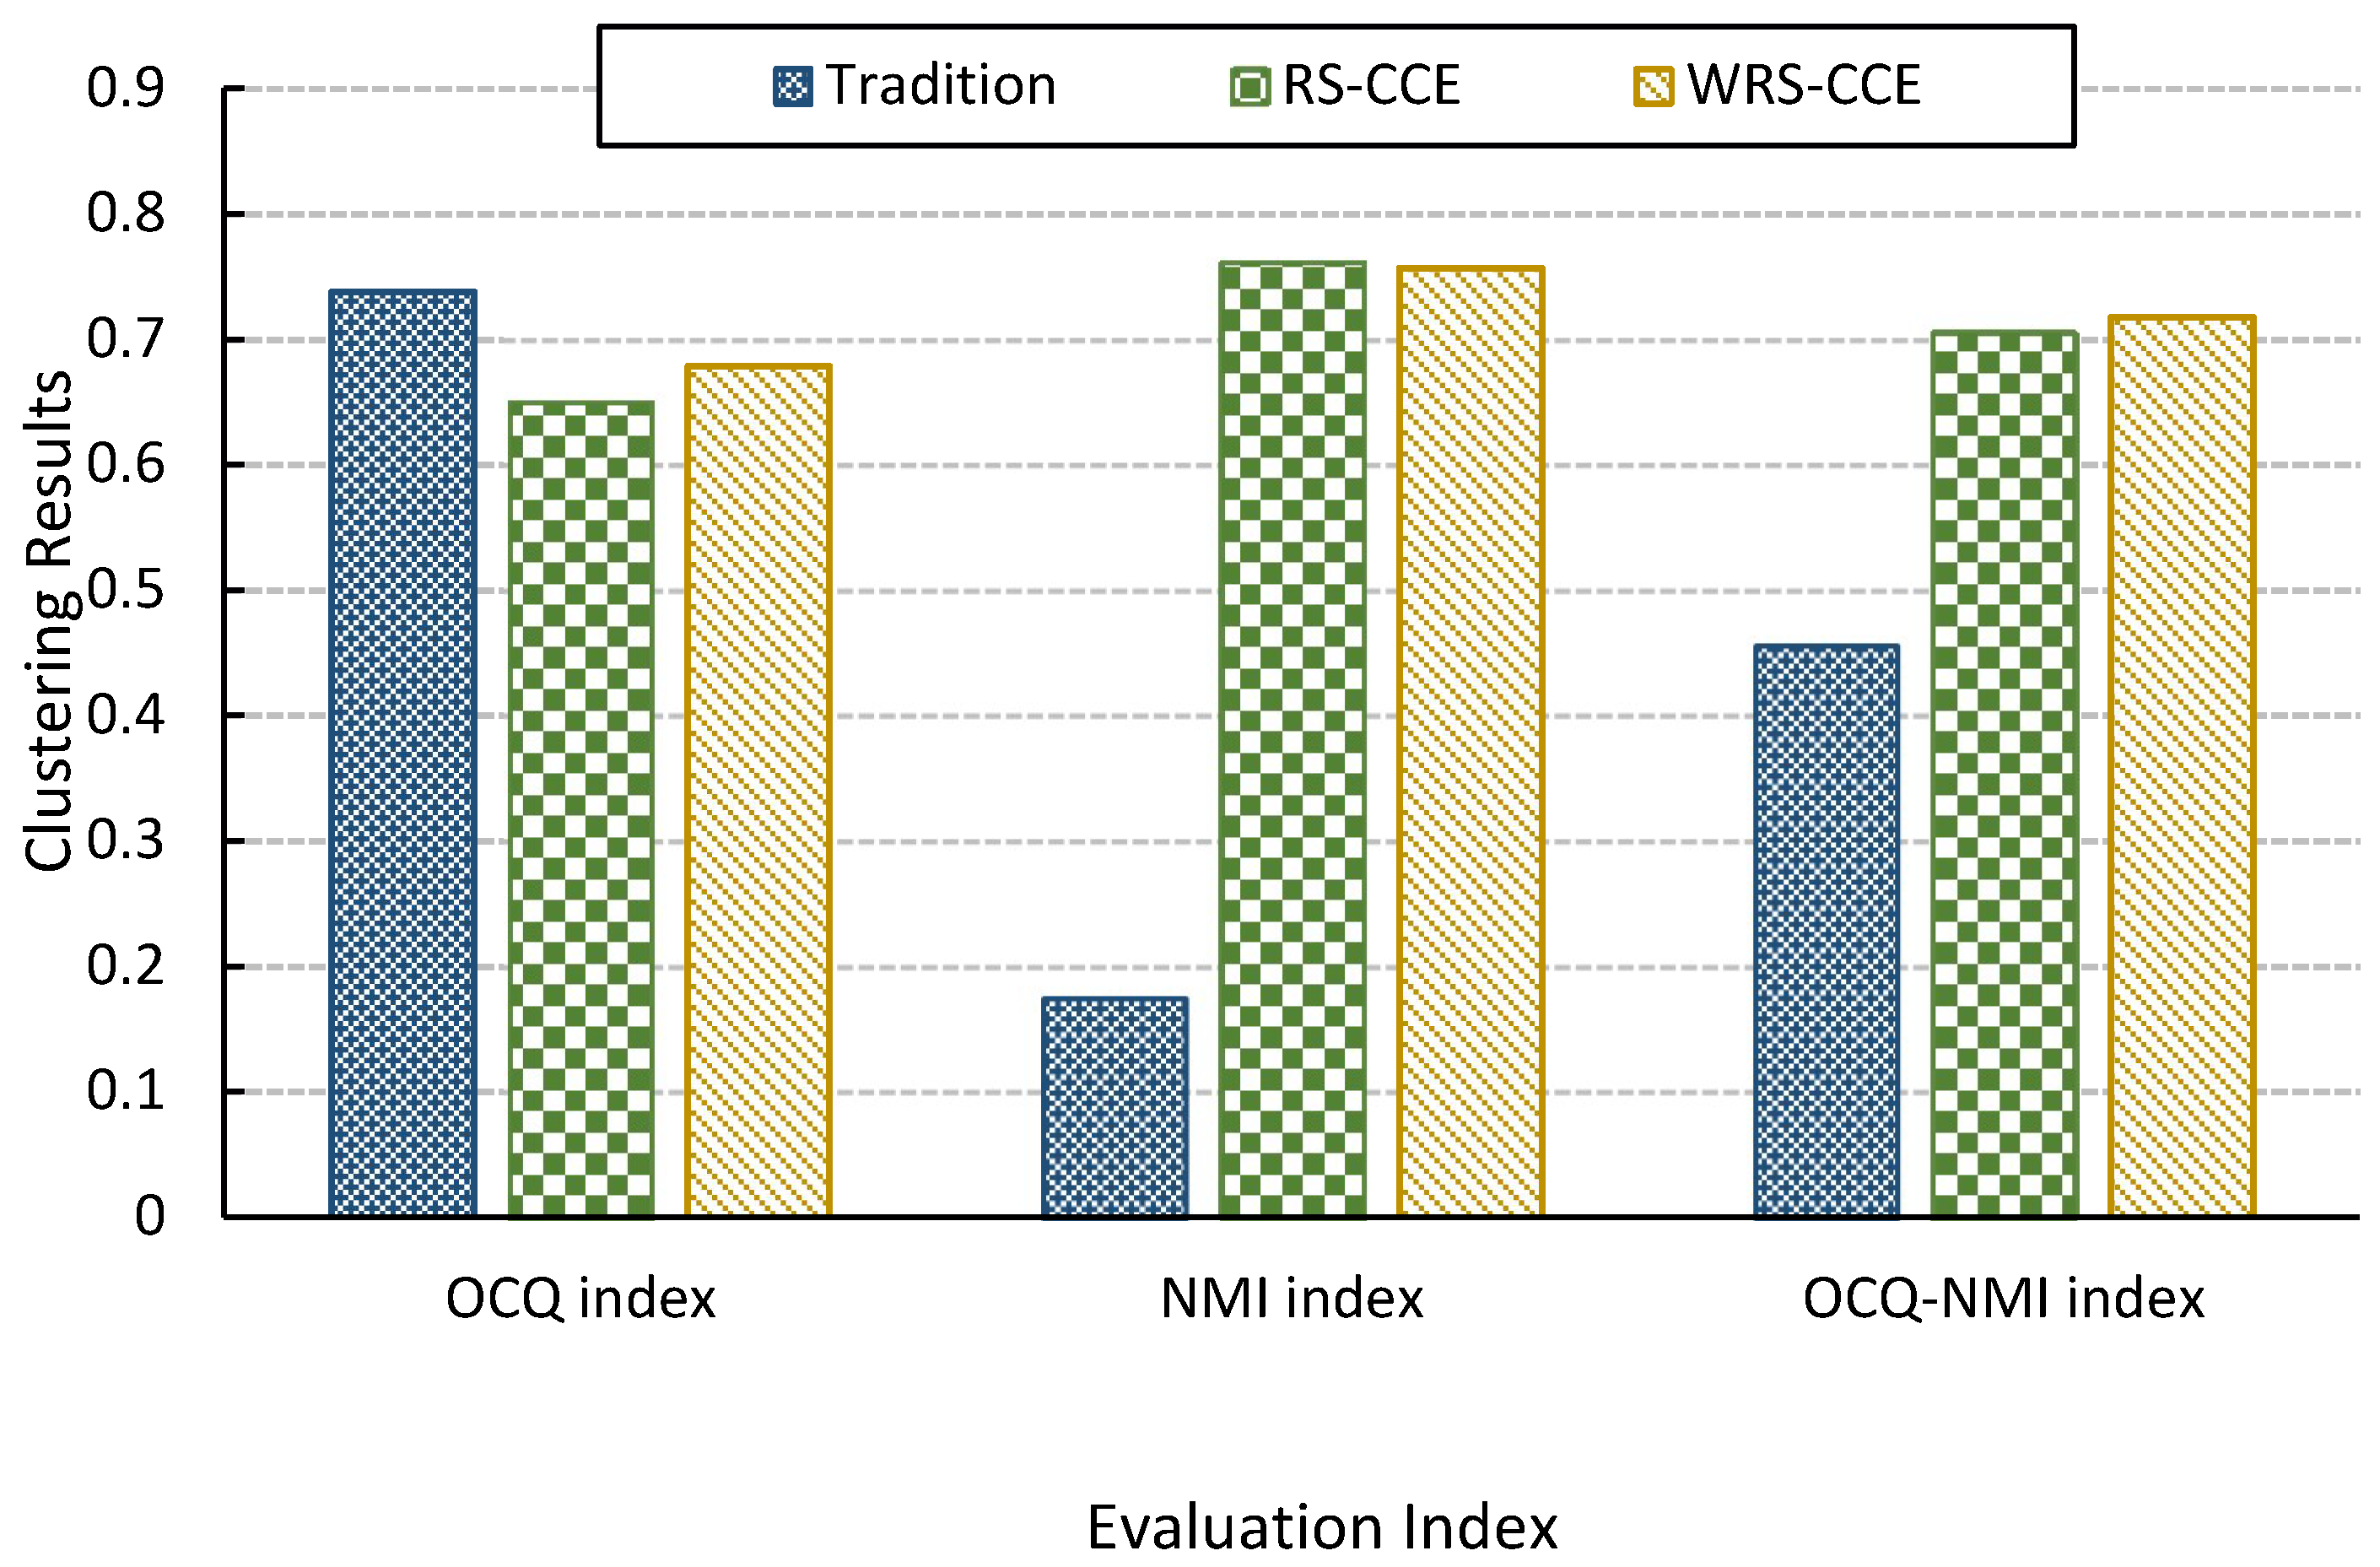
In the case of basic clustering using , the traditional clustering construction method, constructing clustering ensembles by random sampling (RS-CCE) and WRS-CCE are used to construct the clustering group, and several evaluation indicators are used to compare the clustering effects. The specific parameters are as follows:
Input data: . data collection of small and medium watersheds in Jiangxi Province;
Number of cluster members I: 10;
Number of iterations S: 1000;
Experiment according to the above parameter settings, and the final result is shown in
Figure 7:
According to the experimental results in
Figure 7, it can be seen that the comprehensive evaluation index of the clustering group constructed by the traditional construction method is very low because the difference index is too low, that is, the cluster members in the clustering group are too similar. It is because the method always takes the complete data set as input and cannot maintain the difference of the input data. The second reason is that the algorithmic nature of
leads to a decrease in the difference. The RS-CCE will form a diversity feature subset by randomly selecting the feature indicators of the complete data set, and use it as an input data set to improve the difference between each cluster member in the cluster group. Although the quality of the cluster has decreased due to the lack of dimensions, the comprehensive quality of the clustering ensemble has been greatly improved from the comprehensive indicators. However, the RS-CCE randomly selects the feature subsets, so it is difficult to guarantee the stability of the clustering ensemble quality. The clustering collective generated by the WRS-CCE algorithm in this paper is slightly higher than the clustering group generated by the RS-CCE algorithm, but the difference is slightly lower. The reason is that WRS reduces the probability of selecting feature indicators which have bad effects on clustering and ensures the stability of cluster member quality. However, it also reduces the diversity of feature subsets and the differences between cluster members.
It can be seen from
Figure 8 that the comprehensive index of the clustering ensemble generated by the RS-CCE algorithm will generate many peaks, and the fluctuations are very large. After iterations are repeated many times, it may still be in an unstable state. It is necessary to complete all iterations before ending the iteration, the clustering efficiency is low. The WRS-CCE algorithm achieves a large value and tends to be stable after the number of iterations reaches 100. The reason is that the algorithm quickly ends the iteration by dynamically updating the feature index weights and reducing the probability that the feature indicators that have bad effects on the cluster are selected. Therefore, it can be concluded that the clustering efficiency of WRS-CCE is much higher than that of RS-CCE.
Experiment 2: Carry Out Clustering Fusion
(1) Comparison of different similarity matrix
This experiment processes the clustering groups based on the small- and medium-sized watershed dataset and generates the clustering cross-correlation matrix and CTS matrix respectively. It is intended to illustrate that the CTS matrix can reflect the similarities between data points to a greater extent than the cross-correlation matrix. The specific parameters of the experiment are as follows:
Input data: use the clustering groups based on the small and medium watershed data set of Jiangxi Province in Experiment 1;
The cross-correlation degree of the input data is calculated to obtain the cross-correlation matrix of the clustering ensemble. The partial results of the matrix are shown in
Table 3:
Input data: clustering groups based on the data set of small- and medium-sized watersheds in Jiangxi Province;
The input data is calculated by using the WCT algorithm to obtain the CTS matrix of the cluster. The partial results of the matrix are shown in
Table 4:
According to the experimental results, it can be compared that the values in the CTS matrix are all larger than the values in the cross-correlation matrix, so that it can be verified that the CTS matrix does find the hidden relationship between the data points, that is, the degree of similarity between the data points is enhanced. Therefore, this paper chooses CTS matrix as the clustering similarity matrix and uses it as the input matrix of SC-FCM clustering fusion algorithm.
(2) Comparison of different clustering fusion algorithm
The experiment was carried out by direct FCM clustering experiment and SC-FCM clustering fusion experiment, and the results of two clustering experiments were analyzed to show that clustering integration can be more accurate than direct clustering method. It can find similar watersheds accurately in the design basin, make specific comparisons and analysis of the similarity of the basin. The specific parameters of the experiment are as follows:
Input data: data collection of small and medium watersheds in Jiangxi Province;
According to the above input data, the experiment is directly performed using the FCM clustering algorithm, and the final results are shown in
Table 5:
Input data: use the CTS matrix obtained in above experiment;
According to the above input data, the SC-FCM clustering fusion algorithm was used for the experiment. The final results are shown in
Table 6:
According to some data in
Table 5 and
Table 6, it can be seen that among the clustering results directly using FCM clustering, Mukou Station and Xianfeng Station have a high degree of membership belong to the same cluster (cluster 7), while the Sandu station has a low degree of membership in cluster 7. Among the clustering results after SC-FCM clustering, Mukou Station, Xianfeng Station, and Sandu Station belong to the same cluster (cluster 2), which means that Mukou Station, Xianfeng Station, and Sandu Station are likely to be similar.
In the literature [
11], Fan Mengge proposed that if the two-year maximum flood peak and flood volume of the two stations are within 10%, they can basically be considered similar. Therefore, this paper uses this method of multi-year peak and flood comparison analysis to verify the similar situation with Mukou Station, Xianfeng Station and Sandu Station.
Table 7 shows the comparison of the maximum flood peak flow and the maximum floods in 1, 3, 6, and 12 h of Mukou, Xianfeng, and Sandu stations.
It can be concluded from the above table that the gap between the flood peak and the flood volume of Sandu Station and Mukou Station is similar to that of Xianfeng Station and Mukou Station, almost within 10%. Therefore, it can be considered that Sandu Station and Mukou Station are similar, that is, the watershed where Sandu Station is located is also a similar watershed in the basin where Mukou Station is located, which proves that the similarity analysis of small and medium watersheds based on clustering integration can more accurately find similar watersheds in the design basin.
Secondly, the gap between the Sandu Station and the Mukou Station is much larger than that between the Xianfeng Station and the Mukou Station. Therefore, it can be considered that the basin where Mukou Station is located is more similar to the basin where Xianfeng Station is located. This conclusion is consistent with the case where the membership degree of Xianfeng Station is greater than that of Sandu Station in
Table 6.
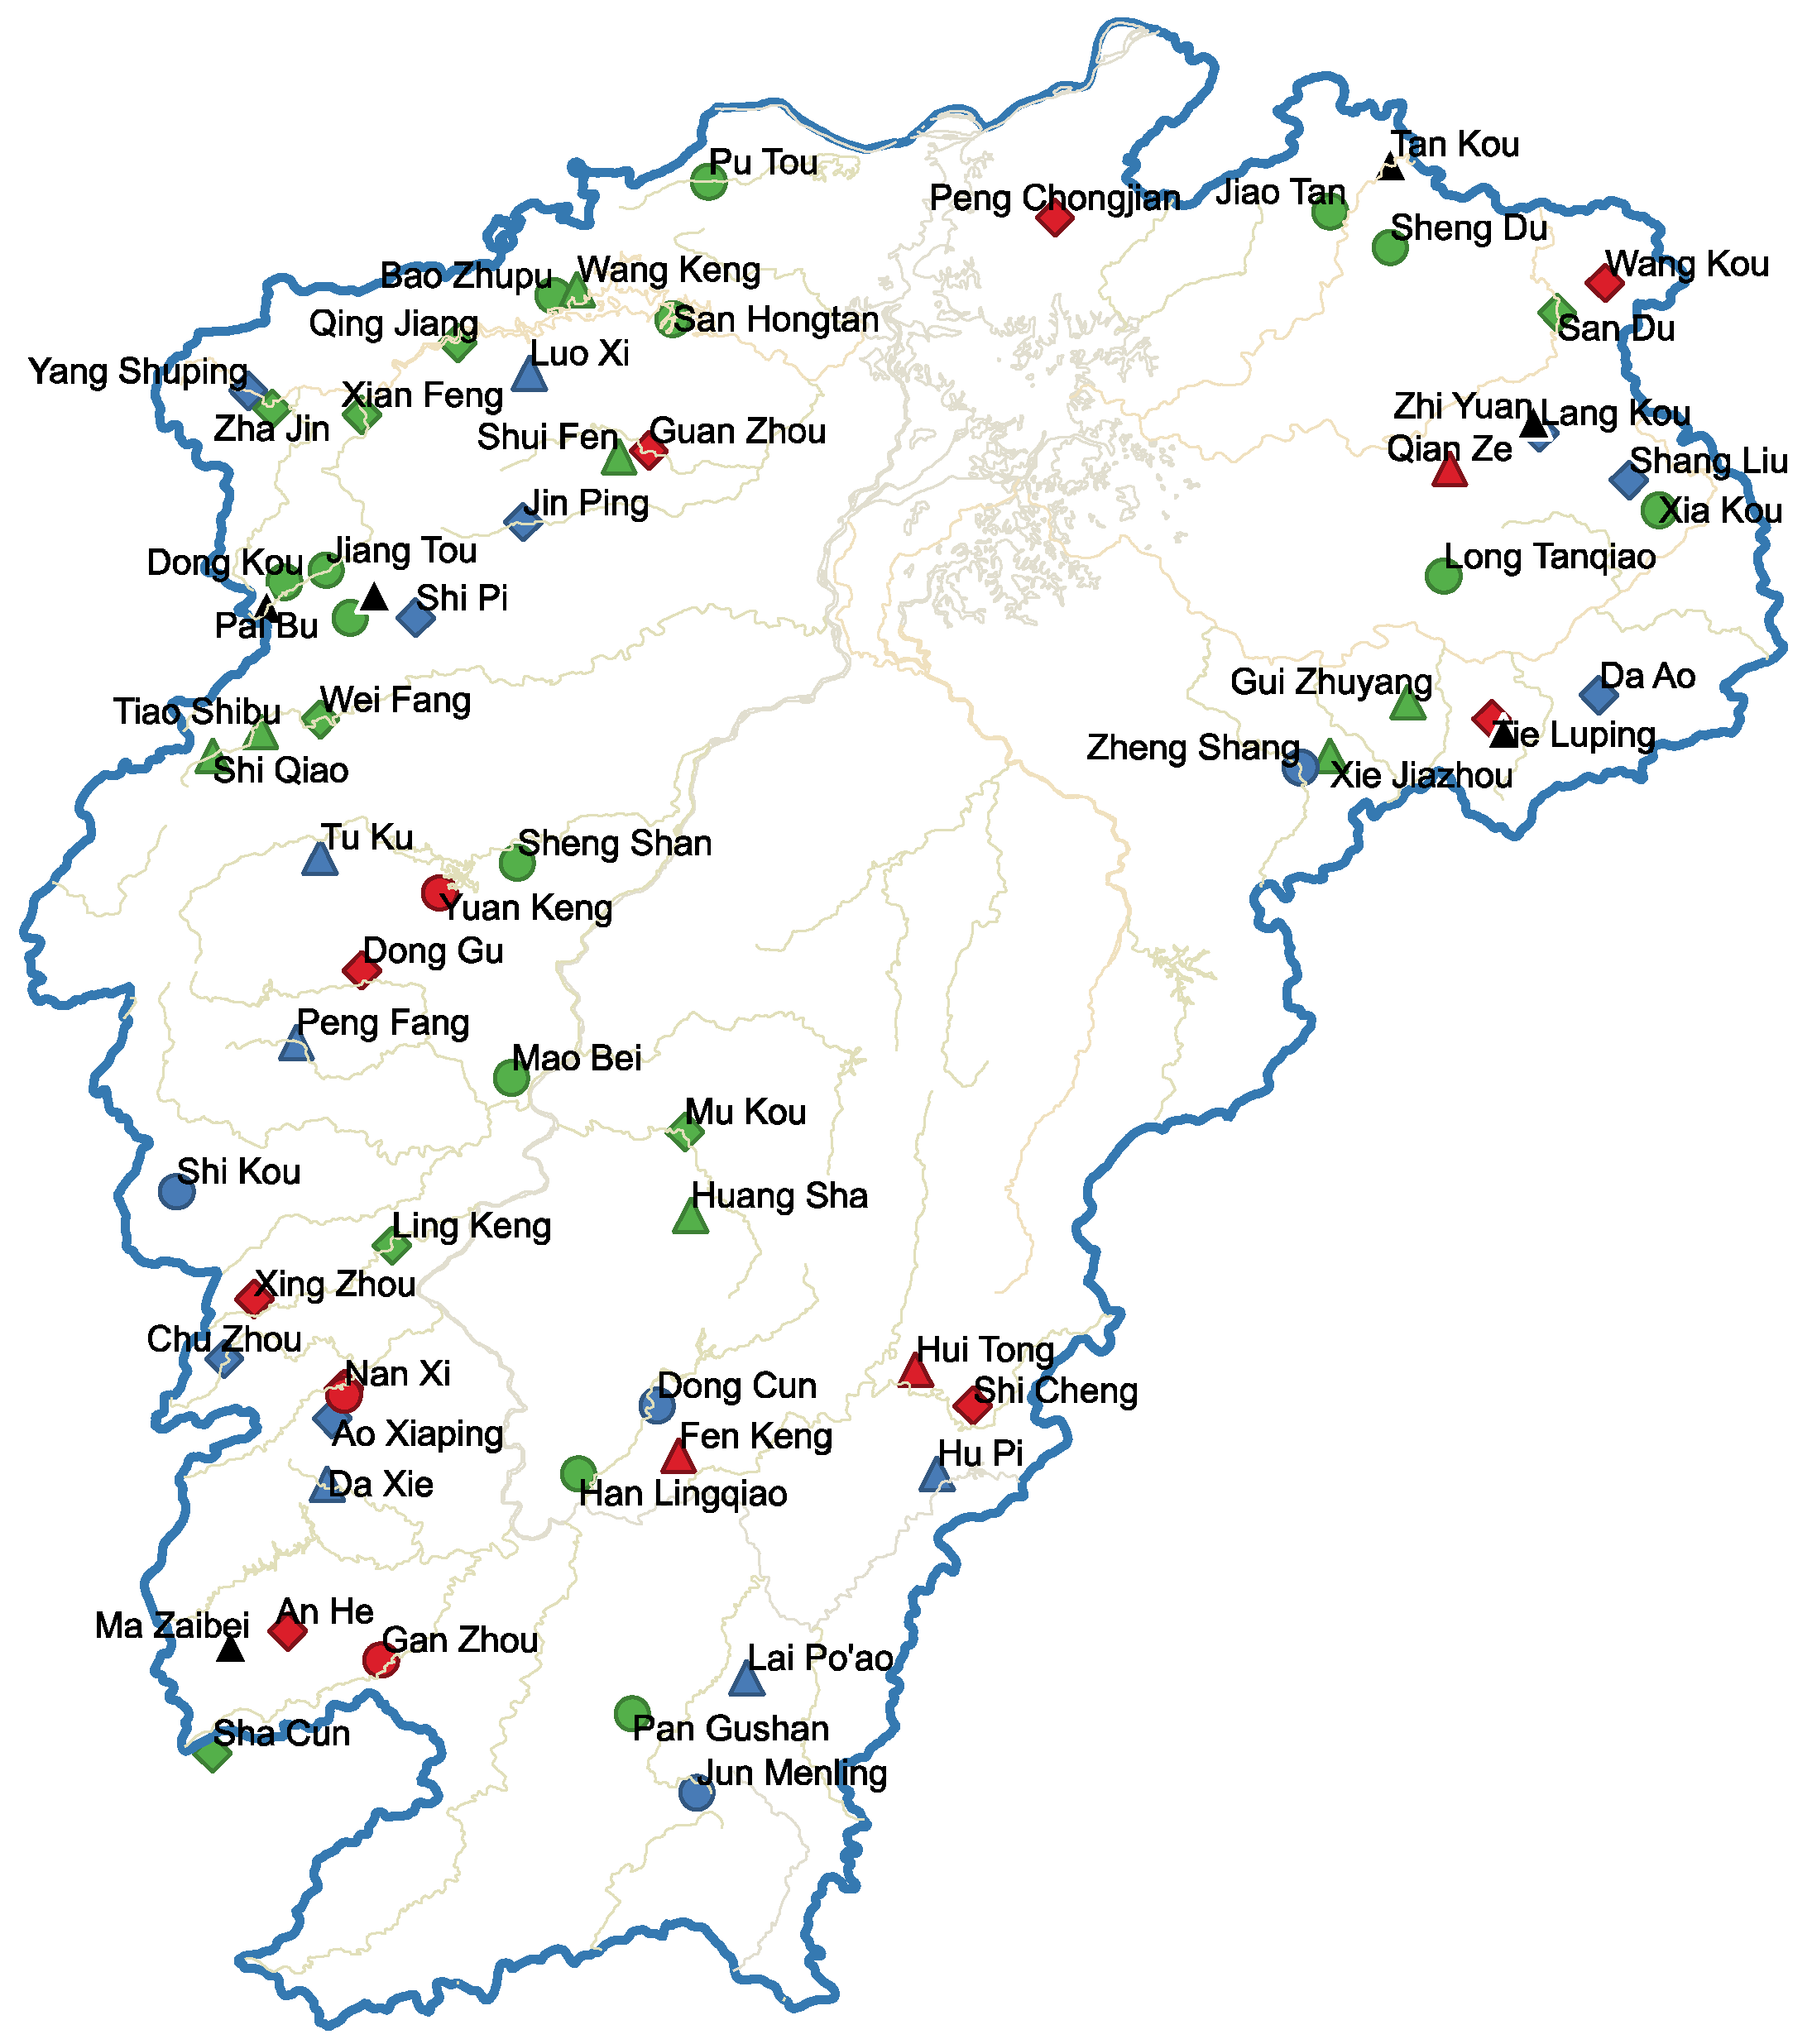
Figure 9 is the result of 69 small- and medium-sized watersheds similarity analysis based on clustering ensemble, and stations with the same color and shape are similar. The clustering integration method proposed in this paper can directly and effectively find out more similar basins.


