Article

A Numerical Study of the Influence of Channel-Scale Secondary Circulation on Mixing Processes Downstream of River Junctions

by
Tatyana P. Lyubimova
1,2,*,
Anatoly P. Lepikhin
3,
Yanina N. Parshakova
1,
Vadim Y. Kolchanov
1,2,
Carlo Gualtieri
4,
Bernard Roux
5 and
Stuart N. Lane
6
1
Institute of Continuous Media Mechanics, Ural Branch of the Russian Academy of Science, 614013 Perm, Russia
2
Department of Theoretical Physics, Perm State University, 614990 Perm, Russia
3
Mining Institute UB RAS, 614007 Perm, Russia
4
Department of Civil, Architectural and Environmental Engineering, University of Napoli “Federico II”, 80138 Napoli, Italy
5
Ecole Centrale, CNRS, Aix-Marseille Université, 13007 Marseille, France
6
Institute of Earth Surface Dynamics, Université de Lausanne, 1015 Lausanne, Switzerland
*
Author to whom correspondence should be addressed.
Water 2020, 12(11), 2969; https://doi.org/10.3390/w12112969
Submission received: 26 August 2020 / Revised: 19 October 2020 / Accepted: 20 October 2020 / Published: 23 October 2020
(This article belongs to the Section Hydrology)

Abstract

:
A rapid downstream weakening of the processes that drive the intensity of transverse mixing at the confluence of large rivers has been identified in the literature and attributed to the progressive reduction in channel scale secondary circulation and shear-driven mixing with distance downstream from the junction. These processes are investigated in this paper using a three-dimensional computation of the Reynolds averaged Navier Stokes equations combined with a Reynolds stress turbulence model for the confluence of the Kama and Vishera rivers in the Russian Urals. Simulations were carried out for three different configurations: an idealized planform with a rectangular cross-section (R), the natural planform with a rectangular cross-section (P), and the natural planform with the measured bathymetry (N), each one for three different discharge ratios. Results show that in the idealized configuration (R), the initial vortices that form due to channel-scale pressure gradients decline rapidly with distance downstream. Mixing is slow and incomplete at more than 10 multiples of channel width downstream from the junction corner. However, when the natural planform and bathymetry are introduced (N), rates of mixing increase dramatically at the junction corner and are maintained with distance downstream. Comparison with the P case suggests that it is the bathymetry that drives the most rapid mixing and notably when the discharge ratio is such that a single channel-scale vortex develops aided by curvature in the post junction channel. This effect is strongest when the discharge of the tributary that has the same direction of curvature as the post junction channel is greatest. A comprehensive set of field data are required to test this conclusion. If it holds, theoretical models of mixing processes in rivers will need to take into account the effects of bathymetry upon the interaction between river discharge ratio, secondary circulation development, and mixing rates.

1. Introduction

It has been noted for some time that two confluent rivers can take some significant distance downstream to mix completely [1,2,3,4,5,6,7]. In large rivers (>0.5-km wide) this distance may be of the order of magnitude of 10 s or even 100 s of km [5,6]; but also very different when comparing rivers of the same width or, because of the changes in the ratio of the flow discharge and momentum of the two channels, due to different hydrological responses of the tributary basins upstream [5,8,9].
Basic semi-theoretical reasoning explains why, in the absence of other forcing factors, the mixing distances of large rivers should be long and this is because far field mixing processes on their own are not particularly effective. Fickian or turbulent diffusion [10,11] is a slow process. Taylor dispersion may arise if there is non-uniformity in the average velocity field within a flow cross-section [12]. Theoretical analyses have shown that the rate of transverse (turbulent) diffusion, and hence the distance required in the downstream direction, is a function of the square of post-confluence width [5,13,14]. This distance may be greater with higher flow momentum and lower with a higher diffusion coefficient [13]. The dependence of the mixing length on the square of width explains why large rivers seem to take progressively longer to mix than smaller ones.
However, large rivers can mix much more rapidly than smaller ones because of two processes [5]: (1) Those operating at the junction itself, that is near-field processes; or (2) downstream (or far-field) advective processes, such as secondary circulation induced by channel curvature or bifurcations around mid-channel bars.

1.1. Near Field Processes—Secondary Circulation and Shear-Driven Turbulence

Near field processes, such as those related to differences in velocity and density, confluence geometry and bed morphology, have been well studied. Laboratory experiments and theoretical analyses of the junction of rectangular channels for subcritical conditions [15] initially focused on momentum balance analyses to explain how different combinations of junction angle, Froude number and discharge ratio influenced the streamline curvature and energy losses. Streamline curvature induces a centrifugal force which in a shallow boundary layer is smaller at the bottom of a curved channel than higher up because of friction effects and which induces a helicoidal flow [16]. At a river junction, the two confluent channels develop curvature in opposite senses such that two counter-rotating helicoidal flows (or back-to-back secondary circulation cells, [17]) may develop. Mosley [18], in a scaled laboratory experiment, Ashmore et al. [19] in field study of junctions in a braided river, and Rhoads and Kenworthy [17] in a field study of a junction in a dendritic network, confirmed their presence. Given that centrifugal acceleration is a function of mean flow velocity as well as junction angle, it is not surprising that numerical experiments showed that the intensity of the helicoidal flows that form is a function of momentum ratio [20] and junction angle [20,21]. Field observations [22] showed that a high proportion of natural river junctions had one channel bed higher than the second, that is they were discordant. Best [23,24,25], Best and Roy [26], and Biron et al. [27,28] showed the importance of the discordance for junction hydrodynamics as an additional driver of secondary circulation, observed to form even in the absence of planform streamline curvature [26,29].
In addition to channel scale secondary circulation, river junctions are also associated with significant shear in the near field zone. This is also of potential importance for mixing because the shear can lead to intrusions of fluid from one tributary into the other and vice versa [30]. However, field data suggest that the growth of these instabilities tends to be constrained by flow convergence [31]. Further, this shear lasts for only a small distance downstream [5,32] and this appears to be because of a relative rapid acceleration of the lower momentum tributary and deceleration of the higher momentum tributary [33].

1.2. Implications for Mixing

Whilst there appears to be less evidence to support the effects of shear-driven turbulence as a control on significant mixing at river junctions [5,34], the secondary circulations induced by streamline curvature and/or bed discordance have been shown to have a significant effect on the mixing processes. Gaudet and Roy [35] showed that the presence of discordance at river junctions could cause downstream mixing lengths to be 5 to 10 times shorter than for river junctions with concordant beds. Numerical experiments [36] showed that this effect is conditioned by the discharge (and hence the momentum) of the combined flow, with longer mixing lengths when discharge was higher. Rhoads and Sukhodolov [32] showed that asymmetry in the planform of the two tributary channels significantly enhanced downstream mixing compared with the symmetrical case. This was because the helicoidal flows that formed in the symmetrical case tended to keep the two tributary flows separated. Lane et al. [5] found a two orders of magnitude reduction in the downstream mixing length at a junction of large rivers with bed discordance provided that the smaller tributary had sufficient momentum to establish channel-scale helicoidal motion. If not, rapid decay in the shear between the two flows rapidly reduced turbulence-driven mixing and the two flows did not mix for 100 s of km downstream. It is also possible that the two tributaries have different densities and the relative buoyancy difference that results has also been shown to impact mixing [6,9,37,38,39,40,41,42].
Numerical studies (e.g., [43,44,45,46]) have generalized these findings to show that the angle of the tributary and its momentum exert a crucial control on whether helicoidal flows enhance or suppress mixing. In all cases, a critical condition for rapid mixing due to the near-field processes associated with secondary circulation appears to be some form of asymmetry (geometry, discordance, momentum, density difference) between the tributaries [45].
Most studies to date, whether field-based, experimental, or numerical have focused on channels with relatively low width (w) to depth (d) ratios, commonly <10 [47,48]. In large rivers, typical of that studied in this paper, w:d can be >100. It is well-established in curved channels that for a given radius of curvature, an increase in width leads to a reduction in the intensity of secondary circulation [49]; and Kashyap et al. [50] report a non-linear decrease in intensity in numerical experiments as w:d was increased from 5 to 12.5. Basic force balance analyses (e.g., [51]) confirm that for a given radius of curvature, the intensity of curvature-driven circulation should decrease as w:d increases. Numerical studies also show a w:d dependence for the intensity of secondary circulation in river junctions [52]. However, there remain no numerical studies of whether or not it is possible for channel-scale secondary circulation to develop in river junctions with large w:d. Further, while there is a very rich history of the direct measurement of the near-field processes that could contribute to mixing in smaller rivers, numerical studies of such processes have tended to focus upon rectangular channels and so have not included non-rectangular or natural bathymetries which have been shown to influence flow hydraulics at junctions (e.g., [53,54]), with implications for near-field mixing. Similarly, if the distances required for mixing are long, then it is possible that mixing may be enhanced (or suppressed) by processes operating in the far-field zone. As secondary circulation intensity declines rapidly downstream from near field zone (e.g., [20]) it is also important to consider processes that might cause secondary circulation to develop downstream of the junctions because of forcing by other processes. Reflecting the observations above for the effects of w:d on secondary circulation intensity, studies of large rivers suggest that channel curvature and mid-channel islands that force streamline convergence and divergence do not lead to the channel-scale secondary circulation that can enhance lateral mixing [47,48].
Given this review, the aim of this paper is to quantify through a numerical approach, the relative influence of both near-field and far-field processes on the rates of mixing of two large rivers (post junction width, circa 1 km), the Kama and the Vishera, west of the Russian Urals. We do this by considering three configurations: (1) The natural geometry and bathymetry of the river; and (2) two simplifications, one where the river bathymetry is simplified to a rectangular cross-section (following from the observations of Ramamurthy and Zhu [53] and Schindfessel et al. [54]), and one where the junction is simplified further by removing planform curvature downstream of the junction to create a straight post-confluence channel without mid-channel islands. We do not aim to produce a new generic model of the mixing process or specific predictions for the case-study considered here. Rather, we seek to identify what such models and predictions may need to consider in terms of influencing factors. We emphasize that this is a numerical study, which while conforming to good practice in terms of the numerical simulations (e.g., [55,56,57,58]), is only able to validate the extent to which the model produces a single case of observed mixing.

2. Case Study and Methods

2.1. Case-Study

The junction of the Vishera and Kama rivers is located at 59°54′27.5″ N, 56°25′46.7″ E. The Vishera river drains the western foothills of the Ural mountains and has an upstream contributing area of 31,200 km2 when it joins the Kama river about 250 river km north of the city of Perm. It has an average annual flow rate of 508 m3·s−1 and an average summer (June to August) flow rate of 385 m3·s−1. The Kama, with a larger upstream contributing area of 51,300 km2, becomes the name of the post-confluence river, even though it has a lower mean annual flow (385 m3·s−1) and mean summer flow (144 m3·s−1). Lower Kama flows reflect the fact that the Vishera drains the Ural foothills which receive greater rainfall. However, given the difference in climate forcing, there is also an important intra-annual variation in the discharge ratio of the two channels illustrated here for 2018 (Figure 1). In 2018, from January through to early April, the Vishera has a marginally higher discharge than the Kama. The Vishera has a higher altitude such that as snowmelt begins in April, the Kama rises first with Qr > 1 until late May. Flow in the Vishera increases in May, and Qr declines to <1. The Vishera snowmelt season is complete by the end of July, but the Vishera discharge remains higher than the Kama discharge until early October because of the effect of the Urals on summer precipitation. From early October, the two basins are affected by autumn storms that may be as snow in the Vishera, but where snow does not always accumulate for more than a few weeks. Thus, the Qr can fluctuate, as a function of both precipitation events and snowmelt release. In our experiments, we drive the numerical simulations (see below) using three different measured values of Qr (Table 1). The first two, Qr = 0.62 and Qr = 0.76, are characteristic of the period June through November when the Vishera generally has a higher discharge than the Kama. The third, Qr = 1.99, is characteristic of the period in April-May when the Kama has a higher discharge than the Vishera.
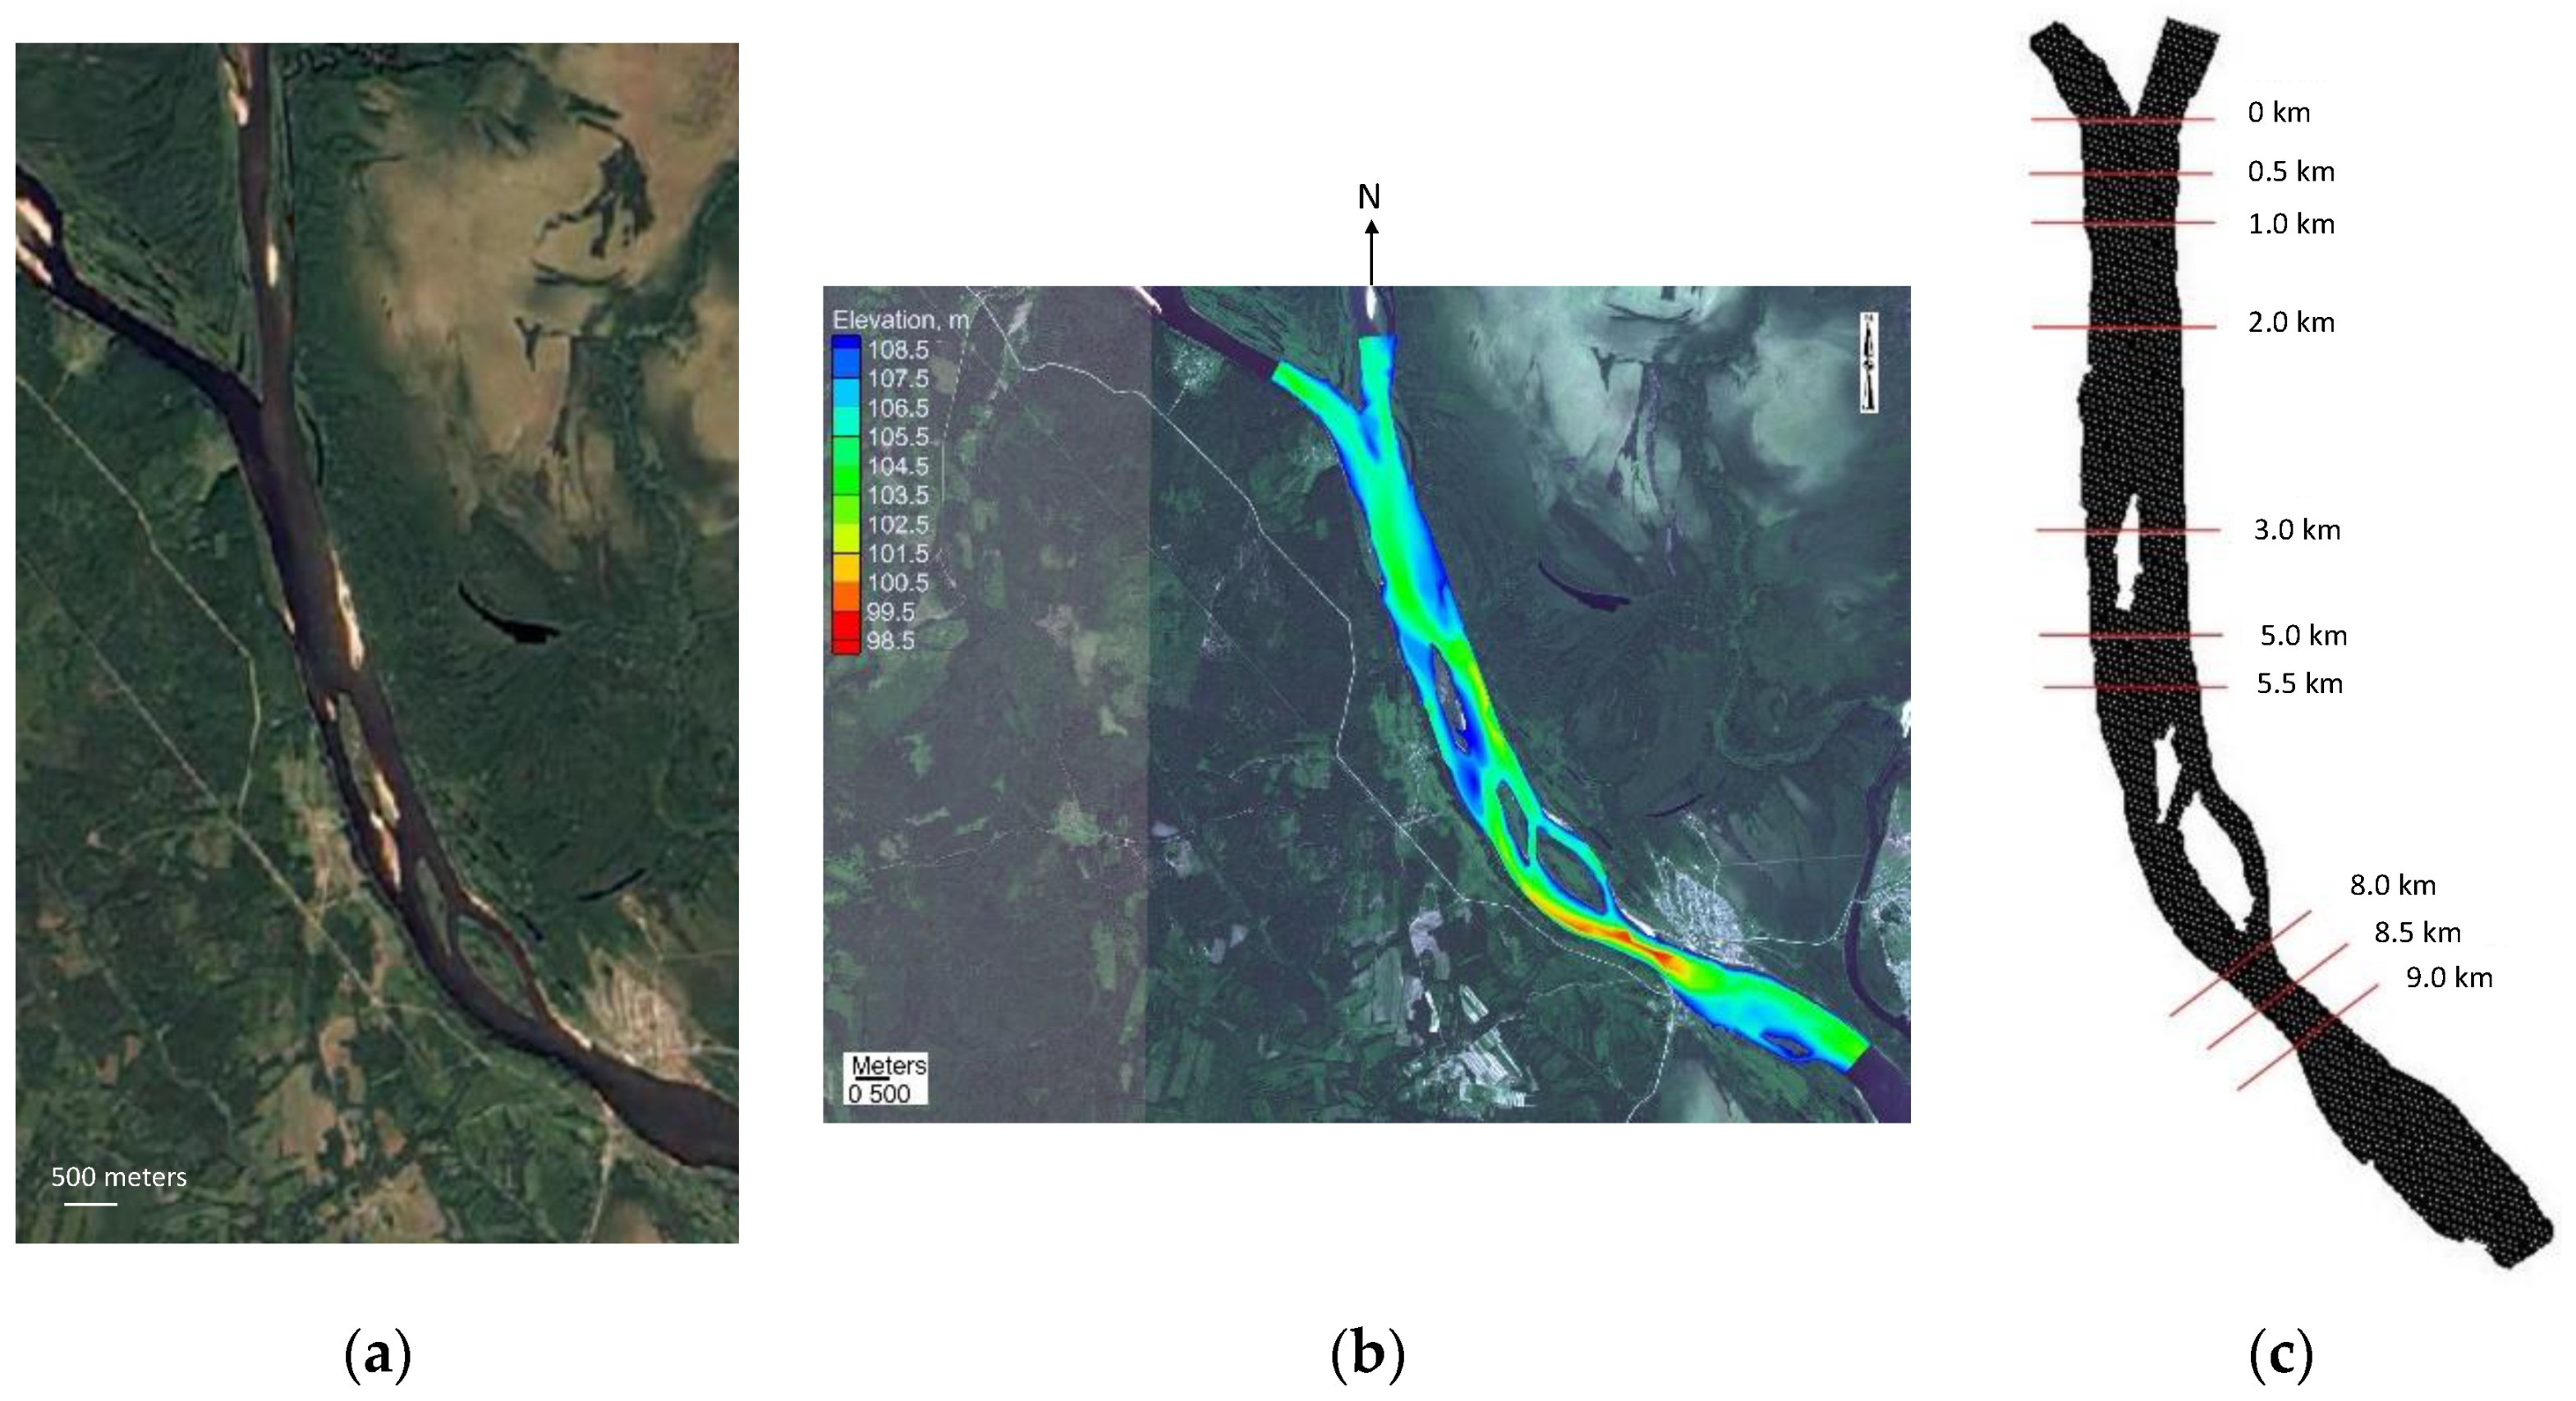
Figure 2a shows a satellite image of the junction and the immediate downstream channel and Figure 2b the measured bathymetry. The characteristic hydraulic slope of the channel downstream from the junction is 0.8 × 10⁻⁴ and the mean width is 500 m, but this varies substantially because of the presence of mid-channel islands. The junction angle between the two rivers is about 50°. Just upstream of the junction the w:d ratio of the Kama is circa 100 and the Vishera is circa 110, which are values much higher than those typical in numerical studies of river junctions. There is no clear discordance at the junction (Figure 2b) and the w:d ratio increases markedly immediately downstream to circa 220. Figure 2b shows that the downstream, post-junction channel initially comprises two laterally attached point bars that can be partially exposed at certain flows to create islands. The channel then curves toward the true left, with two exposed mid-channel bars. The presence of bars and curvature downstream makes this junction an ideal case for evaluating how far-field-induced flow processes might modify the mixing initiated at the junction. Downstream of the junction there is a major hydropower plant that has flooded the Kama valley, but the junction is well upstream of this influence.
Both streams have similar water densities, reflecting similar temperatures, suspended solids, and solutes concentrations (mineralization of the Kama is 80–100 mgL−1 and of the Vishera 140–180 mgL−1). The Kama river appears different in color before it merges with the Vishera river because upstream of the junction it crosses a marshland, and so has a higher content of organic matter and iron, and so a darker color. This does not impact the densities significantly.

2.2. Numerical Simulation

A three-dimensional computational fluid dynamics system, ANSYS Fluent, was used for the simulations. The equations of motion in the tensor form are:
t ( ρ v i ) + x j ( ρ v i v j ) = p x i + x j [ μ ( v i x j + v j x i 2 3 δ i j v l x l ) ] + x j [ μ t ( v i x j + v j x i ) 2 3 ( ρ k + μ t v l x l ) δ i j ] + ρ g i ,
where ρ is the fluid density, p is pressure, vi,j,k are the velocity components in the x, y, and z directions, μ is the molecular viscosity, μt is the dynamic viscosity, k is the turbulent kinetic energy, δ is the Kronecker delta function, and g is gravity. In order to be able to represent the effects of turbulence anisotropy on secondary circulation (i.e., Prandtl type 2 secondary circulation) a Reynolds Stress Model (RSM) was used to close Equation (1). Although the magnitude of secondary circulation associated with turbulence anisotropy may be small in rivers with irregular boundaries as compared with that associated with channel scale effects such as pressure gradients [59,60], it may be significant for more regular geometries or in far field situations with fewer channel scale effects [61,62,63,64,65]. Representing such effects require a Reynolds Stress Model [66]. In an RSM model explicit transport, production, and dissipation terms are introduced through a momentum equation for the Reynolds stresses:
t ( ρ v i v j ¯ ) + x k ( ρ v k v i v j ¯ ) = x k ( μ t σ k v i v j ¯ x k ) + x k [ μ x k ( v i v j ¯ ) ] ρ ( v i v k ¯ v j x k + v j v k ¯ v i x k ) C 1 ρ ε k ( v i v j ¯ 2 3 δ i j k ) + 2 3 δ i j ρ ε
where ε is the rate of dissipation of turbulent kinetic energy and Cl = 1.8.
The turbulence kinetic energy is given as: k = 1 2 v i v i . It is needed to solve a transport equation for the turbulence kinetic energy to obtain boundary conditions for the Reynolds stresses.
t ( ρ k ) + x i ( ρ k v i ) = x j ( ( μ + μ t σ k ) k x i ) + 1 2 ρ ( v i v k ¯ v i x k + v i v k ¯ v i x k ) ρ ε
with σ k = 0.82 .
The scalar dissipation rate is computed with a transport equation:
t ( ρ ε ) + x i ( ρ ε v i ) = x j ( ( μ + μ t σ ε ) ε x j ) + C ε 1 1 2 ρ ( v i v k ¯ v i x k + v i v k ¯ v i x k ) C ε 2 ρ ε 2 k
with σ ε = 1.0 ,   C ε 1 = 1.44 ,   C ε 2 = 1.92 . The turbulent viscosity is defined from μ t = ρ C μ k 2 ε , where Cμ = 0.09.
These relations need modification at the walls were we have to compute the near-wall values of the Reynolds stresses and ε from wall functions. The law-of-the-wall for mean velocity yields
U * = 1 κ ln ( E y * )
where U * = U P C μ 1 / 4 k P 1 / 2 τ w / ρ , y * = ρ C μ 1 / 4 k P 1 / 2 y P μ , κ = 0.4187 (von Karman’s constant), E = 9.793 is an empirical constant, U P is the mean velocity of the fluid at point P , k P is the turbulence kinetic energy at point P , and y P is the distance from point P to the wall. The log-law is employed when 11.225 < y * < 300 . When the mesh is such that y * < 11.225 at the wall-adjacent cells, it applies the laminar stress-strain relationship that can be written as U * = y * . The Reynolds stresses at the wall-adjacent cells are then computed from:
v i 2 ¯ k = 1.098 ,   v j 2 ¯ k = 0.247 ,   v k 2 ¯ k = 0.655 ,   v i v j ¯ k = 0.255
The boundary condition for k imposed at the wall is k n = 0 , where n = z is the coordinate normal to the wall. The production of kinetic energy G k , and its dissipation rate ε , at the wall-adjacent cells, which are the source terms in the k equation, are computed on the basis of the local equilibrium hypothesis. Under this assumption, the production of k and its dissipation rate are assumed to be equal in the wall-adjacent control volume. Thus, the production of k at the wall is computed from:
G k τ w U y = τ w τ w κ ρ C μ 1 / 4 k P 1 / 2 y P
The dissipation rate ε is computed from:
ε = C μ 3 / 4 k P 3 / 2 κ y P
To model mixing, a passive scalar of concentration c was introduced with the following transport equation:
t ( ρ c ) + · ( ρ v c ) = · J
Here J is the diffusion flux of impurities, defined by the expression
J = ρ ( D m + D t ) c
where Dm is the coefficient of molecular diffusion, Dt is the effective coefficient of turbulent diffusion associated with the turbulent viscosity μt through the relation Dt = (μt/ρ)/Sct, where S c t is the turbulent Schmidt number [67], that was set equal to 0.7.
Wall functions are also required for modelling concentrations and so we apply a similar law-of-the wall function:
c * = ( c w c ) ρ C μ 1 / 4 k P 1 / 2 J w = { S c y * ( y * < y c * ) S c t [ 1 κ ln ( E y * ) + P c ] ( y * > y c * )
where Sc and S c t are molecular and turbulent Schmidt numbers, Jw is the diffusion flux of concentration at the wall, and Pc is defined by:
P c = 9.24 [ ( S c S c t ) 3 / 4 1 ] [ 1 + 0.28 e 0.007 S c / S c t ]
The non-dimensional concentration sublayer thickness y c * is computed as the y * value at which the linear law and the logarithmic law intersect, given the molecular Schmidt number of the fluid being modeled.
The river bottom and banks of the computational domain were considered rigid, and no-slip and impermeability conditions were set for them.
v 1 = v 2 = v 3 = 0 ,   c n = 0
The upper boundary of the region corresponding to the free surface of the fluid was considered undeformable (a rigid-lid approximation), which is commonly applied in free-surface flows at low Froude number (Fr < 0.4) [68]; the conditions for the absence of a normal component of velocity and tangential stresses were imposed on it, as well as the condition for the absence of tracer flux:
( v n ) = 0 ,   v x x z + v z x x = 0 ,   v y x z + v z x y = 0 ,
At the outlet of the computational domain, mass balance conditions and a zero-diffusion flow condition were set for all flow variables.
A SIMPLE algorithm was used for pressure-velocity coupling. For spatial discretization, a Green-Gauss cell-based algorithm was used for the gradients in both convection and diffusion terms in the conservation equations. We used second-order upwind discretization for the spatial discretization of the convection terms of the flow equations, turbulence models, and all scalar equations. No relaxation was used. For temporal discretization, a second-order implicit discretization was used.
Calculations were performed for three different configurations, designed to allow comparison of the relative effects of planform and bathymetric irregularity, and hence the likely relative importance of channel-scale effects and turbulence anisotropy upon secondary circulation and mixing. The first used an idealized regular geometry (the R simulations), characterized by the same spatial dimensions as the Kama and Vishera rivers, but with straight rectangular channels downstream from the junction. The calculations were carried out for a 11-km section, from 1 km upstream of the junction to 10 km downstream. The width of the river channels upstream from the confluence was taken to be the same and equal to 250 m, corresponding to the natural geometry. The width of the channel downstream from the confluence was taken to be 500 m, approximating the downstream-averaged average width of the Kama river after its junction. It should be emphasized that the width is variable and the width used is an average. The computational grid in the horizontal direction consisted of quadrangular cells uniformly distributed along the entire length, with a characteristic linear size of 10 m. The mesh had a horizontal bed and vertical banks. The depth of the rivers was assumed to be constant throughout the computational domain and equal to 8 m. In the vertical, the computational grid consisted of 20 nodes located at equal distances from each other equivalent to 0.4 m cell thicknesses. The dimension of the regular grids was one million four hundred thousand nodes.
For the second case, the regular bathymetry due to the rectangular cross-section of the channels was retained, but the planform was modified to that of the actual Kama-Vishera junction and post-junction channel (the P simulations) (Figure 3). The irregular planform (Figure 2b) required use of an unstructured mesh. As with the regular geometry, simulations were undertaken for the 11-km length of river, 1 km upstream of the junction, and 10 km downstream. Unlike the regular geometry, the width varied according to the planform and this required some mesh adaptation. The horizontal dimension of the mesh consisted of quadrangular cells evenly distributed along the entire length, with a characteristic linear dimension of 18 m (Figure 4). To smooth the mesh horizontally near areas of significant curvature, the mesh size was locally decreased. The dimension of the mesh was similar to the mesh used for the regular R simulations.
For the third case (the natural or N simulations), the mesh was modified to include the measured bathymetry of the Kama and Vishera rivers, which we assume to be the same for all discharge ratios considered. A boat-mounted single beam echo sounder (SyQwest HydroBox) was used to measure the bathymetry. The sounder was operated at 200 Hz, to give a vertical resolution of 0.10 m and a vertical precision of ±0.01 m. The sampler was positioned using a dual-frequency GPS-GLONASS receiver Topcon GR-5 in RTK mode. The boat was driven along pre-defined survey lines, with a 200-m spacing between lines. The depth data were combined with the dGPS data to create sets of xyz data points in the UTM-40N coordinate system (WGS-84). These were interpolated to a digital elevation model with a resolution of 20 m using linear interpolation resulting in the bathymetry shown in Figure 2b.
Inlet conditions for flow depth and velocity were available for the Kama and the Vishera and were obtained using a Teledyne Rio Grande Workhorse 600 Hz acoustic Doppler current profiler (aDcp) for all cases. This aDcp allows profiling from 0.7 m (the blanking distance) to 75 m.
For the R geometry simulations, velocities at the inlet were set to have one non-zero horizontal component oriented in the primary flow direction, and background concentrations of tracer in rivers were set to be uniform in the section.
i n l e t 1 : v 1 2 + v 2 2 = V 1 2 , v 3 = 0 , c = C 1 i n l e t 2 : v 1 2 + v 2 2 = V 2 2 , v 3 = 0 , c = C 2
For the P geometry simulations, the R simulation velocity data were used, but these were rotated onto the primary flow direction of each tributary (i.e., to yield both x and y components of velocity). For the N simulations, the measured inlet velocities were used. In all simulations, the outlet was set using a normal depth condition and the water surface elevations were calculated explicitly during solution. The Reynolds stresses were set at the inlet under the assumption of isotropy of turbulence:
v i 2 ¯ = 2 3 k , v i v j ¯ = 0.0
Here k = 3 2 ( v a v g I ) 2 , vavg is the mean flow velocity. The turbulence intensity was defined by
I = 0.16 Re 1 / 8
We checked that the distance upstream of the junction (1 km) was sufficient for predicted flow velocities to have adapted to these initial conditions. Visually, we found this to be the case and checks of the difference between mean flow velocities were <2.5% between a section 200 m upstream and a section 600 m upstream.

2.3. Analysis of Model Outputs

The analysis of model outputs focused upon both visualization and quantitative analysis. We extracted primary flow velocity, secondary flow velocity, and concentration for cross-sections for all simulations, cross-section 0 was set to 50 m downstream from the upstream junction corner and to be perpendicular to each tributary. We then extracted cross-sections orthogonal to the post-junction channel at 0 and then 500, 1000, 2000, 4000, and 8000 m further downstream. In theory, the R simulations allow for a direct geometrical definition of primary flow as Vy and secondary flow as Vx. However, the situation for the P and the N simulations was more complicated as the primary flow direction did not follow mesh lines. So, in practice, and to be consistent, we applied the no next cross-stream discharge condition [69] to all sections for the R, the P and the N simulations, that is the direction of primary velocity was chosen to be that which produced no net secondary flux in the horizontal.
Each cell in the section then had a Vx, Vy, and Vz component. As the mesh lines in the z direction were vertical, no further correction was required. However, we needed to determine primary velocity (Vp) and the horizontal component of secondary velocity (Vs) from Vx and Vy. The primary and secondary velocities were defined as:
V p = V x c o s α + V y s i n α V s = V x s i n α + V y c o s α
where
α = a t a n Q x Q y
and Qx and Qy are the discharges defined in the x and y directions respectively. As the mesh was irregular, we interpolated Vx and Vy onto a regular mesh (i.e., of known cell size) of commensurate resolution to the average mesh spacing (10 m horizontal and 0.08 m vertical) and then used the mesh spacing with Vx and Vy to determine Qx and Qy.
We also calculated the stream function for visualization, superimposed on the primary velocity and concentration. According to Helmholtz’s theorem [70] any vector field can be represented as the sum of the irrotational (curl-free) vector field and the solenoidal (divergence-free) vector field. Thus, the velocity field can be decomposed as
v = φ + curl ψ
where φ is the scalar potential, and ψ is the vector potential. If we consider secondary rotational flows in the plane (x,z) which is normal to the main flow direction (that is along y-axis) then the irrotational part has to be removed from the velocity vector field. The y-component of the vector potential, usually called stream function, characterizes the structure of the vortices associated with secondary flows. Implementing Equation (19) we obtain the Poisson equation for the stream function Ψ:
Δ Ψ = curl y v
This stream function can then be visualized. We see this as complimentary to Equations (18) and (19) as the latter uses the classical methods for quantifying secondary circulation in river junctions whereas Equations (20) and (21) allow visualization of the vortices associated with these secondary flows.
To describe quantitatively the evolution of concentration with distance downstream from the junction we used an entropy statistic as a measure of the extent to which the J is perfectly mixed. Shannon entropy is defined in this case as
ε = 1 n i = 1 n ( J i < J i > ) l n ( J i < J i > )
where ε is the entropy, Ji is the concentration at location i for the n predictions within a cross-section. In Equation (22), with perfect mixing, ε becomes 0. If there is any inhomogeneity in concentration, then ε > 0. The maximum inhomogeneity will maximize ε, but this value of ε will be dependent upon the relative number of cells in the two confluent channels, and hence the discharge ratio. Thus, this statistic allows us to quantify the patterns of decline (and influences upon them) and the point at which perfect mixing is reached (when ε = 0). We also calculate Equation (22) for velocity. In operational terms, we make two modifications. First, the mean concentration is defined for all sections as the mean concentrations of the two inlets, such that Equation (22) is always calculated with reference to the original (perfectly) unmixed case. Second, Ji values equal to 0 cannot be used with Equation (22). Instead we use an imperceptibly small value of Ji (10−5), noting that replacing values Ji = 0 with Ji < 10−4 produces stable values of ε to 3 decimal places.
Finally, to quantify the role that secondary flow plays in driving the mixing process, we quantify the intensity of secondary flow in the horizontal Fs in each section:
F s = i = 1 n | V s i | d z i d s i
where Vsi is the secondary flow in cell i with vertical dimension d z i and horizontal dimension d s i , s being the secondary flow direction.
For the entropy and secondary circulation intensity estimates, we extracted data at four additional distances (Figure 3), 5000 m, 5500 m, 8500 m, and 9000 m, chosen to assess the influence of channel irregularity in the far-field in the P and N cases as compared with the R case.

2.4. Mesh Sensitivity and Validation

For the R simulations, mesh sensitivity tests were undertaken with measured discharges for Qr = 0.62. The focus of these tests was assessment of the extent to which mixing and secondary circulation predictions were mesh sensitive. Meshes were coarsened by 6.9% and then 20.5% of the mesh used in the simulations. Table 2 shows the result and confirms that for the entropy statistics, at both 0 km and 5 km downstream the predictions were stable. This was also the case for the secondary circulation intensity at 5 km downstream but not so for secondary circulation intensity at 0 km downstream. We attribute this to the difficulty that the model has in getting the shear predictions correct right at the junction corner and where rapid changes in geometry amplify the effects of mesh changes. However, given that the concentration and velocity entropies are stable throughout, and that a particular focus on this paper is on the far-field secondary circulation induced by the post junction channel, we believe Mesh 2 to be sufficient for the simulations.
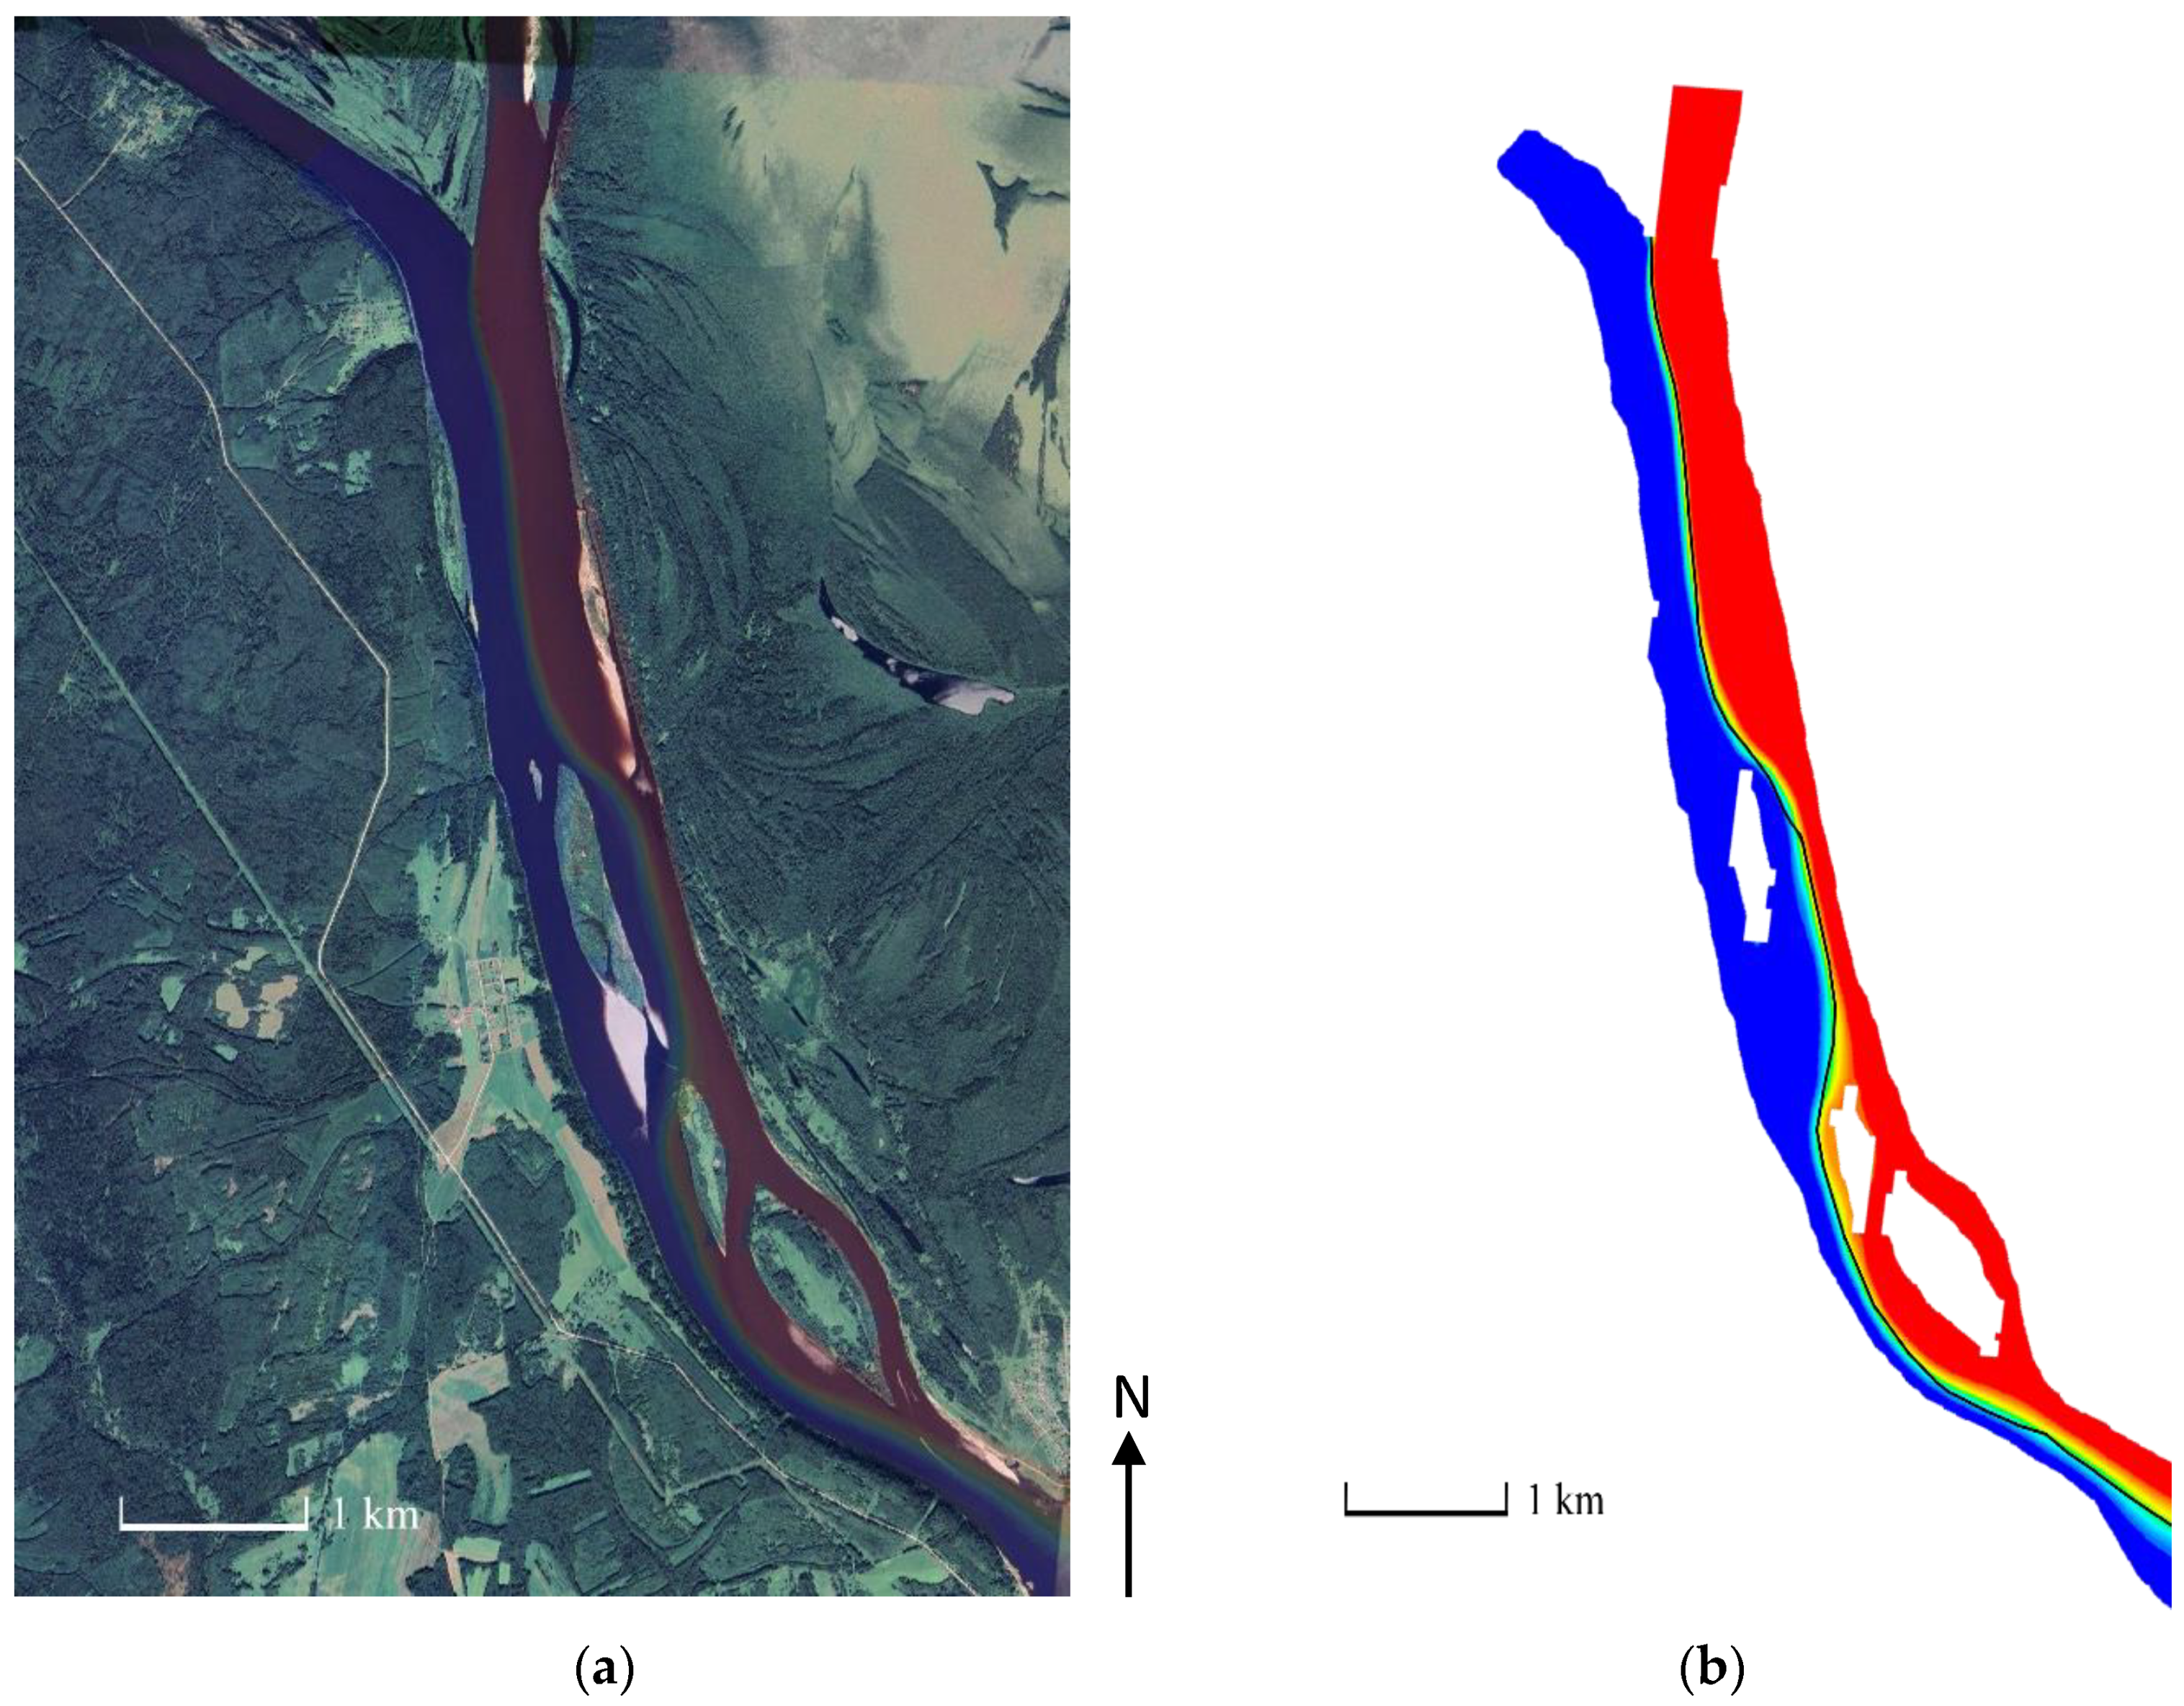
For the N case, we also wanted to undertake some validation. Inspection of Google Earth imagery showed that the mixing interface between the Kama and the Vishera was identifiable throughout the flow domain, although this was not always the case. For the dates of the N simulations this was not the case. However, we were able to use a different bathymetry and discharges measured on the 19 July 2019, which did have Google Earth imagery with a visible mixing interface. The QKama was 1010 m3·s−1 and the QVishera was 1170 m3·s−1 giving a Qr = 0.86. The image was analyzed using a supervised classification (Figure 3a) and the mixing interface was digitized and superimposed on an additional numerical simulation (Figure 3b). This comparison shows that the model is capable of reproducing the position of the mixing interface very effectively.

3. Results

3.1. R Simulations: Regular Planform and Bathymetry

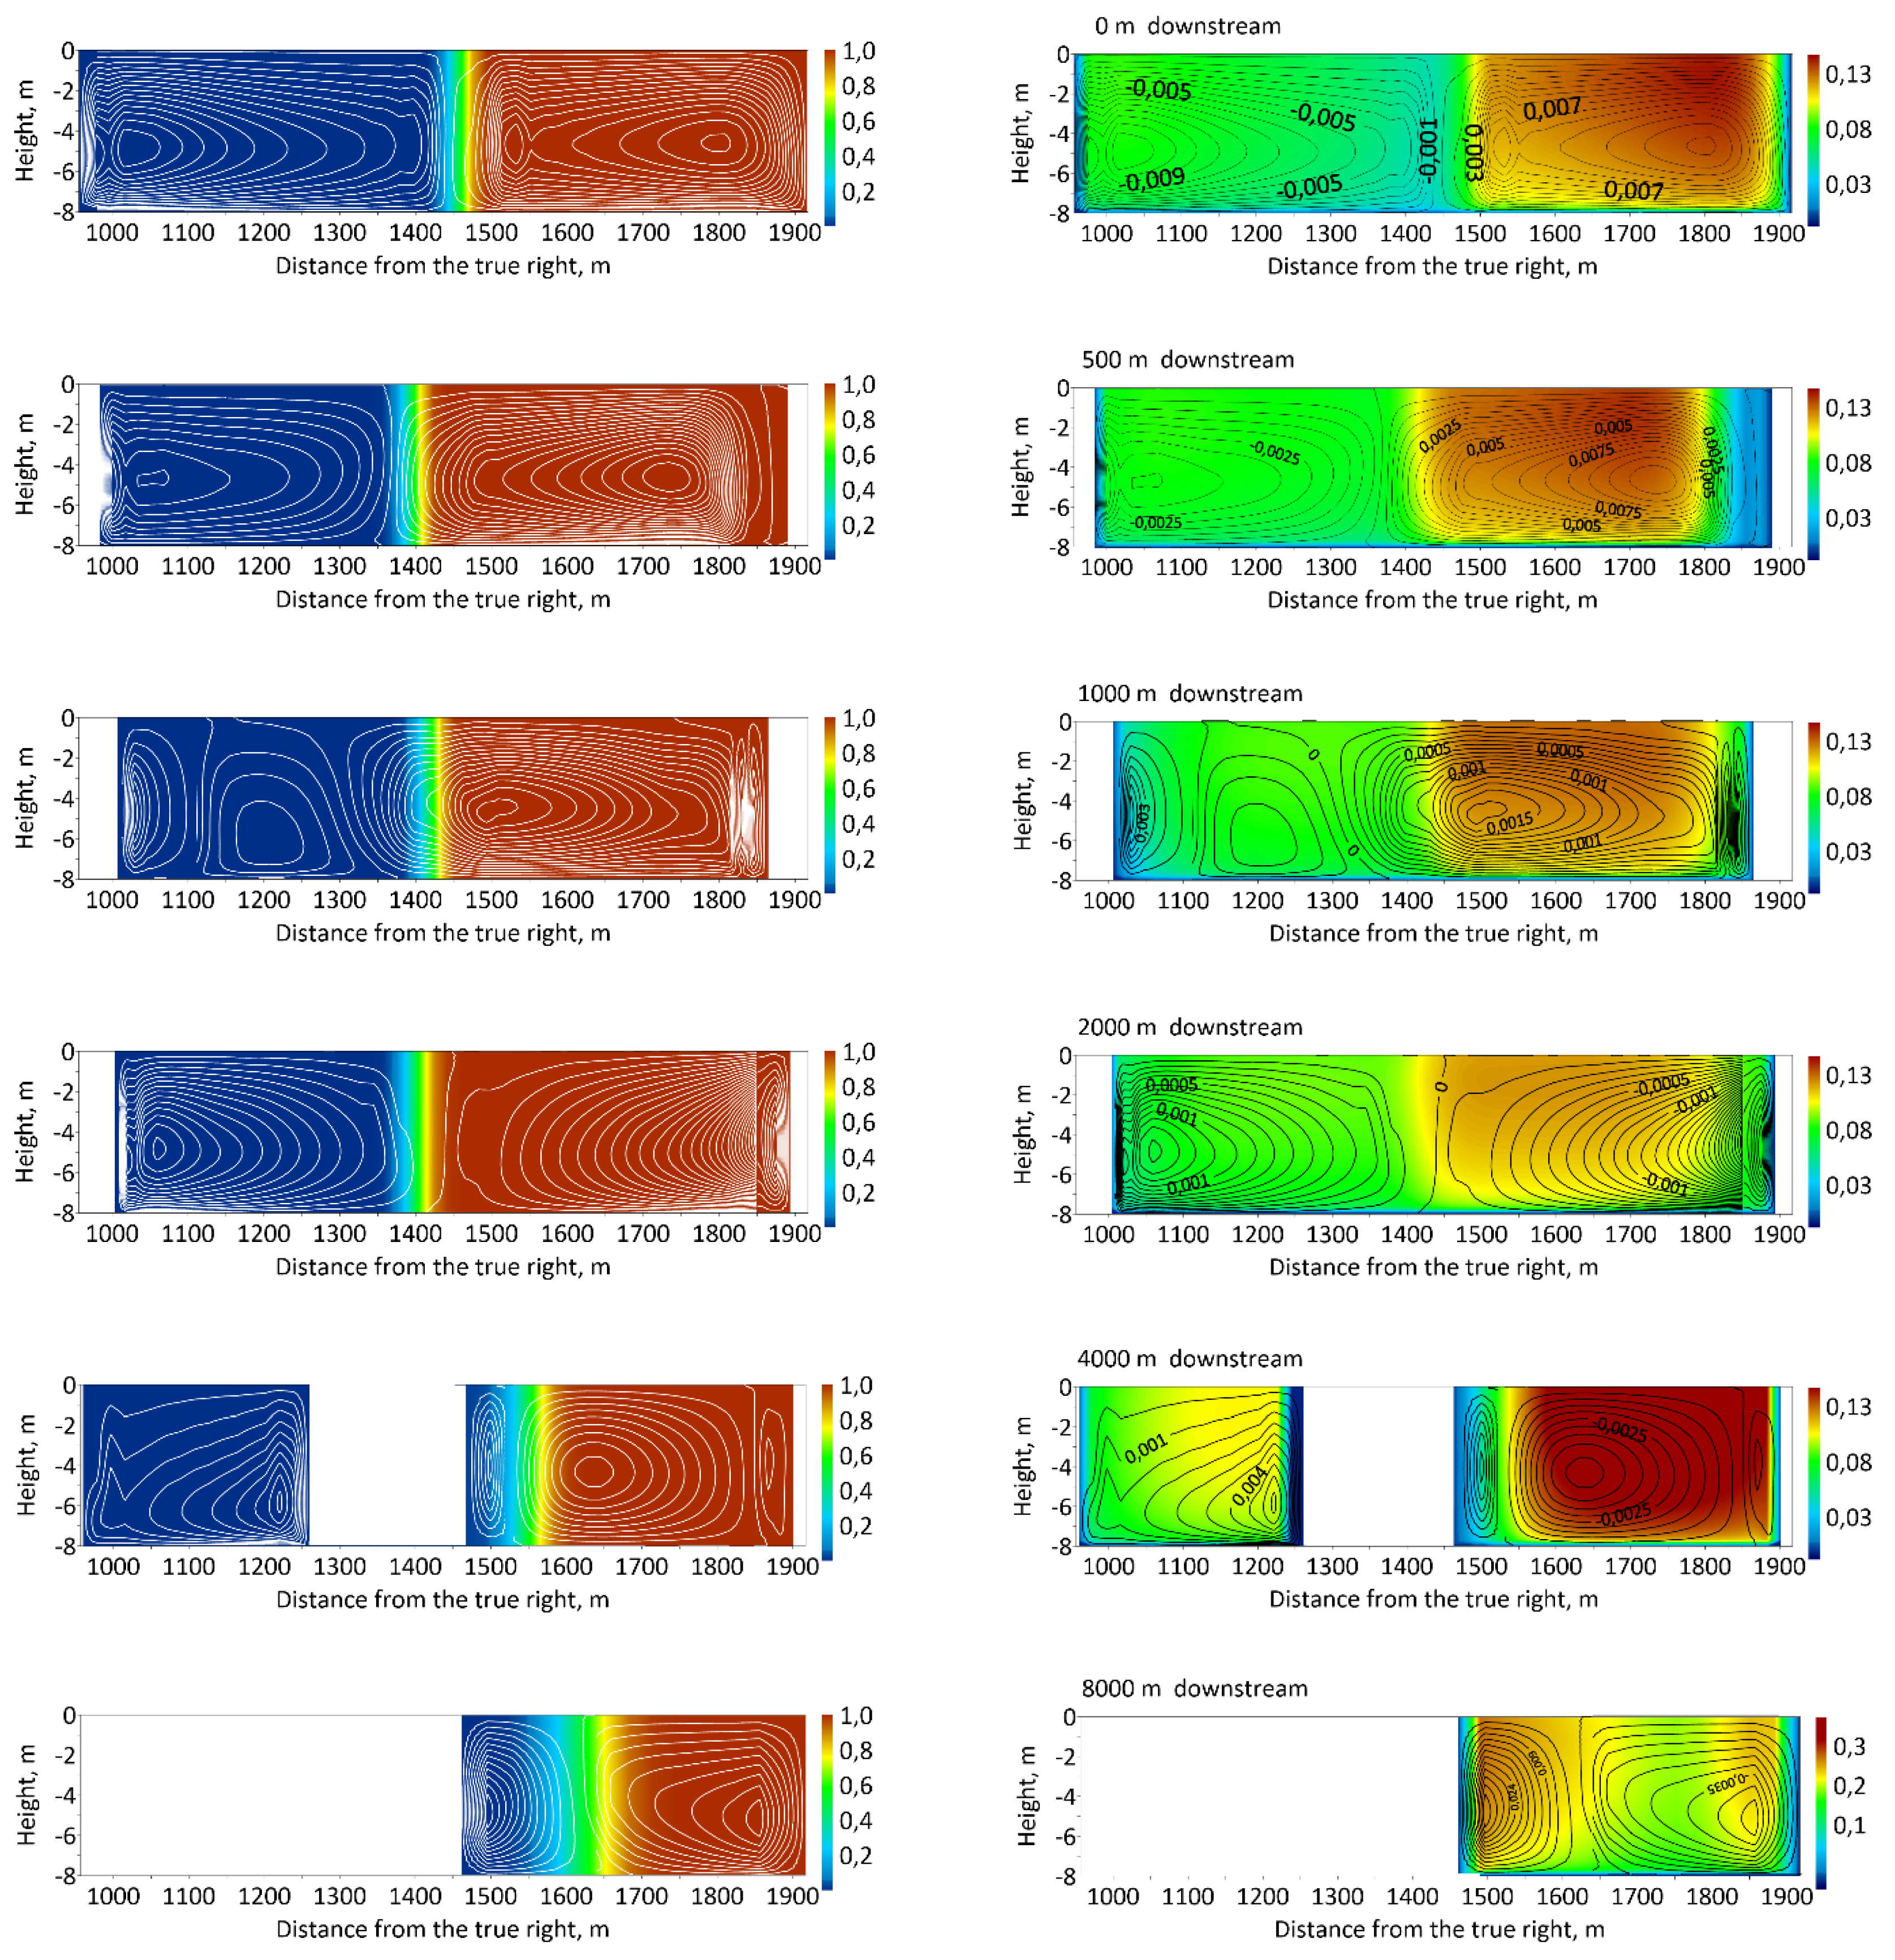
Figure 4 shows the near bed concentrations for the R, P, and N simulation geometries for the three discharge ratios shown in Table 1. For the R simulations, the river remains poorly mixed throughout all the domain for all three discharge ratios. Figure 5 shows concentration and primary velocity with the stream function superimposed. The concentration fields show how the Kama and Vishera water remain clearly distinguishable throughout the solution domain. The interface between the waters becomes very slowly more diffused with distance downstream and migrates away from the tributary that has the larger discharge (with Qr = 0.62, this is the Vishera), that is toward the true right. The primary velocities reflect the discharge ratio at 0 km (i.e., primary velocities are higher in the Vishera, Figure 5) such that there is some shear between the two tributaries at the junction but these differences decrease progressively with distance downstream as Vishera water slows and Kama water accelerates. The stream function (Figure 5) shows the expected formation of two counter rotating vortices at 0 km downstream, that is in the near-field. The contours show that the intensity of this circulation declines rapidly in magnitude, to less than 5% of the 0 m values by only two multiples of the post-junction width (1000 m) downstream. The Kama cell declines in cross-section extent and the Vishera increases, as the Vishera water migrates to the true right. In the absence of any kind of asymmetry in the near-field (Figure 5, 0 km) the cells remained confined within their respective waters in terms of concentration. The stream function also reveals the presence of spatially restricted Prandtl Type 2 secondary circulation attached to the banks and there is perhaps some evidence that these interact with the channel scale secondary circulation reflected in the splitting of the true right vortex on the Kama side of the channel.
Figure 6 shows the patterns of entropy in concentration and velocity and the secondary flow intensity (Fs). The entropy in concentration reflects the evidence in Figure 5 for Qr = 0.62 for all discharge ratios; the entropy declines only very slowly throughout the simulation domain such that Kama and Vishera water remains unmixed by 8 km downstream. There is a slightly higher rate of decay to 1000 m, and a very slightly higher level of entropy for Qr = 1.99 than Qr = 0.76 and for Qr = 0.76 than for Qr = 0.62; that is a very weak discharge ratio effect. Mirroring these changes, the entropy in velocity tends rapidly to zero, suggesting a tendency to velocity homogeneity in the near-field, reflected also in Figure 5. It never falls perfectly to zero because there is always shear on the bed and the banks. The secondary flow intensity drops to almost zero within 500 m (i.e., one post junction channel width) distance downstream. These results point to only a weak potential for advective processes to cause mixing in the near field, with the secondary flow in the two rivers serving to keep their waters separate (Figure 5).

3.2. P Simulations: Natural Planform, Regular Bathymetry

Figure 4 also shows the predicted near bed concentrations for the P simulations. As with the R simulations, the river does not completely mix for the downstream distance that is studied here and Kama and Vishera waters are clearly identifiable at the downstream end of the domain for all values of Qr. Figure 7 also shows that the two rivers remain poorly mixed for Qr = 0.62. The primary velocities are more asymmetric than the R case, and this asymmetry remains throughout, albeit decreasing in intensity. With the Qr used here, the initial secondary circulation intensity in the near field (as represented by secondary fluxes in Figure 7, 0 km) is greater in the Kama but lower in the Vishera than with the R case (Figure 5, 0 km). This reflects the direction of planform curvature of the post-junction channel which when compared with the R case is in the same sense in the Vishera but in the opposite sense in the Kama. Thus, the angle of turn for the Vishera is reduced and that for the Kama is increased, explaining this difference. The decline in secondary circulation in moving from the near-field to the far-field is also slower, with more intense secondary circulation for the R case for both Kama originating and Vishera originating water by 1 km downstream. The secondary circulation cells for the first 1000 km (Figure 7) suggest that there is sufficient asymmetry for the Vishera cell to extend into Kama water and so it is perhaps surprising that the mixing rate is not more rapid. However, this only occurs for a short distance (100 s of m). With the flux values in Figure 7 at 1000 m downstream, complete cross-channel mixing would take 1000 s of m distance downstream and it is clear that by 2000 m downstream the Vishera cell no longer crosses the mixing interface. After 2 km downstream, the secondary flux becomes more complex to interpret as it is influenced by mid-channel bars, which impart flow curvature and also major changes in the w:d ratio. For instance, the bar at 4 km causes the curvature of both Kama- and Vishera-derived waters to reverse and the result is a reversal in the direction of secondary circulation (Figure 7).
Figure 8 shows the downstream changes in entropy of concentration and velocity and secondary circulation intensity. As reflected in Figure 4, there is only a very slow reduction in the concentration entropy for all values of Qr. As with the R simulations the velocity entropy declines rapidly in the near-field to 1000 km. However, there is also evidence that the downstream mid-channel bars lead to increases and decreases in velocity entropy. This is most notable for the first mid-channel bar (Figure 2b). However, this does not result in any real increase in secondary circulation (Figure 8), suggesting that the entropy comes from an increase in the total wetted perimeter (and so the number of boundary cells with low velocity) and flow acceleration into the true right branch of the mid-channel bar (Figure 7). This may explain why the far-field, and mid-channel bars in particular, has little impact on mixing in the P case (Figure 4, Figure 7 and Figure 8).

3.3. N Simulations: Natural Planform and Bathymetry

Figure 4 also shows the near-bed patterns of mixing for the N simulations (i.e., natural planform and measured bathymetry). As compared with the R and P cases (Figure 4), there is now both substantial mixing and a much stronger dependence on the discharge ratio. Figure 4 (Qr = 1.99) shows that when the Kama has a greater discharge than the Vishera, the Kama remains unmixed for a much further distance downstream. Comparison of Figure 4 with Figure 3 is also interesting. Figure 3 is the validation scenario with the Qr closest to 1, but also substantially higher discharges in both the Kama and the Vishera reflecting an unusually cold and wet summer. In this situation, the rivers were observed and modelled as mixing much less significantly (Figure 3) than in 2018, the focus of the R, P, and N simulations in this study.
Figure 9 shows the plots equivalent to Figure 5 and Figure 7 but for N simulations: changes in concentration, primary velocity, and stream function with distance downstream. Comparison with Figure 7 suggests differences in both the near-field and the far-field. In terms of concentration, the interface between the Vishera and the Kama becomes more diffuse more rapidly. Both the Vishera and the Kama have high magnitude primary velocity cores that remain distinct for further downstream. The stream function evolves rapidly. In the near-field with the real bathymetry (0 km), there are two vortices at the interface weaker as compared with the R and P simulations for Qr = 0.62, but these are displaced toward the Kama (the true right) suggesting that the real bathymetry modifies near field processes in a way that is likely to enhance mixing further upstream in the near-field zone. There is a second vortex on the Vishera side of the channel coincident with its high primary velocity core. By 500 m downstream, there is a single large vortex aligned directly over the mixing interface and two sub-vortices, one also aligned over the mixing interface and one entirely within the Vishera. The presence of a submerged mid-channel bar suggests the possibility of significant local topographic forcing and there is consistent flux of water from the true left to the true right over the bar because of the larger-scale vortex. The magnitude of this vortex is lower on the Vishera side and higher on the Kama side than with the R and P simulations at 500 m downstream; but what is more important is the development of a single vortex that would be capable of fluxing Vishera water toward the Kama at altitude, and vice versa at depth. The presence of a significant vortex on the Vishera side of the channel is consistent with the direction of curvature of the Vishera. The secondary circulation flux becomes more intense by 1000 m downstream and has evolved into a single vortex at the scale of the entire post-confluence channel by 2000 m downstream. At 4000 m, the channel is divided either side of an emergent mid-channel bar. The mixing interface has taken the true left (Vishera) side of the channel but the channel is more mixed than with either the R or the P cases.
As compared with the R (Figure 6) and P (Figure 8) cases, and for all values of Qr, the entropy in concentration reduces to almost zero by 8000 m downstream (Figure 10). The entropy in velocity falls to 2000 m, then varies systematically because of the presence of islands, which increase the flow inhomogeneities and hence entropy as in the P case. The secondary flow intensity is much higher in magnitude. It declines to 2000 m downstream, more slowly than in the R and P cases (Figure 6 and Figure 8), but then there is evidence of high magnitude secondary flow intensity notably in relation to variations in the far-field bathymetry and channel planform. This is also reflected in Figure 9. The entropy in concentration shows a much stronger dependence on Qr than with the regular geometry. It is maintained at much higher levels to 4000 km downstream (see also Figure 4) when the Kama has a bigger discharge than the Vishera (Qr = 1.99) in this case. The concentration entropy when the Vishera is dominant (Qr < 1) declines more rapidly. We argue that this Qr effect is related to the direction of curvature in the downstream post-confluence channel, that is the far field. The curvature-driven component of secondary circulation in a curved channel has a linear dependence on the square of the streamwise velocity and an inverse dependence on the radius of curvature. When the Vishera has a relatively higher discharge, and so a relatively higher streamwise velocity, this acts in the same direction as the radius of curvature (Figure 4) aiding the development of a stronger streamwise vortex than the Kama’s, hence encouraging mixing. When the Kama has a bigger discharge, while the initial curvature into the confluence is likely to produce a stronger streamwise vortex, the downstream curvature of the post-confluence channel is in the opposite direction. The latter would serve to maintain two more equal counter rotating vortices for longer and so reducing the mixing.

4. Discussion

The results of this numerical study suggest that the planform and in particular the natural bathymetry downstream of channel junctions can enhance rates of mixing of the two confluent channels, even after decay of the lateral and vertical secondary fluxes created because of reverse tributary curvature in the near-field zone. For all three of the discharge ratios considered in this study, significant mixing had occurred within 8000 m of the junction in the N case, with measured planform and bathymetry, that is about 8 multiples of the post confluence channel width. Channel-scale secondary circulation driven by bed discordance can produce almost complete mixing of incoming flows a few channel widths downstream both of small [35] and large [5] confluences. At small confluences with little bed discordance (typically 10 s of m in width), rapid mixing has also been observed within a few multiples of channel width downstream of the junction [40,71]. Lane et al. [5] found that it is the development of channel-scale secondary circulation in the near-field that causes this rapid mixing and that it can, if the conditions are right, lead to rapid mixing even in large rivers. The tendency to produce such circulation depends on the interaction between confluence geometry and discharge ratio. Unlike in [5], and also as compared with other studies that have shown that bed discordance can enhance mixing significantly (e.g., [35]), there is no discordance in this study (Figure 2) even though significant mixing occurs. We argue that the reason for this is that under certain conditions, near-field processes can lead to the development of a single channel scale vortex (Figure 9). This has already been shown to be important for rapid mixing at smaller confluences [40]. Here we show it can also apply to much larger rivers. This is perhaps surprising as other studies either found it to be absent [47] or present under only certain discharge ratio conditions [5].
Comparison of the P case (Figure 7) and the N case (Figure 9) suggests that the planform curvature on its own is insufficient to create the channel-scale vortex. Rather it is the interaction between the planform curvature and the stream bed bathymetry that matters. While long-established theoretical analyses have been able to represent planform curvature effects on lateral mixing coefficients (e.g., [72,73,74]) there is relatively little work that looks at how these need to be modified to take into account the secondary circulation associated with the near-field zone of river junctions and, in the far field zone, the effects of mid channel bars and natural channel bed bathymetry on mixing rates.
Without bathymetric and planform forcing, the R simulations show little evidence that Taylor type dispersion has a significant effect on the mixing process, similar to the observations of others for large rivers [5]. Indeed, R simulations suggest that rates of mixing decline rapidly (Figure 4) in the straight channel downstream of the junction, while the entropy in velocity (Figure 5) and the near-field secondary circulation (Figure 5 and Figure 6) decline rapidly. In the absence of significant velocity entropy, there cannot be significant shear in the flow. As Rhoads and Sukhodolov [32] observed for a much smaller confluence, the result is the continued presence of a mixing interface but with little or no shear between the two (e.g., Figure 5) confluent flows. Discharge, and hence momentum effects seem to be relatively unimportant in enhancing the mixing rate, which has also been observed in numerical simulations of confluences with no discordance [20,29]. In this study, the numerical results show that distinct Kama-originating and Vishera-originating water can be seen throughout the 11-km length of river that is simulated if the planform and the bathymetry are regular. Inclusion of planform curvature and mid-channel bars (P simulations) in the sense of the Vishera tributary did not seem to contribute to more rapid mixing (Figure 4 and Figure 8), despite the shift of the mixing face (Figure 7) toward the outer bank as defined by the curvature (i.e., the true right).
The results confirm that the discharge ratio conditions how the bathymetry and planform curvature influence mixing. The Kama always has to go through an inflexion in the direction of curvature (see [75]) from clockwise upstream of the junction to anti-clockwise in the post-confluence channel. If the Kama has a higher discharge and hence streamwise velocity, the force required to do this will be greater and so explains why mixing becomes somewhat slower. Thus, the discharge ratio conditions the extent to which downstream channel curvature affects the rate of mixing. There was also evidence (comparison of Figure 3 and Figure 4) that with a higher discharge in both channels, and a Qr closer to 1, complete mixing was also delayed. The effect of the higher discharges will be higher longitudinal mean velocity which theory suggests should increase the longitudinal distance required for complete mixing (e.g., [72,73,74]).
An interesting question then arises: are the effects of bathymetry and planform curvature on secondary circulation a function only of large-scale pressure gradients in the flow, or are they modified also by Prandtl Type 2 secondary circulation. We hypothesized above it was possible to see some Prandtl Type 2 secondary circulation for the R case close to the channel banks. As a preliminary test of the effects of turbulence anisotropy on mixing we undertook an additional simulation where we replaced the Reynolds Stress Model with a standard k-ε turbulence model using the default parameters in [76]), for measured discharges in the Kama of 1480 m3·s−1 and Vishera of 2940 m3·s−1. Figure 11 shows the simulated mixing at the surface (Figure 11a,b). In qualitative terms, it suggests that the inclusion of turbulence anisotropy (Figure 11b) makes very little difference to the mixing process as compared with bathymetric effects (Figure 4). Simulations for the full set of R, P, and N simulations may be of value to test this further and these conclusions may also depend upon the kind of model used to represent the effects of turbulent anisotropy on secondary circulation; but these initial tests suggest that the effect of Prandtl Type 2 secondary circulation on the mixing process is relatively small.
In this study, we have not considered all of the processes that are likely to influence the mixing rates. Most notably, we have not included consideration of density differences which even if small can influence the mixing process (e.g., [6,9,37,38,39,40,41]), notably in the presence of discordance. There are no significant density differences between the two rivers studied here but further work is needed to quantify their potential effects. Second, as Figure 2 shows, there are two different sources of bathymetric irregularity as compared with the regular case: channel curvature and mid-channel bars. Again, this study does not tease out the relative contribution of these effect although there does seem to be significant mixing by 2000 m downstream in the N simulations (Figure 9 and Figure 10) where the primary feature appears to be a large channel scale helical cell. Third, it is important to be aware of the limitations of the experimental design. The use of the natural bathymetry has the effect of increasing primary velocity magnitudes (compare Figure 7 and Figure 9) because the flow is distributed across a smaller cross-sectional area. This should not affect the qualitative interpretation of our results; if anything, the faster primary flow in the N case should increase the distance required for complete mixing due to downstream advection effects [74] whereas our N simulations suggest much more rapid mixing as compared with the R and P cases. Indeed, designing experiments that maintain correct widths and depths as well as w:d ratios when an irregular bathymetry and planform is transformed to a regular one is a challenge. Finally, the validation of these numerical simulations is qualitative and based upon a single date (Figure 3b). Although the level of agreement was qualitatively strong, it is important that field datasets are assimilated that allow mixing to be quantified and influencing factors identified, including the relative contribution of secondary circulation due to turbulence anisotropy.

5. Conclusions

This paper has presented a numerical study of mixing processes of two tributaries of a large (1 km width post confluence) river. By comparing a simulation undertaken with a regular bathymetry and the natural bathymetry measured in a field study, the simulations suggest that mixing occurs slowly in the former and much more rapidly in the latter. Inspection of the numerical results suggests that this is due to both increase in intensity of secondary circulation at the junction (in the near field) and the formation of a single channel-scale vortex downstream of the junction (in the far-field). The latter appears to be aided by curvature of the post-junction channel, suggesting that an observation made for much smaller channels [40] may also apply to much wider rivers despite them having relatively high width to depth ratios. Interactions with discharge ratio were also observed. As these results are based upon numerical simulation, field data collection should also be undertaken to verify the conclusions reached. If they hold, long-established theoretical models of the rates at which confluent rivers mix will need to be modified to represent the ways in which irregular bathymetry interacts with discharge (and momentum flux) ratio so as to determine the extent to which single channel-scale vortices form downstream of river junctions, hence influencing the mixing rates.

Author Contributions

The project was conceptualised and led by T.P.L., who was also responsible for the numerical simulations with Y.N.P. and V.Y.K.; field data collection was led by A.P.L.; S.N.L. analysed model outputs; initial drafts of the paper were prepared by T.P.L. and S.N.L.; C.G. and B.R. contributed to the reviewing and editing of previous versions of the paper. All authors have read and agreed to the published version of the manuscript.

Funding

The study was carried out with the financial support of the Russian Foundation for Basic Research (Grant No. 19-41-59001), the Government of the Perm Krai (Project No. C-26/788 for the support of International Research Teams) and the Swiss National Science Foundation grant 200021_160020.

Acknowledgments

Three anonymous reviewers provided very valuable comments on the first version of this paper.

Conflicts of Interest

The authors declare no conflict of interest.

References

  1. MacKay, J.R. Lateral mixing of the Laird and Mackenzie rivers downstream from their confluence. Can. J. Earth Sci. 1970, 7, 111–124. [Google Scholar] [CrossRef]
  2. Matsui, E.; Salati, F.; Friedman, I.; Brinkman, W.L.F. Isotopic hydrology of the Amazonia, 2, Relative discharge of the Negro and Solimões rivers through 18O concentrations. Water Resour. Res. 1976, 12, 781–785. [Google Scholar] [CrossRef]
  3. Weibezahn, F.H. Downstream natural mixing of water from the Orinoco, Atabapo and Guaviare rivers. Eos Trans. AGU 1983, 644, 699. [Google Scholar]
  4. Stallard, R.F. Cross-channel mixing and its effect on sedimentation in the Orinoco River. Water Resour. Res. 1987, 23, 1977–1986. [Google Scholar] [CrossRef]
  5. Lane, S.N.; Parsons, D.R.; Best, J.L.; Orfeo, O.; Kostaschuk, R.; Hardy, R.J. Causes of rapid mixing at a junction of two large rivers: Río Paraná and Río Paraguay, Argentina. J. Geophys. Res. Earth Surf. 2008, 113, F02019. [Google Scholar] [CrossRef] [Green Version]
  6. Laraque, A.; Guyot, J.; Filizola, N. Mixing processes in the Amazon River at the confluences of the Negro and Solimões Rivers, Encontro das Aguas, Brazil. Hydrol. Process. 2009, 23, 3131–3140. [Google Scholar] [CrossRef]
  7. Bouchez, J.; Lajeunesse, E.; Gaillardet, J.; France-Lanord, C.; Dutra-Maia, P.; Maurice, L. Turbulent mixing in the Amazon River: The isotopic memory of confluences. Earth Planet. Sci. Lett. 2010, 290, 37–43. [Google Scholar] [CrossRef]
  8. Gualtieri, C.; Filizola, N.; Oliveira, M.; Santos, A.M.; Ianniruberto, M. A field study of the confluence between Negro and Solimões Rivers. Part 1: Hydrodynamics and sediment transport. C. R. Geosci. 2018, 350, 31–42. [Google Scholar] [CrossRef]
  9. Gualtieri, C.; Ianniruberto, M.; Filizola, N. On the mixing of rivers with a difference in density: The case of the Negro/Solimões confluence, Brazil. J. Hydrol. 2019, 578, 124029. [Google Scholar] [CrossRef]
  10. Schmidt, W. Der Massenaustausch in Freier Luft und Verwandte Erscheinugen; H. Grandamburg: Hamburg, Germany, 1925. [Google Scholar]
  11. Makkaveev, V.M. On the distribution of solutions in the turbulent flow and the chemical method of measuring the flow. Zap. GGI 1933, 10, 229–246. [Google Scholar]
  12. Fischer, H.B. Dispersion predictions in natural streams. J. Sanit. Eng. Div. 1968, 94, 927–943. [Google Scholar]
  13. Fischer, H.B.; List, E.J.; Koh, R.C.Y.; Imberger, J.; Brooks, N.H. Mixing in Inland and Coastal Waters; Academic Press: Cambridge, MA, USA, 1979; 483p. [Google Scholar]
  14. Rutherford, J. River Mixing; Wiley: Chichester, UK, 1994. [Google Scholar]
  15. Taylor, E.H. Flow characteristics at rectangular open-channel junctions. Trans. Am. Soc. Civ. Eng. 1944, 109, 893–912. [Google Scholar]
  16. Einstein, A. The cause of the formation of meanders in the courses of rivers and of the so-called Baer’s Law. In Ideas and Opinions; Bonanza Books: New York, NY, USA, 1954; pp. 249–253. [Google Scholar]
  17. Rhoads, B.L.; Kenworthy, S.T. Flow structure at an asymmetrical stream confluence. Geomorphology 1995, 11, 273–293. [Google Scholar] [CrossRef]
  18. Mosley, M.P. An experimental study of channel confluences. J. Geol. 1976, 84, 535–562. [Google Scholar] [CrossRef]
  19. Ashmore, P.E.; Ferguson, R.I.; Prestegaard, K.L.; Ashworth, P.J.; Paola, C. Secondary flow in anabranch confluences of a braided, gravel-bed stream. Earth Surf. Process. Landf. 1992, 17, 299–311. [Google Scholar] [CrossRef]
  20. Bradbrook, K.F.; Lane, S.N.; Richards, K.S.; Biron, P.M.; Roy, A.G. Flow structures and mixing at an asymmetrical open-channel confluence: A numerical study. J. Hydraul. Eng. 2001, 127, 351–368. [Google Scholar] [CrossRef]
  21. Huang, J.C.; Weber, L.J.; Lai, Y.G. Three-dimensional numerical study of flows in open-channel junctions. J. Hydraul. Eng. 2002, 128, 268–280. [Google Scholar] [CrossRef]
  22. Kennedy, B.A. On Playfair’s law of accordant junctions. Earth Surf. Process. Landf. 1984, 9, 153–173. [Google Scholar] [CrossRef]
  23. Best, J.L. The morphology of river channel confluences. Prog. Phys. Geogr. 1986, 10, 157–174. [Google Scholar] [CrossRef]
  24. Best, J.L. Flow dynamics at river channel confluences: Implications for sediment transport and bed morphology. In Recent Developments in Fluvial Sedimentology; Special Publication; SEPM Society of Sedimentary Geology: Tulsa, OK, USA, 1987; pp. 27–35. [Google Scholar]
  25. Best, J.L. Sediment transport and bed morphology at river channel confluences. Sedimentology 1988, 35, 481–498. [Google Scholar] [CrossRef]
  26. Best, J.L.; Roy, A.G. Mixing layer distortion at the confluence of channels of unequal depth. Nature 1991, 350, 411–413. [Google Scholar] [CrossRef]
  27. Biron, P.M.; Best, J.L.; Roy, A.G. Effects of bed discordance on flow dynamics at open channel confluences. J. Hydraul. Eng. 1996, 122, 676–682. [Google Scholar] [CrossRef]
  28. Biron, P.M.; Roy, A.G.; Best, J.L. Turbulent flow structure at concordant and discordant open-channel confluences. Exp. Fluids 1996, 21, 437–446. [Google Scholar] [CrossRef]
  29. Bradbrook, K.F.; Biron, P.; Lane, S.N.; Richards, K.S.; Roy, A.G. Investigation of controls on secondary circulation and mixing processes in a simple confluence geometry using a three-dimensional numerical model. Hydrol. Process. 1998, 12, 1371–1396. [Google Scholar] [CrossRef]
  30. Rhoads, B.L.; Sukhodolov, A.N. Spatial and temporal structure of shear layer turbulence at a stream confluence. Water Resour. Res. 2004, 40, W06304. [Google Scholar] [CrossRef]
  31. Rhoads, B.L.; Sukhodolov, A.N. Lateral momentum flux and the spatial evolution of flow within a confluence mixing interface. Water Resour. Res. 2008, 44, W08440. [Google Scholar] [CrossRef]
  32. Rhoads, B.L.; Sukhodolov, A.N. Field investigation of three-dimensional flow structure at stream confluences, Spatial and temporal structure of shear layer turbulence at a stream confluence. Water Resour. Res. 2001, 37, 2393–2410. [Google Scholar] [CrossRef]
  33. Cushman-Roisin, B.; Constantinescu, G.S. Dynamical adjustment of two streams past their confluence. J. Hydraul. Res. 2020, 58, 305–313. [Google Scholar] [CrossRef]
  34. Konsoer, K.M.; Rhoads, B.L. Spatial-temporal structure of mixing interface turbulence at two large river confluences. Environ. Fluid Mech. 2014, 14, 1043–1070. [Google Scholar] [CrossRef]
  35. Gaudet, J.M.; Roy, A.G. Effect of bed morphology on flow mixing length at river confluences. Nature 1995, 373, 138–139. [Google Scholar] [CrossRef]
  36. Biron, P.M.; Ramamurthy, A.S.; Han, S. Three-dimensional numerical modeling of mixing at river confluences. J. Hydraul. Eng. 2004, 130, 243–253. [Google Scholar] [CrossRef]
  37. Lyubimova, T.; Lepikhin, A.; Parshakova, Y.; Konovalov, V.; Tiunov, A. Formation of the density currents in the zone of confluence of two rivers. J. Hydrol. 2014, 508, 328–342. [Google Scholar] [CrossRef]
  38. Ramon, C.L.; Armengol, J.; Dolz, J.; Prats, J.; Rueda, F.J. Mixing dynamics at the confluence of two large rivers undergoing weak density variations. J. Geophys. Res. Ocean. 2014, 119, 2386–2402. [Google Scholar] [CrossRef]
  39. Ramon, C.L.; Prats, J.; Rueda, F.J. The influence of flow inertia, buoyancy, wind, and flow unsteadiness on mixing at the asymmetrical confluence of two large rivers. J. Hydrol. 2016, 539, 11–26. [Google Scholar] [CrossRef]
  40. Lewis, Q.W.; Rhoads, B.L. Rates and patterns of thermal mixing at a small stream confluence under variable incoming flow conditions. Hydrol. Process. 2015, 29, 4442–4456. [Google Scholar] [CrossRef]
  41. Herrero, S.H.; Jose, M.D.L.; Garcia, M.G.; Ricardo, N.S.; Best, J.L.; Mariana, P. The influence of tributary flow density differences on the hydrodynamic behavior of a confluent meander bend and implications for flow mixing. Geomorphology 2018, 304, 99–112. [Google Scholar] [CrossRef]
  42. Cheng, Z.; Constantinescu, G. Stratification effects on flow hydrodynamics and mixing at a confluence with a highly discordant bed and a relatively low velocity ratio. Water Resour. Res. 2018, 54, 4537–4562. [Google Scholar] [CrossRef]
  43. Constantinescu, G.; Miyawaki, S.; Rhoads, B.; Sukhodolov, A. Numerical evaluation of the effects of planform geometry and inflow conditions on flow, turbulence structure, and bed shear velocity at a stream confluence with a concordant bed. J. Geophys. Res. Earth Surf. 2014, 119, 2079–2097. [Google Scholar] [CrossRef]
  44. Constantinescu, G.; Miyawaki, S.; Rhoads, B.; Sukhodolov, A. Influence of planform geometry and momentum ratio on thermal mixing at a stream confluence with a concordant bed. Environ. Fluid Mech. 2016, 16, 845–873. [Google Scholar] [CrossRef]
  45. Chen, X.; Zhu, D.Z.; Steffler, P.M. Secondary currents induced mixing at channel confluences. Can. J. Civ. Eng. 2017, 44, 1071–1083. [Google Scholar] [CrossRef] [Green Version]
  46. Tang, H.; Zhang, H.; Yuan, S. Hydrodynamics and contaminant transport on a degraded bed at a 90-degree channel confluence. Environ. Fluid Mech. 2018, 18, 443–463. [Google Scholar] [CrossRef]
  47. Parsons, D.R.; Best, J.L.; Lane, S.N.; Orfeo, O.; Hardy, R.J.; Kostaschuk, R. Form roughness and the absence of secondary flow in a large confluence-diffluence, Paraná River, Argentina. Earth Surf. Process. Landf. 2007, 32, 155–162. [Google Scholar] [CrossRef]
  48. Szupiany, R.N.; Amsler, M.L.; Parsons, D.R.; Best, J.L. Morphology, flow structure, and suspended bed sediment transport at two large braid-bar confluences. Water Resour. Res. 2009, 45, W05415. [Google Scholar] [CrossRef] [Green Version]
  49. Hickin, E.J. Mean flow structure in meanders of the Squamish River, British Columbia. Can. J. Earth Sci. 1978, 15, 1833–1849. [Google Scholar] [CrossRef] [Green Version]
  50. Kashyap, S.; Constantinescu, G.; Rennie, C.D.; Post, G.; Townsend, R. Influence of channel aspect ratio and curvature on flow, secondary circulation, and bed shear stress in a rectangular channel bend. J. Hydraul. Eng. 2012, 138, 1045–1059. [Google Scholar] [CrossRef]
  51. Dietrich, W.E.; Smith, J.D. Influence of the point bar on flow through curved channels. Water Resour. Res. 1983, 19, 1173–1192. [Google Scholar] [CrossRef]
  52. Shakibaeinia, A.; Tabatabai, M.R.M.; Zarrati, A.R. Three-dimensional numerical study of flow structure in channel confluences. Can. J. Civ. Eng. 2010, 37, 772–781. [Google Scholar] [CrossRef]
  53. Ramamurthy, A.S.; Zhu, W. Combining flow in 90° junctions of rectangular conduit. J. Hydraul. Eng. 1997, 123, 1012–1019. [Google Scholar] [CrossRef]
  54. Schindfessel, L.; Creelle, S.; De Mulder, T. How different cross-sectional shapes influence the separation zone of an open-channel confluence. J. Hydraul. Eng. 2017, 143, 04017036. [Google Scholar] [CrossRef]
  55. ASME. Statement upon the control of numerical accuracy. J. Fluids Eng. 1993, 115, 339–340. [Google Scholar]
  56. ASME. Perspective: Journal of Fluids Engineering Editorial Policy Statement on the Control of Numerical Accuracy. J. Fluids Eng. 2009, 115, 339–340. [Google Scholar]
  57. Lane, S.N.; Hardy, R.J.; Ferguson, R.I.; Parsons, D.R. A framework for model verification and validation of CFD schemes in natural open channel flows. In Computational Fluid Dynamics: Applications in Environmental Hydraulics; Bates, P.D., Lane, S.N., Ferguson, R.I., Eds.; John Wiley & Sons: Chichester, UK, 2005. [Google Scholar]
  58. Blocken, B.; Gualtieri, C. Ten iterative steps for model development and evaluation applied to computational fluid dynamics for environmental fluid mechanics. Environ. Model. Softw. 2012, 33, 1–22. [Google Scholar] [CrossRef]
  59. Blanckaert, K.; de Vriend, H.J. Secondary flow in sharp open-channel bends. J. Fluid Mech. 2004, 498, 353–380. [Google Scholar] [CrossRef] [Green Version]
  60. Hua, C.W.; Yu, M.H.; Wei, H.Y.; Liu, C.J. The mechanisms of energy transformation in sharp open-channel bends: Analysis based on experiments in a laboratory flume. J. Hydrol. 2019, 571, 723–739. [Google Scholar] [CrossRef]
  61. Kang, H.; Choi, S. Reynolds stress modelling of rectangular open-channel flow. Int. J. Numer. Methods Fluids 2006, 51, 1319–1334. [Google Scholar] [CrossRef]
  62. Choi, S.-U.; Park, M.; Kang, H. Numerical simulations of cellular secondary currents and suspended sediment transport in open-channel flows over smooth-rough bed strips. J. Hydraul. Res. 2007, 45, 829–840. [Google Scholar] [CrossRef]
  63. Wu, L.; Long, T.; Lu, X. Improvement of separation efficiency and production capacity of a hydrocyclone. Water Sci. Technol. Water Supply 2012, 12, 281–299. [Google Scholar] [CrossRef]
  64. Han, S.S.; Biron, P.M.; Ramamurthy, A.S. Three-dimensional modelling of flow in sharp open-channel bends with vanes. J. Hydraul. Res. 2011, 49, 64–72. [Google Scholar] [CrossRef]
  65. Safarzadeh, A.; Brevis, W. Assessment of 3D-RANS models for the simulation of topographically forced shallow flows. J. Hydrol. Hydromech. 2016, 64, 83–90. [Google Scholar] [CrossRef] [Green Version]
  66. Blanckaert, K. Flow separation at convex banks in open channels. J. Fluid Mech. 2015, 779, 432–467. [Google Scholar] [CrossRef]
  67. Gualtieri, C.; Angeloudis, A.; Bombardelli, F.A.; Jha, S.; Stoesser, T. On the values for the turbulent Schmidt number in environmental flows. Fluids 2017, 2, 17. [Google Scholar] [CrossRef] [Green Version]
  68. Paik, J.; Sotiropoulos, F. Coherent structure dynamics upstream of a long rectangular block at the side of a large aspect ratio channel. Phys. Fluids 2005, 17, 115104. [Google Scholar] [CrossRef]
  69. Lane, S.N.; Bradbrook, K.F.; Richards, K.S.; Biron, P.M.; Roy, A.G. Secondary circulation in river channel confluences: Measurement myth or coherent flow structure? Hydrol. Process. 2000, 14, 2047–2071. [Google Scholar] [CrossRef]
  70. Arfken, G.B.; Weber, H.J. Mathematical Methods for Physicists, 4th ed.; Academic Press: San Diego, CA, USA, 1995; pp. 92–93. [Google Scholar]
  71. Rhoads, B.L.; Johnson, K.K. Three-dimensional flow structure, morphodynamics, suspended sediment, and thermal mixing at an asymmetrical river confluence of a straight tributary and curving main channel. Geomorphology 2018, 323, 51–69. [Google Scholar] [CrossRef]
  72. Fischer, H.B. The effect of bends on dispersion in streams. Water Resour. Res. 1969, 5, 496–506. [Google Scholar] [CrossRef]
  73. Fukuoka, S.; Sayre, W.W. Longitudinal dispersion in sinuous channels. J. Hydraul. Div. 1973, 99, 195–217. [Google Scholar]
  74. Yotsukura, N.; Sayre, W.W. Transverse mixing in natural channels. Water Resour. Res. 1976, 12, 695–704. [Google Scholar] [CrossRef]
  75. Bradbrook, K.F.; Lane, S.N.; Richards, K.S. Numerical simulation of time-averaged flow structure at river channel confluences. Water Resour. Res. 2000, 36, 2731–2746. [Google Scholar] [CrossRef] [Green Version]
  76. Launder, B.E.; Spalding, D.B. The numerical computation of turbulent flow. Comput. Methods Appl. Mech. Eng. 1974, 3, 269–289. [Google Scholar] [CrossRef]
Figure 1. Time-series of discharges in the Kama and Vishera rivers and the associated discharge ratios.
Water 12 02969 g001
Figure 2. The junction of the Vishera and Kama rivers in the region of Perm, western Urals, Russia, ©GoogleEarth (a) showing the altitude of the river bed measured using a SyQwest HydroBox sonar to get flow depths and dGPS position to convert these into altitudes (b) and the locations of cross-sections used in the analysis (c).
Water 12 02969 g002
Figure 3. The Google Earth image for the Kama-Vishera junction on the 19 July 2019, showing the classified Kama and Vishera water (a). The numerical simulation (b) for the same day showing (black line) the digitized mixing interface from 3a superimposed.
Water 12 02969 g003
Figure 4. Ned bed concentrations for the three discharge ratios for R simulations (regular planform, regular bathymetry), P simulations (natural planform, regular bathymetry) and the N simulations (natural planform, natural bathymetry).
Water 12 02969 g004
Figure 5. Predictions of concentration (left) and primary velocity (right, m·s−1) with the stream function for Qr = 0.62 and the R simulation geometry. Contours of flux are shown (units of m2·s−1) as calculated by the stream function. Plots are viewed looking upstream, such that the Kama is on the left of each plot (i.e., the true right) and the Vishera on the right of each plot (i.e., true left). The contour values are only shown on the primary velocity plots.
Water 12 02969 g005
Figure 6. Longitudinal distribution of entropy of concentration, entropy of velocity, and secondary flow intensity for different values of the discharge ratio for the R simulations.
Water 12 02969 g006
Figure 7. Predictions of concentration (left) and primary velocity (right, m·s−1) with the stream function for Qr = 0.62 and the P simulation geometry. Contours of flux are shown (units of m2·s−1) as calculated by the stream function. Plots are viewed looking upstream, such that the Kama is on the left of each plot (i.e., the true right) and the Vishera on the right of each plot (i.e., true left). The contour values are only shown on the primary velocity plots.
Water 12 02969 g007
Figure 8. Longitudinal distribution of entropy of concentration, entropy of velocity and secondary flow intensity for different values of the discharge ratio for the P simulations.
Water 12 02969 g008
Figure 9. Predictions of concentration (left) and primary velocity (right, m·s−1) with the stream function for Qr = 0.62 and the N simulation geometry. Contours of flux are shown (units of m2·s−1) as calculated by the stream function. Plots are viewed looking upstream, such that the Kama is on the left of each plot (i.e., the true right) and the Vishera on the right of each plot (i.e., true left). The contour values are only shown on the primary velocity plots.
Water 12 02969 g009
Figure 10. Longitudinal distribution of entropy of concentration, entropy of velocity, and secondary flow intensity for different values of the discharge ratio for the N simulations.
Water 12 02969 g010
Figure 11. Comparison of the standard k-ε model (a) and the Reynolds Stress model (b) predictions of mixing for a Kama discharge of 1480 m3·s−1 and a Vishera discharge of 2940 m3·s−1.
Water 12 02969 g011
Table 1. Discharge ratios sampled in this study.
SampleDischarge Kama (QKama) m3·s−1Discharge Vishera (QVishera) m3·s−1Discharge Ratio (QKama/QVishera)
30 July 20182604180.62
22 July 20183855080.76
10 September 20185422731.99
Validation data, 19 July 2019101011700.86
Table 2. Tests of sensitivity of the entropy statistics and secondary circulation (see Equations (22) and (23)) to mesh resolution for two cross-sections using the R simulations.
Parameter0 km
−20.5%
0 km
−6.9%
0 km
Base Mesh
0.5 km
−20.5%
0.5 km
−6.9%
0.5 km
Base Mesh
Entropy in concentration0.5960.6010.6010.5390.5720.572
Entropy in velocity0.0320.0310.0310.0100.0160.016
Secondary circulation intensity (m3·s−1)1.3901.5021.7610.0510.0550.055
Publisher’s Note: MDPI stays neutral with regard to jurisdictional claims in published maps and institutional affiliations.