Article

Predicting Groundwater Vulnerability to Geogenic Fluoride Risk: A Screening Method for Malawi and an Opportunity for National Policy Redefinition

1
Department of Civil & Environmental Engineering, University of Strathclyde, Glasgow G1 1XJ, UK
2
The Ministry of Forestry and Natural Resources, Lilongwe Headquarters, Private Bag 390, Lilongwe, Malawi
*
Author to whom correspondence should be addressed.
Water 2020, 12(11), 3123; https://doi.org/10.3390/w12113123
Submission received: 19 October 2020 / Revised: 4 November 2020 / Accepted: 5 November 2020 / Published: 7 November 2020
(This article belongs to the Special Issue Methods and Tools for Assessment of Groundwater)

Abstract

:
Fluoride concentrations in Malawi’s groundwater are primarily controlled by geogenic sources that are highly variable and may cause a heterogeneous fluoride occurrence and local-to-regional variations in fluorosis health risks posed. Our aim was to address the challenge of developing a national solution to predicting groundwater vulnerability to geogenic fluoride risk in the country of Malawi where incidences of fluorosis are reported and typical developing world problems of limited data and resources abound. Previously there have only been sporadic, local-scale studies linking fluoride occurrence with health risks in Malawi with no attempts to tackle the issue nationally. We hence develop a screening method for predicting groundwater vulnerability to geogenic fluoride in the form of detailed risk maps developed from statistical relationships shown between groundwater fluoride occurrence and known geogenic fluoride sources. The approach provides for dynamic update and informed acquisition of new data and hence on-going improving capacity to manage fluoride risks in Malawi. Our screening method provides a technical basis for redefining national fluoride policy to ensure commensurate management of health risks posed. Specifically, the approach provides a pathway for stepped progression from the current 6 mg/L Malawian standard for fluoride in drinking water to adoption of the World Health Organisation 1.5 mg/L guideline standard.

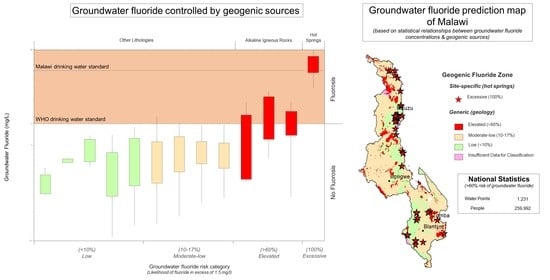
Graphical Abstract

1. Introduction

Over 82% of Malawi’s burgeoning 17.5 million population live in rural areas that are heavily dependent upon groundwater for drinking water supply [1]. Our comprehensive mapping of rural water supplies in Malawi indicate international aid programmes have drilled nearly 60,000 boreholes and wells, most without prior hydrogeological knowledge or assessment of potential geo-hazards, with 24.5% resulting in poor performance and another 14.1% resulting in failure and abandonment [2,3,4]. The proportion suffering from poor water quality is unknown, however issues with iron, salinity, fluoride, and others are widespread [3,5,6,7,8]. Considering the reliance on groundwater in Malawi, significant focus is needed to mitigate risks of geogenic fluoride and to sustainably assess and manage existing supplies. Geogenic fluoride has been identified by the United Nations (UN)’s Joint Monitoring Programme (JMP) as a global-level priority contaminant under Sustainable Development Goal (SDG) 6.1 [9].
Concentrations of fluoride in the range 0.5–1.5 mg/L are beneficial to health in promoting the development of strong bones and teeth. Hence fluoride is often added to drinking water supplies and dental products where supplies fall below these concentrations. Drinking water fluoride concentrations exceeding 1.5 mg/L increases the risk of fluorosis with severity of the condition increasing from dental to skeletal to crippling with greater exposure [10], with children more vulnerable [11]. The World Health Organisation (WHO) recommends 1.5 mg/L for fluoride in drinking water to set a global guideline standard which is aligned with health risks [12]. The current Malawian standard for fluoride in drinking water from boreholes and wells is higher at 6 mg/L [13]. In the drive for SDG 6.1 and in response to the JMP classification of fluoride as a priority chemical contaminant globally, Malawi must review and redefine their fluoride standard and set targets that bring groundwater policy in line with known health risks, whilst assessing and managing existing groundwater supplies.
Endemic fluorosis occurs globally in distinct provinces; including the East African Rift System (EARS) [14] of which Malawi is part [5]. Groundwater fluoride and associated occurrence of fluorosis is well-documented in many EARS countries [15,16,17]. However, there has been only limited research in Malawi where there have been a few documented localities of increased dental fluorosis tentatively linked to increased fluoride based on quite sparse data [18,19,20]. There has been no published assessment of the fluorosis condition nationally and possible linkage to groundwater-derived drinking water supplies.
Fluorine is a naturally-occurring element making up 0.06–0.09% of the Earth’s crust [21]. This occurrence gives rise to geogenic sources of fluoride to groundwater arising from water-rock interactions [5,6,14,18,22]. Alkaline igneous rocks are recognised as a major source of groundwater fluoride due to relatively high concentrations of fluoride-bearing minerals compared to other rock types [6,10,23,24,25]. Higher ratios of fluoride-bearing minerals in rocks result in higher fluoride concentrations in groundwaters and this is reflected in global data (Figure 1). In Malawi, hot springs and alkaline igneous rocks have been identified as significant sources of groundwater fluoride [5,6]. Anthropogenic activities such as the use of fertilisers, large-scale brick-making or industrial processes (aluminium and cement plants) can additionally contribute to fluoride concentrations to groundwater [11,14,26], however, these inputs in groundwater are considered negligible when compared to geogenic sources.
Whilst some geostatistical models have been developed to predict occurrence of groundwater fluoride risks nationally, for instance in India [37] and globally [38], this has not been specifically attempted for Malawi. Fluoride occurrence in Malawi’s groundwater is moderately, but not comprehensively documented; the national dataset available have been recently collated for the first time by ourselves [5] and underpins our approach herein. Two distinct source types are evident: shallow weathering of aquifer rocks of diffuse occurrence; and highly localised hydrothermal inputs from hot springs along rift faults. Our approach herein is further underpinned by relationships found in our recent Central Malawi study setting where we mapped geogenic fluoride risk using statistical relationships identified between groundwater fluoride concentrations and aquifer lithology [6]. Zones of generic geogenic fluoride risk could be mapped, based on the statistical likelihood of a lithology producing groundwater with fluoride concentrations exceeding the WHO standard of 1.5 mg/L. Whilst the method developed used fluoride concentration data with corresponding lithological data, we [6] proposed the method could be extended to cover lithologies without corresponding fluoride concentration data where extrapolations on likely fluoride content may be reasonably made based on the wider international geogenic source literature.
This study expands upon this previous work to investigate existing fluoride-lithology statistical relationships over a wider range of lithologies occurring nationally, and to extrapolate likely fluoride content of rocks where fluoride data were absent. This allowed geological-based mapping of generic geogenic fluoride risk nationally even where groundwater fluoride concentration data are absent. It is recognised though within the Rift Valley setting, structural geological control in the form of faulting may additionally control the occurrence of particularly elevated fluoride due to the provision of pathways to surface of deep-seated hydrothermal, fluoride-rich groundwaters. It is hence proposed hot spring data may be additionally collated to proxy map ‘hot-spot’ site-specific groundwater vulnerability to geogenic fluoride from known hydrothermal sources.
Our goal was hence to develop a geological-based screening method for predicting groundwater vulnerability to geogenic fluoride risk in Malawi nationally, with local-to-regional granularity assessment of risks posed. The methodology aimed to not only make optimal use of existing, often sparse data, but also to direct future acquisition of data enabling on-going improvement in fluoride risk management capacity. The screening method proposed takes the form of detailed geogenic risk maps identifying site-specific ‘hot-spot’ risks signified by known hot spring occurrences overlying a more regional zonation of generic groundwater fluoride risk developed from statistical relationships between groundwater fluoride occurrence and lithological fluoride sources identified within the mapped geology. Combining such risk maps with our wider research programme’s detailed water point mapping across the whole of Malawi may then allow estimation of the numbers of people at risk of fluorosis from every functioning water point, nationally. The above ambitions were substantially achieved. The screening method developed provides the first comprehensive mapping of data-informed vulnerability of Malawi’s groundwater resource to geogenic fluoride and attendant increased risks of fluorosis. The approach informs national policy development through primarily providing a data-informed, risk-based pathway for stepped progression from the current 6 mg/L fluoride Malawian drinking water standard to adoption of the current WHO standard of 1.5 mg/L

2. Materials and Methods

Multiple data sets have been synthesised by us to develop the overall method of predicting and mapping groundwater vulnerability to geogenic fluoride. The approach involved five stages of development which are summarised in Table 1 and discussed in detail below. Some fluoride sources were excluded from this study as they likely have a negligible effect on groundwater fluoride concentrations in Malawi. For example, anthropogenic source via fertilisers high in fluoride can be a viable source of groundwater fluoride where present. A proxy for measurement is a correlation between nitrate (NO3) and fluoride (F) [11], however, no correlation was found in our data and fluoride input from this source was excluded. Fluoride from precipitation has been shown to have mean concentrations in rainfall (in the absence of volcanic emissions and marine aerosols) of one to two orders of magnitude less than those in (Malawian) groundwater (median range: 0.03–0.22 mg/L), the higher end of the range caused by proximity to large-scale aluminium and cement plants which are absent in Malawi [14,26]. Atmospheric input from coal burning or brick making may increase fluoride levels in precipitation, however, in the absence of large-scale industrial processes (e.g., India; China), concentrations will remain within the same precipitation range [14], thus, precipitation as a source was not considered due to Malawi’s predominantly rural, low industry landscape. Surface water fluoride was excluded as concentrations are generally higher than in precipitation, but still within the µg/L range [14]. Additionally, most rivers are were found to be ‘gaining’ rivers in Malawi, therefore any fluoride in river water likely has a groundwater origin [39,40,41]. Seasonal effects on fluoride were excluded due to a negligible effect in Malawi, where minor seasonal variations have comparable spatial trends across the seasons (wet and dry) [18]. Geochemical studies suggest that rock-silicate weathering (of aquifer material) is the dominant source of groundwater fluoride [6,11] and was the focus of this study.

2.1. Stage 1: Groundwater Fluoride Data Collation

A master data set of groundwater fluoride concentrations for Malawi was collated (n = 1126) so that statistical and spatial correlations with geology could be determined. The collation was achieved and discussed within our earlier published works: In brief summary, fluoride data from groundwater quality analyses across Malawi were compiled, and augmented by field work carried out by the Climate Justice Fund: Water Futures Programme (CJF) for the period 2016–2018 [5]. Data were further augmented by our local study in Central Malawi [6]. Hot spring data were collated for this study (n = 63) from published literature [5,42,43,44,45,46] and data provided by the Malawi Ministry of Forestry and Natural Resources (formerly Ministry of Agriculture, Irrigation and Water Development). All data had previously been through QA/QC protocols. The resulting two collated data sets represented both known groundwater fluoride sources in Malawi: (i) A groundwater fluoride concentration data set to represent ‘shallow rock weathering’ source and for use in fluoride-lithology statistical analysis; (ii) A groundwater fluoride concentration data set from hot springs to represent ‘deep hydrothermal’ source and for use in fluoride-hot spring statistical analysis.

2.2. Stage 2: Geological Data Collation and Digitisation

Fluoride concentration data were spatially analysed with respect to geology to calculate fluoride-lithology statistical correlations. Digital geological data were not available for Malawi so had to be digitised from existing, non-digital geological maps [47]. Data from maps were enhanced with lithological and structural detail from geology bulletins and journal publications [48,49,50,51]. Lithological composition was found to be the main control on groundwater fluoride concentrations and extent in the weathered basement aquifer of Malawi [6], so was therefore assumed here as the main control from shallow rock weathering due to the presence or absence of fluoride-bearing minerals [6,10,23,24,25,52]. Each lithology in Malawi was digitised into a geological map per lithological group (shown later) which were determined based on dominant mineralogical composition. In order to view geology in the detail discussed within this study, the geological map was divided into 10 separate maps (Figures S1–S10—Supplementary Materials). Deeper hydrothermal groundwater from hot springs were mapped separately as highly localised, site-specific ‘hot-spot’ sources of particularly elevated fluoride.

2.3. Stage 3: Development of Statistical Relationships and Extrapolations

The method developed for mapping generic geogenic fluoride risk zones outlined by [5] is adapted and scaled nationally here to cover lithologies (zones) which had corresponding groundwater fluoride concentration data and extending to cover those which did not. The previous study calculated fluoride-lithology statistical correlations to develop a generic fluoride risk map covering three lithologies in TA Mazengera [5]. Similarly, the groundwater fluoride data set compiled for this study (n = 1126) was spatially joined with digitised geology in ArcGIS (10.6) and evaluated with corresponding geological attributes for analysis separately in Microsoft Excel (2010). The percentage of groundwater fluoride concentrations > 1.5 mg/L were calculated for 12 lithologies where corresponding groundwater fluoride data from the master groundwater data set occurred. Geogenic fluoride risk categories were then identified using the resulting fluoride-lithology relationships and classified based on the statistical likelihood of a lithology containing groundwater with fluoride concentrations > 1.5 mg/L. Hot springs were calculated separately, regardless of host lithology due to a different groundwater source system (deep hydrothermal). This allowed an accurate fluoride signature of each lithology to be calculated without external influence from a hydrothermal system which would interfere with the results.
For lithologies where corresponding groundwater fluoride data were absent, fluoride-lithology relationships were estimated where suitable extrapolations could be made on likely mineralogical content of rocks and thus, likely generic geogenic fluoride classification. Estimations and extrapolations were based on the observed relationships from this study and augmented by literature where necessary. The dominant mineralogy of each lithology was used to associate individual lithologies with the appropriate risk classification. Lithologies where no similar fluoride-lithology statistical relationships were available from which to extrapolate a classification, or where no suitable justification could be made, were classified simply as ‘Insufficient Data for classification’.
A total of 28 hot springs (those from the collated master hot spring data set that had corresponding groundwater fluoride concentration data) were used to determine a statistical relationship between hot springs and groundwater fluoride concentrations in order to determine a groundwater fluoride risk category for hot springs (i.e., statistical likelihood of a hot spring containing groundwater with fluoride concentrations > 1.5 mg/L). The risk category for hot springs was extrapolated to the remaining 35 hot springs which had no corresponding groundwater fluoride concentration data.

2.4. Stage 4: Development of National Groundwater Risk Maps and Statistics

A national map of geogenic groundwater risk for Malawi was developed (presented later). The map was built in ArcGIS to display zones of statistical geogenic fluoride groundwater risk from shallow rock weathering sources (generic) and deep hydrothermal sources (site-specific-hot springs). In Malawi, water resources are managed at (surface water) catchment-level, so smaller-scale maps were developed for each major catchment, or ‘Water Resource Area’ (WRA) (Figures S11–S27—Supplementary Materials), to facilitate groundwater resource development planning for fluoride by the Government. These maps also demonstrate the ability of our approach to be adapted to any scale.
National statistics were calculated using a master data set of water points. Efforts to develop a ‘live’ national Management Information System (MIS) in Malawi are ongoing and are core to the CJF aim of assisting the Government of Malawi to proactively manage its water supply infrastructure assets [2]. The mWater platform (www.mwater.co) (referred to simply as ‘mWater’) hosts the MIS and manages data for over 120,000 water points in Malawi, mapped and managed in a joint Government of Malawi and CJF venture. The ability to cross reference highly detailed, national water point data with geological data has proven to be a powerful tool as the data were used to identify specific water points which may be at risk from geogenic fluoride. The full water point data set was extracted from mWater and analysed spatially with geology to estimate the number of people at risk from increased groundwater fluoride concentrations from every water point. Each water point contains data on its functional status which are characterised as follows:
  • Functional
  • Partly functional but in need of repair
  • Not functional
  • No longer exists/abandoned
Only “functional” and “partly functional but in need of repair”, direct groundwater abstraction sources were included (n = 49,730). ‘not functional’ water points (n = 4158) were calculated separately as they are continually repaired across the country, therefore, still represent a potential future risk if drawing groundwater from an elevated geogenic fluoride source (Figure 2).
Water point data from mWater (i.e., groundwater abstraction points) were divided per geogenic fluoride zone (defined previously from statistical correlations) so that the exact number of water points in each zone could be calculated. Each water point contained Government of Malawi survey data on the number of people who normally use it, which was used to estimate the number of people at risk from geogenic fluoride (chronic exposure to the same water point was assumed), thus fluorosis, using the geogenic fluoride risk classifications developed within this study. This was performed nationally and calculated statistics for water points and users at risk were presented on the final maps (national and catchment-level) as tables. An additional table of national statistics is presented per district to aid local government in policy review efforts. This study was solely concerned with fluorosis risk arising from chronic consumption of groundwater (home/village water supply) abstracted directly from a geogenic fluoride source. Fluoride exposure complexities arising from consumption of water from multiple sources was out with our scope, therefore, water points with >850 users were excluded as they likely represented heath centres or schools.

2.5. Stage 5: Policy Review and Implications

An assessment of the current Malawian standard documents related to fluoride in drinking water was undertaken. We present a discussion of the value of our screening method in directing the redefinition of Malawi’s fluoride standard along with recommendations on how it may be revised within the context of the SDGs and health risks in Malawi.

3. Results

3.1. Groundwater Data

In total, 1126 groundwater fluoride concentrations from boreholes, shallow wells and natural springs were compiled, along with data for 28 hot springs. (Table 2). The separation of hot springs from other groundwater data allowed both groundwater fluoride source systems (shallow rock weathering vs. deep hydrothermal) to be analysed separately. The average fluoride concentration from the groundwater fluoride data set was 0.97 mg/L, with 87% of samples falling within the WHO standard for fluoride in drinking water of 1.5 mg/L. The remaining 13% had concentrations < 6 mg/L, with one outlier at 10.63 mg/L from a shallow well. Hot springs had significantly higher fluoride concentrations: all hot springs with corresponding fluoride concentration data (n = 28) exceeded the WHO standard, with an average of 6.38 mg/L.

3.2. Geological Data

85 separate lithologies in Malawi were identified and digitised from existing geological maps (Figure 3b), which were sub-divided into 10 main lithological groups (Figure 3a). The geology of Malawi was additionally split into 10 separate maps (spatial cuts) so that detail at the relevant scales discussed in this study can be viewed with ease (Figures S1–S10—Supplementary Materials). The maps additionally display major faulting associated with rifting and the locations of all 63 known hot springs.

3.3. Statistical Relationships and Extrapolations

The results of spatial analysis of both groundwater data sets (groundwater fluoride and hot springs) allowed statistical relationships between fluoride concentrations in groundwater and aquifer lithology/hot springs to be classified. Six classifications were developed based on the statistical likelihood of encountering groundwater fluoride concentrations which exceed the WHO drinking water guideline standard of 1.5 mg/L (Table 3).
Water points from our groundwater data set occur within 12 of Malawi’s 85 specific lithologies. The plot of 12 lithologies (plus hot springs) with georeferenced fluoride data confirms statistical risk categories can be assigned to lithologies where hydrochemical data for fluoride exist (Figure 4). Sample numbers vary for different lithologies (n = 3 to 678) (Figure 4), showing increased confidence for lithologies with higher sample numbers and decreasing confidence for those with lower sample numbers.
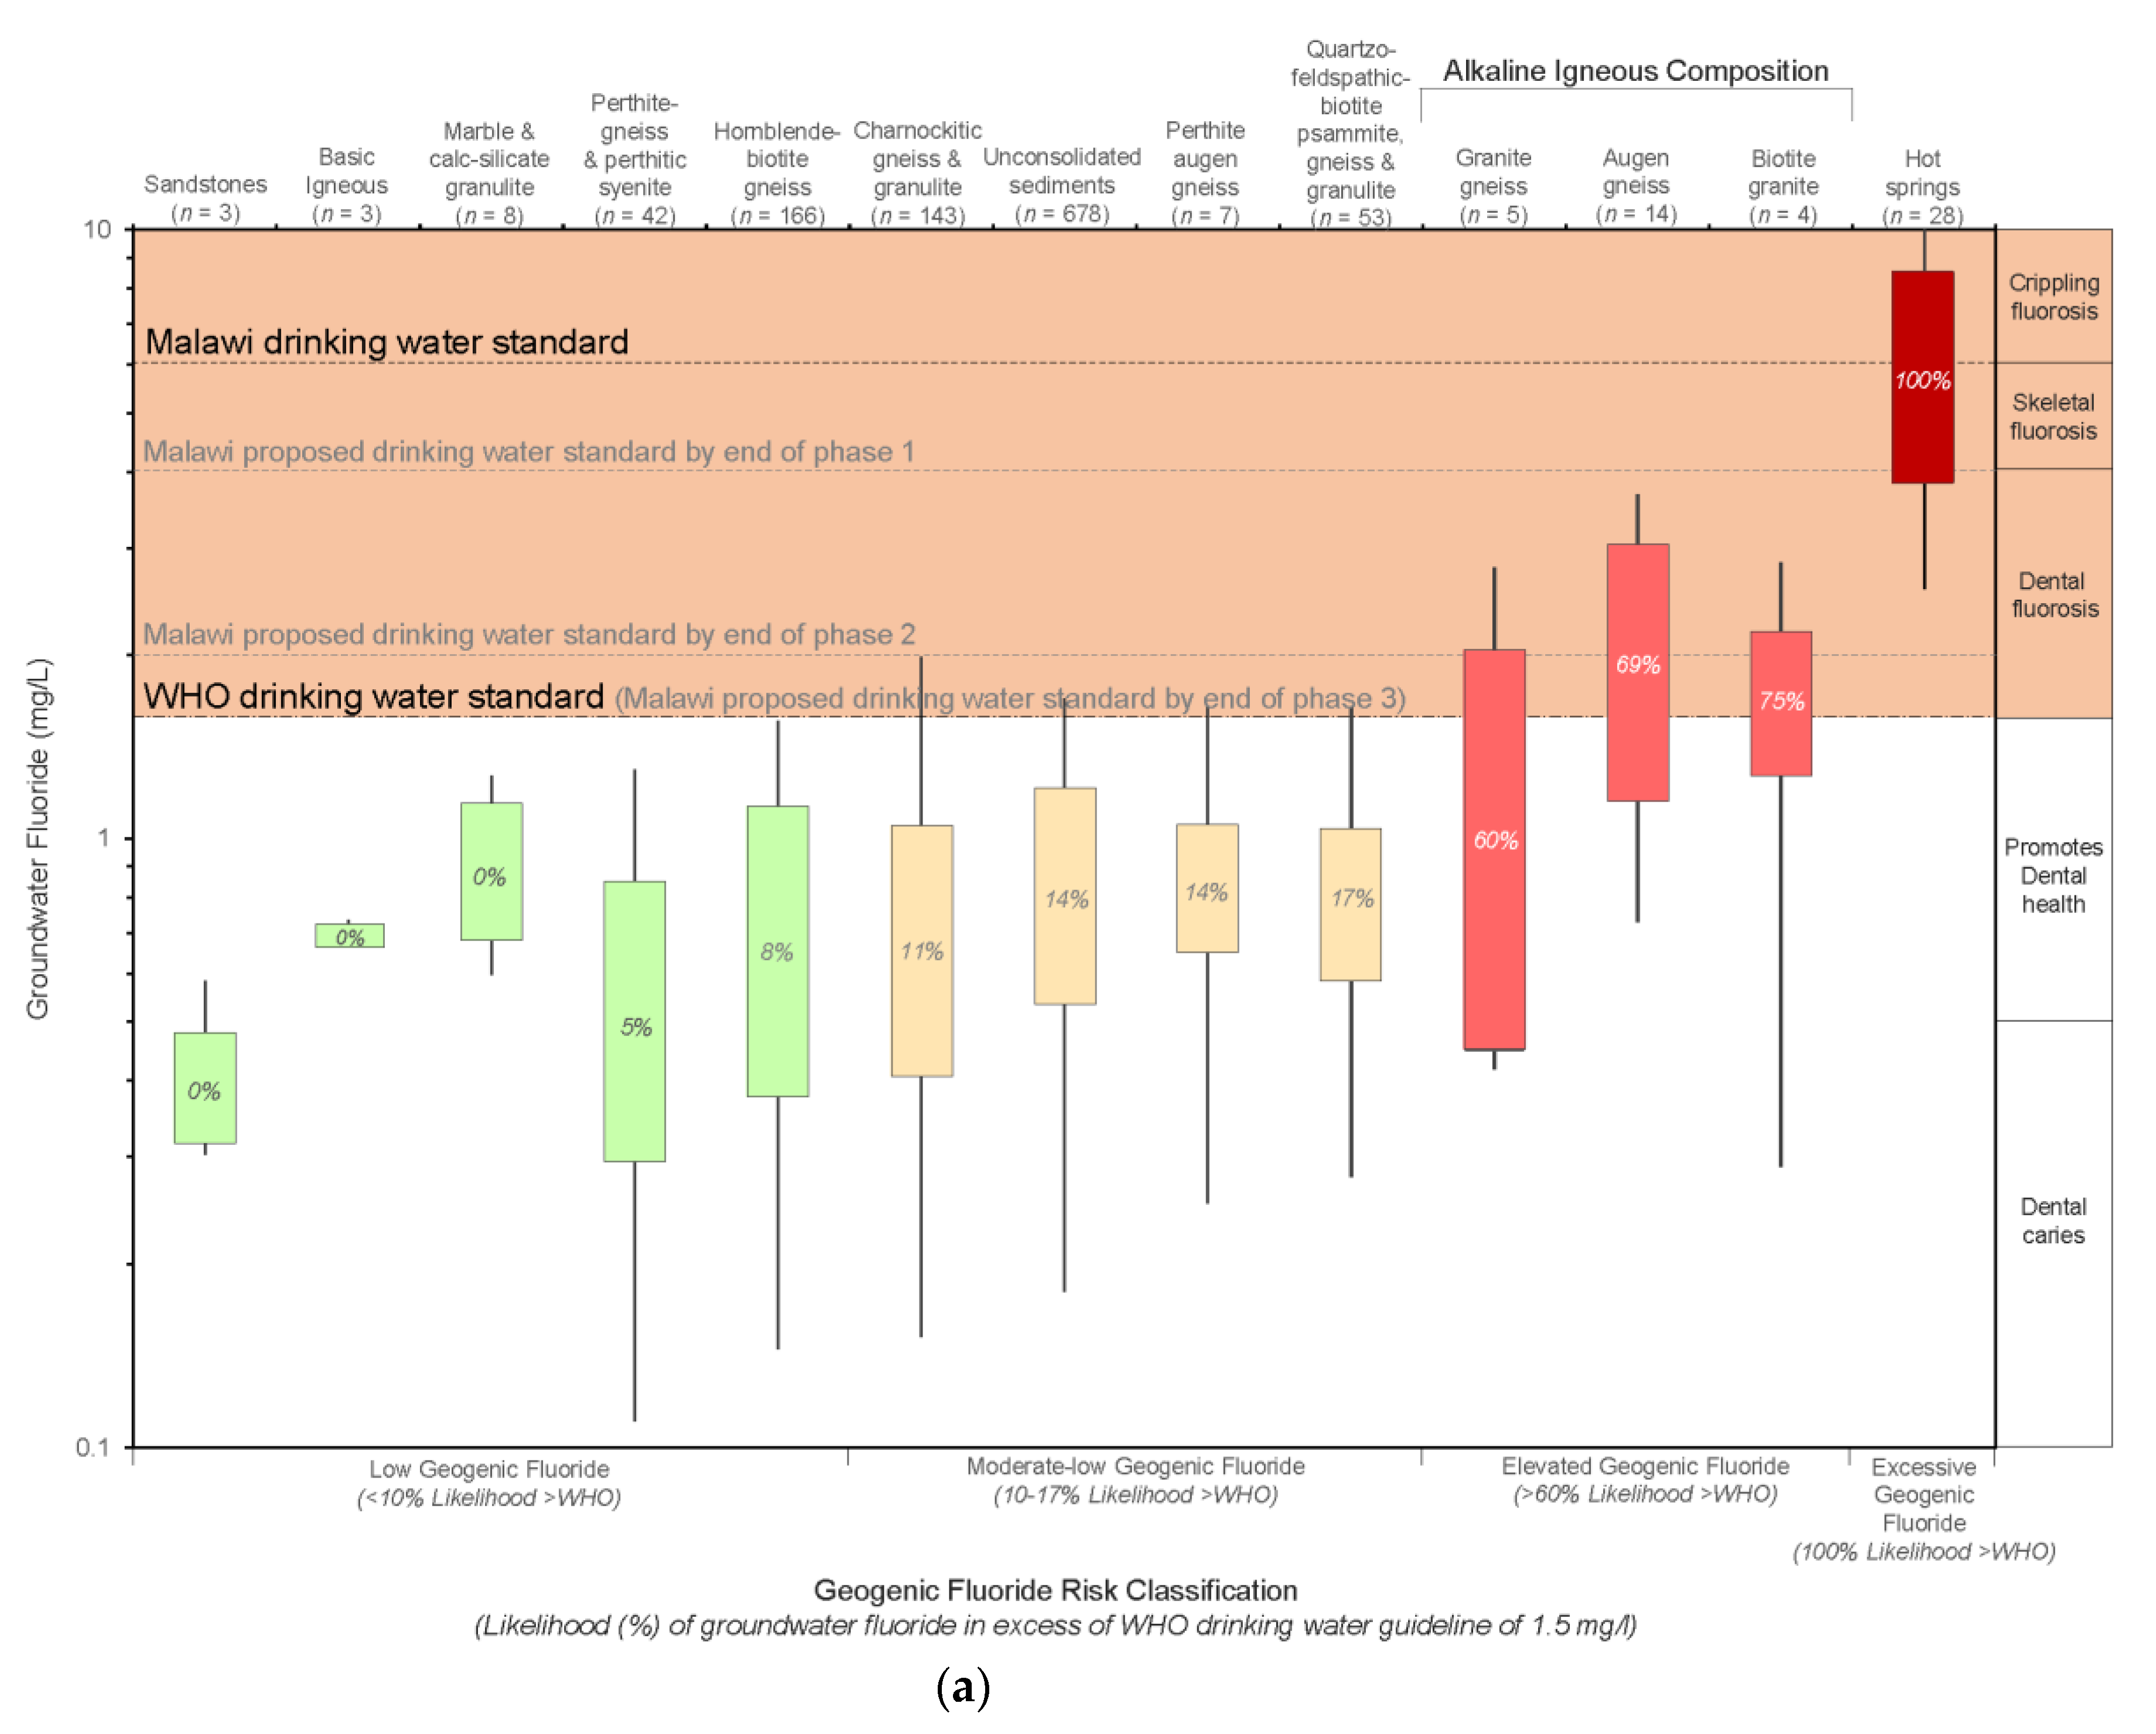
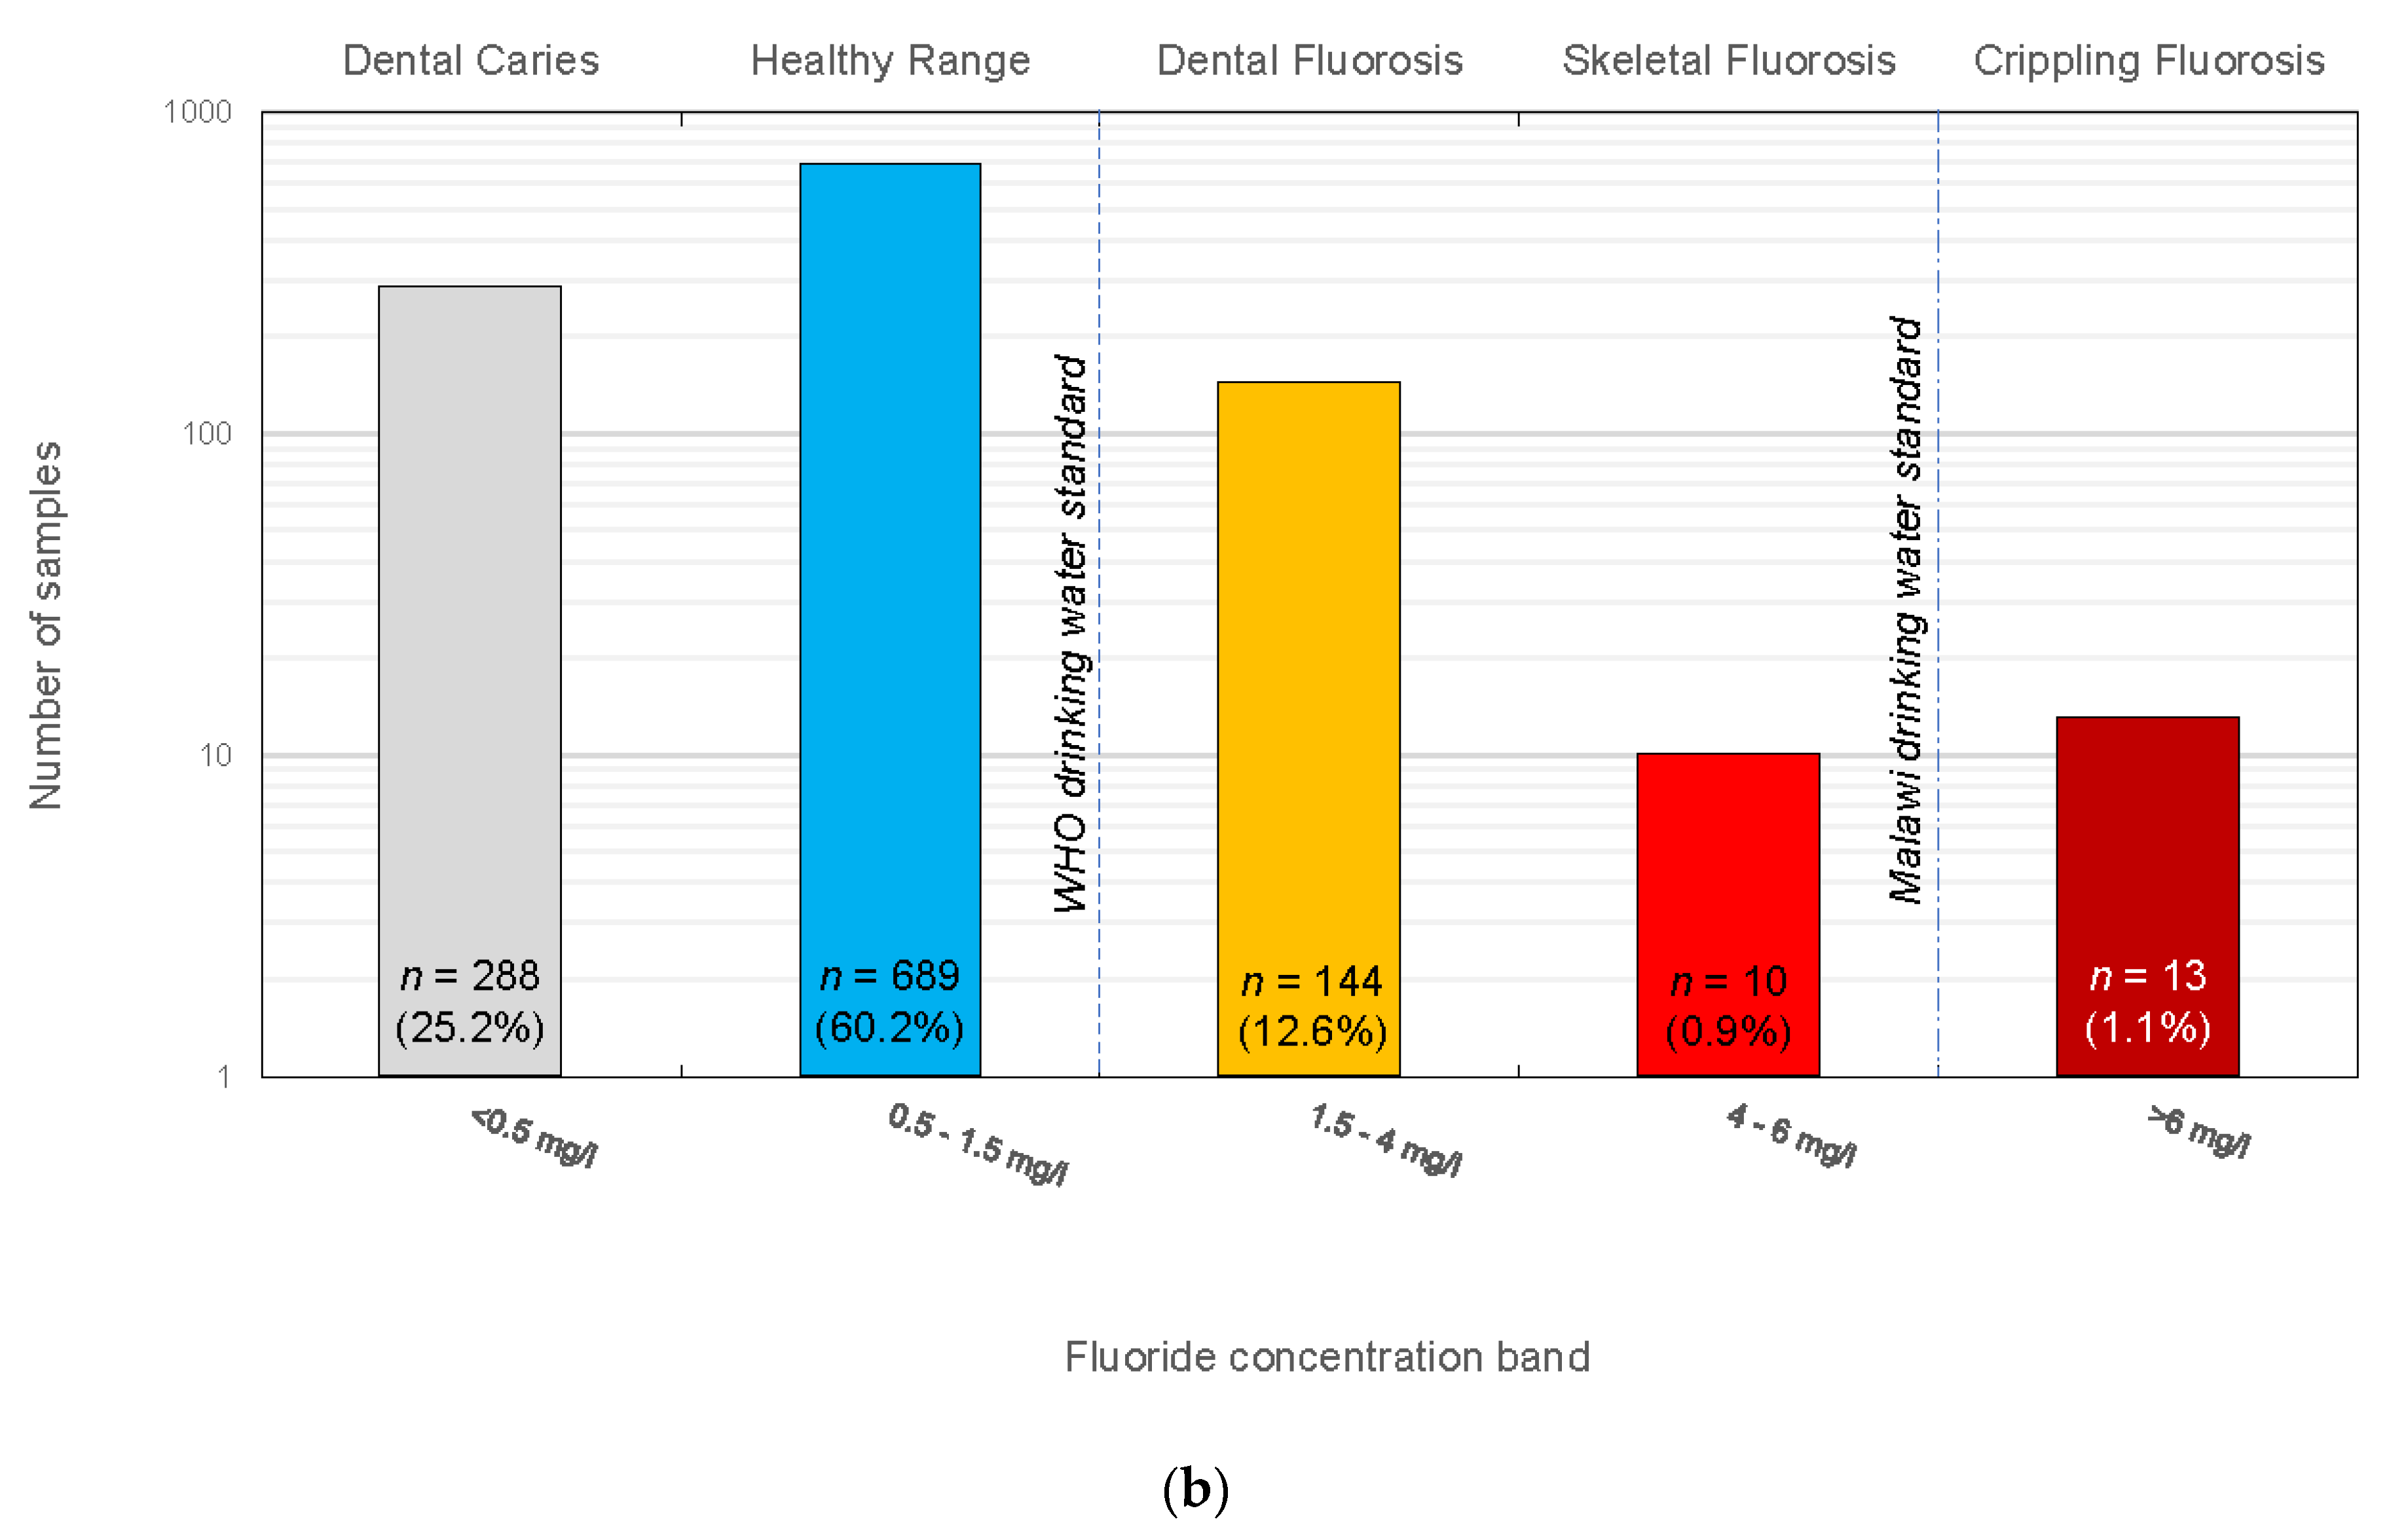
The highest statistical likelihood of encountering groundwater fluoride > 1.5 mg/L is from hot springs with 100% (n = 28) possessing fluoride exceeding this limit. Hot springs displayed the highest fluoride concentrations (range: 2.2–20.0 mg/L) and were classified separately as ‘Excessive Geogenic Fluoride’. All fluoride concentrations in the data set > 6 mg/L (except one outlier) are associated with a known hot spring (conduit for hydrothermal water). Lithologies of alkaline igneous composition display a statistical likelihood of encountering groundwater fluoride > 1.5 mg/L of 60–75%. All other lithologies displayed likelihoods of 17% or less, with a complete absence of any lithological groundwater fluoride source between 17% and 60% (Figure 4a). 60.2% of all samples (water points) produce groundwater fluoride concentrations within a healthy range which actively promotes the formation of strong teeth and bones in children (0.5–1.5 mg/L), 12.6% of samples produce groundwater fluoride concentrations high enough to cause dental fluorosis and 2% of samples produce concentrations high enough to cause skeletal and crippling fluorosis (Figure 4b).
Rocks of alkaline igneous composition displayed the highest generic statistical likelihood (>60%) of encountering groundwater fluoride > 1.5 mg/L (Figure 4a) and were classified as ‘Elevated Geogenic Fluoride’. Granite gneiss, Augen gneiss (metamorphosed granite in this case) and Biotite granite have statistical likelihoods of 60%; 69% and 75% respectively. Even with low sample numbers for Granite gneiss and Biotite granite, these results are not surprising due to significantly higher ratios of fluoride-bearing minerals in granitoid rocks (Figure 1), relative to other rocks [6,10,23,24,25]. The ‘Elevated Geogenic Fluoride’ classification was thus extrapolated to the 19 remaining lithologies of alkaline igneous composition (Figure 3a).
Perthite-gneiss and perthitic syenite, present as extensive outcrops south east of Lilongwe at the Malawi/Mozambique border and around Blantyre (Figure 3), appear anomalous as “syenite” (alkaline igneous composition) should reflect a relatively high statistical likelihood of elevated groundwater fluoride. Our data show this lithology displaying only 5% likelihood (Figure 4a). The gneiss was originally meta-sedimentary which was intruded by syenite (unknown volume), then subsequently perthitised. Syenite was intruded along axial planes of refolded major F1 structures and has since been highly altered during at least two deformation stages [47]. This resulted in localised linear occurrences of syenite within the gneiss. Consistently low groundwater fluoride within this lithology (n = 42) may reflect locations where there is an absence or low volume of syenite. This lithology, originally classified as alkaline igneous [47], was subsequently reclassified to meta-sedimentary (in this study), based on these statistical and descriptive observations. Further field work is necessary to confirm the relative syenite/meta-sediments ratio, and locations of syenite bands for the outcrop, but a high ratio of low fluoride concentrations suggests that syenite volume is low in this lithology and its reclassification is valid.
The ‘Moderate-high Geogenic Fluoride’ range (17–60% likelihood of encountering groundwater fluoride > 1.5 mg/L) (Figure 4a) was defined by the lower limit of ‘Elevated Geogenic Fluoride’ and upper limit of ‘Moderate-low Geogenic Fluoride’ and is characterised by complete lack of lithological sources in Malawi.
Lithologies with 10–17% likelihood of encountering groundwater fluoride > 1.5 mg/L, classified as ‘Moderate-low Geogenic Fluoride’ are dominated by meta-sedimentary lithologies and unconsolidated sediments. Perthite augen gneiss (n = 7) is the only anomaly and represents a perthitised alkaline lithology, similar to Perthite gneiss and perthitic syenite mentioned previously. Sample numbers are low and description of the lithology states that it is graded into the previously reclassified Perthite gneiss and perthitic syenite [47], therefore low fluoride concentrations may again represent meta-sedimentary locations within the graded zone. Field visits at the locations of those water points would be required to confirm. The ‘Moderate-low Geogenic Fluoride’ classification was applied to all remaining meta-sedimentary lithologies with similar dominant mineralogies, and to all six unconsolidated sediment lithologies.
‘Low Geogenic Fluoride’ lithologies carry the least risk of groundwater fluoride > 1.5 mg/L (<10%) (Figure 4a). This range includes two meta-sedimentary lithologies: the newly classified perthite gneiss and perthitic syenite, and hornblende-biotite gneiss. The latter is a lithology previously connected to elevated geogenic fluoride risk in Central Malawi [6], however doubts about the validity of this connection were expressed due to a low sample number (n = 3). Our study increased the sample size to 166, of which only 8% had fluoride concentrations > 1.5 mg/L, therefore, classified here as ‘Low Geogenic Fluoride’ (Figure 4a). Other lithologies identified in this category include sandstones, basic igneous rocks, marble, and calc-silicate granulite (Figure 4). The ‘Low Geogenic Fluoride’ classification was applied to all remaining lithologies with similar mineralogy to those identified.
Areas classified as ‘Insufficient Data for Classification’ are comprised of mostly complex sedimentary sequences where not enough hydrochemical or geological data are available to determine a generic fluoride risk classification. Lithologies within this group are likely to be low risk: most are sandstones, conglomerates, mudstones and breccias (with highly variable carbonate), but the sequences are too complex to determine generic fluoride risk without hydrochemical data. Some mylonites are present but there are not enough available data to determine composition. There are also no corresponding fluoride data from which to calculate statistical correlations. Logging and geochemical sampling from those lithologies would be required to determine geogenic fluoride risk classification.
13.5% of samples from the groundwater data set display fluoride concentrations between the WHO and Malawi standards (1.5–6 mg/L) for fluoride in drinking water. Concentrations > 1.5 mg/L cause varying degrees of fluorosis (Figure 4), therefore, drinking water standards are not aligned with geogenic fluoride risk in Malawi under current policy.
Hot spring activity is highly localised, and the risk of hydrothermal fluoride appears exclusive to those locations. Five locations with fluoride concentrations in the range 3–6 mg/L occur within the rift basin and may represent hot spring activity, or movement of fluoride-rich groundwater along faults hidden beneath unconsolidated basin sediments. Unconsolidated sediments have a statistically low risk of groundwater fluoride (14%-Figure 4a) so such concentrations within this range in the sediments appear anomalous. Known hot springs within unconsolidated sediments display the highest fluoride concentrations found in Malawi (Figure 5) so it is reasonable to assume that anomalously high groundwater fluoride concentrations found within unconsolidated sediments in the rift valley likely represent locations where rift-related faults hidden beneath sediments are exploited as flow conduits for fluoride-rich groundwater. They may also indicate where shallow groundwater is in contact with fluorite mineralisation from past hydrothermal activity along faults, hidden beneath sediments.

3.4. National Groundwater Risk Map and Statistics

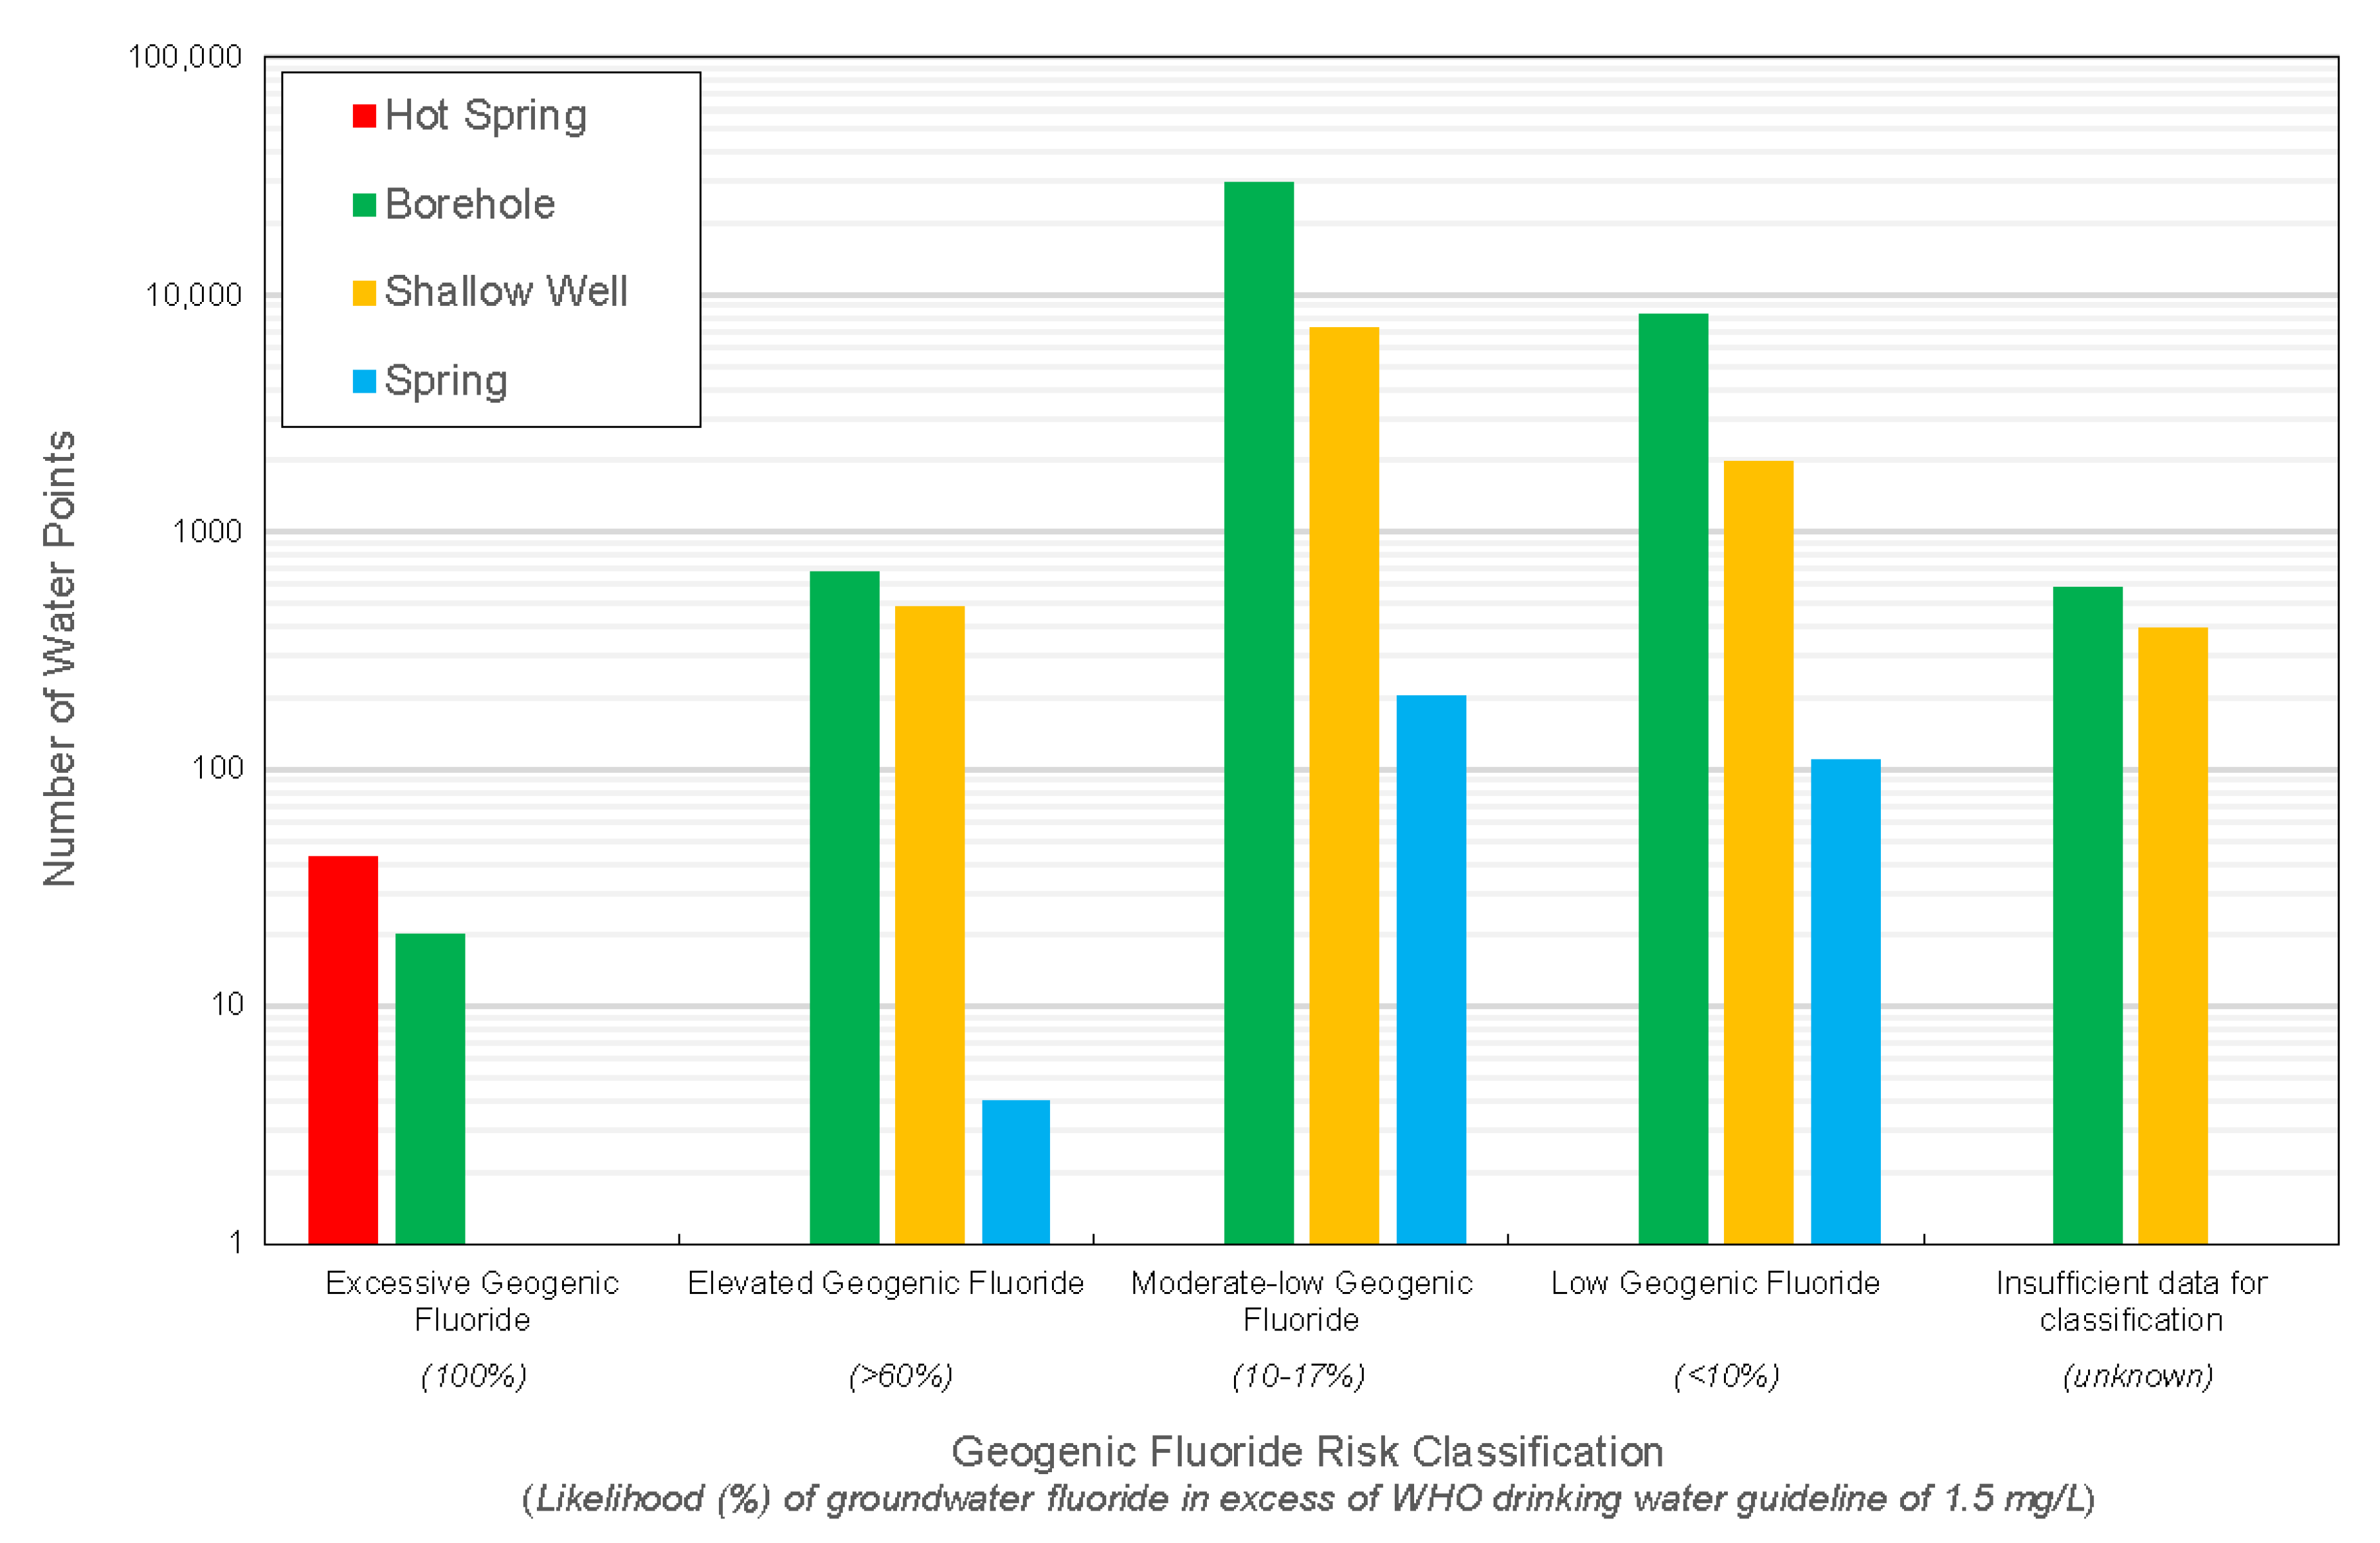
49,793 groundwater, ‘functional’ and ‘party functional but in need of repair’ water points were extracted from mWater and used to calculate statistics for the number of water points and the number of people at risk in each zone. Water points included hot springs, boreholes, shallow wells (protected and unprotected) and natural springs (Figure 6).
A map of groundwater vulnerability from geogenic fluoride was developed for Malawi based on the results from the statistical analysis and subsequent extrapolations (Figure 7a). 63 site-specific ‘Excessive Geogenic Fluoride’ water points (hot springs) represent highly localised endemic fluorosis areas where local people use them for drinking. These water points pose the highest fluorosis risk in Malawi (Figure 4). The estimated number of people at risk from developing fluorosis from hot springs in Malawi is 11,029 (Figure 7a). This is based on the average number of people per functioning water point, per local district (in the absence of users per water point data for hot springs).
‘Elevated Geogenic Fluoride’ zones account for 5.18% of Malawi’s land surface and are presented as generic zones with >60% risk of encountering groundwater > 1.5 mg/L (Figure 7a). Those represent alkaline igneous lithologies and are localised to plutons and intrusions associated with rifting and deformed meta-equivalents within basement rock. The number of people vulnerable from groundwater fluoride > 1.5 mg/L (thus dental fluorosis) in those zones is an estimated 248,963 (Figure 7a), which constitutes about 1.4% of the population of Malawi. Water points within these zones total 1168 which is about 2.3% of functioning and partly functioning direct groundwater abstraction points. Water points within this category plus all hot springs (n = 1233) affect a total of 259,992 rural Malawians across the country (Figure 7a) and represent the worst of the fluorosis risk (Figure 4a).
Water points within ‘Moderate-low Geogenic Fluoride’ zones constitute 74.9% of water points (n = 37,279), affecting a total of 9,969,114 people (Figure 7a). This classification carries a relatively low statistical risk (10–17%) of encountering groundwater fluoride > 1.5 mg/L. While the statistical likelihood is low, this still represents approximately 1–1.6 million people across these zones who may be drinking groundwater with fluoride concentrations elevated enough to cause dental fluorosis. ‘Low Geogenic Fluoride’ carries a low statistical likelihood (<10%) of encountering elevated groundwater fluoride > 1.5 mg/L but still represents approximately 267,594 people (Figure 7a) who currently may be at risk. Water points within zones with insufficient data for a geogenic fluoride classification constitute 2% of water points (n = 979) and currently affect an estimated 181,666 people (Figure 7a).
Statistics were calculated for ‘not functional’ water points separately (Table S1—Supplementary Materials). A total of 107 of these are located in ‘Elevated Geogenic Fluoride’ zones, posing a potential future groundwater fluoride risk to 25,522 people if repaired and not assessed for fluoride. Geogenic fluoride groundwater risk maps were also developed for each major catchment in Malawi with relevant summary statistics displayed as tables (Figures S11–S27—Supplementary Materials). An additional table of water point and users at risk statistics is presented per district (Table 4) for local government use in reviewing the fluoride standard.

4. Discussion

4.1. Discussion of Results

Hot springs are well-documented sources of particularly increased groundwater fluoride concentrations, often displaying the highest concentrations globally (Figure 1), so it was not unexpected that all hot springs in Malawi exceeded the WHO standard [9] for fluoride in drinking water and possessed the highest range of groundwater fluoride concentrations (Figure 4a). Hot springs produce groundwater from deeper reservoirs (i.e., different hydrogeological system) to those associated with shallow rock weathering, so they were classified separately as ‘Excessive Geogenic Fluoride’. This classification reflects: (i) deep hydrothermal source reservoir; (ii) significantly higher groundwater fluoride concentrations associated with hot springs; (iii) 100% likelihood of groundwater fluoride concentrations > 1.5 mg/L (Figure 4a); and (iv) the only site-specific groundwater geogenic fluoride risks identified by this study. Fluoride concentrations > 4 mg/L are associated with skeletal and crippling fluorosis (Figure 4) so hot springs represent almost all of the risk of those conditions in Malawi. They constitute the biggest human health risk from fluorosis and are the priority targets for replacement water supplies. The 63 hot springs represent highly localised ‘hot-spot’ areas of probable endemic fluorosis which currently affect an estimated 11,029 people in Malawi (Figure 7a). It is likely that incidences of both conditions (skeletal, crippling), plus increased incidences of dental fluorosis relative to other locations will be present at and immediately surrounding those sites.
Rocks of alkaline igneous composition consistently produce the highest groundwater fluoride concentrations, relative to other rocks (Figure 1) and our results support this conclusively (Figure 4a). Our results contain groundwater fluoride concentrations from three different granitoids which all displayed > 60% likelihood of groundwater fluoride concentrations > 1.5 mg/L, reasonably justifying the extrapolation of the ‘Elevated Geogenic Fluoride’ classification to other granitoid rocks. Hydrochemical data from syenitic rocks were absent so reasonable justifications for inclusion into this classification along with other alkaline igneous rocks had to be established: lithologies of syenitic composition are well-documented sources of elevated groundwater fluoride, comparable to granitic types [10], some syenites often possess significantly higher fluoride content than granites [53]. The fluoride content of the Chipala-Kasungu nepheline syenites of northern Malawi range from 1550–2400 mg/kg [50]. Quartz syenite of the Zomba and Mulanje plutons in southern Malawi have very similar composition to granite [47]. All syenitic-type rocks in Malawi were thus classified as ‘Elevated Geogenic Fluoride’ and mapped as zones of increased generic risk.
Carbonatites are categorised as alkaline igneous rocks but have different composition to granites and syenites. They contain high relative sodium content which increases groundwater fluoride potential via fluorite (CaF2) equilibration [5]. Malawi carbonatites additionally have extensive occurrences of fluorite and fluoro-apatite veins [48,49], a result of secondary precipitation from post emplacement hydrothermal processes and an additional source of groundwater fluoride. Carbonatites were therefore classified as ‘Elevated Geogenic Fluoride’ alongside other alkaline igneous rocks and mapped as zones of increased generic risk.
Lithologies within the ‘Moderate-low Geogenic Fluoride’ classification contained exclusively unconsolidated sediments and meta-sedimentary rocks (Figure 4a). Unconsolidated sediments display 14% likelihood of encountering groundwater fluoride > 1.5 mg/L, however, this is a category which carries some uncertainty. Unconsolidated sediments in the Southern Region are dominated by rift basin colluvium, alluvium, lacustrine and fluvial sediments (Figure 3). In the Central and Northern Regions, there is an additional category of colluvium which is characterised as ‘thin basement cover’ of unknown thickness and is extensive (Figure 3). Those areas represent a two-tier aquifer system where weathered basement aquifers occur beneath unconsolidated sediment aquifers of variable and unknown thickness. An individual well may be tapping into either, or both of those aquifer systems, depending on its depth. This poses uncertainty when extrapolating geogenic fluoride risk categorisation for the unconsolidated sediments at those locations, as a well may be drilled into an elevated geogenic fluoride lithology (e.g., granite) which is hidden beneath the sediment cover, but showing as low risk on a map (unconsolidated sediments). High hydraulic conductivity and transmissivity values identified in wells within these areas [54] suggest that from the perspective of drinking water boreholes, these areas abstract from unconsolidated sediment aquifers (for the most part) and are thus classified as ‘Moderate-low Geogenic Fluoride’. Further groundwater sampling to identify elevated fluoride, pumping test data to determine hydraulic conductivities (proxy for aquifer type: sedimentary aquifers classified by high hydraulic conductivity and transmissivity values; weathered basement aquifers characterised by low hydraulic conductivity and transmissivity values [6]), and/or borehole drilling logs to identify sediment depth vs. well depth, would increase confidence in this classification. All remaining lithologies in Malawi within the ‘Meta-sedimentary Rocks’ lithological group (Figure 3a) were reasonably classified as ‘Moderate-low Geogenic Fluoride’ based on existing statistical correlations for this group (Figure 4a).
‘Low Geogenic Fluoride’ lithologies were characterised by sandstones, marbles, basic igneous rocks and two meta-sedimentary rocks (Perthite gneiss and Hornblende-biotite gneiss) so all remaining sandstones, limestones, marbles and basic igneous rocks across Malawi were grouped within this classification. The two meta-sedimentary rocks present a potential anomaly within the Moderate-low classification; however, relatively high sample numbers (Figure 4a) present an increased confidence so they were grouped within this classification. Low sample number (n = 3) for basic igneous rocks present low confidence in prediction for those lithologies, however, all samples had groundwater fluoride concentrations < 1.5 mg/L (Figure 4a), hence the classification as ‘Low Geogenic Fluoride’. Groundwater fluoride concentrations within basic igneous rocks elsewhere generally reflect this classification, although can sometimes exceed 1.5 mg/L (Figure 1). Further testing of the map (Figure 7a) with additional fluoride analysis will allow confidence to increase in predicting geogenic fluoride risk to groundwater from basic igneous lithologies. While all samples within sandstone (n = 3) displayed groundwater fluoride concentrations well below 1.5 mg/L (Figure 4a), a low sample number also presents decreased confidence in prediction, however, global data on groundwater fluoride concentrations from sandstones (Figure 1) conclusively support the classification of these lithologies within ‘Low Geogenic Fluoride’. Results for limestones and marbles in Malawi fall within this classification (Figure 4). Limestones elsewhere are associated with low concentrations of groundwater fluoride but can also be associated with more elevated concentrations [10], sometimes up to 5 mg/L (Figure 1). Malawi limestones (incl. meta-equivalents) were classified as ‘Low Geogenic Fluoride’ based on our data (n = 8) where all samples were <1.5 mg/L, however, this prediction may change with increased sampling and testing of the map.
Anomalous elevated groundwater fluoride concentrations located within the rift basin may reveal the locations of fluoride-rich groundwater movement along faults hidden beneath unconsolidated basin sediments, and indeed was previously hypothesised in the Lower Shire Basin to explain the linear appearance of >6 mg/L fluoride concentrations found at that location [5]. A separate geological study to investigate fault strikes currently hidden beneath basin sediments may assist in the delineation of anomalous fluoride concentrations from that lithology but the data do not yet exist. Investigating those fluoride anomalies may reveal concealed fault strikes in the rift valley where high-fluoride groundwater is mobilised along faults and in contact with shallow groundwater. Mapping of faults beneath basin sediments (inferring based on existing geological, topographical and hydrochemical data) would therefore be a useful a tool for identifying target locations for fluoride assessment and priority replacement water supply. Such an approach may result in an additional zone of increased risk (hidden faults), increasing prediction accuracy for our screening method. Removal of anomalous groundwater fluoride concentrations related to fault strikes (inferred or observed) to be classified and targeted separately, may additionally result in a new, much lower (and more accurate) generic fluoride risk classification for unconsolidated sediments. Dental fluorosis data collected and confirmed by dentists would be additionally useful in identifying areas where there may be fluoride-rich groundwater beneath basin sediments as they would appear as locations with a high number of fluorosis incidences, this would be particularly useful in areas with an absence of groundwater data.
In total, water points (mostly rural) covered by this study serve an estimated 13,075,237 people (Table 4), accounting for 74% of Malawi’s total population [55] and our analysis suggests up to 1.9 million people may be at some risk from geogenic fluoride. An estimated 248,963 people currently use water points within ‘Elevated Geogenic Fluoride’ zones (the highest statistical risk of encountering groundwater fluoride > 1.5 mg/L from shallow rock weathering: >60%) and may be at risk from dental fluorosis. Water points within the ‘Moderate-low Geogenic Fluoride’ zones carry significantly less statistical risk of encountering concentrations of groundwater fluoride high enough to cause dental fluorosis (10–17%), however they number 74% of water points covered by this study. This equates to 1–1.6 million people using water points within these zones. With such a high number of people potentially at risk, water points within this category cannot be ignored and will require assessment within the SDG framework. Similarly, ‘Low Geogenic Fluoride’ carries a low statistical risk (<10%) of elevated groundwater fluoride but still represents up to approximately 267,594 people (Figure 7a) who currently may be at risk. Water points within zones with insufficient data for a fluoride classification currently affect 181,666 people (Figure 7a). While the expectation is that these lithologies will be relatively low risk, these will still need to be assessed for completeness within the SDG period and likely will contain some level (albeit low) of fluoride risk.
Overall, the results for Malawi (Figure 4a) reflect global trends in groundwater fluoride concentrations and aquifer type (Figure 1), with hot springs and groundwater points within alkaline igneous rocks posing the biggest human health risks. The map produced (Figure 7a) provides a high-resolution preliminary screening tool which can be used to target areas for groundwater fluoride assessment. The screening method was designed to be dynamic, providing increased prediction confidence with the continued addition of new groundwater and geological data. Areas can be prioritised for sampling and potential replacement water supply depending on the statistical likelihood of encountering groundwater with fluoride concentrations > 1.5 mg/L, thus, risk to human health from fluorosis, from highest–lowest geogenic risk.
The national geogenic groundwater fluoride vulnerability map (Figure 7a) is provided and should be used as an investment planning (or review) tool for Donors, NGO’s and Water Sector Stakeholders for assessing geogenic fluoride risk. It should be reiterated that this map is presented as a preliminary screening tool to target and prioritise future sampling efforts for existing wells and new ones being drilled, with the addition of groundwater and geological data increasing prediction confidence. To facilitate management of groundwater abstraction, the fluoride risk map for each WRA was individually produced and 15 geogenic fluoride risk maps for each of Malawi’s 15 major WRAs can be found in the Supplementary Materials (Figures S11–S27). Water resources (groundwater and surface water) in Malawi are managed by the National Water Resources Authority (NWRA) at (surface water) catchment level under the Water Resources Act (Malawi) 2013 [56]. The national fiscal resources in Malawi are managed through the 28 District Councils, and each District Water Development Officer (DWDO) would have responsibility for planning and monitoring of water resources. Therefore, it is also important to provide detail on fluoride risk for planning at the district scale as provided in Table 4. It is likely that the ministry responsible for water will delegate to local government the responsibility of implementing new groundwater standards in the first instance, and there will be a need to determine the fiscal burden of monitoring and potentially replacing water supplies as the fluoride standard is lowered.

4.2. Policy Review and Implications

A review of groundwater policy, specifically the fluoride standard is needed for Malawi to achieve SDG 6 targets as our results show that the Malawian drinking water standard MS 733:2005 (groundwater and boreholes) for fluoride (6 mg/L) (Figure 8) is not aligned with geogenic and acceptable health risks. The WHO guideline drinking water standard for fluoride is 1.5 mg/L [9] and is aligned with geogenic risk (the link with the WHO guideline standard being that concentrations below 1.5 mg/L are not associated with causing dental fluorosis). Concentrations exceeding 1.5 mg/L cause varying degrees of fluorosis (Figure 4), so retention of this standard runs the risk of (undocumented) dental and skeletal (and possibly crippling) fluorosis in populations who drink from wells with fluoride concentrations above risk standards. The Ministry responsible for water in Malawi and CJF Programme are together developing a plan to incrementally reduce the MS 733:2005 fluoride standard over time, aligning their drinking water fluoride standard with the WHO. Phase 1 of the plan is to reduce the standard from 6 mg/L to 4 mg/L. If implemented, this will manage the risk of skeletal and crippling fluorosis. Phase 2 will see a reduction to 2 mg/L and phase 3 will see a final reduction to 1.5 mg/L (Figure 4a), which will manage the risk of all fluorosis and bring groundwater fluoride policy in line with the WHO. The geogenic fluoride groundwater risk map of Malawi produced in this study (Figure 7a) is proposed primarily as the preliminary screening tool to be used in national efforts to manage groundwater assets for fluoride, but additionally as the basis for policy review. The map is based on the WHO standard of 1.5 mg/L which reflects geogenic risk, if it was based on the Malawian standard of 6 mg/L, only hot springs would show as risk areas as >6 mg/L groundwater fluoride concentrations are exclusive to them in Malawi (except one shallow well in the Southern Region). The gap between the WHO and Malawi standards for fluoride in drinking water reflect the “troublesome” fluoride concentrations (1.5–6 mg/L) identified previously as a key management issue due to diffuse occurrence and out of date fluoride standards [5].
The Malawian standard MS214 for fluoride in general drinking water (piped networks) is in line with WHO guidelines and does not require assessment, with an upper limit and range of 0.7–1.0 mg/L [57]. The standard MS 733:2005 for “raw water” that covers groundwater abstracted from boreholes and wells requires assessment (Figure 8) and was the target of this study. These groundwater sources are the primary water points for rural areas (85% of Malawians). There is a lack of emphasis on fluoride in the Malawi standard documents which were written before the JMP classification as a priority chemical contaminant (WHO and UNICEF, 2017). Fluoride (along with arsenic) will require more focus in the redefinition of standards if SDG 6.1 targets are to be set and achieved in Malawi, specifically 6.1.1 which states the global indicator as: “safely managed drinking water” and describes it as: “Improved source located on premises” … ”free from priority chemical contamination” [58]. Lowering the fluoride standard will render many water points unsuitable under this heading and alternative supplies will be required, a significant challenge for the Malawi Government.
MS 733 (Figure 8) refers to siting boreholes at least ‘100 m away from sources of pollution’, Fluoride is a geogenic contaminant in groundwater; alkaline igneous rocks have been identified as high-risk sources of fluoride in groundwater and therefore, could be classed as a pollution source (particularly given the JMP classification), although large-scale geogenic sources (e.g., geology) could not be legislated in the same way as an anthropogenic point source (e.g., pit latrine). Hot springs on the other hand can and should be legislated separately in the standards as point sources of various pollutants, including fluoride. More detail on pollution sources (geogenic, anthropogenic) will be required when revising these documents. In the document, under “6.2 Handling”, the MS 733:2005 document states that use of a borehole or well should cease immediately if a pollution source is identified, until the cause is eliminated. This is unrealistic for water points within a generic geogenic fluoride source but there is no indication of protocols for such an occurrence. Elevated geogenic fluoride zones cover large areas and many water points (Figure 7a). Site-specific chemical analysis of abstracted water is therefore necessary as it is unknown how many water points within elevated geogenic fluoride zones may be producing water with low fluoride concentrations (there is currently no systematic measurement of fluoride from groundwater supplies). Under MS 733:2005 only hot springs would require assessment.
Additional to reviewing and updating standards for fluoride in drinking water, the WASH sector has the responsibility to ensure that Malawi Government standards for installation are and were followed (including a requirement for chemical testing before installation of a pump or lifting device and use of the water as a drinking water supply). Our data show that many boreholes have been drilled which contain elevated groundwater fluoride which would have been within standards at the time of drilling but would fail water quality tests under proposed new standards. Updated, more stringent standards for fluoride will further the need for more focus on proper due diligence and accurate reporting. If these issues are not addressed, Malawi will continually gain new borehole infrastructure which later fails water quality tests and become stranded assets [2]. Local-scale studies where elevated groundwater fluoride concentrations exist are recommended to better understand the geogenic processes causing them. Such localised investigations may produce site/area-specific management solutions, such as avoiding faults, hot springs, or high risk lithologies.
As Malawi’s population continues to rise, stress on water resources will increase and the need for safely managed rural water supply and stricter policy on groundwater quality will become increasingly difficult to achieve, highlighting the need for proactive management of water resources. This study was designed to inform policy makers with an evidence-based prediction method for both environmental management and policy review. Recommended best practices for advocating science-based policy review includes (but are not limited to): (i) accurately characterising the best available policy-relevant science; (ii) presenting a clear and concise argument; (iii) accurately characterising any uncertainty; (iv) transparent representation of scientific basis for policy recommendation, and; (v) avoidance of hyperbole [59]. Thus, prediction maps have been produced here to form the basis for both assessment of existing groundwater supplies for geogenic fluoride (asset management), and as monitoring and investment planning tools as review of the Malawi fluoride standard is taken forward by the government. For Malawi to achieve SDG 6.1 scientists and policy makers must work closely and collaboratively to develop a consistent and accurate approach to reducing both current and future risks.

5. Conclusions

In the absence of national data sets for fluoride in Malawi, we show that existing statistical fluoride relationships with geogenic sources can be extrapolated nationally to develop high resolution geogenic fluoride groundwater risk maps. We present a preliminary screening tool for targeted testing of existing groundwater supplies for geogenic fluoride groundwater risk as well as a clear, evidence-based argument for redefinition of groundwater policy (for fluoride) in Malawi. The screening method is dynamic in design, with prediction confidence increasing with informed acquisition of new data as national sampling progresses. At present, our approach is the best available science relevant to fluoride in groundwater in Malawi and will inform a review of Malawi groundwater policy (including fluoride) in support of Sustainable Development Goal (SDG) targets. Our approach will assist national efforts (ongoing) by the Malawian Government to form a pathway for stepped progression of the fluoride standard to adoption of the globally accepted World Health Organisation (WHO) standard for fluoride in drinking water. The method should be integrated into future groundwater resource development strategies employed by the government, donors, and NGOs, to reduce the risk of geogenic fluoride in water supplies.

Supplementary Materials

The following are available online at https://www.mdpi.com/2073-4441/12/11/3123/s1, Table S1. Table showing data on the number of ‘not functional’ water points in each fluoride zone and the corresponding number of people at risk per zone, split by district. Figure S1. Geological map of Karonga (Malawi’s location on the African continent inset). Figure S2. Geological map of Nyika. Figure S3. Geological map of Nkhata Bay. Figure S4. Geological map of Nkhotakota. Figure S5. Geological map of Lilongwe. Figure S6. Geological map of Salima. Figure S7. Geological map of Dedza. Figure S8. Geological map of Mangochi. Figure S9. Geological map of Zomba. Figure S10. Geological map of Nsanje. Figure S11. Geogenic fluoride groundwater risk map of WRA 1-1 (Upper Shire). Figure S12. Geogenic fluoride groundwater risk map of WRA 1-2 (Middle Shire). Figure S13. Geogenic fluoride groundwater risk map of WRA 1-3 (Lower Shire). Figure S14. Geogenic fluoride groundwater risk map of WRA 2 (Lake Chilwa). Figure S15. Geogenic fluoride groundwater risk map of WRA 3 (SW Lakeshore). Figure S16. Geogenic fluoride groundwater risk map of WRA 4 (Lilongwe-Linthipe). Figure S17. Geogenic fluoride groundwater risk map of WRA 5 (Bua). Figure S18. Geogenic fluoride groundwater risk map of WRA 6 (Dwanga). Figure S19. Geogenic fluoride groundwater risk map of WRA 7 (South Rukuru-North Rumphi). Figure S20. Geogenic fluoride groundwater risk map of WRA 8 (North Rukuru). Figure S21. Geogenic fluoride groundwater risk map of WRA 9 (Songwe-Lufira). Figure S22. Geogenic fluoride groundwater risk map of WRA 10 (SE Lakeshore). Figure S23. Geogenic fluoride groundwater risk map of WRA 11 (Lake Chiuta). Figure S24. Geogenic fluoride groundwater risk map of WRA 14 (Ruo). Figure S25. Geogenic fluoride groundwater risk map of WRA 15 (Nkhotakota). Figure S26. Geogenic fluoride groundwater risk map of WRA 16 (Nkhata). Figure S27. Geogenic fluoride groundwater risk map of WRA 17 (Karonga).

Author Contributions

Conceptualization, M.J.A.; methodology, M.J.A.; software, M.J.A.; validation, M.J.A., M.O.R., R.M.K., P.P., P.M., E.M., and G.W.; formal analysis, M.J.A.; investigation, M.J.A.; resources, M.J.A.; data curation, M.J.A.; writing—original draft preparation, M.J.A.; writing—review and editing, M.J.A., M.O.R., and R.M.K.; visualization, M.J.A.; supervision, M.O.R., and R.M.K.; project administration, R.M.K.; funding acquisition, R.M.K. All authors have read and agreed to the published version of the manuscript.

Funding

This research was funded by the Scottish Government, via the ‘Climate Justice Fund: Water Futures Programme’ under research grant HN-CJF-03 awarded to the University of Strathclyde (R.M. Kalin).

Acknowledgments

The authors would like to acknowledge the Ministry of Forestry and Natural Resources (previously Ministry of Agriculture, Irrigation and Water Development) in Malawi for their consistent and continued cooperation with this project. Conducting research remotely is often a challenge, particularly when it involves current policy and standards, so we are very grateful for the active collaboration. Further thanks are due to the Scottish Government, via the ‘Climate Justice Fund: Water Futures Programme’ for funding this research.

Conflicts of Interest

The authors declare no conflict of interest.

References

  1. Upton, K.; Dochartaigh, B.É.Ó.; Chunga, B.; Bellwood-Howard, I. Africa Groundwater Atlas: Hydrogeology of Malawi. British Geological Survey. Available online: http://earthwise.bgs.ac.uk/index.php/Hydrogeology_of_Malawi (accessed on 19 October 2020).
  2. Kalin, R.M.; Mwanamveka, J.; Coulson, A.B.; Robertson, D.J.C.; Clark, H.; Rathjen, J.; Rivett, M.O. Stranded Assets as a Key Concept to Guide Investment Strategies for Sustainable Development Goal 6. Water 2019, 11, 702. [Google Scholar] [CrossRef] [Green Version]
  3. Rivett, M.O.; Budimir, L.; Mannix, N.; Miller, A.V.; Addison, M.J.; Moyo, P.; Wanangwa, G.J.; Phiri, O.L.; Songola, C.E.; Nhlema, M.; et al. Responding to salinity in a rural African alluvial valley aquifer system: To boldly go beyond the world of hand-pumped groundwater supply? Sci. Total Environ. 2018, 653, 1005–1024. [Google Scholar] [CrossRef] [PubMed] [Green Version]
  4. Rivett, M.; Robinson, H.; Wild, L.; Melville, J.; McGrath, L.; Phiri, P.; Flink, J.; Wanangwa, G.; Mlwta, P.; MacLeod, S.; et al. Arsenic occurrence in Malawi groundwater. J. Appl. Sci. Environ. Manag. 2018, 22, 1807. [Google Scholar] [CrossRef] [Green Version]
  5. Addison, M.J.; Rivett, M.O.; Robinson, H.; Fraser, A.; Miller, A.M.; Phiri, P.; Mleta, P.; Kalin, R.M. Fluoride occurrence in the lower East African Rift System, Southern Malawi. Sci. Total Environ. 2020, 712, 136260. [Google Scholar] [CrossRef] [PubMed]
  6. Addison, M.; Rivett, M.O.; Phiri, P.; Mleta, P.; Mbalame, E.; Kanjaye, M.; Phiri, O.; Lakudzala, W.; Kalin, R.M. Identifying Groundwater Fluoride Source in a Weathered Basement Aquifer in Central Malawi: Human Health and Policy Implications. Appl. Sci. 2020, 10, 5006. [Google Scholar] [CrossRef]
  7. Grimason, A.; Morse, T.; Beattie, T.K.; Masangwi, S.; Jabu, G.; Taulo, S.; Lungu, K.; Morse, T.D.; Masangwi, S.J. Classification and quality of groundwater supplies in the Lower Shire Valley, Malawi—Part 1: Physico-chemical quality of borehole water supplies in Chikhwawa, Malawi. Water SA 2013, 39, 563–572. [Google Scholar] [CrossRef] [Green Version]
  8. Monjerezi, M.; Ngongondo, C. Quality of Groundwater Resources in Chikhwawa, Lower Shire Valley, Malawi. Water Qual. Expos. Health 2012, 4, 39–53. [Google Scholar] [CrossRef]
  9. WHO; UNICEF. Progress on Drinking Water, Sanitation and Hygiene: 2017 Update and SDG Baselines; World Health Organization (WHO): Geneva, Switzerland; The United Nations Children’s Fund (UNICEF): New York, NY, USA, 2017. [Google Scholar]
  10. Ozsvath, D.L. Fluoride concentrations in a crystalline bedrock aquifer Marathon County, Wisconsin. Environ. Earth Sci. 2006, 50, 132–138. [Google Scholar] [CrossRef]
  11. Li, D.; Gao, X.; Wang, Y.; Luo, W. Diverse mechanisms drive fluoride enrichment in groundwater in two neighboring sites in northern China. Environ. Pollut. 2018, 237, 430–441. [Google Scholar] [CrossRef]
  12. World Health Organisation. Guidelines for Drinking-Water Quality: Fourth Edition Incorporating the First Addendum; World Health Organization: Geneva, Switzerland, 2017. [Google Scholar]
  13. Malawi Bureau of Standards. Borehole and Shallow Well Water—Specification; Malawi Standards Board: Blantyre, Malawi, 2005; ICS 13.060.10; MS 733:2005. [Google Scholar]
  14. Edmunds, W.M.; Smedley, P.M. Fluoride in natural waters. In Essentials of Medical Geology, 2nd ed.; Springer: Dordrecht, The Netherlands, 2013; pp. 311–336. [Google Scholar]
  15. Ghiglieri, G.; Pittalis, D.; Cerri, G.; Oggiano, G. Hydrogeology and hydrogeochemistry of an alkaline volcanic area: The NE Mt. Meru slope (East African Rift—Northern Tanzania). Hydrol. Earth Syst. Sci. 2012, 16, 529–541. [Google Scholar] [CrossRef] [Green Version]
  16. Nair, K.R.; Manji, F.; Gitonga, J.N. The occurrence and distribution of fluoride in groundwaters of Kenya. East Afr. Med. J. 1984, 61, 503–512. [Google Scholar]
  17. Tekle-Haimanot, R.; Melaku, Z.; Kloos, H.; Reimann, C.; Fantaye, W.; Zerihun, L.; Bjorvatn, K. The geographic distribution of fluoride in surface and groundwater in Ethiopia with an emphasis on the Rift Valley. Sci. Total Environ. 2006, 367, 182–190. [Google Scholar] [CrossRef]
  18. Msonda, K.W.M.; Masamba, W.R.L.; Fabiano, E. A study of groundwater fluoride occurrence in Nathenje, Lilongwe, Malawi. Phys. Chem. Earth 2007, 32, 1178–1184. [Google Scholar] [CrossRef]
  19. Pritchard, M.; Mkandawire, T.; O’Neill, J. Assessment of groundwater quality in shallow wells within the southern districts of Malawi. Phys. Chem. Earth Parts A/B/C 2008, 33, 812–823. [Google Scholar] [CrossRef]
  20. Sajidu, S.M.; Masumbu, F.F.F.; Fabiano, E.; Ngongondo, C. Drinking water quality and identification of fluoritic areas in Machinga, Malawi. Malawi J. Sci. Technol. 2007, 8, 42–56. [Google Scholar]
  21. Qasemi, M.; Afsharnia, M.; Zarei, A.; Farhang, M.; Allahdadi, M. Non-carcinogenic risk assessment to human health due to intake of fluoride in the groundwater in rural areas of Gonabad and Bajestan, Iran: A case study. Hum. Ecol. Risk Assess. Int. J. 2018, 25, 1222–1233. [Google Scholar] [CrossRef]
  22. Bath, A.H. Hydrochemistry in Groundwater Development: Report on an Advisory Visit to Malawi; Report No. WD/05/80/20; British Geological Survey: Nottingham, UK, 1980; pp. 29–40. [Google Scholar]
  23. AbdelGawad, A.; Watanabe, K.; Takeuchi, S.; Mizuno, T. The origin of fluoride-rich groundwater in Mizunami area, Japan—Mineralogy and geochemistry implications. Eng. Geol. 2009, 108, 76–85. [Google Scholar] [CrossRef]
  24. Berger, T.; Mathurin, F.A.; Drake, H.; Åström, M.E. Fluoride abundance and controls in fresh groundwater in Quaternary deposits and bedrock fractures in an area with fluorine-rich granitoid rocks. Sci. Total Environ. 2016, 569, 948–960. [Google Scholar] [CrossRef] [PubMed]
  25. Naseem, S.; Rafique, T.; Bashir, E.; Bhanger, M.I.; Laghari, A.; Usmani, T.H. Lithological influences on occurrence of high-fluoride groundwater in Nagar Parkar area, Thar Desert, Pakistan. Chemosphere 2010, 78, 1313–1321. [Google Scholar] [CrossRef]
  26. Chandrawanshi, C.K.; Patel, K.S. Fluoride Deposition in Central India. Environ. Monit. Assess. 1999, 55, 251–265. [Google Scholar] [CrossRef]
  27. Sracek, O.; Wanke, H.; Ndakunda, N.; Mihaljevič, M.; Buzek, F. Geochemistry and fluoride levels of geothermal springs in Namibia. J. Geochem. Explor. 2015, 148, 96–104. [Google Scholar] [CrossRef]
  28. Shitumbanuma, V.; Tembo, F.; Tembo, J.M.; Chilala, S.; Van Ranst, E. Dental fluorosis associated with drinking water from hot springs in Choma district in southern province, Zambia. Environ. Geochem. Health 2007, 29, 51–58. [Google Scholar] [CrossRef]
  29. Lottermoser, B.; Cleverley, J.S. Controls on the genesis of a high-fluoride thermal spring: Innot Hot Springs, north Queensland *. Aust. J. Earth Sci. 2007, 54, 597–607. [Google Scholar] [CrossRef]
  30. Kundu, N.; Panigrahi, M.K.; Sharma, S.P.; Tripathy, S. Delineation of fluoride contaminated groundwater around a hot spring in Nayagarh, Orissa, India using geochemical and resistivity studies. Environ. Earth Sci. 2002, 43, 228–235. [Google Scholar] [CrossRef]
  31. Bardsen, A.; Bjorvatn, K.; Selvig, K.A. Variability in fluoride content of subsurface water reservoirs. Acta Odontol. Scand. 1996, 54, 343–347. [Google Scholar] [CrossRef]
  32. Reddy, D.V.; Nagabhushanam, P.; Sukhija, B.S.; Reddy, A.G.S.; Smedley, P.L. Fluoride dynamics in the granitic aquifer of the Waliapally watershed, Nalgonda District, India. Chem. Geol. 2010, 269, 278–289. [Google Scholar] [CrossRef] [Green Version]
  33. Banks, D.; Frengstad, B.; Midtgård, A.K.; Krog, J.R.; Strand, T. The chemistry of Norwegian groundwaters: I. The distribution of radon, major and minor elements in 1604 crystalline bedrock groundwaters. Sci. Total Environ. 1998, 222, 71–91. [Google Scholar] [CrossRef]
  34. Smedley, P.L.; Edmunds, W.M.; Pelig-Ba, K.B. Groundwater Vulnerability Due to Natural Geochemical Environment: 2: Health Problems Related to Groundwater in the Obuasi and Bolgatanga Areas, Ghana; Technical Report; British Geological Survey: Nottingham, UK, 1995. [Google Scholar]
  35. Edmunds, W.M.; Cook, J.M.; Kinniburgh, D.G.; Miles, D.G.; Trafford, J.M. Trace Element Occurrence in British Groundwaters; Research Report SD/89/3; British Geological Survey: Keyworth, UK, 1989; p. 424. [Google Scholar]
  36. Robinson, H. A Hydrogeochemical Assessment of the Geothermal Potential of Southern Malawi. Master’s Thesis, Department of Civil and Environmental Engineering, University of Strathclyde, Strathclyde, UK, 2018, unpublished. [Google Scholar]
  37. Podgorski, J.E.; Labhasetwar, P.; Saha, D.; Berg, M. Prediction Modeling and Mapping of Groundwater Fluoride Contamination throughout India. Environ. Sci. Technol. 2018, 52, 9889–9898. [Google Scholar] [CrossRef] [Green Version]
  38. Amini, M.; Mueller, K.; Abbaspour, K.C.; Rosenberg, T.; Afyuni, M.; Møller, K.N.; Sarr, M.; Johnson, C.A. Statistical Modeling of Global Geogenic Fluoride Contamination in Groundwaters. Environ. Sci. Technol. 2008, 42, 3662–3668. [Google Scholar] [CrossRef] [Green Version]
  39. Kelly, L.; Kalin, R.M.; Bertram, D.; Kanjaye, M.; Nkhata, M.; Sibande, H. Quantification of Temporal Variations in Base Flow Index Using Sporadic River Data: Application to the Bua Catchment, Malawi. Water 2019, 11, 901. [Google Scholar] [CrossRef] [Green Version]
  40. Kelly, L.; Bertram, D.; Kalin, R.; Ngongondo, C. Characterization of Groundwater Discharge to Rivers in the Shire River Basin, Malawi. Am. J. Water Sci. Eng. 2019, 5, 127. [Google Scholar] [CrossRef]
  41. Kelly, L.; Bertram, D.; Kalin, R.; Ngongondo, C.; Sibande, H. A National Scale Assessment of Temporal Variations in Groundwater Discharge to Rivers: Malawi. Am. J. Water Sci. Eng. 2020, 6, 39. [Google Scholar] [CrossRef]
  42. Dulanya, Z. Geothermal resources of Malawi—An overview. In Proceedings of the 31st Workshop on Geothermal Reservoir Engineering, Stanford, CA, USA, 30 January–1 February 2006; SGP-TR179. Stanford University: Stanford, CA, USA, 2006. [Google Scholar]
  43. Dulanya, Z.; Morales-Simfors, N.; Sivertun, A. A comparison between silica and cation geothermometry of the Malawi hotsprings. In Proceedings of the World Geothermal Congress 2010, Bali, Indonesia, 25–29 April 2010. [Google Scholar]
  44. Kaonga, H.; Tsokonombwe, G.; Kamanga, T. Status of geothermal exploration in Malawi. In Proceedings of the 5th African Rift Geothermal Conference, Arusha, Tanzania, 29–31 October 2014. [Google Scholar]
  45. Kirkpatrick, I.M. The Thermal Springs of Malawi. In Proceedings of the XXIII International Geological Congress; 1969; pp. 111–120. Available online: https://www.scopus.com/record/display.uri?eid=2-s2.0-84910800168&origin=inward&txGid=3f03adc1ab35f878f790d280b6ad2b26 (accessed on 7 November 2020).
  46. Msika, B.J.W.; Kalenga Saka, J.D.; Dulanya, Z. Spatial distribution, chemistry and subsurface temperatures of geothermal springs in Nkhata bay, Malawi. Afr. J. Environ. Sci. Technol. 2014, 8, 464–475. [Google Scholar]
  47. Cannon, R.T. Geological Atlas of Malawi, 1st ed.; Government of Malawi: Lilongwe, Malawi, 1970.
  48. Broom-Fendley, S.; Brady, A.E.; Horstwood, M.S.; Woolley, A.R.; Mtegha, J.; Wall, F.; Dawes, W.; Gunn, G. Geology, geochemistry and geochronology of the Songwe Hill carbonatite, Malawi. J. Afr. Earth Sci. 2017, 134, 10–23. [Google Scholar] [CrossRef] [Green Version]
  49. Carter, G.S.; Bennett, J.D. The Geology and Mineral Resources of Malawi, 2nd ed.; Bulletin No. 6; Government Print: Zomba, Malawi, 1973.
  50. Nelson Eby, G.; Wooley, A.R.; Din, V.; Platt, G. Geochemistry and petrogenesis of nepheline syenites: Kasungu-Chipala, Ilomba, and Ulindi nepheline syenite intrusions, North Nyasa Alkaline Province, Malawi. J. Petrol. 1998, 39, 1405–1424. [Google Scholar]
  51. Wedmore, L.N.J.; Biggs, J.; Williams, J.; Fagereng, A.; Dulanya, Z.; Mphepo, F.; Mdala, H. Active Fault Scarps in Southern Malawi and Their Implications for the Distribution of Strain in Incipient Continental Rifts. Tectonics 2020, 39, e2019TC005834. [Google Scholar] [CrossRef] [Green Version]
  52. Chae, G.-T.; Yun, S.-T.; Kwon, M.-J.; Kim, Y.-S.; Mayer, B. Batch dissolution of granite and biotite in water: Implication for fluorine geochemistry in groundwater. Geochem. J. 2006, 40, 95–102. [Google Scholar] [CrossRef] [Green Version]
  53. Shah, M.T.; Danishwar, S. Potential Fluoride Contamination in the Drinking Water of Naranji Area, Northwest Frontier Province, Pakistan. Environ. Geochem. Health 2003, 25, 475–481. [Google Scholar] [CrossRef] [PubMed]
  54. Storey, I. Determination of Transmissivities through Pumping Tests and Their Impact on Water Management, TA Mazengera, Malawi. Master’s Thesis, University of Strathclyde, Strathclyde, UK, 2019. [Google Scholar]
  55. Government of Malawi. Malawi Population and Housing Census: Main Report; Government Report; National Statistical Office: Zomba, Malawi, 2019.
  56. Government of Malawi. Water Resources Act (2013); No. 2; Government Publication: Zomba, Malawi, 2013.
  57. Malawi Bureau of Standards. Drinking Water—Specification; ICS 13.030.40; MS 214:2013; Malawi Bureau of Standards: Blantyre, Malawi, 2013. [Google Scholar]
  58. UN Water. Integrated Monitoring Guide for SDG 6 Targets and Global Indicators; Version 2016-07-19; UN Water Publication: Zomba, Malawi, 2016. [Google Scholar]
  59. Meyer, J.L.; Frumhoff, P.C.; Hamburg, S.P.; De La Rosa, C. Above the din but in the fray: Environmental scientists as effective advocates. Front. Ecol. Environ. 2010, 8, 299–305. [Google Scholar] [CrossRef]
Figure 1. Summary of global data for groundwater fluoride concentration ranges and geogenic source. Hot springs represent deep hydrothermal groundwater fluoride source, all others represent shallow rock weathering groundwater fluoride source, sorted per lithology type (References for data: [10,27,28,29,30,31,32,33,34,35]; hot spring photo source: [36]).
Water 12 03123 g001
Figure 2. All water points included in this study. Only direct groundwater sources were considered (each water point type is represented separately). The data is representative of the time/date it was extracted from mWater (8 October 2020).
Water 12 03123 g002
Figure 3. (a) Map legend and geological key for all maps, lithology organised per lithological group. (b) Full geological map of Malawi (digitised after others: [47,51], with Malawi’s location on the African continent inset. Map is divided into 10 separate maps with additional detail necessary to identify specific lithologies in the Supplementary Materials (Figures S1–S10).
Water 12 03123 g003aWater 12 03123 g003b
Figure 4. (a) Integrated graphic showing summarised statistical fluoride-lithology relationships for existing data. The percentage in each bar reflects the statistical likelihood of each source (lithology/hot spring) producing groundwater fluoride exceeding 1.5 mg/L. Sample numbers (n) are shown with lithology names. The figure shows the various health conditions associated with ingestion of fluoride and their corresponding fluoride concentration bands [10]. Horizontal lines display current and proposed fluoride drinking water standards. (b) Chart showing fluoride concentration bands and their respective proportion of the sample number from the data set. Y-axis has a logarithmic scale to expand data with low sample numbers.
Water 12 03123 g004aWater 12 03123 g004b
Figure 5. Groundwater fluoride concentration ranges for hot springs, split per lithological group from which they occur.
Water 12 03123 g005
Figure 6. Breakdown summary of all water point data (functional and partly functional, direct groundwater sources–extracted from mWater) used in this study, per geogenic fluoride classification.
Water 12 03123 g006
Figure 7. (a) Geogenic fluoride groundwater risk map of Malawi. The map is based on the geological map of Malawi (Figure 3), where each lithology is displayed per geogenic fluoride risk classification (Figure 4a) as zones of generic groundwater vulnerability to geogenic fluoride from shallow rock weathering. Hot springs are displayed as site-specific sources of geogenic fluoride from deep hydrothermal sources. The map includes estimated numbers of people vulnerable from geogenic groundwater fluoride in each zone (based on the number of people normally using each water point). (b) Conceptual model of known and hypothesised geogenic fluoride sources from (a).
Water 12 03123 g007aWater 12 03123 g007b
Figure 8. Summary of fluoride-relevant information from Malawi standard documents for drinking water and borehole and shallow well water [13,57].
Water 12 03123 g008
Table 1. Summary of methodology development, per stage, with a short description of the objectives of each stage.
Methodology Development
Stage 1Groundwater Fluoride Data CollationCollate master data set of groundwater fluoride concentrations and hot springs for Malawi
Stage 2Geological Data Collation and DigitisationProduce Digital Geological Map of Malawi for use in statistical and spatial analyses with groundwater data
Stage 3Development of Statistical Relationships and ExtrapolationsDetermine geogenic fluoride risk classifications by calculating fluoride-lithology statistical relationships and extrapolating where data are absent
Stage 4Development of National Groundwater Risk Maps and StatisticsProduce national and catchment-level geogenic fluoride groundwater risk maps. Estimate number of water points and people at risk from groundwater fluoride.
Stage 5Policy Review and ImplicationsInvestigate the Malawian standard documents for fluoride in drinking water relative to the WHO and SDGs
Table 2. Summary of groundwater fluoride data collated for use in this study.
Data SetnFluoride Concentration (mg/L)
<1.5>1.51.5–6>6Min.Max.MeanMedianStd. Dev.
Groundwater F112686.77%13.23%13.14%0.09%0.0210.630.970.800.95
Hot Springs280.00%100%46.43%53.57%2.21206.385.883.89
Table 3. Fluoride classifications and likelihood (%) of encountering groundwater fluoride > 1.5 mg/L. Hot springs represent site-specific groundwater fluoride sources; all other classifications represent generic sources.
ClassificationLikelihood of Groundwater Fluoride > 1.5 mg/L
Excessive Geogenic Fluoride (hot spring)100%
Elevated Geogenic Fluoride>60%
Moderate-high Geogenic Fluoride17–60%
Moderate-low Geogenic Fluoride10–17%
Low Geogenic Fluoride<10%
Insufficient Data for classificationUnknown
Table 4. Data for the number of water points in each fluoride zone and the corresponding number of people at risk per zone, split per district.
DistrictNo. of Water PointsNo. of Users
Elevated Geological FluorideModerate-Low Geological FluorideLow Geological FluorideInsufficient DataTotalElevated Geological FluorideModerate-Low Geological FluorideLow Geological FluorideInsufficient DataTotal
Balaka00.0%110873.0%41027.0%00.0%15180319,481146,6330466,114
Blantyre20.1%211975.5%68724.5%00.0%2808480456,009164,9580621,447
Chikwawa220.9%186774.4%56222.4%592.4%25105875542,936192,63620,106761,553
Chiradzulu00.0%112567.0%55433.0%00.0%16790306,588156,0720462,660
Chitipa16712.3%98972.9%14310.5%584.3%135735,470156,41735,3764153231,416
Dedza120.7%107466.4%53232.9%00.0%16184987392,938178,0750576,000
Dowa703.8%156485.2%20211.0%00.0%183624,452524,41978,4860627,357
Karonga100.5%159183.8%432.3%25513.4%18991040256,35511,18145,318313,894
Kasungu402.2%138774.6%43223.2%00.0%18599265374,05290,2380473,555
Lilongwe1012.3%379387.0%46610.7%00.0%436042,3771,136,296173,85301,352,526
Machinga40.3%118792.0%997.7%00.0%12901600445,46129,4000476,461
Mangochi360.9%329386.5%47612.5%00.0%380510,723883,423155,74501,049,891
Mchinji100.5%181397.7%321.7%00.0%18552900466,83863810476,119
Mulanje00.0%152583.4%30016.4%30.2%18280357,12558,563110415,798
Mwanza274.6%00.0%56295.4%00.0%58975080129,4320136,940
Mzimba4169.6%269162.2%120727.9%110.3%432556,988614,476217,3601542890,366
Neno00.0%7415.5%40384.5%00.0%477022,869130,7380153,607
Nkhata Bay10.1%31423.1%53439.3%50937.5%135827041,96273,61199,355215,198
Nkhotakota764.9%99064.0%48131.1%00.0%154710,908220,67390,7390322,320
Nsanje110.8%110177.9%28920.4%130.9%14142580213,46345,9192170264,132
Ntcheu90.7%53641.1%76058.2%00.0%13055000219,963264,2140489,177
Ntchisi30.3%87377.0%25822.8%00.0%11341780254,51747,7660304,063
Phalombe151.3%106892.1%776.6%00.0%11605092249,93515,8760270,903
Rumphi11411.1%70368.6%14414.0%646.2%102512,952100,19321,7056207141,057
Salima10.1%105680.0%26319.9%00.0%1320206302,13068,5990370,935
Thyolo00.0%174985.6%29414.4%00.0%20430446,92362,7390509,662
Zomba211.2%166793.6%935.2%00.0%17816510657,83728,9990693,346
AUNA *00.0%2273.3%13.3%723.3%300583520027058740
Total11682.3%37,27975.0%10,30420.7%9792.0%49,730248,9639,969,1142,675,494181,66613,075,237
% of Malawi Population 1.4%56.8%15.2%1.0%74%
All water points are direct groundwater sources and are either functional or partly functional. ‘No. of users’ calculation is based on the number of users per each water point. * AUNA = Area Under National Administration.
Publisher’s Note: MDPI stays neutral with regard to jurisdictional claims in published maps and institutional affiliations.