Abstract
Brazil is the world’s largest sugarcane producer with projections for expanding the current area by 30% in the coming years, mainly in areas previously occupied by pastures. We assess soil water changes induced by land-use change (LUC) for sugarcane expansion in the central-south region of Brazil. For that purpose, soil samples were collected in a typical LUC sequence (native vegetation–pasture–sugarcane) in two contrasting soil textures (i.e., sandy and clayey). Soil hydro-physical properties such as pores size distribution, bulk density, soil water content, water tension, and drainage time at field capacity, plant-available water, and S-index were analyzed. Our data showed that long-term LUC from native vegetation to extensive pasture induced severe degradation in soil physical quality and soil water dynamics. However, conventional tillage used during conversion from pasture to sugarcane did not cause additional degradation on soil structure and soil water dynamics. Over time, sugarcane cultivation slightly impaired soil water and physical conditions, but only in the 10–20 cm layer in both soils. Therefore, we highlight that sustainable management practices to enhance soil physical quality and water dynamics in sugarcane fields are needed to prevent limiting conditions to plant growth and contribute to delivering other ecosystem services.
1. Introduction
Brazil is the world’s largest sugarcane producer, accounting for 40% of global production. Currently, the sugarcane area covers 10 million hectares, predominantly concentrated (92%) in the central-south region of Brazil [1]. Growing global bioenergy demand has driven a substantial increment of the sugarcane cultivated area since the early 2000s. In the last decade only, the Brazilian sugarcane area increased by 50% [1]. Despite the economic challenges that many countries face nowadays, Brazil is committed to promoting sugarcane production in the next years, having projections for expanding the current sugarcane area by 30% [2,3]. This expansion has occurred in the central-southern region [1], mainly in areas previously covered with pasture [4,5]. The Brazilian large-scale sugarcane production system is predominantly based on conventional tillage and intensive machinery traffic during the cultivation cycle [6]. Therefore, soil physical degradation as soil compaction induced by field traffic has become one of the major concern among sugarcane farmers, consultants, and researchers [7]. Recent studies have shown that land-use change (LUC) for sugarcane cultivation can negatively affect several soil physical properties such as pore size [8] and shape [9], bulk density and penetration resistance [10], and soil structural stability [11]. Those changes in soil physical properties inevitably can alter hydraulic conductivity [10] and retention in the soil. Moreover, physically degraded soils may reduce the water availability to plants and soil biota, compromising not only provisioning ecosystem services expressed by crop yield, but also other related ecosystem services, such as C sequestration, erosion control, and water purification.
Nevertheless, there is a paucity of studies that focused on soil water changes induced by LUC to sugarcane expansion. For example, Cherubin et al. [10] conducted a comprehensive evaluation of LUC effects on soil physical quality, but they only measured soil hydraulic conductivity to infer about potential changes in soil water dynamics. In addition, the authors highlighted that these modifications could depend on the elapsed time since the LUC, tillage, and other management practices adopted on sugarcane cultivation. Conventional tillage increases soil hydraulic conductivity [10]; besides this soil physical benefit, conventional tillage causes negative effects on soil (e.g., inversion of soil horizons, breakdown of macro-aggregates, aggregate slaking, clay dispersion, accelerated oxidation of soil organic carbon, and accelerated decomposition of plant root and shoot), as well as are no longer noticeable after successive cycles including heavy mechanization [8,12]. Therefore, the initial impact of conversion from pasture to sugarcane (i.e., first time impact) over water dynamics in soil remains poorly explored, representing an important research gap for broader sustainability assessment of sugarcane expansion and production in Brazil [13] and elsewhere.
Soil water management is an environmental and socio-technical challenge to sugarcane expansion in tropical regions [14]. Monitoring the water resources is essential to ensure that sugarcane expansion will not compromise them [15], not only in soils more resistant to degradation (i.e., clayey soils, as a consequence of higher aggregate stability and lower susceptibility to erosion) but also in soils more susceptible to degradation (i.e., sandy soils, as a consequence of poor soil structure, lower aggregate stability, and higher susceptibility to erosion) [16,17], which are prevalent in most regions of sugarcane expansion in Brazil. Besides that, it is estimated that 70–80% of the yield gap in sugarcane fields is caused by water deficit throughout the crop cycle in different regions of Brazil [18], which can be associated with degraded soil structure, poor soil aeration, and reduced water storage [19].
Soil hydraulic properties, which are useful for describing the patterns of water in the soil, can be extracted from the soil water retention curve. The soil water retention curve is described as the relationship between soil water content and matric potential [20]. From this relationship, some physical indicators associated to pore-size distribution [21], water and air capacity, drainage time [22], field capacity, permanent wilting point, and hydraulic conductivity [23], can be obtained. Additionally, soil physical quality can be linked to water dynamics and pore-size distribution through the S-index derived from the soil water retention curve [23,24]. The use of those indicators may provide better comprehension about the impacts of LUC on soil water and air fluxes [25], as well as its impact on soil functions and ecosystem services related to water dynamics regulation and soil erosion control [26].
Comprehensive in-field studies are fundamental to design more sustainable management practices that increase water retention, plant-available water content, and soil porosity, optimizing the landscape management in the current climate change age [27]. For that purpose, the study objective was to evaluate the effects of a typical LUC sequence (native vegetation–pasture–sugarcane) for sugarcane expansion on soil water dynamics in contrasting soil textures in central-southern Brazil. Our hypothesis is that soil hydro-physical properties are negatively affected as a consequence of this LUC sequence, and successive sugarcane cultivation, regardless of soil texture, negatively affects soil water processes and associated functions.
2. Materials and Methods
2.1. Experimental Site and LUC Sequence
The study was conducted in two sites with contrasting soil textures located in Brotas (22°17′ S and 48°07′ W) and Manduri (23°00′ S and 49°19′ W), São Paulo (SP) state, central-south region of Brazil, the main site of sugarcane expansion of the country. The soil classification and texture and climate information for each site can be found in Table 1 and Figure 1, respectively. To facilitate the presentation and interpretation of results, we named the sites as Sandy soil (site 1) and Clayey soil (site 2) and have used them throughout the manuscript. The LUC soil sampled sequence in both sites represents the most ordinary LUC’s convention in central-southern Brazil (i.e., native vegetation (NV)—pasture (PA)—sugarcane (SC)). Sugarcane fields were further analyzed shortly after the conversion, during the plant cane cycle (SCplant) and for a longer period after the conversion, during ratoon cycles (SCratoon). The sugarcane cycle is about five years with annual harvestings. The first year after planting is considered the plant cane cycle. After the first harvest (i.e., 12–18 months after the planting) the ratoon cycles start, which represent the interval between following annual harvesting from the second to the fifth year. After the fifth year, the sugarcane is replanting using soil tillage practices. In our study, SCratoon was in the first ratoon cycle in the Sandy soil and the second ratoon cycle in the Clayey soil, therefore soil conditions were similar between the two sites, even the age of LUC was different. The land-use history and the management practices for both places are shown in Table 2.

Table 1.
Location and soil particle-size distribution at the Sandy and Clayey soil in the State of São Paulo, Brazil.
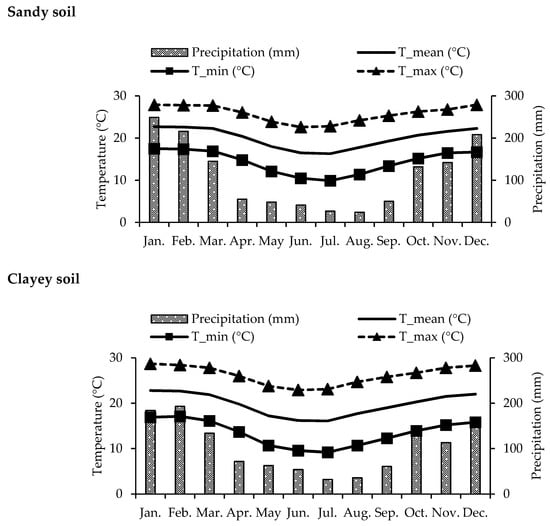
Figure 1.
Mean monthly temperature (maximum, mean, and minimum) (°C) and mean annual precipitation (mm) for Sandy soil (near the city of Brotas-SP) and Clayey soil (near the city of Manduri-SP). Source: climate-date.org (https://pt.climate-data.org/).
Table 2.
History of land use and description of management practices conducted in each study area.
2.2. Soil Sampling
Undisturbed soil cores were sampled in both sites during the summer in February 2019. The samplings consisted of four sample points spaced 50 m apart in each land-use area to represent LUC. Samples were taken from the center of soil layers 0–10, 10–20, and 20–30 cm using cylindrical rings of ~100 cm3 (5 cm in diameter by 5 cm in height). In sugarcane fields, the samples were taken from the crop inter-row position five months after conversion and planting in SCplant in both places, in the first ratoon in the Sandy soil and the second ratoon cycle in the Clayey soil in SCratoon. A total of 96 samples were taken and then forwarded to the laboratory for analysis.
2.3. Soil Water Retention Curve Determination
To avoid any confusion in signals and for the mathematical formulation, the matric potential (Ψ) will be described in terms of water tension (h), which can be given as h = |Ψ|. The undisturbed soil cores were saturated with distilled water by capillarity for 48 h and subjected to the h of 10, 30, 60, 100, 330, and 1000 hPa, whereas disturbed soil samples previously sieved through a 2 mm sieve, saturated in small rings of known volume and subjected to the h of 5000, 10,000, and 15,000 hPa. Both undisturbed and disturbed soil sampled were equilibrated using a pressure plate apparatus. After reaching the hydraulic equilibrium, the samples were weighed and oven-dried at 105 °C for 24 h to determine the water content and bulk density. Bulk density was calculated as the ratio between oven-dried soil mass and the total volume of the soil, whereas the gravimetric water content was calculated as the difference between the mass of the samples at each water tension and that at oven-dried conditions.
Soil water retention data were fitted to the van Genuchten model [30], Equation (1):
where θ and h are the volumetric water content (m3 m−3) and soil water tension (hPa), respectively; θs and θr are the fitted saturated and residual water contents (m3 m−3); and α and n are fitting parameters (Table S1).
The van Genuchten-based approach given by Assouline and Or [31] was used for calculation of the h at field capacity (hFC) (Equation (2)), which was used to calculation of the volumetric water content at field capacity (θFC) (using Equation (1)):
The saturated hydraulic conductivity was estimated using the θs and α van Genuchten parameters, as described by Guarracino [32]. From the saturated and unsaturated soil hydraulic conductivities, we calculated the time to reach the field capacity (tFC) using the procedure given by Assouline and Or [31] and Meskini-Vishkaee et al. [33] (Equation (3)):
where z is the soil depth (cm), Ks is saturated hydraulic conductivity (cm d−1), and K(θFC) is the unsaturated hydraulic conductivity at the volumetric water content at the field capacity (cm d−1), which was calculated by the van Genuchten [30] procedure.
Plant-available water (PAW) was then calculated using the water content available between the θFC and that measured at −15,000 hPa. Pore-size distribution was determined using the soil pore volume fractions for the h values <30 hPa, 30–100 hPa, and >100 hPa, which were used as thresholds for calculation of the macro-, meso-, and micropores, following Cavalcanti et al. [8]. The soil pore volume correspondent to the macro-, meso-, and microporosity were extracted from the fitted water retention curve (applying Equation (1)) for each land use. Finally, S-index was calculated using the van Genuchten parameters by applying the expression given by Dexter [24] (Equation (4)):
where S is the S-index, n, θs, and θr (volumetric water contents) are van Genuchten parameters; and BD is soil bulk density.
The S-index has been used as a sensitive indicator of soil physical quality. According to Dexter and Czyz [34], based on S-index values, the soil physical quality can be classified as very poor (S-index < 0.020), poor (0.020 > S-index < 0.035), good (0.035 > S-index < 0.050), and very good (S-index > 0.05).
2.4. Data Analysis
The analysis of variance (ANOVA) was calculated through the PROC GLM routine to test LUC effects on soil pores size distribution, bulk density, and parameters from the soil water retention curve (SWRC) within each site. When the values of the ANOVA results were significant (p < 0.05), the means were separated using Tukey test (p < 0.05). All statistical procedures were performed using Statistical Analysis System—SAS 9.3 software (SAS Inc., Cary, NC, USA). Moreover, a canonical discriminant analysis was used to examine variables relationships and treatment differences in a multivariate approach. Biplot graphs were used to examine the dispersion of the canonical scores associated with original variables, as well as the impact of these variables on the discrimination of the treatments. The mean values of the canonical variables for each treatment were compared by 95% confidence spheres. The graphs and statistical procedures were performed using the R Software [35].
3. Results
3.1. Soil Pores Size Distribution and Bulk Density
The pore-size distribution was altered due to conversion from NV to PA in both soils, although the magnitude of changes varied between soils (Figure 2a,c). While microporosity increased in the PA of the Sandy soil, no changes were observed in the Clayey soil. The mesoporosity was reduced in both soils (Figure 2), but macroporosity was reduced only in the surface layer of the Sandy soil, reaching a value lower than 0.10 m3 m−3 (Figure 2a). Furthermore, this land transition from NV to PA reduced total porosity in the surface layer of the Sandy soil, and in the subsurface layers (10–20 and 20–30 cm) of the Clayey soil. The reduction in mesopores increased micropores in the Sandy soil but did not increase it in the Clayey soil (Figure 2c). In addition, the reduction in mesopores was responsible for the reduction in total porosity in the Clayey soil (e.g., 10–20 and 20–30 cm layers).
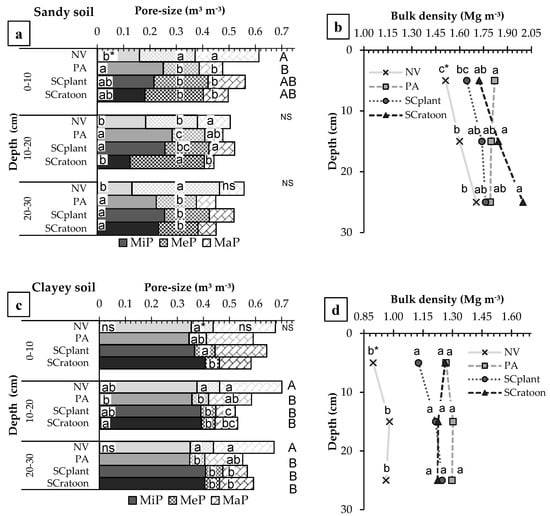
Figure 2.
Soil pore-size distribution (microporosity (MiP) ≤15 μm, mesoporosity (MeP) = 15–50 μm, macroporosity (MaP) ≥50 μm), total porosity (a,c), and bulk density (b,d) from 0–10, 10–20, and 20–30 cm layers under native vegetation (NV), pasture (PA), sugarcane plant (SCplant), and sugarcane ratoon (SCratoon) at Sandy soil (a,b) and Clayey soil (c,d). * Mean values within each site and each pore-size distribution in the same depth followed by the same letter do not differ among themselves according to Tukey’s test (p < 0.05). ns Not significant.
Short-term conversion from PA to SCplant did not change the microporosity of both soils. On the other hand, conversion from PA to SCratoon altered the microporosity in the 10–20 cm layer of both soils. Microporosity was reduced in the Sandy soil and increased in the Clayey soil. Consequently, this conversion increased mesoporosity in this same layer in the Sandy soil. Microporosity and macroporosity were also reduced in SCratoon in comparison to SCplant in the 10–20 cm layer in the Sandy soil. However, in both soils, total porosity was not altered due to conversion from PA to sugarcane.
The alterations in pores size distribution, e.g., total porosity and mesoporosity were reflected in an increment of bulk density when NV was converted to PA. Bulk density increased by 17% in the surface layer of the Sandy soil (Figure 2b) and about 27% in all layers of the Clayey soil (Figure 2d). Conversion from PA to SCplant reduced bulk density by 10%, but only in the surface layer in the Sandy soil. Moreover, sugarcane cultivation (SCratoon) did not induce changes in bulk density in comparison to PA. In SCratoon, bulk density values were lower than 1.30 Mg m−3 (Figure 2d) in the Clayey soil and varied between 1.74 Mg m−3 and 2.0 Mg m−3 in the Sandy soil (Figure 2b).
3.2. Field Capacity (θFC, hFC, tFC) and Soil Water Retention Curve (SWRC)
The conversion from NV to PA did not alter θFC in the Sandy soil, where it varied from 0.17 to 0.23 m3 m−3 (Figure 3a). Besides that, this conversion reduced soil water content at field capacity in the 10–20 cm layer from 0.47 to 0.43 m3 m−3 in the Clayey soil (Figure 3b). The conversion from PA to SCplant did not alter the θFC in both soils at all layers. However, the SCratoon reduced the θFC by 50% when compared to PA and SCplant in the 10–20 cm soil depth, but it was not altered in other layers in the Sandy soil (Figure 3a). Therefore, the higher limit of plant-available water was altered in the 10–20 cm layer in both soils.
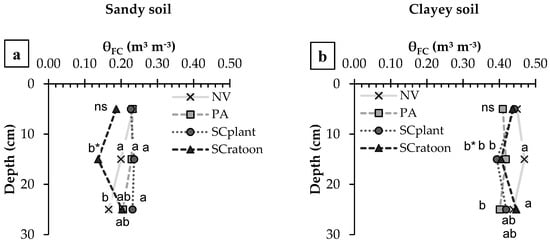
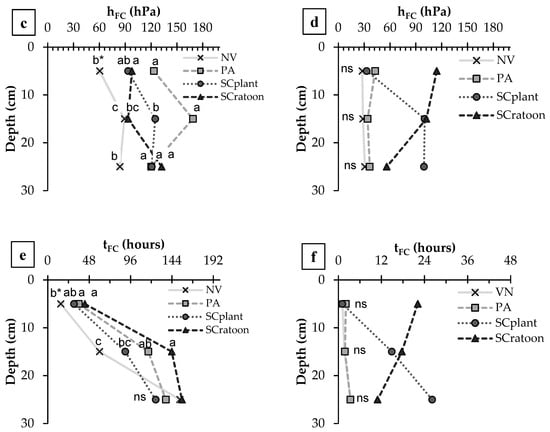
Figure 3.
Water content at field capacity (θFC) (a,b), water tension at field capacity (hFC) (c,d), drainage time to reach the field capacity (tFC) (e,f) from 0–10, 10–20, and 20–30 cm layers under native vegetation (NV), pasture (PA), sugarcane plant (SCplant), and sugarcane ratoon (SCratoon) at Sandy and Clayey soil. * Mean values within each site in the same depth followed by the same letter do not differ among themselves according to Tukey’s test (p < 0.05). ns Not significant.
The hFC was increased by 50% after the conversion from NV to PA in the Sandy soil. In the Clayey soil, whose hFC varied from 30 to 100 hPa (Figure 2d), no change was observed after conversion. However, the conversion from PA to SCplant and SCratoon reduced hFC from 169 to 120 and 90 hPa, respectively, in the 10–20 cm layer of the Sandy soil (Figure 2c). Furthermore, conversion from NV to PA increased tFC in the soil surface, but the conversion from PA to SCplant and SCratoon did not alter tFC in this soil when compared to PA. In the Clayey soil, tFC varied from 1 to 22 h and was not altered in the LUC sequence (Figure 3f). Therefore, neither hFC nor tFC were sensitive indicators to detect alterations due to LUC in the Clayey soil. It shows then that hFC and tFC are sensitive to alterations in soil structure mainly in the Sandy soil.
The SCratoon reduced θFC in the 10–20 cm layer in the Sandy soil but did not alter other layers nor differed as to SCplant in the Clayey soil. Furthermore, the tFC and hFC did not differ between SCratoon and SCplant in both soils (Figure 3).
The SWRCs for both soils are shown in Figure 4. The total porosity was responsible for higher water retention in the NV at lower h in the Clayey soil as well as in the NV and SCplant in the Sandy soil. Therefore, the alterations on θFC can be seen in the SWRC. The higher θFC in NV related to PA, SCplant, and SCratoon in the 10–20 cm layer in the Clayey soil reflected on the difference observed in the SWRC close to tFC (i.e., 30–90 hPa) (Figure 4d). However, a higher proportion of mesopores corresponds to lower water retention, as shown in the Sandy soil when compared to the Clayey soil. The higher mesoporosity in the Sandy soil also affected tFC in function of depth (Figure 3e). This higher mesoporosity effected the SWRC due to the higher decline of the curve in SCratoon (Figure 4c) and in NV (Figure 4e).
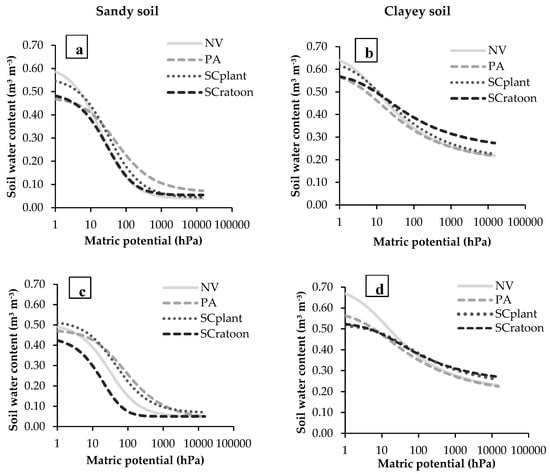
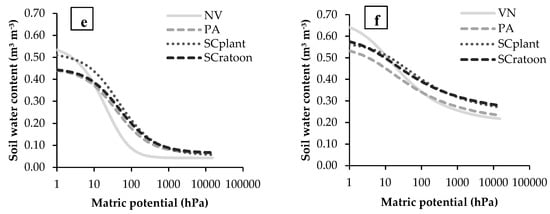
Figure 4.
Average soil water retention curve (SWRC) from 0–10 (a,b), 10–20 (c,d), and 20–30 cm (e,f) layers under native vegetation (NV), pasture (PA), sugarcane plant (SCplant), and sugarcane ratoon (SCratoon) at Sandy soil (a,c,e) and Clayey soil (b,d,f).
3.3. Plant-Available Water Content (PAW) and S-Index
PAW varied from 0.09 to 0.20 m3 m−3 in the Sandy soil (Figure 5a) and from 0.17 to 0.27 m3 m−3 in the Clayey soil (Figure 5b). For both soils, the conversion from NV to PA did not alter PAW. The main alteration in this parameter was a reduction observed in SCratoon compared to PA in the 10–20 cm layer in both soils. The pattern of PAW was different in SCratoon and SCplant in the 10–20 cm layer in each soil. While PAW was lower in the SCratoon in comparison to SCplant (Figure 5a) in the Sandy soil, SCratoon and SCplant presented similar PAW in that layer of the Clayey soil (Figure 5b).
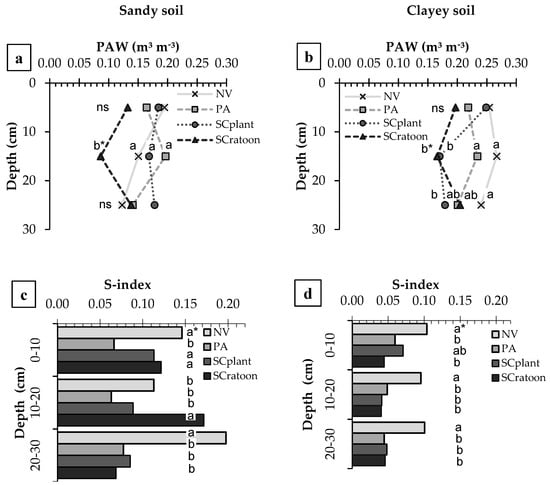
Figure 5.
Plant-available water (PAW) content (a,b) and S-index (c,d) from 0–10, 10–20, and 20–30 cm layers under native vegetation (NV), pasture (PA), sugarcane plant (SCplant), and sugarcane ratoon (SCratoon) at Sandy soil (a,c) and Clayey soil (b,d). * Mean values within each site in the same depth followed by the same letter do not differ among themselves according to Tukey’s test (p < 0.05). ns Not significant.
The S-index derived from the SWRC was sensitive to detecting alterations in soil structure due to LUC. Conversion from NV to PA reduced S-index from 0.13 to 0.06 in the Sandy soil (Figure 5c) and from 0.10 to 0.05 in the Clayey soil (Figure 5d). In contrast, the conversion from PA to SCplant did not have a negative impact on S-index and even promoted improvement in the surface layer of Sandy soil. Similarly, SCratoon also presented close or higher S-index values as compared to PA, reaching similar values to NV in the Sandy soil (Figure 5c). Lastly, based on S-index values, soil physical quality was classified as very good in all land uses in the Sandy soil, very good in NV, and good in PA, SCplant, and SCratoon in the Clayey soil.
3.4. Relationships among Hydro-Physical Indicators and Land Use
Figure 6 shows the distribution of land use with soil water indicators as explanatory variables in the dispersion of the canonical scores in each soil. The two axes together explained 85% and 93% of the variance for the Sandy and Clayey soil, respectively. In both soils, S-index, mesoporosity, and macroporosity were associated with NV, whereas bulk density, microporosity, hFC, and tFC were not associated with NV. Therefore, the CAN1 (Figure 6), which explained most of the total data variance, showed better soil physical quality in NV when compared to PA, SCplant, and SCratoon in both soils.
Figure 6.
Dispersion of the canonical scores associated with soil porosity (MaP = macroporosity, MeP = mesoporosity, MiP = microporosity), bulk density (BD), parameters from soil water retention curve (θFC = soil water content at field capacity, hFC = water tension at field capacity, tFC = drainage time to reach the field capacity, PAW = plant-available water content, S-index) in four land uses: (NV= native vegetation, PA = pasture, SCplant = sugarcane plant, SCratoon = sugarcane ratoon). n = 48.
In addition, PAW had a positive correlation with θFC and microporosity in the Sandy soil and with macroporosity, mesoporosity, and S-index in the Clayey soil. On the other hand, the higher hFC and tFC were associated with higher bulk density and microporosity.
4. Discussions
4.1. LUC Impacts on Soil Physical Quality and Water Dynamics
4.1.1. Land Transition from Native Vegetation to Pasture
The conversion from NV to PA substantially altered the soil physical properties and, consequently, the soil water dynamics. The reduction in soil macropores and mesopores due to the conversion from NV to PA (Figure 2) reduced soil water retention at lower h (e.g., <10 hPa) (Figure 4). While PA reduced soil water retention in lower h, this conversion had positive effects on soil water retention in higher h (e.g., >10 hPa) due to the transition from mesopores to micropores, as well as an increase in bulk density. As a consequence, the hFC (Figure 3c) and tFC (Figure 3e) were higher at PA in the Sandy soil. These results of hFC and tFC reflected the increment on soil compaction and agree with Cherubin et al. [10], who observed a reduction in field-saturated hydraulic conductivity in pasture areas. Although a higher bulk density in PA in comparison to NV was observed, this increase did not reflect in alterations in hFC and tFC in the Clayey soil. However, the lower stocking rate during grazing in the Clayey soil when compared to the Sandy soil (Table 2) can be an important aspect [36] that attenuated water dynamic changes in this soil. In addition, it should be noted that excessive soil water retention at higher h in PA can impair grass growth, due to a limited supply of oxygen to plants, since macropores were <0.10 m3 m−3, which is considered critical for air fluxes in the soil [37]. In addition, the association between hFC and tFC (Figure 6) showed that land uses with higher hFC will have higher tFC (e.g., PA in comparison to NV), which might negatively affect air fluxes.
Furthermore, the increase in bulk density reached critical values in the Sandy soil (i.e., 1.60 Mg m−3), according to Reynolds et al. [23], and did not reach critical values in the Clayey soil (i.e., 1.33 Mg m−3), according to Reichert et al. [38]. Nevertheless, mesoporosity and macroporosity were reduced in the PA in the Clayey soil, which indicates alterations in soil structure due to LUC, as can be seen in Figure 6 by the association of these parameters with NV. The alterations in soil structure by LUC from NV to PA in tropical regions were described by several authors. First, conventional soil tillage used at land conversion breaks soil aggregates [39], leading to increased soil C oxidation to the atmosphere [38,40]. Secondly, after conversion of external drivers such as soil compaction due to continuous cattle trampling, this negatively influences the soil structure [9,17], water movement [10], and consequently, important ecosystem services, such as grass productivity, soil biodiversity and C sequestration [11], and erosion control. Therefore, the poor soil structure in PA and reduced vegetation cover in poorly managed pastures make the soil more susceptible to runoff [41] and soil erosion [39], mainly in months with higher precipitation, i.e., from October to March in the studied region (Figure 1).
In addition, the S-index was able to confirm alterations in soil water dynamics where conversion from NV to PA reduced soil structure quality by about 50% (Figure 5c,d), and θFC was reduced in Clayey soil. Despite those reductions, PAW was not altered in this scenario being considered ideal (>0.20 m3 m−3) for maximum root growth in the Clayey soil and good (≥0.15, ≤0.20 m3 m−3) in the Sandy soil, according to Reynolds [20].
Our findings showing soil physical degradation and its consequent negative implications on water dynamics in extensive PA soils confirm what previous studies with a broader scope have reported, namely that those areas are characterized by poor overall soil quality [42] and provision of soil-related ecosystem services [13], low productivity and stocking rate [5], and low economic developments to farmers, workers, and the surrounding urban centers [13]. Due to all these environmental and socio-economic aspects, the prevalent scenario of sugarcane and other annual crops expansion has been, and will continue to be, over areas previously occupied with extensive pasture [4,13]. The full monitoring of PA soil conditions is fundamental to evaluate if sugarcane cultivation is degrading, sustaining, or even enhancing soil quality compared to the pasture baseline.
4.1.2. Conversion from Pasture to Sugarcane Cultivation
The transition from PA to sugarcane cultivation did not negatively impact water dynamics in both soils, refuting our initial hypothesis. Conventional tillage by plowing and disking (Table 2) break up soil structure [8], which sometimes reduces bulk density and increases soil porosity as compared to the previous use [43]. Therefore, in the Sandy soil, where bulk density was considered critical in PA, the conversion to SCplant alleviated soil compaction mainly on the soil surface making the soil structure in SCplant similar to the one observed in NV. As a consequence of that, an increase in soil water retention at lower h (Figure 4a,c,e), coupled with an increase in S-index (e.g., 0–10 cm layer), reduction in hFC (e.g., 10–20 cm layer) and tFC, and association with PAW and θFC (Figure 6) were observed. In a previous study by Cherubin et al. [10], conversion from pasture to sugarcane was able to increase the field-saturated hydraulic conductivity and decrease bulk density.
In the clayey soil, where PA did not reach the critical bulk density, the conversion from PA to SCplant negatively affected soil porosity and reduced PAW only in the 10–20 cm layer. In that case, soil macropores were reduced to lower than 0.10 m3 m−3 (Figure 2c); consequently, PAW decreased from 0.23 to 0.17 m3 m−3 (Figure 5b). Similar results were observed by Cavalcanti et al. [8] when soil tillage at the sugarcane replanting degraded soil structure and altered soil porosity. Despite the critical value of macroporosity (<0.10 m3 m−3) [37] being reached in SCplant, no limitation was observed for available water content [20], as shown in Figure 5b. Furthermore, the initial impact after conversion from PA did not cause substantial alterations in soil structure and soil water dynamics, as previously expected.
A negative impact induced by conversion from pasture to sugarcane was found by Youlton et al. [44] in a Quartzipsamments with 12% clay, who reported that runoff was increased in sugarcane just after the conversion due to soil disturbance and absence of soil cover. However, results from soil porosity and bulk density in SCplant showed a higher potential of water infiltration in comparison to PA, considering that about 3% of the amount of total rainfall might cause runoff near the city of Brotas-SP [41]. Besides, during sugarcane ratoon cultivation, there is no additional soil disturbance, and plant canopy plus crop residues could substantially reduce the risks of soil erosion and soil losses [41,44].
Results from SCratoon showed that sugarcane cultivation altered the soil structure mainly in 10–20 cm layer where the observed θFC values were lower than PA (Figure 3a), and the PAW values were limited (Figure 5a) [20] in the Sandy soil. After soil disturbance by conversion from pasture to sugarcane, machinery traffic by harvesters, tractors, and loaded trailers during harvesting intensifies soil compaction [6,45,46], mainly in the subsurface layer [47]. Soil compaction induced by machinery traffic likely explains the reduction in the PAW, of the soil water retention at lower h (Figure 4c), and alterations in soil porosity in the 10–20 cm layer in SCratoon in both soils (Figure 2a,c). Despite that, SCratoon not only did not display altered bulk density in comparison to PA (Figure 2) but showed an increased S-index in this soil layer (Figure 5c). These results alleviate the negative impacts related to θFC in SCratoon and concur to the findings of Cherubin et al. [10] and Luz et al. [16], who did not find increases in bulk density due to conversion from pasture to sugarcane.
Soil compaction by traffic can positively affect soil water retention due to rearrangement of pore-size distribution in sandy soils, as reported by Moraes et al. [48] in a Typic Paleudult with 25% of clay and 55% of sand. However, our findings indicated an inverse pattern in the Sandy soil, in which there was a reduction in PAW in SCratoon that has experienced successive machinery traffic. In this case, the soil with a lower amount of clay and a higher amount of sand (Table 1) responded differently to machinery traffic, when compared to the results reported by Moraes et al. [48], and tillage followed by traffic altered soil pore-size distribution in SCratoon (e.g., 10–20 cm layer) (Figure 2a). Nonetheless, a positive effect on soil water retention due to compaction could be confirmed when macroporosity does not reach critical values. Macroporosity reached critical values not only in sugarcane fields but also in pasture soils (Figure 2a). This compaction reinforces the poor structural stability of sandy soils, mainly in deeper layers [49].
Despite alteration in the 10–20 cm layer, conversion from PA to sugarcane did not change PAW and soil pore-size distribution in the soil surface and the lowest layer. In addition, about 60–90% of the sugarcane root system is distributed in the 0–40 cm layers [49,50], which allows sugarcane to explore soil layers with no limited water uptake. This means that no alterations in the soil water uptake by plants is expected as a result of the conversion from PA to sugarcane during the annual cycle, especially in periods of high-water deficit (Figure 1). Besides, our data showed that the management adopted in sugarcane cultivation (SCplant and SCratoon) did not induce water (PAW) and mechanical (bulk density) limiting conditions to plant growth in the Clayey soil. The S-index values corroborate it, indicating that those soils present good physical quality. Additionally, the principal component analysis demonstrated a positive correlation between S-index and mesoporosity (Figure 6), which was not altered in sugarcane fields.
As a result of the previous conditions of extensive pasture characterized by compacted soils, conventional tillage for planting sugarcane did not induce additional degradation on soil structure and soil water dynamics. During the sugarcane cycle, comparing SCplant and SCratoon, soil water retention was reduced in the Sandy soil, but only in the 10–20 cm layer, and it was not altered in the Clayey soil. In addition, tFC and PAW were increased and reduced, respectively, in the 10–20 cm layer in the Sandy soil. Thus, the Sandy soil was shown to be more prone to physical degradation by machinery traffic than the Clayey soil. On the other hand, the increased water retention promoted by SCratoon in the 0–10 cm layer (Figure 4b) did not change bulk density, soil porosity, and water dynamics when compared to SCplant.
4.2. Sustainable Management Practice to Enhance Water Dynamics in Sugarcane Fields
Despite the similar conditions observed in SCplant and SCratoon related to soil water dynamics, sugarcane fields are still susceptible to soil compaction [51,52], mainly in the 10–20 cm layer. The risk of compaction in sugarcane fields is dependent not only on machinery traffic but also on the management system [46]. Therefore, soil management such as a no-tillage system [12] and reduced tillage [53] can be promising strategies for reducing tension transmission through the soil profile [54] and, consequently, reduce the negative impact on soil structure. Additionally, keeping sugarcane straw on the soil surface after harvesting increases soil carbon content [55], reduces the negative impact of the raindrop splash effect, and reduces the negative impact on soil structure caused by traffic [50,56]. Therefore, these practices have the potential to improve soil water retention, field capacity, and PAW and make the soil more resistant to soil erosion processes.
The benefits of soil management practices, which reduce soil disturbance, keep the soil surface covered, and promoted balanced water and air contents in the soil, should be accompanied by other important conservation practices such as crop rotation or cover crops during sugarcane planting [57] and controlled traffic in sugarcane fields [58]. The latter is fundamental to minimize soil compaction [47] preserving appropriated soil hydro-physical conditions to sugarcane growth [58], and reducing sugarcane yield losses [18].
We expect that our findings can be useful for a better understanding of the impacts of sugarcane expansion in contrasting soils in the central-southern region of Brazil. Furthermore, this information can serve as a scientific basis to design better soil management practices, that increase soil water conservation by reducing runoff and soil erosion. Finally, our findings can also be valuable for an array of modeling purposes, such as prediction of plant growth, hydrological processes, and broader ecosystem services assessments.
5. Conclusions
Long-term LUC from native vegetation to extensive pasture induced the degradation of the soil physical quality and soil water dynamics. This leads pasture soils into a vicious cycle, in which poor soil hydro-physical functioning leads to pasture degradation, and then consequently, pasture degradation and continuous grazing lead to further degradation of soil properties, functions, and services.
One strategy to reincorporate those pasturelands into a productive system is through converting those areas for sugarcane cultivation. Our data showed that even conventional tillage used during such conversion did not cause additional degradation to soil structure and soil water dynamics. Over time, sugarcane cultivation slightly impaired soil water and physical conditions, but only in the 10–20 cm layer in both soils. We highlight that sustainable management practices to enhance soil physical quality and water dynamics in sugarcane fields are needed to prevent limiting conditions to plant growth and synergistically contribute to delivering other ecosystem services.
Supplementary Materials
The following are available online at https://www.mdpi.com/2073-4441/12/11/3156/s1, Table S1: Adjustment parameters from van Genuchten (1980) for the average soil water retention curves.
Author Contributions
Conceptualization, F.B.d.L. and M.R.C.; methodology, F.B.d.L., D.A.d.B., B.E.S., and M.L.C.; software, validation, formal analysis, F.B.d.L. and R.P.d.L.; data curation, F.B.d.L. and M.R.C.; writing—original draft preparation, F.B.d.L., R.P.d.L., M.L.C., D.A.d.B., and B.E.S.; writing—review and editing, F.B.d.L., R.P.d.L., M.L.C., and M.R.C. visualization, supervision, project administration, and funding acquisition, M.R.C. All authors have read and agreed to the published version of the manuscript.
Funding
This research was funded by São Paulo Research Foundation (FAPESP), grant number 2018/09845-7; the Coordenação de Aperfeiçoamento de Pessoal de Nível Superior—Brasil (CAPES)—Finance Code 001; and the Brazilian National Council for Scientific and Technological Development (CNPq), grant number 427170/2018-4.
Conflicts of Interest
The authors declare no conflict of interest. The funders had no role in the design of the study; in the collection, analyses, or interpretation of data; in the writing of the manuscript, or in the decision to publish the results.
References
- CONAB. Acompanhamento da Safra brasileira de cana-de-açúcar. 2020, 1, 64. [Google Scholar]
- Goldemberg, J.; Mello, F.F.C.; Cerri, C.E.P.; Davies, C.A.; Cerri, C.C. Meeting the global demand for biofuels in 2021 through sustainable land use change policy. Energy Policy 2014, 69, 14–18. [Google Scholar] [CrossRef]
- Andrade Junior, M.A.U.; Valin, H.; Soterroni, A.C.; Ramos, F.M.; Halog, A. Exploring future scenarios of ethanol demand in Brazil and their land-use implications. Energy Policy 2019, 134, 110958. [Google Scholar] [CrossRef]
- Adami, M.; Rudorff, B.F.T.; Freitas, R.M.; Aguiar, D.A.; Sugawara, L.M.; Mello, M.P. Remote sensing time series to evaluate direct land use change of recent expanded sugarcane crop in Brazil. Sustainability 2012, 4, 574–585. [Google Scholar] [CrossRef]
- Strassburg, B.B.N.; Latawiec, A.E.; Barioni, L.G.; Nobre, C.A.; da Silva, V.P.; Valentim, J.F.; Vianna, M.; Assad, E.D. When enough should be enough: Improving the use of current agricultural lands could meet production demands and spare natural habitats in Brazil. Glob. Environ. Chang. 2014, 28, 84–97. [Google Scholar] [CrossRef]
- De Lima, R.P.; Rolim, M.M.; da Daniel, D.; da Silva, A.R.; Mendonça, E.A.S. Compressive properties and least limiting water range of plough layer and plough pan in sugarcane fields. Soil Use Manag. 2020, 1–12. [Google Scholar] [CrossRef]
- Martíni, A.F.; Valani, G.P.; Boschi, R.S.; Bovi, R.C.; Simões da Silva, L.F.; Cooper, M. Is soil quality a concern in sugarcane cultivation? A bibliometric review. Soil Tillage Res. 2020, 204, 104751. [Google Scholar] [CrossRef]
- Cavalcanti, R.Q.; Rolim, M.M.; de Lima, R.P.; Tavares, U.E.; Pedrosa, E.M.R.; Cherubin, M.R. Soil physical changes induced by sugarcane cultivation in the Atlantic Forest biome, northeastern Brazil. Geoderma 2020, 370, 114353. [Google Scholar] [CrossRef]
- Canisares, L.P.; Cherubin, M.R.; Silva, L.F.S.; Franco, A.L.C.; Cooper, M.; Mooney, S.J.; Cerri, C.E.P. Soil microstructure alterations induced by land use change for sugarcane expansion in Brazil. Soil Use Manag. 2020, 36, 189–199. [Google Scholar] [CrossRef]
- Cherubin, M.R.; Karlen, D.L.; Franco, A.L.C.; Tormena, C.A.; Cerri, C.E.P.; Davies, C.A.; Cerri, C.C. Soil physical quality response to sugarcane expansion in Brazil. Geoderma 2016, 267, 156–168. [Google Scholar] [CrossRef]
- Franco, L.C.; Cherubin, M.R.; Cerri, C.E.P.; Six, J.; Wall, D.H.; Cerri, C.C. Linking soil engineers, structural stability, and organic matter allocation to unravel soil carbon responses to land-use change Andre. Soil Biol. Biochem. 2020, 150, 107998. [Google Scholar] [CrossRef]
- Barbosa, L.C.; Magalhães, P.S.G.; Bordonal, R.O.; Cherubin, M.R.; Castioni, G.A.F.; Tenelli, S.; Franco, H.C.J.; Carvalho, J.L.N. Soil physical quality associated with tillage practices during sugarcane planting in south-central Brazil. Soil Tillage Res. 2019, 195, 104383. [Google Scholar] [CrossRef]
- Oliveira, D.M.S.; Cherubin, M.R.; Franco, A.L.C.; Santos, A.S.; Gelain, J.G.; Dias, N.M.S.; Diniz, T.R.; Almeida, A.N.; Feigl, B.J.; Davies, C.A.; et al. Is the expansion of sugarcane over pasturelands a sustainable strategy for Brazil’s bioenergy industry? Renew. Sustain. Energy Rev. 2019, 102, 346–355. [Google Scholar] [CrossRef]
- Hess, T.M.; Sumberg, J.; Biggs, T.; Georgescu, M.; Haro-Monteagudo, D.; Jewitt, G.; Ozdogan, M.; Marshall, M.; Thenkabail, P.; Daccache, A.; et al. A sweet deal? Sugarcane, water and agricultural transformation in Sub-Saharan Africa. Glob. Environ. Chang. 2016, 39, 181–194. [Google Scholar] [CrossRef]
- Scarpare, F.V.; Hernandes, T.A.D.; Ruiz-Corrêa, S.T.; Picoli, M.C.A.; Scanlon, B.R.; Chagas, M.F.; Duft, D.G.; de Fátima Cardosoc, T. Sugarcane land use and water resources assessment in the expansion area in Brazil. J. Clean. Prod. 2016, 133, 1318–1327. [Google Scholar] [CrossRef]
- Luz, F.B.; da Silva, V.R.; Kochem Mallmann, F.J.; Bonini Pires, C.A.; Debiasi, H.; Franchini, J.C.; Cherubin, M.R. Monitoring soil quality changes in diversified agricultural cropping systems by the Soil Management Assessment Framework (SMAF) in southern Brazil. Agric. Ecosyst. Environ. 2019, 281, 100–110. [Google Scholar] [CrossRef]
- Huang, J.; Hartemink, A.E. Soil and environmental issues in sandy soils. Earth Sci. Rev. 2020, 208, 103295. [Google Scholar] [CrossRef]
- Dias, H.B.; Sentelhas, P.C. Sugarcane yield gap analysis in Brazil—A multi-model approach for determining magnitudes and causes. Sci. Total Environ. 2018, 637–638, 1127–1136. [Google Scholar] [CrossRef]
- Meurer, K.; Barron, J.; Chenu, C.; Coucheney, E.; Fielding, M.; Hallett, P.; Herrmann, A.M.; Keller, T.; Koestel, J.; Larsbo, M.; et al. A framework for modelling soil structure dynamics induced by biological activity. Glob. Chang. Biol. 2020, 1–22. [Google Scholar] [CrossRef]
- Reynolds, W.D.; Drury, C.F.; Tan, C.S.; Fox, C.A.; Yang, X.M. Use of indicators and pore volume-function characteristics to quantify soil physical quality. Geoderma 2009, 152, 252–263. [Google Scholar] [CrossRef]
- Ghiberto, P.J.; Imhoff, S.; Libardi, P.L.; Da Silva, Á.P.; Tormena, C.A.; Pilatti, M.Á. Soil physical quality of mollisols quantified by a global index. Sci. Agric. 2015, 72, 167–174. [Google Scholar] [CrossRef]
- Twarakavi, N.K.C.; Sakai, M.; Šimůnek, J. An objective analysis of the dynamic nature of field capacity. Water Resour. Res. 2009, 45, 1–9. [Google Scholar] [CrossRef]
- Reynolds, W.D.; Bowman, B.T.; Drury, C.F.; Tan, C.S.; Lu, X. Indicators of good soil physical quality: Density and storage parameters. Geoderma 2002, 110, 131–146. [Google Scholar] [CrossRef]
- Dexter, A. Soil Physical quality Part I. Theory, effects of soil texture, density, and organic matter, and effects on root growth. Geoderma 2004, 120, 201–214. [Google Scholar] [CrossRef]
- Bacher, M.G.; Schmidt, O.; Bondi, G.; Creamer, R.; Fenton, O. Comparison of Soil Physical Quality Indicators Using Direct and Indirect Data Inputs Derived from a Combination of In-Situ and Ex-Situ Methods. Soil Sci. Soc. Am. J. 2019, 83, 5–17. [Google Scholar] [CrossRef]
- Dominati, E.; Mackay, A.; Green, S.; Patterson, M. A soil change-based methodology for the quantification and valuation of ecosystem services from agro-ecosystems: A case study of pastoral agriculture in New Zealand. Ecol. Econ. 2014, 100, 119–129. [Google Scholar] [CrossRef]
- Dlapa, P.; Hrinik, D.; Hrabovsky, A.; Simkovic, I.; Zarnovican, H.; Sekucia, F.; Kollar, J. The Impact of Land-Use on the Hierarchical Pore Size Loamy Soils. Water 2020, 12, 339. [Google Scholar] [CrossRef]
- WRB. World Reference Base for Soil Resources 2014, Update 2015, 106th ed.; FAO: Rome, Italy, 2015. [Google Scholar]
- Soil Survey Staff. Keys to Soil Taxonomy, 12th ed.; USDA-Natural Resources Conservation Service, Ed.; USDA-Natural Resources Conservation Service: Washington, DC, USA, 2014.
- Van Genuchten, M.T. A Closed-form Equation for Predicting the Hydraulic Conductivity of Unsatured Soils. Soil. Sci. Soc. Am. 1980, 44, 892–898. [Google Scholar] [CrossRef]
- Assouline, S.; Or, D. The concept of field capacity revisited: Defining intrinsic static and dynamic criteria for soil internal drainage dynamics. Water Resour. Res. 2014, 50, 4787–4802. [Google Scholar] [CrossRef]
- Guarracino, L. Estimation of saturated hydraulic conductivity Ks from the van Genuchten shape parameter α. Water Resour. Res. 2007, 43, 15–18. [Google Scholar] [CrossRef]
- Meskini-Vishkaee, F.; Mohammadi, M.H.; Neyshabouri, M.R. Revisiting the wet and dry ends of soil integral water capacity using soil and plant properties. Soil Res. 2018, 56, 331–345. [Google Scholar] [CrossRef]
- Dexter, A.R.; Czyz, E.A. Application of S-Theory in the study of soil physical degradation and its consequences. L. Degrad. Dev. 2007, 18, 369–371. [Google Scholar] [CrossRef]
- R Core Team. A Language and Environment for Statistical Computing; R Core Team: Vienna, Austria, 2019. [Google Scholar]
- De Andrade Bonetti, J.; Anghinoni, I.; Ivonir Gubiani, P.; Cecagno, D.; de Moraes, M.T. Impact of a long-term crop-livestock system on the physical and hydraulic properties of an Oxisol. Soil Tillage Res. 2019, 186, 280–291. [Google Scholar] [CrossRef]
- Grable, A.R.; Siemer, E.G. Effects of Bulk Density, Aggregate Size, and Soil Water Suction on Oxygen Diffusion, Redox Potentials, and Elongation of Corn Roots. Soil Sci. Soc. Am. J. 1968, 32, 180–186. [Google Scholar] [CrossRef]
- Reichert, J.M.; Suzuki, L.E.A.S.; Reinert, D.J.; Horn, R.; Håkansson, I. Reference bulk density and critical degree-of-compactness for no-till crop production in subtropical highly weathered soils. Soil Tillage Res. 2009, 102, 242–254. [Google Scholar] [CrossRef]
- Hunke, P.; Mueller, E.N.; Schröder, B.; Zeilhofer, P. The Brazilian Cerrado: Assessment of water and soil degradation in catchments under intensive agricultural use. Ecohydrology 2015, 8, 1154–1180. [Google Scholar] [CrossRef]
- Franco, A.L.C.; Cherubin, M.R.; Pavinato, P.S.; Cerri, C.E.P.; Six, J.; Davies, C.A.; Cerri, C.C. Soil carbon, nitrogen and phosphorus changes under sugarcane expansion in Brazil. Sci. Total Environ. 2015, 515–516, 30–38. [Google Scholar] [CrossRef]
- Youlton, C.; Wendland, E.; Anache, J.A.A.; Poblete-Echeverría, C.; Dabney, S. Changes in erosion and runoff due to replacement of pasture land with sugarcane crops. Sustainability 2016, 8, 685. [Google Scholar] [CrossRef]
- Cherubin, M.R.; Karlen, D.L.; Franco, A.L.C.; Cerri, C.E.P.; Tormena, C.A.; Cerri, C.C. A Soil Management Assessment Framework (SMAF) evaluation of Brazilian sugarcane expansion on soil quality. Soil Sci. Soc. Am. J. 2016, 80, 215–226. [Google Scholar] [CrossRef]
- Awe, G.O.; Reichert, J.M.; Fontanela, E. Sugarcane production in the subtropics: Seasonal changes in soil properties and crop yield in no-tillage, inverting and minimum tillage. Soil Tillage Res. 2020, 196, 104447. [Google Scholar] [CrossRef]
- Youlton, C.; Bragion, A.P.; Wendland, E. Evaluación experimental de la producción de sedimentos durante el primer año después del reemplazo de pradera por caña de azúcar. Cienc. Investig. Agrar. 2016, 43, 374–383. [Google Scholar] [CrossRef]
- Esteban, D.A.A.; de Souza, Z.M.; da Silva, R.B.; de Souza Lima, E.; Lovera, L.H.; de Oliveira, I.N. Impact of permanent traffic lanes on the soil physical and mechanical properties in mechanized sugarcane fields with the use of automatic steering. Geoderma 2020, 362, 114097. [Google Scholar] [CrossRef]
- da Guimarães Júnnyor, W.S.; Diserens, E.; De Maria, I.C.; Araujo-Junior, C.F.; Farhate, C.V.V.; de Souza, Z.M. Prediction of soil stresses and compaction due to agricultural machines in sugarcane cultivation systems with and without crop rotation. Sci. Total Environ. 2019, 681, 424–434. [Google Scholar] [CrossRef]
- Keller, T.; Sandin, M.; Colombi, T.; Horn, R.; Or, D. Historical increase in agricultural machinery weights enhanced soil stress levels and adversely affected soil functioning. Soil Tillage Res. 2019, 194, 104293. [Google Scholar] [CrossRef]
- de Moraes, M.T.; Levien, R.; Trein, C.R.; de Andrade Bonetti, J.; Debiasi, H. Corn crop performance in an Ultisol compacted by tractor traffic. Pesqui. Agropecu. Bras. 2018, 53, 464–477. [Google Scholar] [CrossRef]
- Barbosa, L.C.; de Souza, Z.M.; Franco, H.C.J.; Otto, R.; Rossi Neto, J.; Garside, A.L.; Carvalho, J.L.N. Soil texture affects root penetration in Oxisols under sugarcane in Brazil. Geoderma Reg. 2018, 13, 15–25. [Google Scholar] [CrossRef]
- Otto, R.; Silva, A.P.; Franco, H.C.J.; Oliveira, E.C.A.; Trivelin, P.C.O. High soil penetration resistance reduces sugarcane root system development. Soil Tillage Res. 2011, 117, 201–210. [Google Scholar] [CrossRef]
- Lozano, N.; Rolim, M.M.; Oliveira, V.S.; Tavares, U.E.; Pedrosa, E.M.R. Evaluation of soil compaction by modeling field vehicle traffic with SoilFlex during sugarcane harvest. Soil Tillage Res. 2013, 129, 61–68. [Google Scholar] [CrossRef]
- Cavalcanti, R.Q.; Rolim, M.M.; de Lima, R.P.; Tavares, U.E.; Pedrosa, E.M.R.; Gomes, I.F. Soil physical and mechanical attributes in response to successive harvests under sugarcane cultivation in Northeastern Brazil. Soil Tillage Res. 2019, 189, 140–147. [Google Scholar] [CrossRef]
- Jabro, J.D.; Iversen, W.M.; Stevens, W.B.; Evans, R.G.; Mikha, M.M.; Allen, B.L. Physical and hydraulic properties of a sandy loam soil under zero, shallow and deep tillage practices. Soil Tillage Res. 2016, 159, 67–72. [Google Scholar] [CrossRef]
- Keller, T.; Berli, M.; Ruiz, S.; Lamandé, M.; Arvidsson, J.; Schjønning, P.; Selvadurai, A.P.S. Transmission of vertical soil stress under agricultural tyres: Comparing measurements with simulations. Soil Tillage Res. 2014, 140, 106–117. [Google Scholar] [CrossRef]
- Tenelli, S.; de Oliveira Bordonal, R.; Barbosa, L.C.; Carvalho, J.L.N. Can reduced tillage sustain sugarcane yield and soil carbon if straw is removed? Bioenergy Res. 2019, 12, 764–777. [Google Scholar] [CrossRef]
- Castioni, G.A.F.; Cherubin, M.R.; de Oliveira Bordonal, R.; Barbosa, L.C.; Menandro, L.M.S.; Carvalho, J.L.N. Straw Removal Affects Soil Physical Quality and Sugarcane Yield in Brazil. Bioenergy Res. 2019, 12, 789–800. [Google Scholar] [CrossRef]
- Oliveira, I.N.; Souza, Z.M.; Lovera, L.H.; Vieira Farhate, C.V.; de Souza Lima, E.; Esteban, A.D.A.; Fracarolli, J.A. Least limiting water range as influenced by tillage and cover crop. Agric. Water Manag. 2019, 225, 105777. [Google Scholar] [CrossRef]
- Aguilera Esteban, D.A.; de Souza, Z.M.; Tormena, C.A.; Lovera, L.H.; de Souza Lima, E.; de Oliveira, I.N.; de Paula Ribeiro, N. Soil compaction, root system and productivity of sugarcane under different row spacing and controlled traffic at harvest. Soil Tillage Res. 2019, 187, 60–71. [Google Scholar] [CrossRef]


Publisher’s Note: MDPI stays neutral with regard to jurisdictional claims in published maps and institutional affiliations. |
© 2020 by the authors. Licensee MDPI, Basel, Switzerland. This article is an open access article distributed under the terms and conditions of the Creative Commons Attribution (CC BY) license (http://creativecommons.org/licenses/by/4.0/).