Article

Food Chain Length Associated with Environmental Factors Affected by Large Dam along the Yangtze River

1
Institute of Three Gorges Ecological Fisheries of Chongqing, College of Fisheries, Southwest University, Chongqing 400715, China
2
Fishery Resources and Environmental Science Experimental Station of The Upper-Middle Reaches of Yangtze River, Ministry of Agriculture and Rural Affairs, Yangtze River Fisheries Research Institute, Chinese Academy of Fishery Science, Wuhan 430223, China
3
College of Agriculture and Forestry Projects and Planning, Tongren University, Tongren 554300, China
4
Key Laboratory of Freshwater Fish Reproduction and Development (Ministry of Education), Key Laboratory of Aquatic Science of Chongqing, Southwest University, Chongqing 400715, China
*
Authors to whom correspondence should be addressed.
Water 2020, 12(11), 3157; https://doi.org/10.3390/w12113157
Submission received: 28 September 2020 / Revised: 1 November 2020 / Accepted: 5 November 2020 / Published: 12 November 2020
(This article belongs to the Section Water, Agriculture and Aquaculture)

Abstract

:
Food chain length (FCL) is a critical measure of food web complexity that influences the community structure and ecosystem function. The FCL of large subtropical rivers affected by dams and the decisive factors are far beyond clear. In this study, we used stable isotope technology to estimate the FCL of fish in different reaches of the main stream in the Yangtze River and explored the key factors that determined the FCL. The results showed that FCL varied widely among the studied areas with a mean of 4.09 (ranging from 3.69 to 4.31). The variation of FCL among river sections in the upstream of the dam was greater than that in the downstream. Regression analysis and model selection results revealed that the FCL had a significant positive correlation with ecosystem size as well as resource availability, and FCL variation was largely explained by ecosystem size, which represented 72% of the model weight. In summary, our results suggested that ecosystem size plays a key role in determining the FCL in large subtropical rivers and large ecosystems tend to have a longer food chain. Additionally, the construction of the Three Gorges Dam has been speculated to increase the FCL in the impoundment river sections.

1. Introduction

Food chain length (FCL) is a fundamental and measurable property in complex food web relationships [1], which represents the nutritional progression of the food web in the ecosystem from primary producer to top predator, reflecting the vertical structure of the food web [2,3]. The study of FCL and its change mechanism may provide not only a quantifiable framework for the community composition and energy flow pattern of the food web [4] but also an important way for an ecosystem response to the environment and the management of biological resources, such as the assessment of pollutant concentration in predators or species regulation in proliferation and release [5,6].
There are many ways to define FCL. Among them, realized FCL—the average number of energy transferences between basal resources and top predators—is the most widely used nowadays [3,5], and one of the important reasons for this is that the use of stable isotope technology has simplified its measurement [7,8]. Utilizing nitrogen stable isotopes (δ15N), the trophic position of organisms within a food web can easily be determined without the time-consuming process of constructing a fully delineated energy web [5,7]. In addition, with the calibration of primary consumers as the stable isotope baseline, the comparison of FCL among multiple ecosystems becomes feasible [9,10,11]. As a result, research on FCL is not limited to the determination of FCL in a single ecosystem but can also be applied to multiple ecosystems in order to make comparisons [12,13] or explore the influence of environmental factors on FCL [14,15,16,17].
Investigations into FCL in different types of aquatic ecosystems have been carried out globally for decades [4,5]. Previous studies have shown that FCL varies remarkably in diverse systems [18]. Exploring the key factors that lead to the change of FCL has been a primary research focus for food web ecologists [7,19]. Three main hypotheses (i.e., disturbance, resource availability, and ecosystem size) have been widely discussed as terminal factors affecting FCL [20,21]. The disturbance hypothesis suggests that longer food chains in the system are more likely to be destroyed by the disturbance, and the recovery from perturbations is more difficult and time-consuming than for shorter food chains. Therefore, the FCL of the ecosystem with intense or frequent disturbance is likely to be relatively short [7,20]. The resource availability hypothesis states that FCL is limited by the available energy sources in terms of the energy lost within each trophic transfer [17,22]. The ecosystem size hypothesis proposes that larger systems should have longer food chains, because larger ecosystems generally display greater habitat heterogeneity and availability [16,23]. Although an increasing number of studies have tested these hypotheses in various natural systems, none of these hypotheses have been supported by general experience [18]. The relative importance of the mechanisms proposed by the hypotheses to determine FCL, especially in a typical system, remains unknown [24].
As rivers vary widely in size, disturbance, and resources, they are suitable for testing predictions about general ecological theory [17]. At present, researchers have studied the differences of FCL and environmental control factors in both horizontal and vertical gradients of many rivers [25,26,27]. A study of 16 small subtropical rivers in China found that both ecosystem and resource availability could significantly affect the FCL and that resource availability is the decisive factor of FCL [17]. McHugh et al. studied several streams in New Zealand and discovered that the FCL was mainly affected by the ecosystem size and disturbance [23]. However, a research study of 66 Australian rivers revealed that ecosystem size, disturbance, and productivity have no influence on FCL [21]. In terms of the enormous diversity of environmental characteristics in river systems, the process and degree of those factors affecting FCL vary dramatically [3,24]. It has been acknowledged that specific environmental elements determine the FCL only under specific conditions [7,18], e.g., available resources determine the FCL only when resources are limited [5,28,29] or habitat heterogeneity and the complexity of the food web could buffer the influence of disturbance on the FCL [25]. Besides, FCL is also affected by overfishing [8], ecosystem structure [30], and riparian vegetation cover characteristics [31]. Therefore, it is necessary to independently study the FCL in specific ecosystems and the controlling factors for those ecosystems rather than simply inferring from the results of other ecosystems.
The Yangtze River is a large subtropical river with rich fish species and a complex food web structure [32]. Affected by the subtropical monsoon climate, most areas of the basin show obvious seasonality in temperature, rainfall, and river flow [33]. Due to the abundant water resources in the Yangtze River Basin, many dams have been built in the main and branch rivers of the Yangtze River for hydropower development [34,35]. Among them, the Three Gorges Dam (TGD), located in the Yangtze River Basin, is the largest hydroelectric dam in the world [33]. Large dam construction and reservoir operation have changed the original hydrological rhythm of rivers and affected the nutrient relationships and energy flow pathways of aquatic ecosystems upstream and downstream [36,37,38]. At the same time, different river sections are influenced by dams to distinct degrees. The upstream of the reservoir area is barely affected by the impoundment and operation of the reservoir and maintains the original river conditions, while the middle and lower reaches of the reservoir areas, which are heavily affected by the dam, change from the pristine river ecosystem to a still water or slow water habitat similar to a lake [35]. However, the degree and process of the influence of the construction of the TGD on the upstream and downstream river sections are still far from clear. As a vital characteristic of an ecosystem, FCL is a practical indicator to evaluate these impacts. Habitats affected by huge dams may differ greatly in ecosystem size, resource availability, and disturbance, and these differences may affect the FCL [7,18,21]. Nevertheless, research on the FCL of this large subtropical river has not yet been carried out, and little is known about the environmental controlling factors.
In this context, we chose different sections of the upper and lower reaches of the TGD in the Yangtze River Basin as the study area and used the nitrogen stable isotope ratios (δ15N) of fish and the baseline organism to determine the trophic position of the fish and the FCL. Meanwhile, the effects of ecosystem size, resource availability, and hydrological disturbance on the FCL in different river sections were also analyzed. The main objectives were to (1) determine the upstream and downstream FCL of the TGD, (2) explore the key environmental factors that may cause change in the FCL along the Yangtze River Basin, and (3) analyze the possible impacts of the construction of the TGD on the FCL.

2. Materials and Methods

2.1. Study Site and Site Descriptions

The Yangtze River Basin is located in the south-central part of China and belongs to the subtropical monsoon climate area. Affected by the subtropical monsoon climate, the average annual temperature of most regions in the Yangtze River Basin is relatively high, with abundant rainfall and obvious seasonal differences [33,34]. The Yichang section in the main stream is at the intersection of the middle and upper reaches of the Yangtze River where the TGD was built. Upstream from the dam to the lower Mudong section is the Three Gorges Reservoir Area (TGRA), which is nearly 600 km long with a total storage capacity approaching 40 billion m3. Due to the impoundment of the dam, the reservoir area has changed from a single river habitat to a variety of habitats with flowing water, slow flowing water, and still water [32,34,35]. The TGRA is mostly canyon-shaped and is tremendously complex and diverse in width and depth [35,39]. However, the downstream of the TGD typifies a meandering channel connecting to lakes in some sections [40,41]. In this study, a total of 8 river sections in the upper and lower reaches of the TGD were selected to represent different habitats affected by the dam to varying degrees (Figure 1, Table 1).

2.2. Sample Collection and Stable Isotope Analysis

In our study, the potential top predators were mainly carnivorous fish and omnivorous fish, which have a relatively high trophic position in the region’s food web [39,40]. Samples were collected in July (flood season) and December (dry season) 2018. Fish were captured using gillnets, which had a length of 50 m and a width of 2 m and included 30, 60, 80, and 120 mm mesh sizes. All fish were identified to the species level, and the number and weight in the field were recorded. Only large adult individuals were selected for each species (see Supplementary Materials Table S1 for detailed fish species). Meanwhile, we chose snails as the baseline organism. Snails (including Bellamya aeruginosa and Semisulcospira cancellata) were collected using a 0.025 m2 modified Peterson grab or by hand on the riverbank and then kept in distilled water for 24 h. The dorsal muscle tissue of the fish and the abdominal muscles of the snails were sampled with anatomical tools and washed with distilled water. Finally, all muscle samples were dried to a constant weight at 60 °C and then ground to fine powder.
The samples were then sent to the Stable Isotope Laboratory, Chinese Academy of Forestry, Beijing, China, for analysis of the nitrogen isotope ratios using a Flash EA1112 HT Elemental Analyzer (Thermo Fisher Scientific, Inc., Waltham, USA) coupled to a DELTA V Advantage Isotope Ratio Mass Spectrometer (Thermo Fisher Scientific, Inc., Waltham, USA). The stable nitrogen isotope ratios are expressed as δ15N (per thousand percent) in the following equation:
δ15N = (Rsample − Rstandard)/Rstandard × 1000
where R is the ratio of 15N/14N [6,12]. The reference standard for δ15N was atmospheric nitrogen. The precision of the isotopic analysis was 0.2‰ for nitrogen.

2.3. Estimates of Food Chain Length

In this study, energy-based “realized” FCL, which reflects all the energy paths from the primary producers to the top predator and the energy transfer intensity or efficiency of different paths [4,7], was used. The FCL at each site was estimated following the maximum trophic position convention. First, we determined the δ15N values of potential top predators and baseline organisms, then we calculated the trophic position of potential top predators, and finally we selected the maximum trophic position as realized FCL.
The FCL was estimated as:
FCL = (δ15Ntop consumer − δ15Nbaseline)/∆δ15N + λ
where FCL is the trophic level of the top predator, δ15Ntop consumer is the stable nitrogen isotope ratio of the top predator, δ15Nbaseline is the stable nitrogen isotope ratio of the baseline organisms in the system, ∆δ15N is the enrichment value of δ15N between adjacent trophic levels, which is typically 3.4‰ on average [9], and λ is the trophic level of the selected baseline organisms [18]. The baseline organisms are usually primary consumers with a long life cycle and relatively stable feeding habits [10]. Studies have shown that the isotopic signals of snails are less variable in time [11]. Accordingly, snails were selected as the baseline organism, and the trophic position of snails was taken as the baseline organism’s trophic level (i.e., λ = 2) [17].

2.4. Characterizing Ecosystem Size, Resource Availability, and Disturbance

Firstly, we used the cross-sectional area of the sampled reaches to characterize the ecosystem size of each river section [20,23,30]. Three to five sections (each about 500 m apart) were selected for each sampling reach in order to measure the depth and width, which subsequently were averaged to estimate the cross-sectional area [30]. Secondly, because chlorophyll-a (Chl-a) is an important index to evaluate the primary productivity of a water body, we used the Chl-a concentration of the sampled reaches to characterize the resource availability of each river section [8,16]. We collected 1 L mixed water samples (samples were mixed water from the left, middle, and right channels of the river) from each sampling section and filtered them onto glass fiber filters (Whatman GF/F; GE Healthcare Life Sciences China, Beijing, China), and then the samples were stored at −20 °C until analysis. Chl-a was extracted from the filters with 90% acetone and measured using a spectrophotometer (at 630, 647, 667, and 750 nm) following standardized methods [42]. Field measures were completed in the flood season (approximately from June to August) and in the dry season (approximately from November to January) to consider seasonal variation. Finally, we characterized disturbance for each reach using the hydrological changes of the sample reaches. A total of six metrics are used to describe the hydrological changes of different river sections, including the coefficients of variation (CV) of daily water levels, the CV of daily flows, the ratio of peak flow to mean daily flows (Fmax:Fmd), the ratio of minimum flow to mean daily flows (Fmin:Fmd), the number of days with high flows (defined as higher than 150% of the mean daily flow), and the number of days with low flow (defined as less than 50% of the mean daily flow). These metrics can well reflect the hydrological fluctuation of river and flood or drought conditions that may be stressful for organisms. The hydrological data were obtained from the hydrological stations near each study area. Then, we used principal component analysis (PCA) to analyze the six indexes and used the scores of the first axis of this PCA as a multivariate disturbance index to describe the hydrological changes of the different river sections [23,30] (Table S2).

2.5. Statistical Analysis

The FCL of river sections along the longitudinal gradient as well as the FCL upstream and downstream of the dam were analyzed and compared. The Shapiro–Wilk test and Levene’s test were used to test the normality and homogeneity of variances for FCL. Analyses of variance (ANOVAs) were used when the data were consistent with homogeneity of variance and normality assumption. Otherwise, the nonparametric Kruskal–Wallis test was employed. Statistical significance was determined at p = 0.05. Then, we explored the influence of resource availability, disturbance, and ecosystem size on FCL in these reaches. Before the analysis, we tested for correlations (|r| ≥ 0.80) among ecosystem size, resource availability, and disturbance. The weight of the evidence of three FCL control variables was evaluated using an information-theoretic model-selection approach [43]. We separately regressed maximum trophic position (MTP) against the independent variables and calculated the Akaike information criterion with correction for a small sample size (AICc) for each candidate model. The degree of support for each model was considered using three values derived from AICc, including ∆AICci (i.e., ∆AICci = AICci − min (AICc), Akaike weights (wi) (i.e., wi = e(−0.5∆i)/∑e(−0.5∆i)), and evidence ratios (i.e., wtop/wi) [19,21,23]. Statistical analyses were conducted using IBM SPSS Statistics (version 16.0), and the AICc value of each candidate model was calculated using the MuMIn package in R (version 3.6.3; R Foundation for Statistical Computing, Vienna, Austria).

3. Results

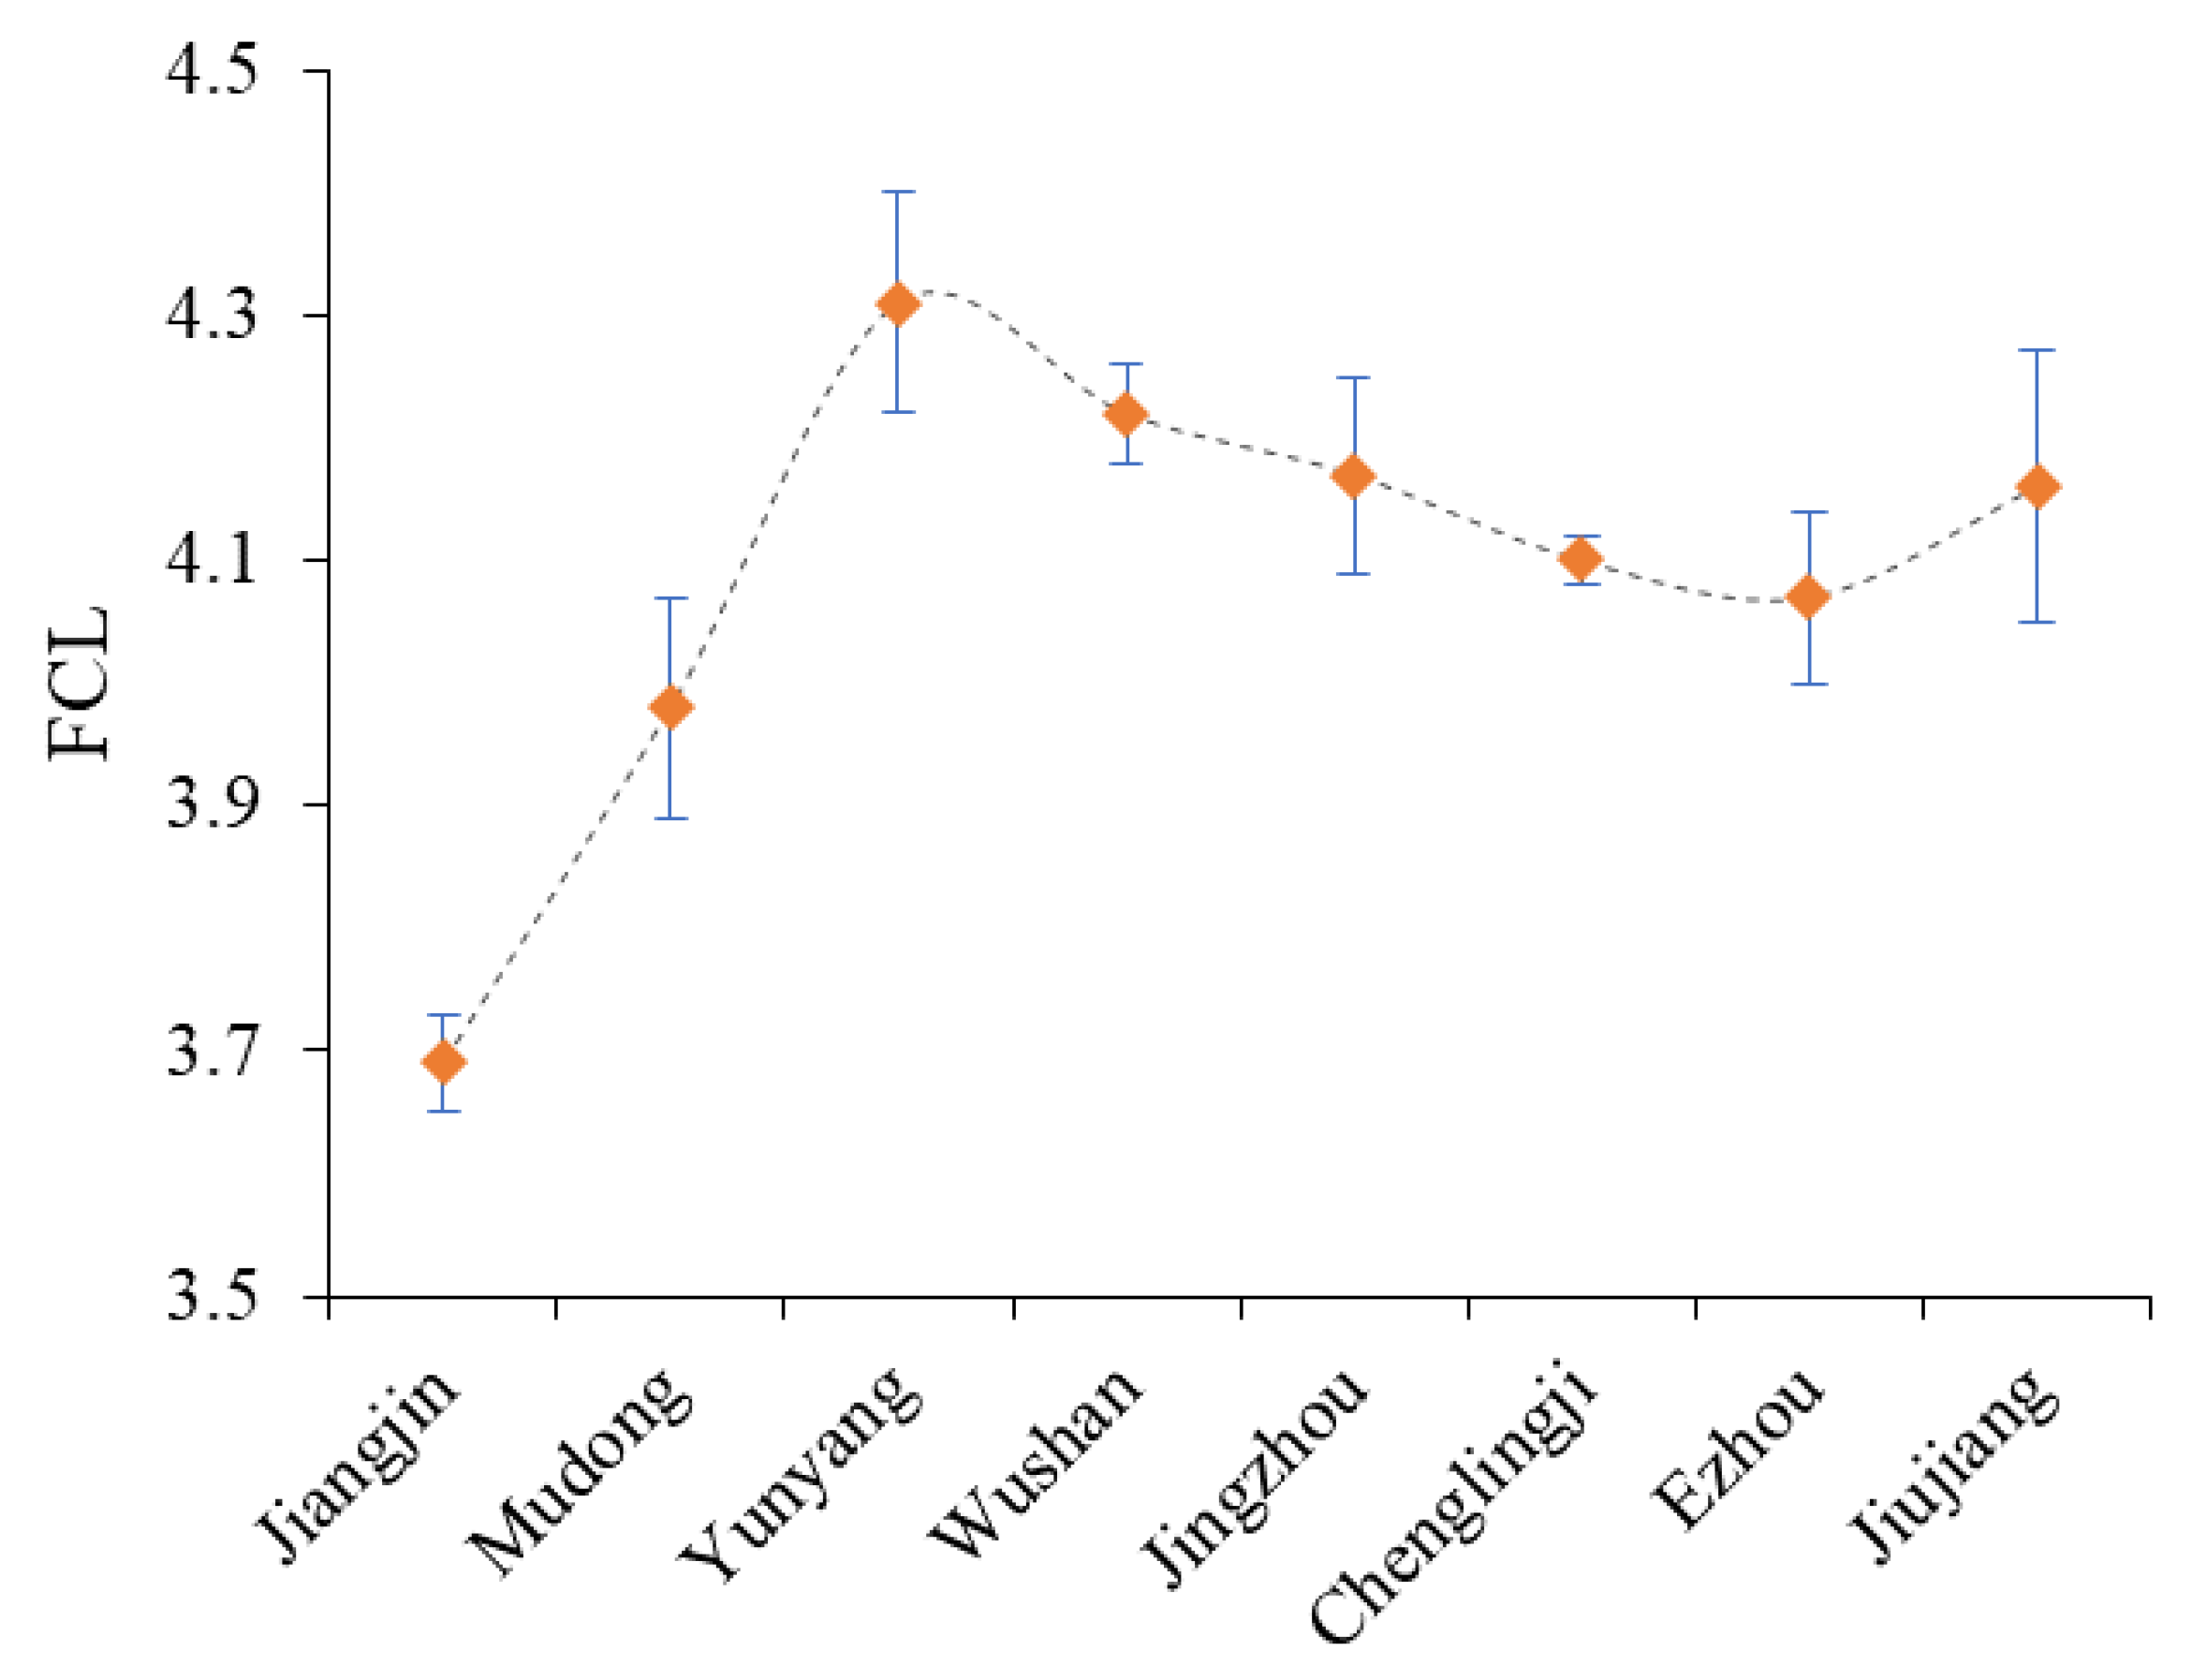
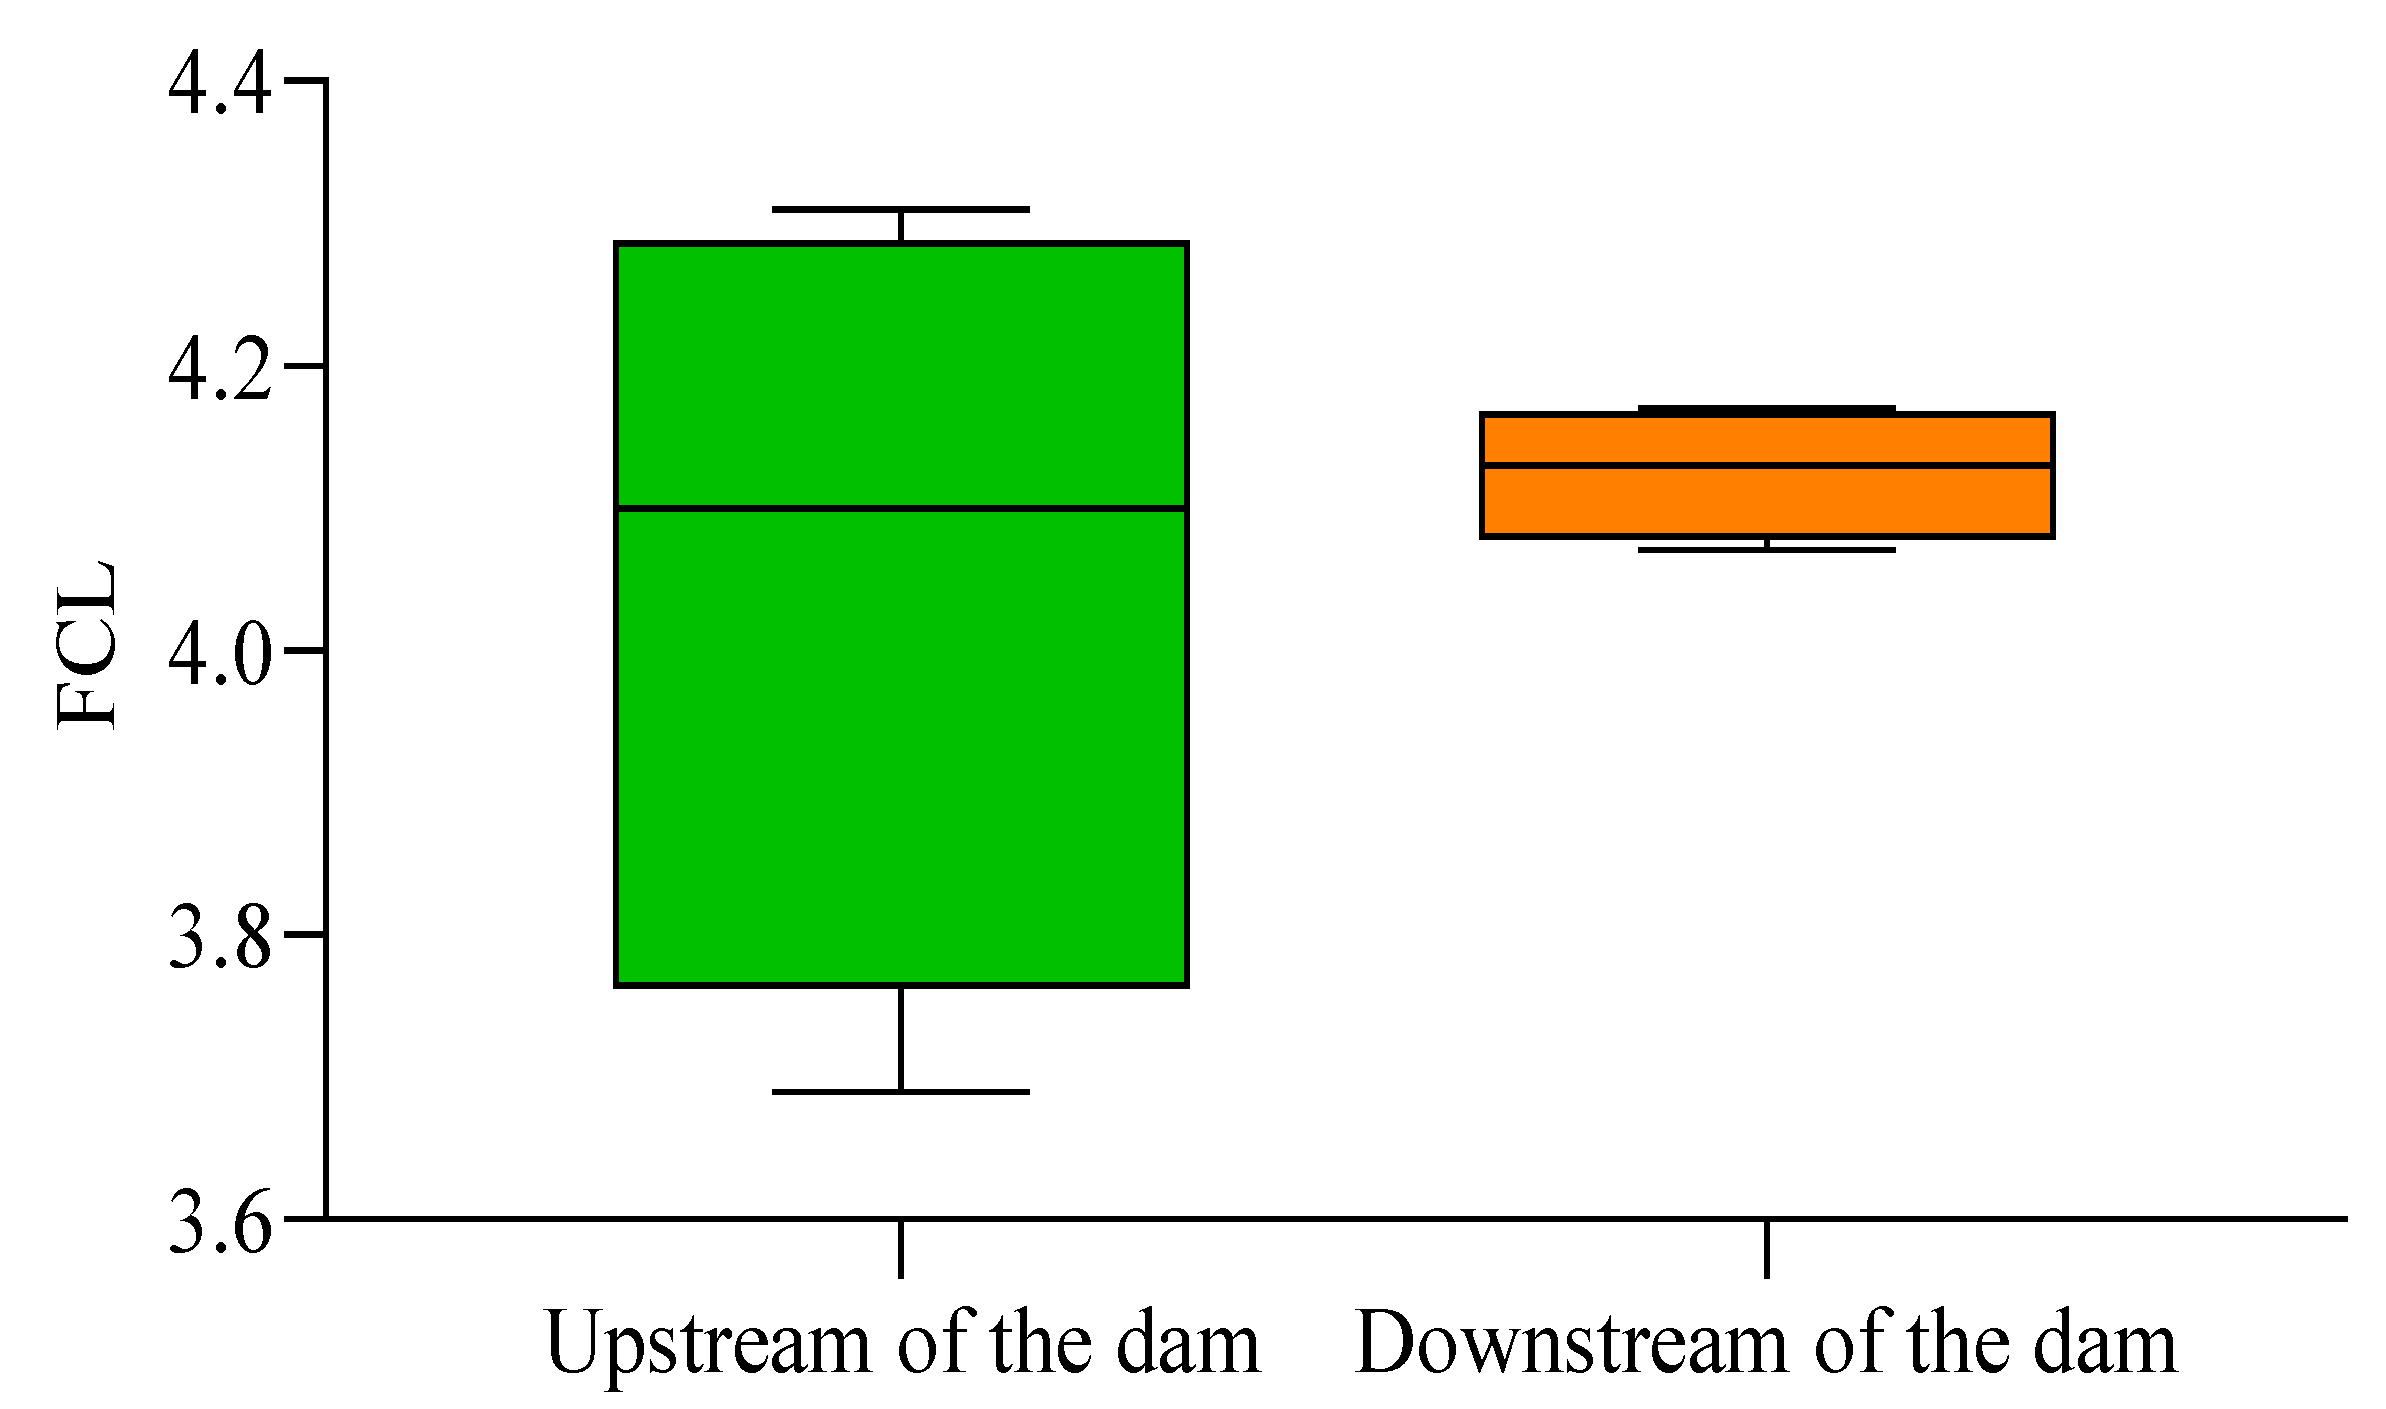
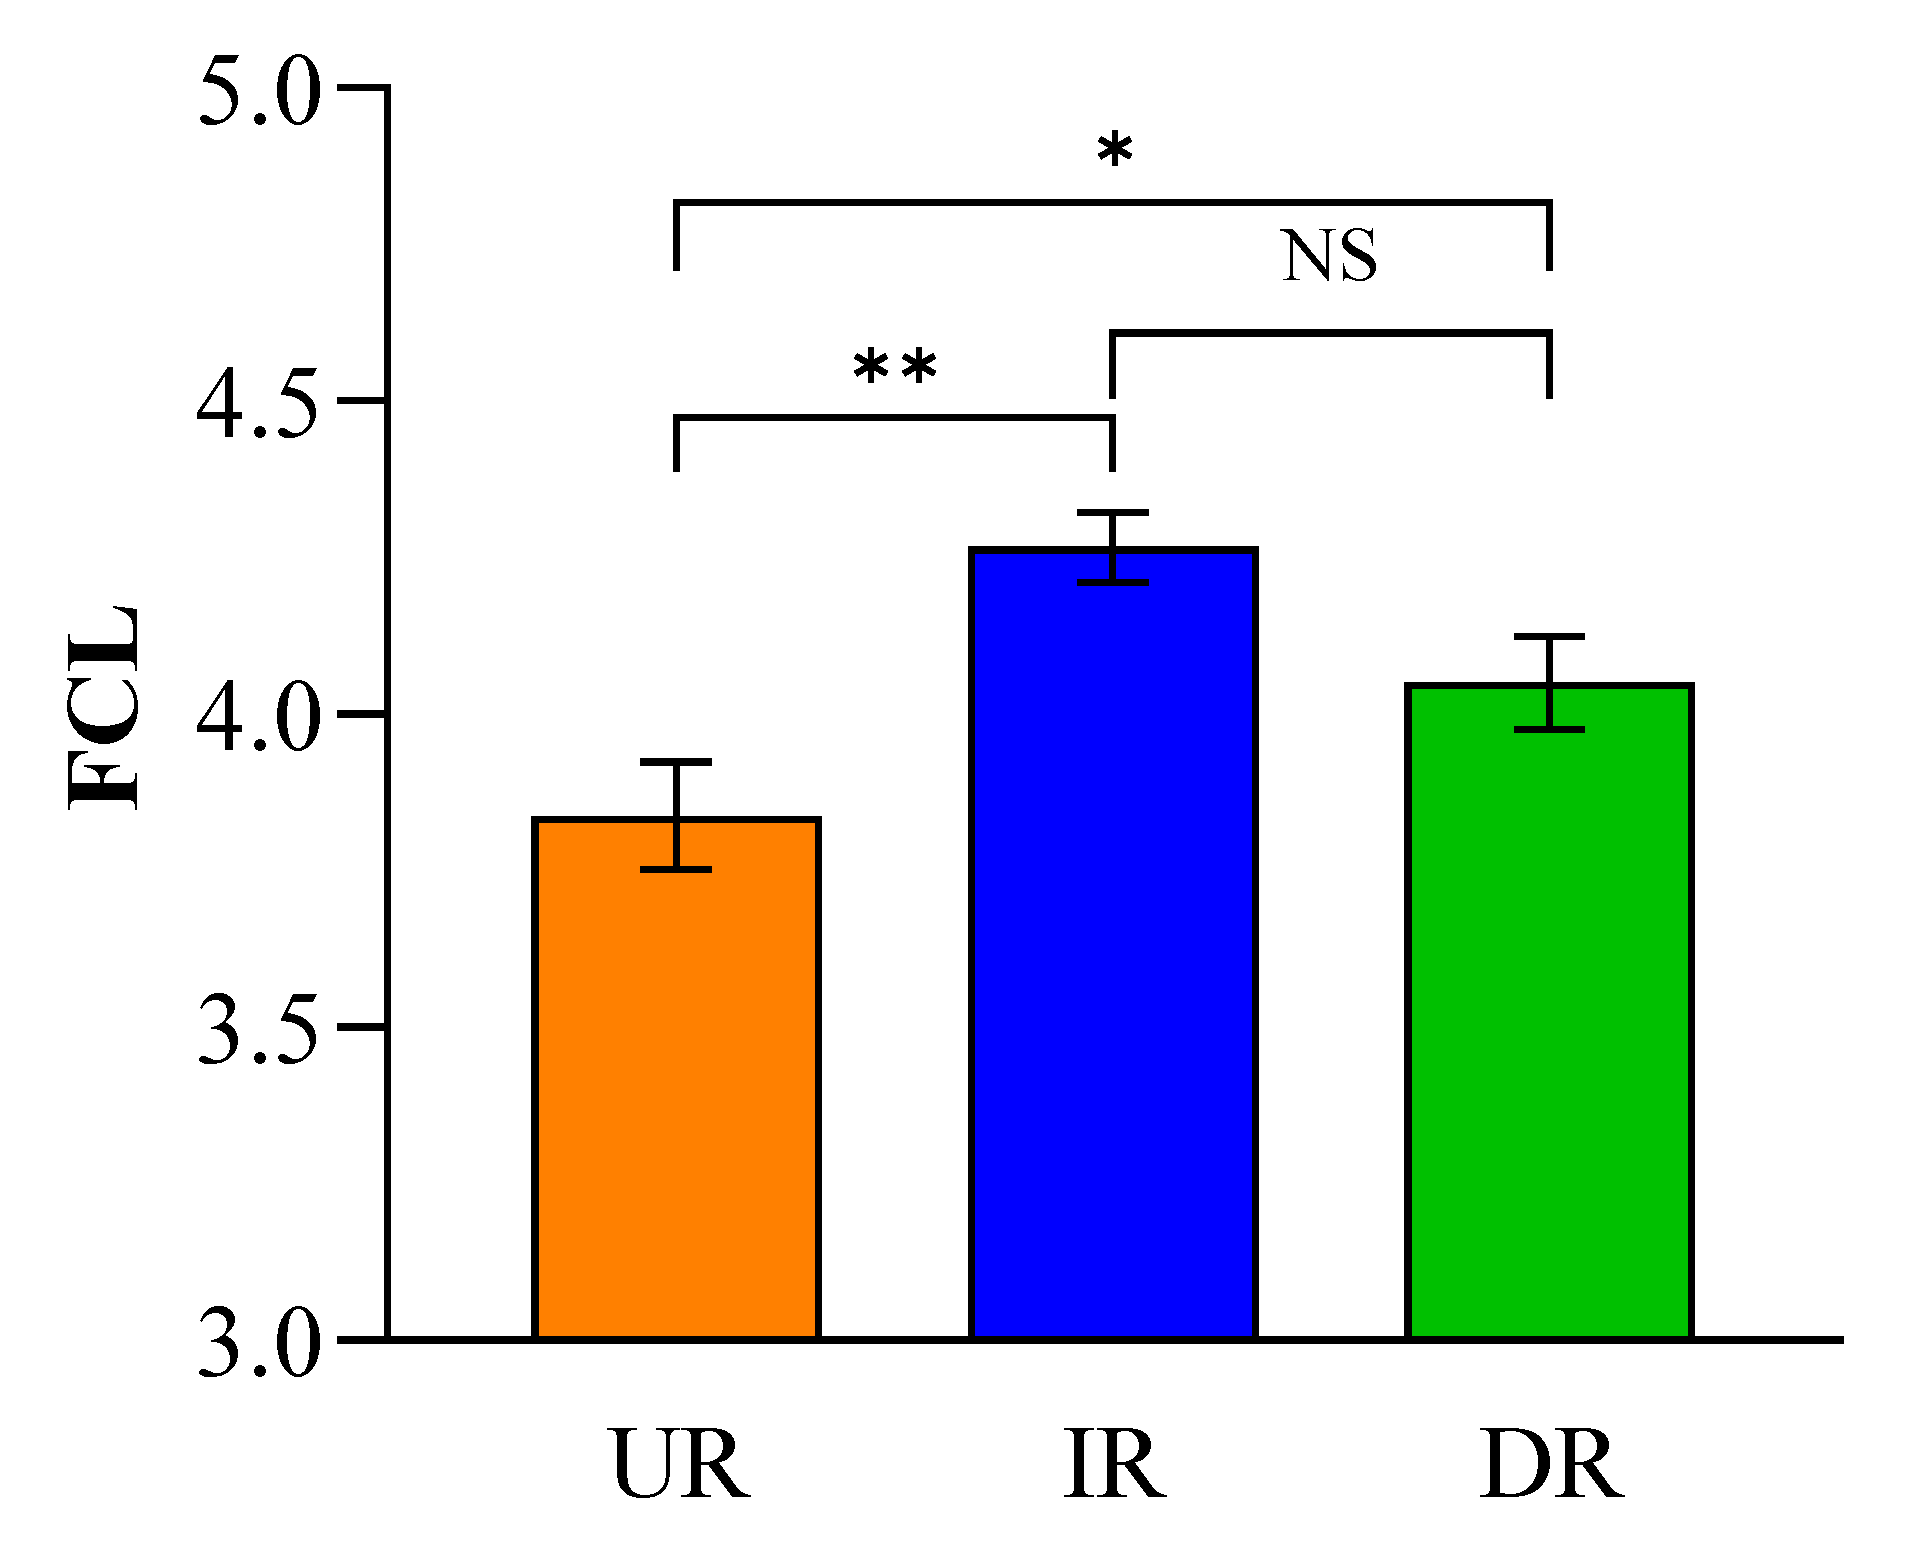
The average FCL was 4.09, ranging from 3.69 to 4.31 across the eight sampling sites (Table S1). The FCL tended to increase first and then decrease along the longitudinal gradient. Specifically, the reservoir (Yunyang section and Wushan section) had a relatively long food chain (Figure 2). The average FCL was 4.05, ranging from 3.69 to 4.31, upstream of the TGD (Jiangjin–Yunyang section), whereas the average FCL was 4.13, ranging from 4.07 to 4.17, downstream of the TGD (Jingzhou–Jiujiang section). There was no significant difference in the FCL between the upstream and downstream of the TGD (Kruskal–Wallis test, p = 0.99 > 0.05). However, the variation range of the FCL upstream of the dam (0.62 trophic levels) was greater than that downstream (0.1 trophic levels) (Figure 3), while the variable coefficient within the FCL upstream (CVupstream = 0.06) was also larger than downstream (CVdownstream = 0.01). According to the different habitat characteristics, three distinct types of river reaches were used for comparison. The FCLs in the upper reaches with swift currents (UR) were significantly shorter than those in the impounded reaches (IR) (ANOVA, p = 0.00 < 0.05) and the downstream reaches with free flow (DR) (ANOVA, p = 0.04 < 0.05), but there was no significant difference between the IR and the DR areas (ANOVA, p = 0.06 > 0.05) (Figure 4).
Pearson correlation analysis of three explanatory variables showed that there was significant positive correlation between ecosystem size and resource availability (p = 0.00 < 0.05, |r| = 0.98), whereas ecosystem size and disturbance (p = 0.26 > 0.05, |r| = 0.53) and disturbance and resource availability (p = 0.25 > 0.05, |r| = 0.55) were not significantly correlated. The results of the regression analysis showed that a positive relationship between ecosystem size and FCL was found (FCL = 2.08 + 0.46 × log10(Ecosystem size), R2 = 0.63, p = 0.01 < 0.05) (Figure 5a). Resource availability also showed a positive relationship with FCL (FCL = 3.81 + 0.04 × Resource availability, R2 = 0.58, p = 0.03 < 0.05) (Figure 5b). However, disturbance revealed no significant relationship with FCL (R2 = 0.04, p = 0.63 > 0.05) (Figure 5c). The weight of the evidence in support of the three FCL hypotheses was evaluated using an information-theoretic model-selection approach. The ecosystem size model had the lowest AICc value (AICc = −1.71), followed by the resource availability model (AICc = 0.24) and the disturbance model, which had the largest AICc value of 6.62 (Table 2). FCL variation was best explained by ecosystem size, which represented 72% of the model weight, followed by resource availability, which represented 27% (Table 2). Based on model evidence ratios, ecosystem size was a 2.7 times better explanatory variable than resource availability (Table 2).

4. Discussion

The average FCL of the studied rivers was 4.09, which is longer than the reported global mean FCL in streams, where the average FCL was 3.5 [18]. However, the results are similar to some large and medium rivers in other regions of the world [19,21,44]. The increasing tendency in the FCL occurs along the longitudinal gradient; however, this is seemingly interrupted by the impounded/reservoir reaches (Figure 2). Moreover, we also observed greater differences in FCL in the upstream reach of the dam compared to the downstream, as specifically, the impounded reaches have a relatively long food chain similar to other large rivers [44].
Although a multitude of research has discussed the effects of resource availability, natural disturbance state, and ecosystem size as well as their relative importance on FCL in rivers [24], ecosystem size has gradually become a central variable for understanding variation in FCL in natural ecosystems [5,7,13]. In our research, ecosystem size was defined as the cross-sectional area of the river and revealed that there was a significant positive correlation with the FCL, consistent with some rivers in New Zealand [23] and North America [26]. Moreover, FCL variation was best explained by ecosystem size, which showed the lowest AICc and represented 72% of the model weight. The ecosystem size hypothesis suggests that larger ecosystems should have a longer food chain, because larger ecosystems generally display greater habitat availability and suitability for top predators [5,16,23]. In our study, we also found that there was a significant positive correlation between ecosystem size and resource availability, indicating that a larger ecosystem could provide more available resources for the food web. Underlying complex habitats and diverse food provided by a larger ecosystem could support more potential top predators and the intricate trophic relationship and, therefore, create conditions for a longer food chain in the region.
The change in FCL explained by resource availability has also been widely discussed [16,17,22], and studies have found that FCL will increase with available resources [7]. In the present study, we found a significant correlation between FCL and available resources, consistent with some of the findings on neotropical [44] and temperate rivers [27]. Wang et al. (2016) found that FCL increased with the increase of available resources in small subtropical rivers in China, indicating that available resources are an important driving factor of FCL in subtropical rivers [17]. In addition, FCL variation was explained by available resources, which represented 27% of the model weight and was lower than the ecosystem size. It shows that resource availability is also one of the reasons for the disparity of FCL, but the impact on FCL is limited relative to the ecosystem size. This may be due to the fact that most of the main reaches of the Yangtze River are either moderately eutrophic or eutrophic [37,45], implying that the available resources are sufficient. Ultimately, it is difficult for resource availability to become a limiting factor affecting the FCL in this large river. Previous research has already discovered that available resources determine the FCL only under specific conditions, such as when ecosystem availability resources are limited [5].
Located in a subtropical monsoon climate, the Yangtze River Basin marks predictable rainfall patterns and hence has a seasonal river flow [35]. In addition, periodic hydrological regulation carried out by the TGD according to flood control utterly alters the hydrological process, which may influence fish growth and breeding and, in turn, the food web structure [34,39,46]. Outwardly, longer food chains are more vulnerable to disturbance and more difficult to recover than shorter food chains, which implies that food chains should be shorter in highly variable environments [20]. However, in our research, we found that hydrological disturbance does not significantly increase or shorten the FCL, conforming with the verification results of other rivers [24,25,47]. A research study on subtropical small rivers in China also reached a conclusion that the FCL does not change with hydrological changes even though these rivers suffer from evident seasonal hydrological disturbances [17]. Studies have confirmed that low flow disturbance would not influence the FCL in stream food webs where food web complexity and habitat heterogeneity could buffer the effect of disturbance [25]. The Yangtze River is a large subtropical river with rich food availability, species diversity, and a complex trophic relationship [32], which makes the food web in this area more resistant to interference. Furthermore, habitat heterogeneity in large rivers provides a good shelter for different organisms to accommodate environmental changes, thus reducing the impact of interference on FCL.
The FCL in the upstream reach of the dam exhibited a wide variation, and the impounded reaches had a longer food chain, inferring the impact of the construction of the TGD on the FCL. The impoundment of the reservoir altered the original and continuous status of the upstream, which has objectively resulted in the diversity of aquatic habitats, including the deep lacustrine environment, backwater areas, and the fluvial habitat, characterized either by an incised channel or large open sections with wide lateral habitats [33,35,39]. Theoretical and empirical evidence, including our results, indicate that environmental variability plays an important role in determining FCL [7,24]. According to exceptional changes of the FCL along the reservoir in our study, the construction of the TGD may have increased the FCL by changing the ecosystem size and the resource availability of the original river. Particularly, the water level of the original reach rose with impoundment, which increased the ecosystem size and habitat heterogeneity of the area [35]. Besides, with the sediment from the upstream deposited and the massive riparian zone inundated in the reservoir area, the availability of food resources in this area were apparently augmented [37,45]. As a consequence, we speculate that the construction of the TGD has increased the FCL in the impoundment river section through ecosystem scale effects.

5. Conclusions

To sum up, our results showed that the FCL in the main stream of the Yangtze River was 4.09 and similar to other large and medium rivers. Regression analysis results indicated that both resource availability and ecosystem size had a significant positive correlation with FCL, but there was no significant effect of disturbance on FCL. Moreover, FCL variation was best explained by ecosystem size, which represented 72% of the model weight, followed by resource availability, which represented 27%. However, disturbance had little impact on the FCL as an environmental factor in this large river. It is conjectured that larger ecosystems possess potentially complex shelter and diverse food resources facilitating the diversity of top predators as well as a sophisticated trophic relationship, but on the other hand this dampens the effect of disturbance. The Three Gorges Dam in the middle of the Yangtze River, which disrupts the river continuum, has subsequently altered the FCL through enlarging the ecosystem size and resource availability.

Supplementary Materials

The following are available online at https://www.mdpi.com/2073-4441/12/11/3157/s1. Table S1: Mean (±SE) trophic position (TP) of potential top-predator fish and the FCL (Maximum TP = FCL) of fish in the study system; Table S2: Ecosystem size (cross-sectional area), resource availability (Chl-a) and disturbance (CV (water level), CV (flows), high flows (the number of days with high flows), low flows (the number of days with low flows), Fmax:Fmd (the ratio of peak flow to mean daily flows), Fmin:Fmd (the ratio of minimum flow to mean daily flows), multivariate disturbance index) variables for the study reaches.

Author Contributions

Conceptualization, C.H., H.D., and Y.L.; investigation, C.H., J.B., S.L. (Sheng Li), Z.C., and Y.T.; writing—original draft preparation, C.H.; writing—review and editing, C.H., H.D., D.C., X.D., and S.L. (Shaoping Liu). All authors have read and agreed to the published version of the manuscript.

Funding

This research was financially supported by the National Natural Science Foundation of China (Grant No. 51909271); the Fishery Resources and Environmental Science Experimental Station of The Upper-Middle Reaches of Yangtze River Ministry of Agriculture and Rural Affairs (FRESES201905); The Ecological Fishery Technological System of Chongqing Municipal Agricultural and Rural Committee under Grant 40810017; Chongqing Municipal Agricultural and Rural Committee under Grant JQCG2020-20; the biodiversity investigation, observation, and assessment program (2019–2023) of the Ministry of Ecology and Environment of China; and the Innovation Team Project of the Chinese Academy of Fishery Sciences (2020TD09).

Conflicts of Interest

The authors declare no conflict of interest.

References

  1. Pimm, S.L. Food Webs; Chapman & Hall: London, UK, 1982. [Google Scholar]
  2. Schoener, T.W. Food webs from the small to the large. Ecology 1989, 79, 2013–2018. [Google Scholar]
  3. Wang, Y.Y.; Xu, J.; Lei, G.C. Proximate and ultimate determinants of food chain length. Acta Ecol. Sin. 2013, 33, 5990–5996. [Google Scholar] [CrossRef] [Green Version]
  4. Post, D.M. The long and short of food-chain length. Trends Ecol. Evol. 2002, 17, 269–277. [Google Scholar] [CrossRef]
  5. Zhang, H.; He, L.; Zheng, P.Y. Food chain length theory: A review. Acta Ecol. Sin. 2012, 33, 7630–7643. [Google Scholar]
  6. Cabana, G.; Rasmussen, J.B. Modelling food chain structure and contaminant bioaccumulation using stable nitrogen isotopes. Nature 1994, 372, 255–257. [Google Scholar] [CrossRef]
  7. Sabo, J.L.; Finlay, J.C.; Post, D.M. Food Chains in Freshwaters. Ann. N. Y. Acad. Sci. 2010, 1162, 187–220. [Google Scholar] [CrossRef]
  8. Saigo, M.; Ruffener, L.; Scarabotti, P.; Marchese, M. Food chain length in a large floodplain river: Planktonic or benthic reliance as a limiting factor. Mar. Freshw. Res. 2016, 65, 249–255. [Google Scholar] [CrossRef]
  9. Post, D.M. Using stable isotopes to estimate trophic position: Models, methods, and assumptions. Ecology 2002, 83, 703–718. [Google Scholar] [CrossRef]
  10. Xu, J.; Zhang, M.; Xie, P. Variability of stable nitrogen isotopic baselines and its consequence for trophic modeling. J. Lake Sci. 2010, 22, 8–20. [Google Scholar]
  11. Wang, Y.Y.; Xu, J.; Zhang, L.; Lei, G.C. Seasonal variability in baseline δ15N and usage as a nutrient indicator in Lake Poyang, China. J. Freshw. Ecol. 2013, 28, 365–373. [Google Scholar] [CrossRef]
  12. Perkins, M.J.; Mcdonald, R.A.; Frank, V.V.F.J.; Kelly, S.D.; Rees, G.; Bearhop, S. Application of Nitrogen and Carbon Stable Isotopes (δ15N and δ13C) to Quantify Food Chain Length and Trophic Structure. PLoS ONE 2014, 9, e93281. [Google Scholar] [CrossRef] [PubMed] [Green Version]
  13. Post, D.M.; Pace, M.L.; Hairston, N.G. Ecosystem size determines food-chain length in lakes. Nature 2000, 405, 1047–1049. [Google Scholar] [CrossRef]
  14. Takimoto, G.K.; Post, D.M. Proximate Structural Mechanisms for Variation in Food-Chain Length. Oikos 2007, 116, 775–782. [Google Scholar]
  15. Hette-Tronquart, N.; Roussel, J.M.; Dumont, B.; Archaimbault, V.; Pont, D.; Oberdorff, T.; Belliard, J. Variability of water temperature may influence food-chain length in temperate streams. Hydrobiologia 2013, 718, 159–172. [Google Scholar] [CrossRef]
  16. Xiao, X.W.; Wang, Y.Y.; Zhang, H.; Yu, X.B. Effects of primary productivity and ecosystem size on food-chain length in Raohe River, China. Acta Ecol. Sin. 2015, 35, 29–34. [Google Scholar] [CrossRef]
  17. Wang, Y.Y.; Xiao, X.W.; Yu, X.B.; Xu, J.; Cai, Y.J.; Lei, G.C. Resource availability determines food chain length in Chinese subtropical rivers. Aquat. Ecol. 2016, 50, 187–195. [Google Scholar] [CrossRef]
  18. Fetzer, W.W.; Vander Zanden, M.J. Global Patterns of Aquatic Food Chain Length. Oikos 2007, 116, 1378–1388. [Google Scholar]
  19. Kautza, A.; Sullivan, S.M. Anthropogenic and natural determinants of fish food-chain length in a midsize river system. Freshw. Sci. 2016, 35, 895–908. [Google Scholar] [CrossRef]
  20. Ruhi, A.; Muñoz, I.; Tornés, E.; Batalla, R.; Vericat, D.; Ponsatí, L.; Acuña, V.; Von Schiller, D.; Marcé, R.; Bussi, G.; et al. Flow regulation increases food-chain length through omnivory mechanisms in a Mediterranean river network. Freshw. Biol. 2016, 61, 1536–1549. [Google Scholar] [CrossRef] [Green Version]
  21. Warfe, D.M.; Jardine, T.D.; Pettit, N.E.; Hamilton, S.K.; Pusey, B.J.; Bunn, S.E.; Davies, M.P.; Douglas, M.M. Productivity, disturbance and ecosystem size have no influence on food chain length in seasonally connected rivers. PLoS ONE 2013, 8, e66240. [Google Scholar] [CrossRef] [Green Version]
  22. Post, D.M. Testing the productive-space hypothesis: Rational and power. Oecologia 2007, 153, 973–984. [Google Scholar] [CrossRef]
  23. Mchugh, P.A.; McIntosh, A.R.; Jellyman, P.G. Dual influences of ecosystem size and disturbance on food chain length in streams. Ecol. Lett. 2010, 13, 881–890. [Google Scholar] [CrossRef]
  24. Takimoto, G.; Post, D.M. Environmental determinants of food-chain length: A meta-analysis. Ecol. Res. 2013, 28, 675–681. [Google Scholar] [CrossRef]
  25. Walters, A.W.; Post, D.M. An experimental disturbance alters fish size structure but not food chain length in streams. Ecology 2008, 89, 3261–3267. [Google Scholar] [CrossRef]
  26. Sabo, J.L.; Finlay, J.C.; Kennedy, T.; Post, D.M. The role of discharge variation in scaling of drainage area and food chain length in rivers. Science 2010, 330, 965–967. [Google Scholar] [CrossRef] [PubMed]
  27. Thompson, R.M.; Townsend, C.R. Energy availability, spatial heterogeneity and ecosystem size predict food-web structure in streams. Oikos 2005, 108, 137–148. [Google Scholar] [CrossRef]
  28. Zanden, M.J.V.; Shuter, B.J.; Lester, N.; Rasmussen, A.J.B. Patterns of food chain length in lakes: A stable isotope study. Am. Nat. 1999, 154, 406–416. [Google Scholar] [CrossRef] [PubMed]
  29. Jenkins, B.; Kitching, R.L.; Pimm, S.L. Productivity, disturbance and food web structure at a local spatial scale in experimental container habitats. Oikos 2016, 65, 249–255. [Google Scholar] [CrossRef]
  30. Sullivan, S.M.P.; Hossler, K.; Cianfrani, C.M. Ecosystem structure emerges as a strong determinant of food-chain length in linked stream-riparian ecosystems. Ecosystems 2015, 18, 1356–1372. [Google Scholar] [CrossRef]
  31. González-Bergonzoni, I.; Kristensen, P.B.; Baattrup-Pedersen, A.; Kristensen, E.A.; Alnoee, A.B.; Riis, T. Riparian forest modifies fuelling sources for stream food webs but not food-chain length in lowland streams of Denmark. Hydrobiologia 2017, 805, 291–310. [Google Scholar] [CrossRef]
  32. Zhang, H.; Kang, M.; Shen, L.; Wu, J.M.; Li, J.Y.; Du, H.; Wang, C.Y.; Yang, H.L.; Zhou, Q.; Liu, Z.G.; et al. Rapid change in Yangtze fisheries and its implications for global freshwater ecosystem management. Fish. Fish 2020, 21, 60–623. [Google Scholar] [CrossRef]
  33. Liu, X.J.; Qin, J.J.; Xu, Y.; Ouyang, S.; Wu, X.P. Biodiversity decline of fish assemblages after the impoundment of the Three Gorges Dam in the Yangtze River Basin, China. Rev.: Methods Technol. Fish Biol. Fish. 2019, 29, 177–195. [Google Scholar] [CrossRef]
  34. Cheng, F.; Li, W.; Castello, L.; Murphy, B.R.; Xie, S.G. Potential effects of dam cascade on fish: Lessons from the Yangtze River. Rev. Fish Biol. Fish. 2015, 25, 569–585. [Google Scholar] [CrossRef]
  35. Wu, J.G.; Huang, J.H.; Han, X.G.; Gao, X.M.; He, F.L.; Jiang, M.X.; Jiang, Z.G.; Primack, R.B.; Shen, Z.H. The Three Gorges Dam: An Ecological Perspective. Front. Ecol. Environ. 2004, 2, 241–248. [Google Scholar] [CrossRef]
  36. Jordi-René, M.; Albert, R.; Elisabet, T.; Héctor, V.; Isabel, M.; Sergi, S. Dam regulation and riverine food-web structure in a Mediterranean river. Sci. Total Environ. 2017, 625, 301–310. [Google Scholar]
  37. Zhang, S. Distribution of Nutrient and Plankton Mass in Three Gorges Reservoir Water Body. Ph.D. Thesis, Southwest Agricultural University, Chongqi, China, May 2005. [Google Scholar]
  38. Fearnside, P.M. Dams in the Amazon: Belo Monte and Brazil’s hydroelectric development of the Xingu river basin. Environ. Manag. 2006, 38, 16–27. [Google Scholar] [CrossRef]
  39. Li, B.; Wang, Z.J.; Yang, J.P.; Yue, X.J.; Qi, Z.M.; Zhang, Y.G. The dynamic and seasonal variation of the fish food webs in the mainstream of Three Gorges Reservoir. J. Fish. China 2013, 37, 1015–1022. [Google Scholar] [CrossRef]
  40. Ba, J.W.; Deng, H.T.; Duan, X.B.; Liu, S.P.; Li, Y.; Cheng, D.Q. Trophic level analysis on main fish species in the middle reaches of Yangtze River by δ13C and δ15N analysis. Chin. J. Zool. 2015, 50, 537–546. [Google Scholar]
  41. Ban, X.; Du, H.; Wei, Q.W. Fish preference for hydraulic habitat in typical middle reaches of Yangtze River, China. J. Appl. Ichthyol. 2013, 29, 1408–1415. [Google Scholar] [CrossRef]
  42. Ministry of Environmental Protection of the People′s Republic of China. Water Quality-Determination of Chlorophyll a-Spectrophotometric Method: HJ 897-2017; Ministry of Environmental Protection of the People’s Republic of China: Beijing, China, 2017.
  43. Burnhan, K.P.; Anderson, D.R. Model Selection and Multi-Model Inference: A Practical Information-Theoretic Approach; Springer: New York, NY, USA, 2004. [Google Scholar]
  44. Hoeinghaus, D.J.; Winemiller, K.O.; Agostinho, A.A. Hydrogeomorphology and river impoundment affect food-chain length of diverse Neotropical food webs. Oikos 2008, 117, 984–995. [Google Scholar] [CrossRef]
  45. Tang, C.J. Evolution, driving mechanism and control strategy for eutrophication in Changjiang River Basin. Yangtze River 2020, 51, 80–87. [Google Scholar]
  46. Akin, S.; Winemiller, K.O. Seasonal variation in food web composition and structure in a temperate Tidal Estuary. Estuaries Coasts 2006, 29, 552–567. [Google Scholar] [CrossRef]
  47. Takimoto, G.; Spiller, D.A.; Post, D.M. Ecosystem size, but not disturbance, determines food-chain length on islands of the bahamas. Ecology 2008, 89, 3001–3007. [Google Scholar] [CrossRef] [Green Version]
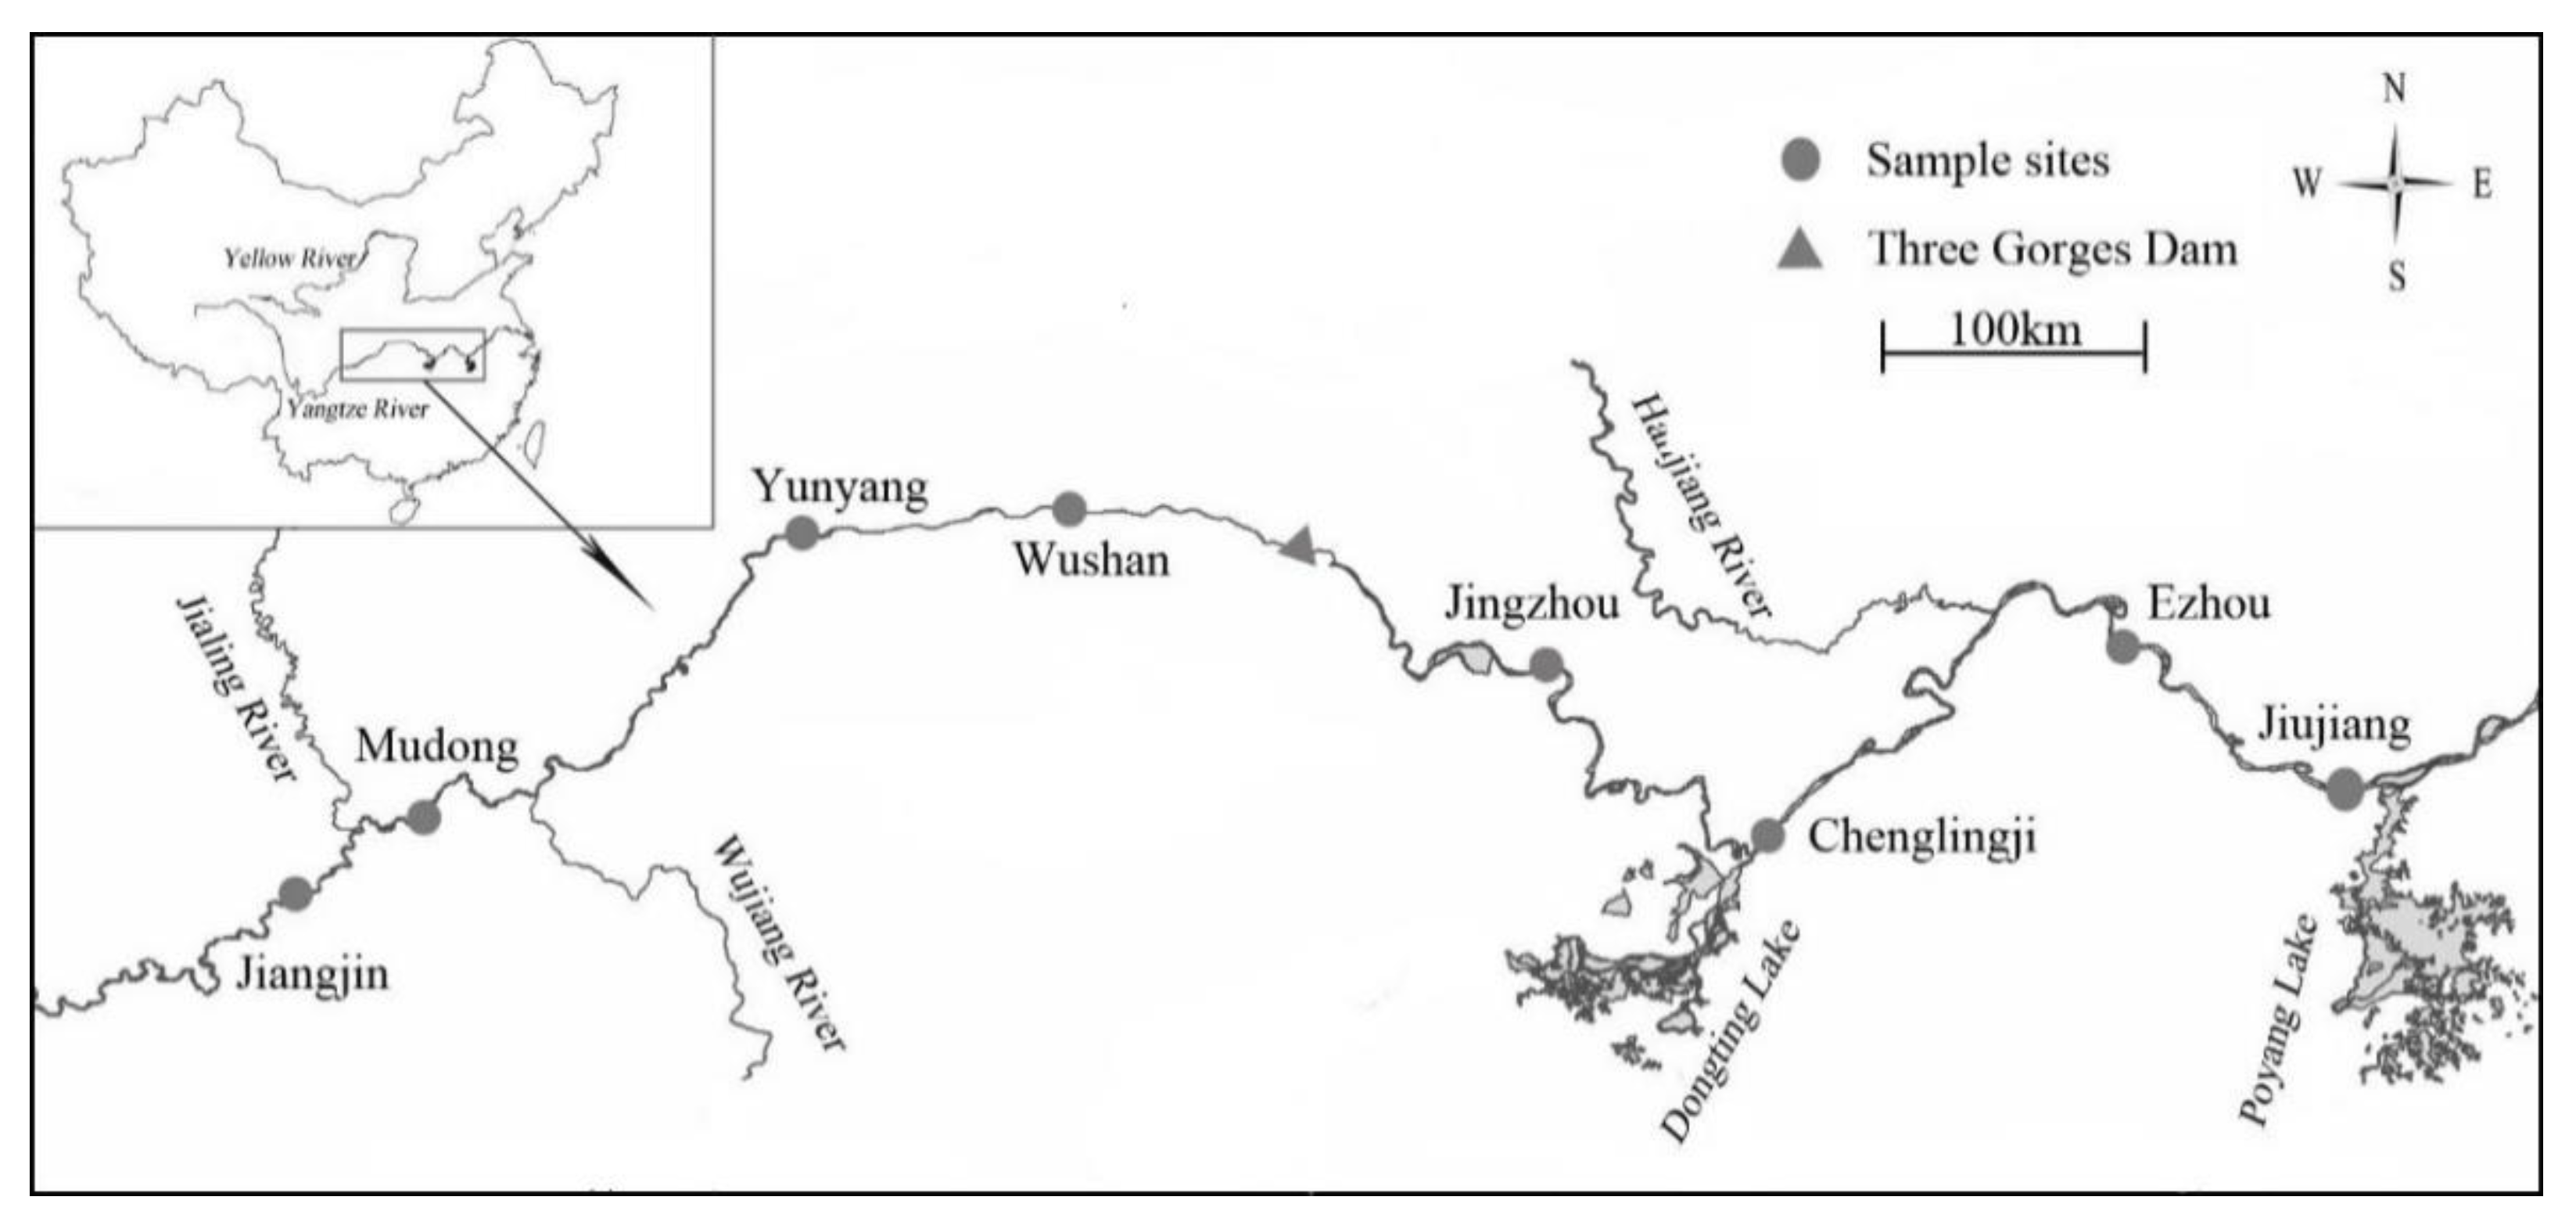
Figure 1. Map of the study area and sample sites.
Water 12 03157 g001
Figure 2. Food chain length (FCL) in different sections of the Yangtze River. The diamonds show the average value, and the whiskers either side of the diamonds show the standard error (SE).
Water 12 03157 g002
Figure 3. Box plots for the FCL of fish upstream of the dam (Jiangjin–Yunyang section) and downstream of the dam (Jingzhou–Jiujiang section). The boxes show the interquartile range, and the whiskers either side show the 10th and 90th percentiles. The median values are shown as a horizontal line in the middle of each box.
Water 12 03157 g003
Figure 4. Comparison of the FCL in different types of reaches. UR: the upper reaches with swift currents, including the Jiangjin and Mudong sections; IR: the impounded reaches, including the Yunyang and Wushan sections; DR: the downstream reaches with free flow, including the Jingzhou–Jiujiang section. The columns show the average value and the whiskers show the SE. NS indicates no significant differences (p > 0.05); * and ** indicate significant differences (p < 0.05; p < 0.01).
Water 12 03157 g004
Figure 5. Relationships of FCL (maximum trophic position) and (a) ecosystem size (cross-sectional area (m2) and log-transformed), (b) resource availability (Chl-a (μg/L)), and (c) disturbance (multivariate disturbance index).
Water 12 03157 g005aWater 12 03157 g005b
Table 1. Description of habitat characteristics for the sampling sites.
Sample ReachEcosystem TypeAltitude (m)Distance from the Three Gorges Dam
JiangjinRiver209644 km (upstream of the dam)
MudongRiver181543 km (upstream of the dam)
YunyangReservoir175248 km (upstream of the dam)
WushanReservoir174121 km (upstream of the dam)
JingzhouRiver43185 km (downstream of the dam)
ChenglingjiRiver37392 km (downstream of the dam)
EzhouRiver26710 km (downstream of the dam)
JiujiangRiver23853 km (downstream of the dam)
Table 2. Model selection results for environmental driving factors on the FCL. The reported parameters are the coefficient of determination (R2), significance (p), AIC corrected for a small sample size (AICc), relative AICc (△AICci), Akaike weight (wi), and evidence ratios.
Component ModelsR2pAICc△AICcwiEvidence Ratio
Ecosystem size0.630.01−1.710.000.721.0
Resource availability0.580.030.241.950.272.7
Disturbance0.040.636.628.330.0172.0
Publisher’s Note: MDPI stays neutral with regard to jurisdictional claims in published maps and institutional affiliations.