Article

Cyanobacterial Blooms and Zooplankton Structure in Lake Ecosystem under Limited Human Impact

by
Agnieszka Napiórkowska-Krzebietke
1,*,
Krystyna Kalinowska
2,
Elżbieta Bogacka-Kapusta
1,
Konrad Stawecki
1 and
Piotr Traczuk
3
1
Department of Ichthyology, Hydrobiology and Aquatic Ecology, Inland Fisheries Institute, Oczapowskiego 10, 10-719 Olsztyn, Poland
2
Department of Lake Fisheries, Inland Fisheries Institute, Rajska 2, 11-500 Giżycko, Poland
3
Department of Sturgeon Fish Breeding, Inland Fisheries Institute, Pieczarki 50, 11-610 Pozezdrze, Poland
*
Author to whom correspondence should be addressed.
Water 2020, 12(5), 1252; https://doi.org/10.3390/w12051252
Submission received: 31 March 2020 / Revised: 17 April 2020 / Accepted: 24 April 2020 / Published: 28 April 2020
(This article belongs to the Special Issue Phytoplankton and Phytobenthos: From Freshwater to Marine Ecosystems)

Abstract

:
Cyanobacterial blooms are tightly related to increasing trophic conditions of lakes and climate warming. Abiotic and biotic parameters were studied in a shallow lake, in which the island with the largest cormorants colony in north-eastern Poland is situated. We hypothesized that the strongest cyanobacterial blooms will persist near the cormorant’s island and will decrease with an increasing distance from it. Filamentous cyanobacteria (Pseudanabaena, Planktolyngbya, Limnothrix, Planktothrix) were the main phytoplankton components during summer and autumn. Their strongest blooms (up to 66 mg L−1) were recorded near the roosting area. The content of nutrients and chlorophyll a, and the biomass of phytoplankton (primarily cyanobacteria) and zooplankton, decreased gradually with the increasing distance from the island. The changes from hypertrophic to eutrophic conditions were confirmed by a decrease in values of the trophic state index from 72 (site 1) to 58 (site 5). This all suggests that cormorants might have a significant impact on the deterioration of water quality (at distance to 1.6 km) and can contribute to faster water eutrophication. Our results suggest that protection of breeding sites for many waterbirds, such as cormorants, becomes a real threat for the functioning of aquatic ecosystems due to a large load of nutrients.

1. Introduction

Cyanobacteria are known as one of the main phytoplankton groups closely related to the increase in trophy level and climate warming. They can dominate in almost all types of aquatic ecosystems, from freshwater to marine, including different climatic zones [1,2,3,4,5]. The persistent blooms of cyanobacteria affect the whole aquatic food web, starting from viruses, bacteria and fungi to metazooplankton and fish [3,6,7,8]. The most common negative consequences include primarily hypoxia-generating conditions, food web disruptions, water quality worsening, loss of the aquatic biodiversity, and toxic-related harmfulness for human and animals. Recent reports showed that eutrophication [4,9,10] is considered as the most important factor controlling the cyanobacterial growth. The fast process of water eutrophication with cyanobacterial blooms presenting a serious threat to aquatic ecosystems is mostly the result of human nutrient inputs [4,11]. Toxigenic cyanobacteria and cyanotoxins are commonly found not only in European waters, but also all over the world and can also threaten human and animal health [12,13]. Among the commonly blooming toxic or potentially toxic species of the genera Microcystis, Aphanizomenon and Dolichospermum (previously Anabaena) are also listed Planktothrix, Planktolyngbya, Pseudanabaena or Limnothrix [14,15,16]. Consequently, all this leads to irreversible disturbances in the structure and functioning of the aquatic food webs [17].
Some studies on cormorants and their environment [18] have shown that the intensive cyanobacterial blooms can also be attributed to regions with more eutrophicated water bodies where Great Cormorant Phalacrocorax carbo (L.) usually spends the entire breeding and post-fledging seasons. Such sites are often included in various forms of protection, i.e., limiting the human activities to some extent. Moreover, the number of pairs in colony and the number of colonies have increased during the last few decades in European countries. Cormorants are also important indirect and direct links in food webs facilitating both the organic matter dislocation between the aquatic and terrestrial ecosystems and feeding on fish [19,20,21]. The elevated phosphorus and nitrogen concentrations were recorded not only in the top-soil layer, but also in littoral water in the vicinity of the colony. The cormorant-related changes in the aquatic ecosystems are, thus, associated primarily with the deterioration of water quality. It includes a clear decrease in water transparency simultaneously with an increase in electrical conductivity, chlorophyll a, phosphorus, and nitrogen concentrations, as well as a decrease in the abundance of more sensitive macrophytes [22]. The detailed studies on the cormorant’s effect on primary producers are very scarce. These studies only show that a very high share of cyanobacteria (up to 66%) in phytoplankton assemblages can occur at the sites closely located just beneath the cormorant’s roost [23]. The dominants species are Woronichinia naegeliana (Unger) Elenkin, Microcystis aeruginosa (Kützing) Kützing, and Aphanothece sp., and they dominate during the warmer periods of the year, while diatoms dominate in colder months. Furthermore, filamentous green algae of the genera Cladophora and Ulva, and brown algae of the genera Pilayella, Fucus and Ectocarpus tended also to be more abundant near older and denser colonies of cormorants due to higher nutrient enrichment originating from the colonies [24].
The aims of this study were to (1) determine the intensity, structure and spatial distribution of cyanobacterial blooms; (2) indicate the key factors that enhance the cyanobacterial growth in the cormorant-affected freshwater ecosystem; and (3) estimate the zooplankton effect on the whole phytoplankton community and individually on cyanobacteria. We hypothesized that the strongest blooms will last in the vicinity of the cormorant’s island, and their intensity will decrease along the increasing distance from this island.

2. Materials and Methods

2.1. Study Site

Lake Warnołty is a shallow (maximum depth of 6.2 m, mean depth of 2.5 m) lake with a surface area of ca. 370.4 ha, located in north-eastern Poland. This elongated lake (5 km long) was previously regarded as the southern bay of the largest lake, Lake Śniardwy. Nowadays, both lakes are treated separately, although the waters outflow from Lake Warnołty towards Lake Śniardwy. They are still connected by some part of the lake with a wide strip of submerged (e.g., Potamogeton natans L., P. perfoliatus L., P. crispus L., Myriophyllum sp.) and emergent vegetation (e.g., Nuphar lutea (L.) Sibth. & Sm., Typha latifolia L., Phragmites australis (Cav.) Trin. ex Steud, Acorus calamus L., Schoenoplectus lacustris (L.) Palla, Persicaria amphibia (L.) Delarbre), which can play a role of buffer zone. In 1976, Lake Warnołty was established as a nature reserve protecting the breeding sites for a lot of wetland birds and hunting sites for carnivorous birds especially including cormorants. Recently, the number of cormorants living on the Warnowska Island (the middle of Lake Warnołty) has increased from 295 nesting pairs recorded firstly in 2005 to 1479 nesting pairs in 2016. It is the largest colony of cormorants in north-eastern Poland [25], which can catch and eat a large amount of fish from Lake Warnołty and Lake Śniardwy. Recently, their number has remained around 1122 nesting pairs.
The surrounding catchment, which consists mainly of forests and limited fisheries management, suggests the very low anthropogenic impact on the lake. The lake is inhabited by the most common fish like perch Perca fluviatilis L., pikeperch Sander lucioperca L., tench Tinca tinca (L.), bream Abramis brama (L.), pike Esox lucius L., bleak Alburnus alburnus (L.), and roach Rutilus rutilus (L.), which constitute the main dietary components of cormorants [25,26,27].

2.2. Sampling and Determination

The sampling sites were located at different distances from the Warnowska Island (Figure 1). Site 1 was located 5 m from the island (the nearest site to cormorant’s island), site 2—800 m, site 3—1600 m, site 4—2500 m (near the inflow to Lake Śniardwy), and site 5 (Lake Śniardwy)—3000 m from the island. Site 4 can be treated as a buffer zone in the outflow from Lake Warnołty. The last site was chosen to check the impact of waters flowing out from Lake Warnołty on Lake Śniardwy.
The biological parameters included phytoplankton, protozooplankton (heterotrophic nanoflagellates, ciliates), and metazooplankton (rotifers, copepods, cladocerans). In 2016, water samples for biological and chemical analyses were collected in summer (July) and autumn (October) from four sites (1–4), while in 2017, in spring (March), summer (July) and autumn (November) from five sites (1–5). Water samples were taken from the subsurface (0.5 m) water layer and fixed with Lugol’s solution and 96% ethanol. The phytoplankton samples were not concentrated., Additional samples for taxonomic analyses of plankton were taken using the plankton net with 10 μm mesh size. Phytoplankton (including also cyanobacteria) abundance was analyzed using an inverted microscope (Nikon) according to the Utermöhl method [28], and the biomass was calculated from the cell biovolume measurements, according to standard methods revised in Napiórkowska–Krzebietke and Kobos [29]. Phytoplankton composition was determined using a light microscope at magnifications of 200×, 400×, and 1000× with oil immersion. Species identifications were based on the latest references [30,31,32,33,34] and their currently accepted taxonomic names were confirmed according to Guiry and Guiry [35].
Heterotrophic nanoflagellate (HNF) samples were fixed with formaldehyde (final concentration 2%), stained with DAPI [36], filtered through 0.8 µm pore size polycarbonate membrane filters (Millipore) and enumerated by epifluorescence microscopy (Nikon Optiphot 2). The HNF biomass was calculated from measurements of cell size and their approximations to simple geometric forms. Samples for ciliates (1 L) were fixed with Lugol’s solution (0.5% final concentration), concentrated to 10–20 mL, and examined with a light microscope. Ciliate biomass was calculated from measurements of cell dimensions and simple geometric shapes. Species composition and measurements were determined from living samples condensed by filtering through a 10 μm mesh size plankton net. The taxonomic identifications of ciliates were based mainly on Foissner et al. [37]. Samples for rotifers and crustaceans were concentrated (25 L) using a plankton net of a mesh size 55 µm and preserved with Lugol’s solution and 96% ethanol. The abundance of rotifers and crustaceans was quantified using a Sedgwick–Rafter counting cell under an optical microscope. Identification of metazooplankton species was based mainly on Flössner [38], Radwan et al. [39] and Rybak and Błędzki [40]. Length and length–dry mass relationships were used for the biomass calculations of rotifers according to Ejsmont–Karabin [41] and the biomass of crustaceans according to Bottrell et al. [42].
The physicochemical parameters included water temperature (T), dissolved oxygen (DO), water transparency, chlorophyll a (Chl-a), total phosphorus (TP), total nitrogen (TN), total organic carbon (TOC), pH, and electrical conductivity. The water temperature and dissolved oxygen content were measured in situ in the vertical profile using an YSI 6600-V2-meter (YSI Inc., Yellow Springs, OH, USA) whereas the water transparency was measured with a Secchi disk and expressed as Secchi disk depth (SDD). The chlorophyll a content was analyzed with the spectrophotometric method including acetone extractions of cyanobacteria and the other phytoplankton groups retained on the Whatman GF/C glass filters. The content of TP was determined colorimetrically, after mineralization, using a Shimadzu UV 1601 spectrophotometer (Shimadzu Corporation, Tokyo, Japan) according to standard methods [43]. The content of TN and TOC was measured by a Shimadzu TOC-VCSH (Shimadzu Corporation, Tokyo, Japan) using a NDIR detector according to PN-EN 12260:2004 and PN-EN 1484:1999, respectively.

2.3. Data Analysis and Statistics

The Trophic State Index (TSI) of the lake was calculated from the summer SDD (TSISDD), Chl-a (TSICHL), TP (TSITP) and TN (TSITN) [44,45]. The classification of trophic state was made according to Carlson and Simpson [46] and possible interpretations of the TSI deviations according to Carlson and Havens [47]. The zooplankton grazing effect on phytoplankton, including relationships between planktonic organisms expressed as the biomass ratio of zooplankton (both total and individual groups) to phytoplankton, were analyzed as follows:
(1)
TZB:TPB
(2)
BCil:TPB
(3)
BRot:TPB
(4)
BClad:TPB
(5)
BCop:TPB
where: TZB—total zooplankton biomass, TPB—total phytoplankton biomass, BCil—ciliate biomass, BRot—rotifer biomass, BClad—cladoceran biomass, BCop—copepod biomass.
The assumptions of these relationships included the response to the questions: (1) how big the effect was, (2) when and where it was the largest, and (3) which group was the most effective.
Significant changes in spatial distribution of physicochemical parameters as well as biomass of planktonic organisms were tested with the non-parametric Kruskal–Wallis test (K-W test), assuming the 0.05 significance level. The database for testing included 23 cases (K-WH (4;23)). This analysis of results was carried out using the Statistica software. The response of total phytoplankton and cyanobacteria to selected environmental parameters (T, TP, TN, TOC, SDD, Chl-a) was modeled with generalized additive model (GAM) analysis. The Canonical Correspondence Analysis (CCA) with a forward selection of variables (the Monte Carlo test with 999 permutations) was used to analyze the relationships between parameters. The GAM’s options included smoothness, df 2.0, Gaussian distribution, and identity link function. These two analyses were performed using CANOCO 5.0 software for Windows.

3. Results

3.1. Environmental Parameters

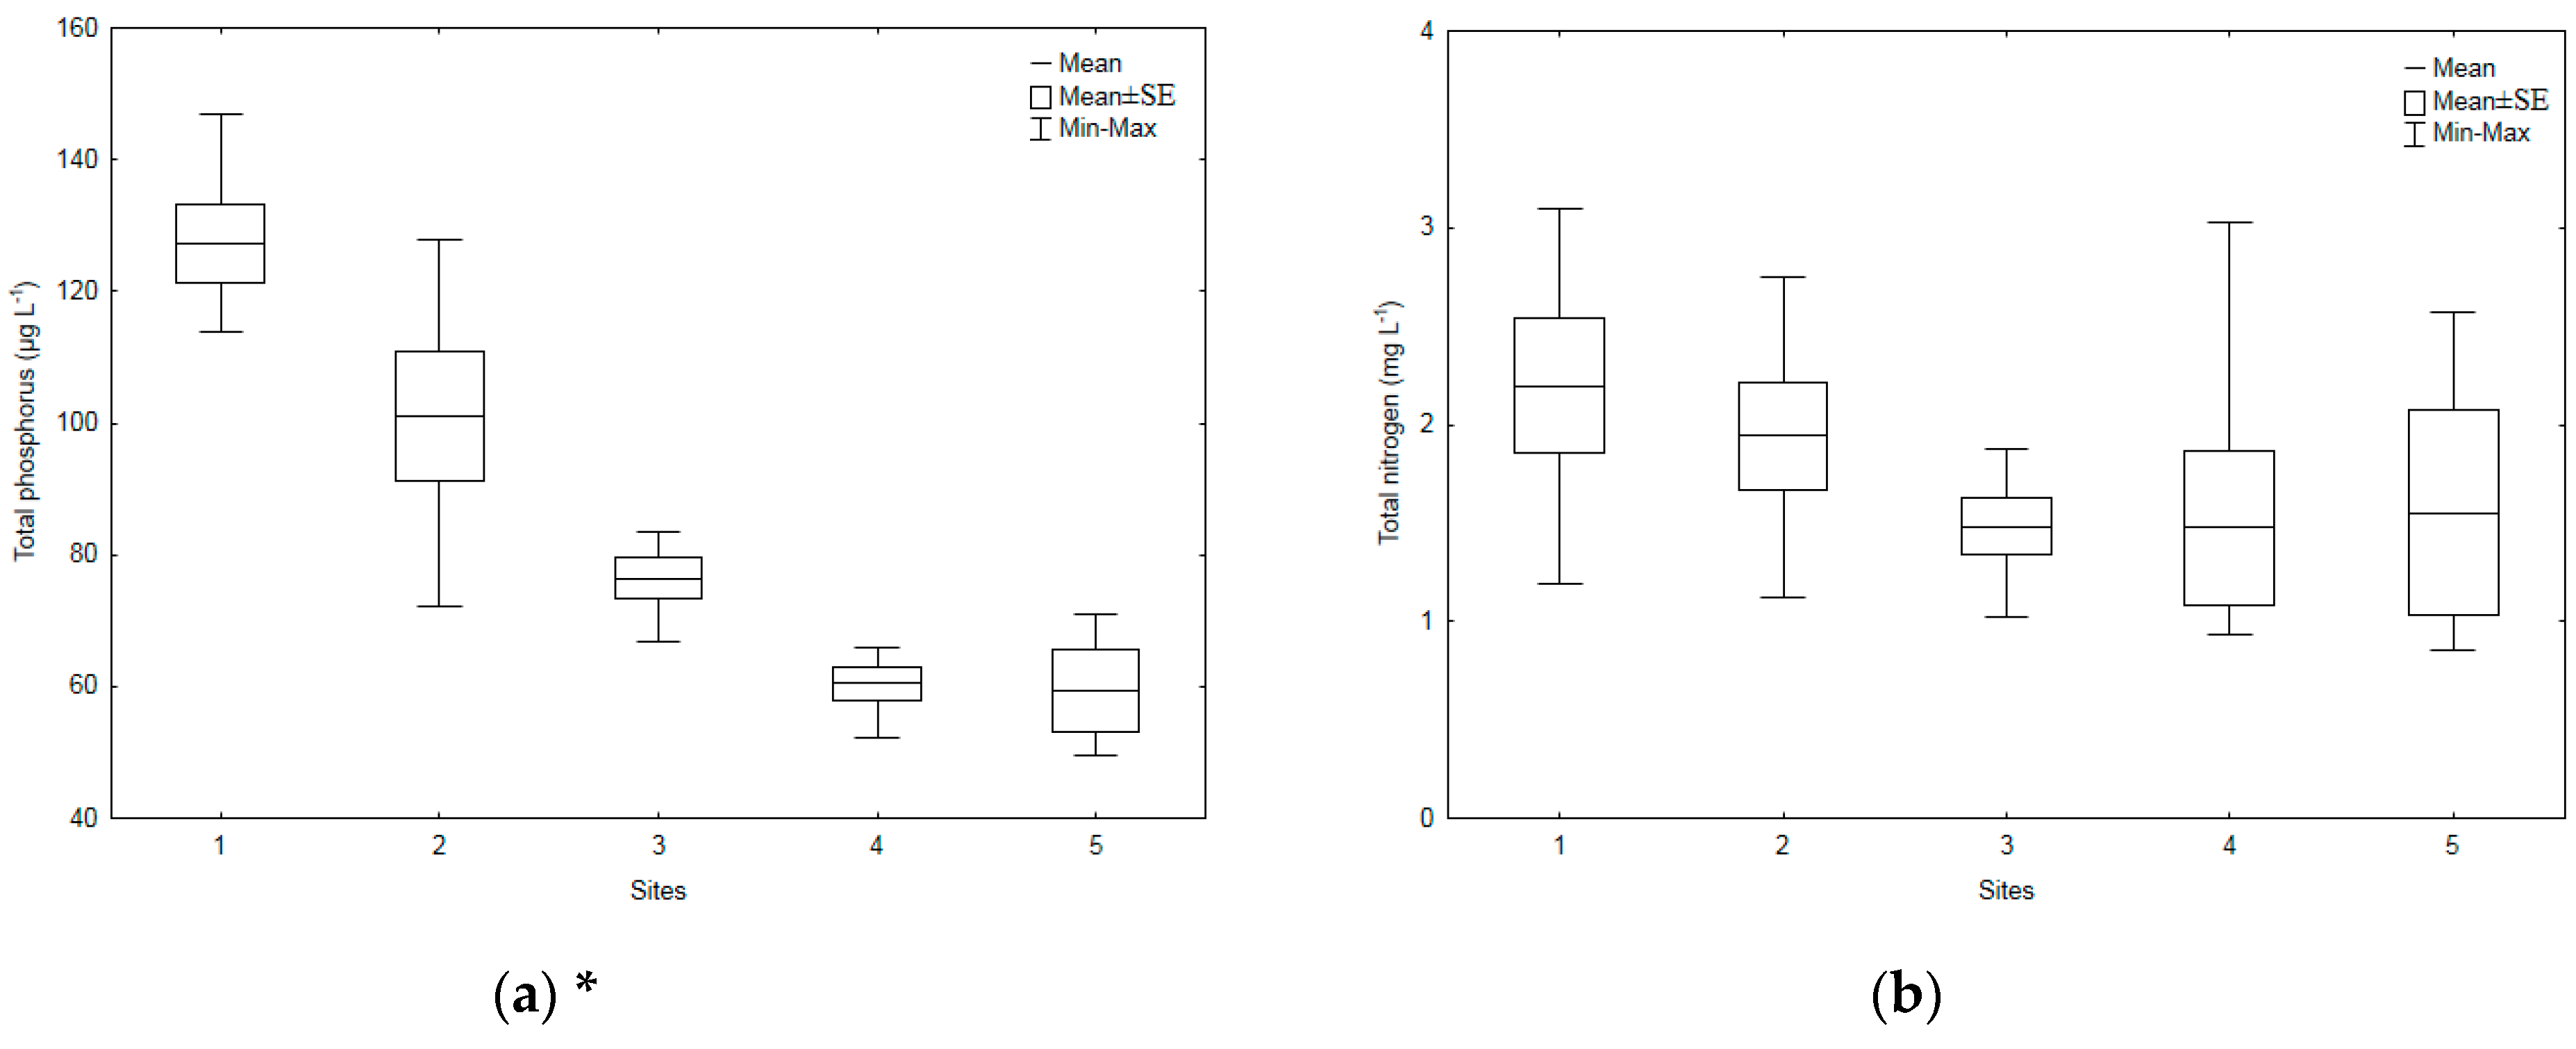
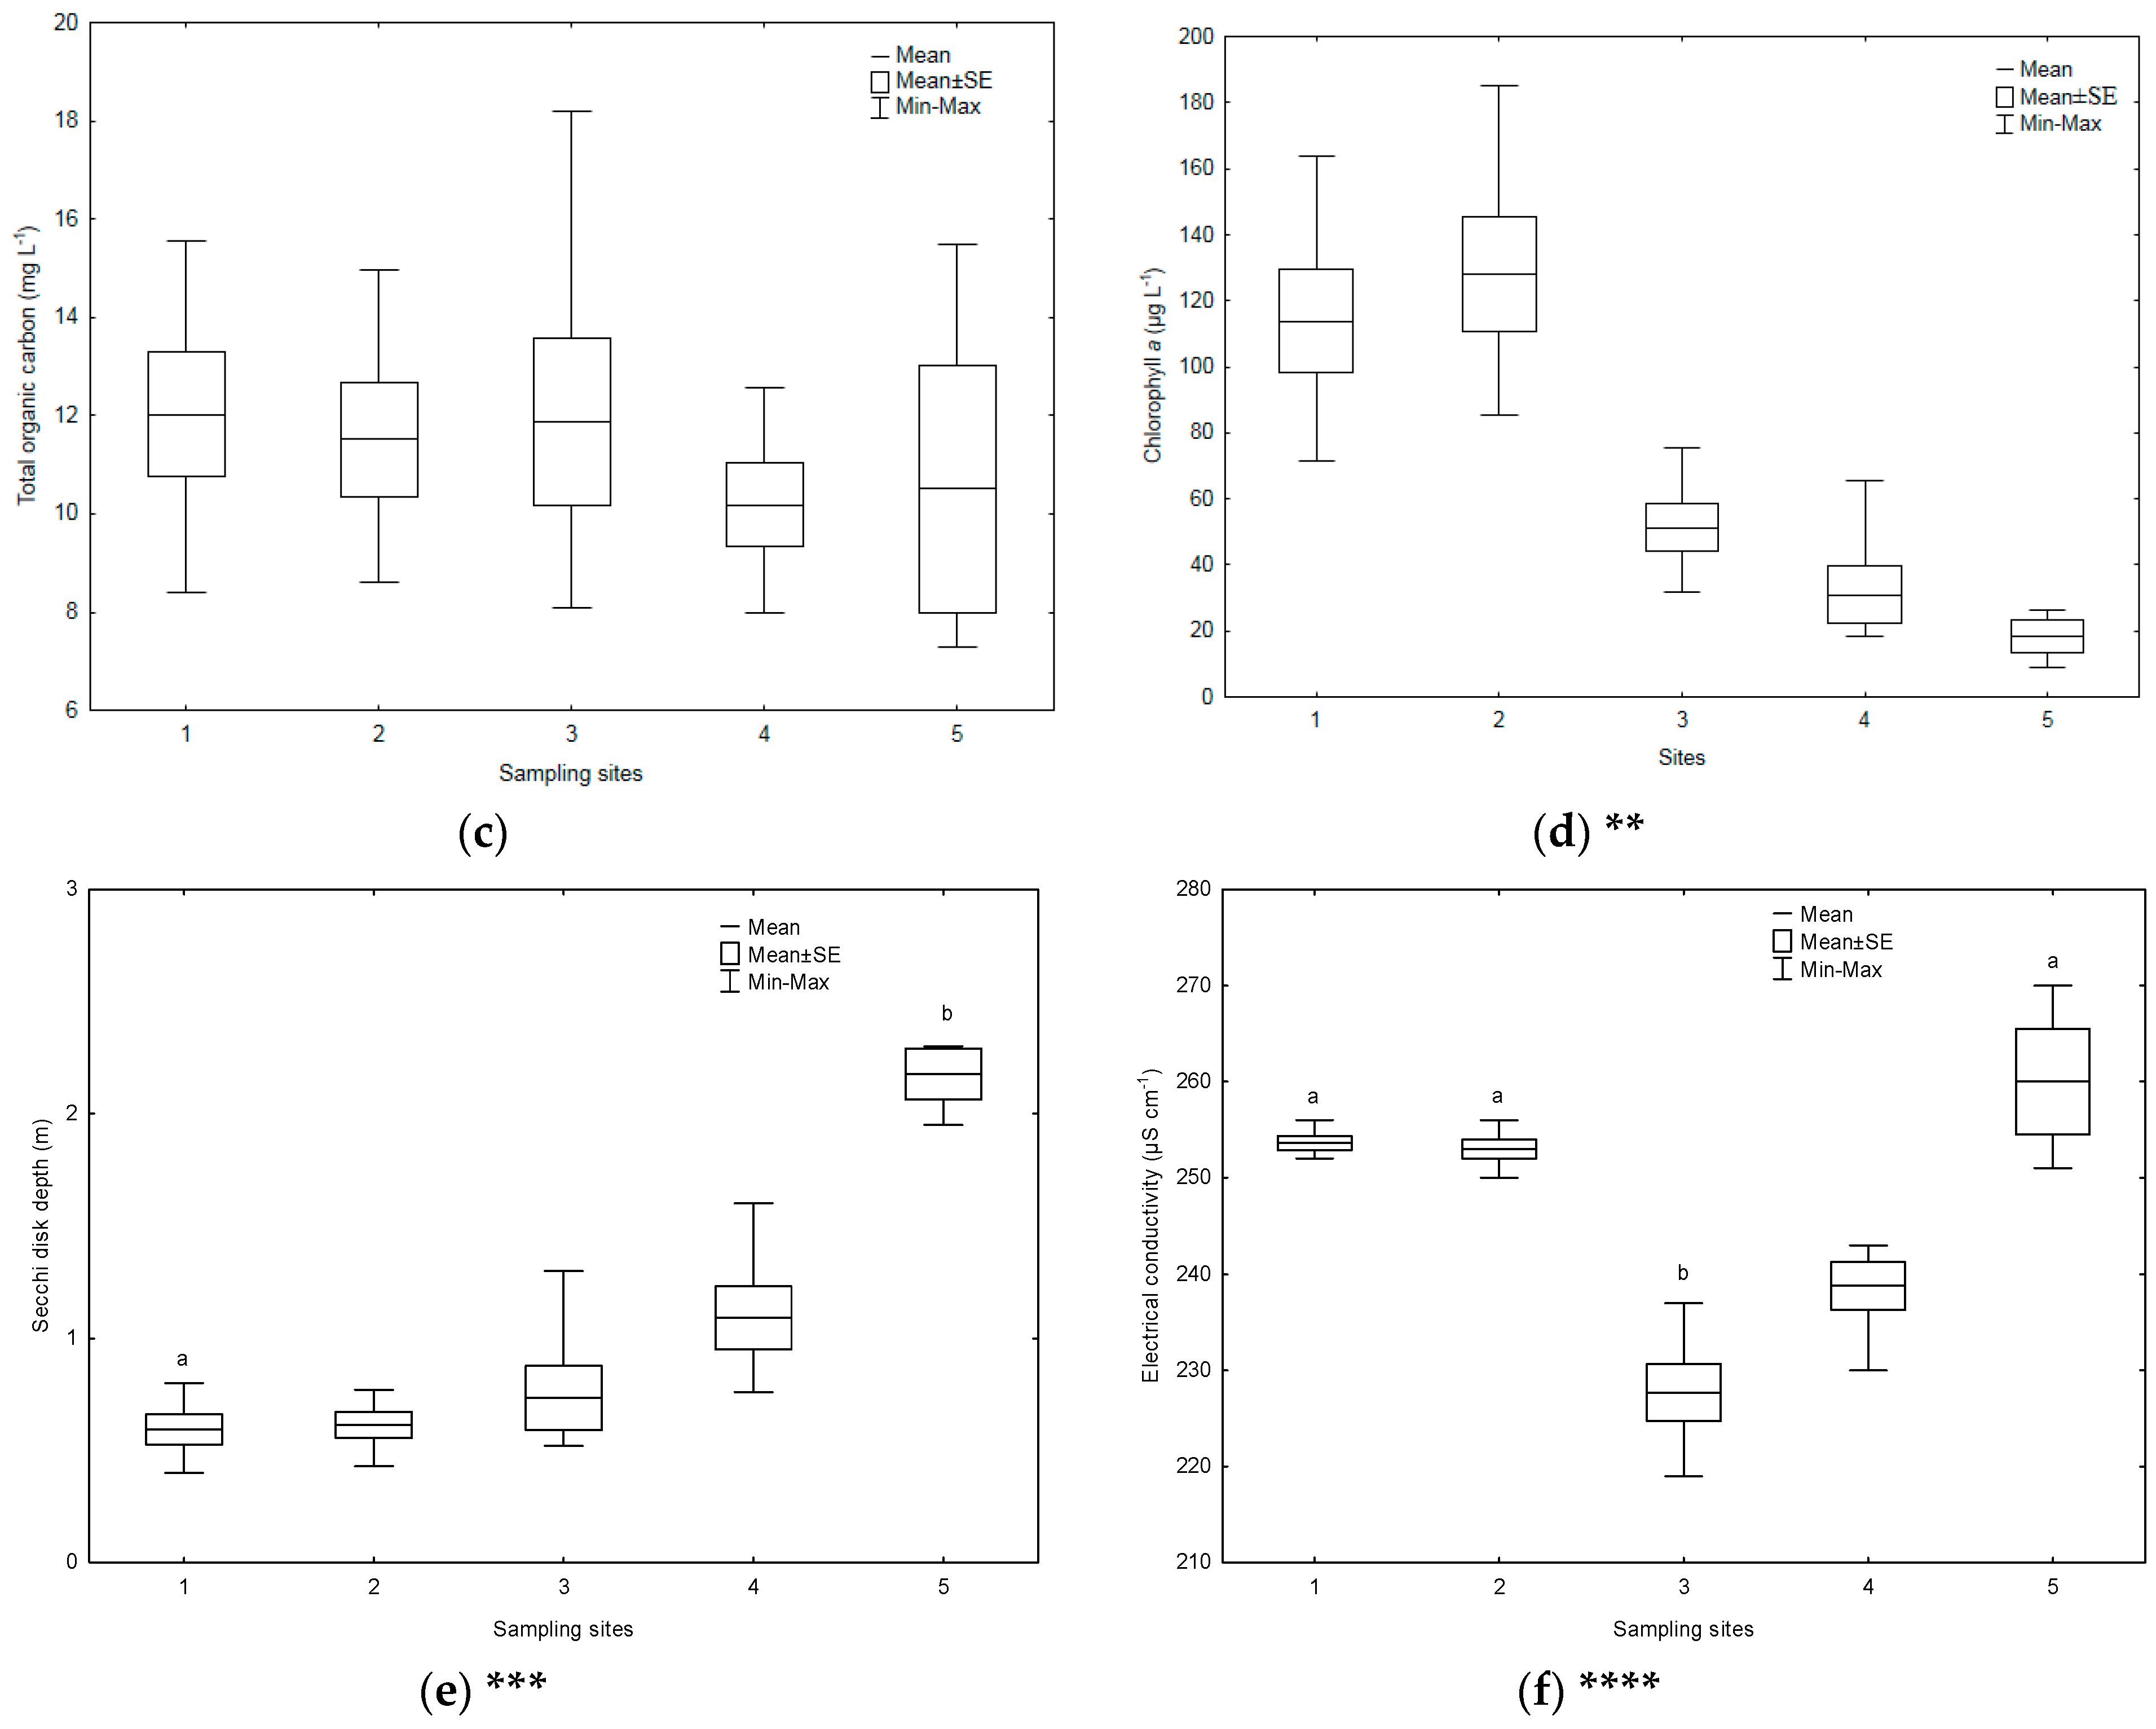
The water temperature (6–23 °C), dissolved oxygen concentrations (5.8–12.0 mg L−1) and pH (8.0–9.6) did not show significant differences in spatial distribution. The concentration of TP (Figure 2a), TN (Figure 2b) and TOC (Figure 2c) reached up to 0.147 mg L−1, 3.1 mg L−1 and 18.2 mg L−1, respectively. The highest content of nutrients was usually noted near the island with a clear tendency to decrease (especially of phosphorus content) along the increasing distance from the cormorant’s island. In analogy, the significantly higher chlorophyll a content (with maximum of 180 µg L−1) (Figure 2d) was recorded at site 1 close to the island. The opposite situation was observed in Secchi disk depth, which clearly increased with increasing distance from the island (Figure 2e). Among the other parameters, only electrical conductivity was characterized by significant changes in spatial distribution (Figure 2f). The Kruskal–Wallis test showed significant differences between sampling sites in TP (KW-H (4;23) = 18.5918; p = 0.0009), Chl-a (KW-H (4;23) = 18.029; p = 0.0012), SDD (KW-H (4;23) = 13.5351; p = 0.0089), and electrical conductivity (KW-H (4;23) = 17.6; p = 0.0015).
The mean values of TSI gradually decreased from 72 at the closest site to the island (site 1) to 58 at the furthest site from the island (site 5) (Table 1). The same decreasing tendency along the increased distance from the island was also recorded for most of the partial TSI indices. In opposite, the average values of the TN/TP ratio gradually increased, as follows: 17, 19, 20, 25, and 27 at sites 1, 2, 3, 4, and 5, respectively.

3.2. Total Phytoplankton and Cyanobacterial Biomass and Composition

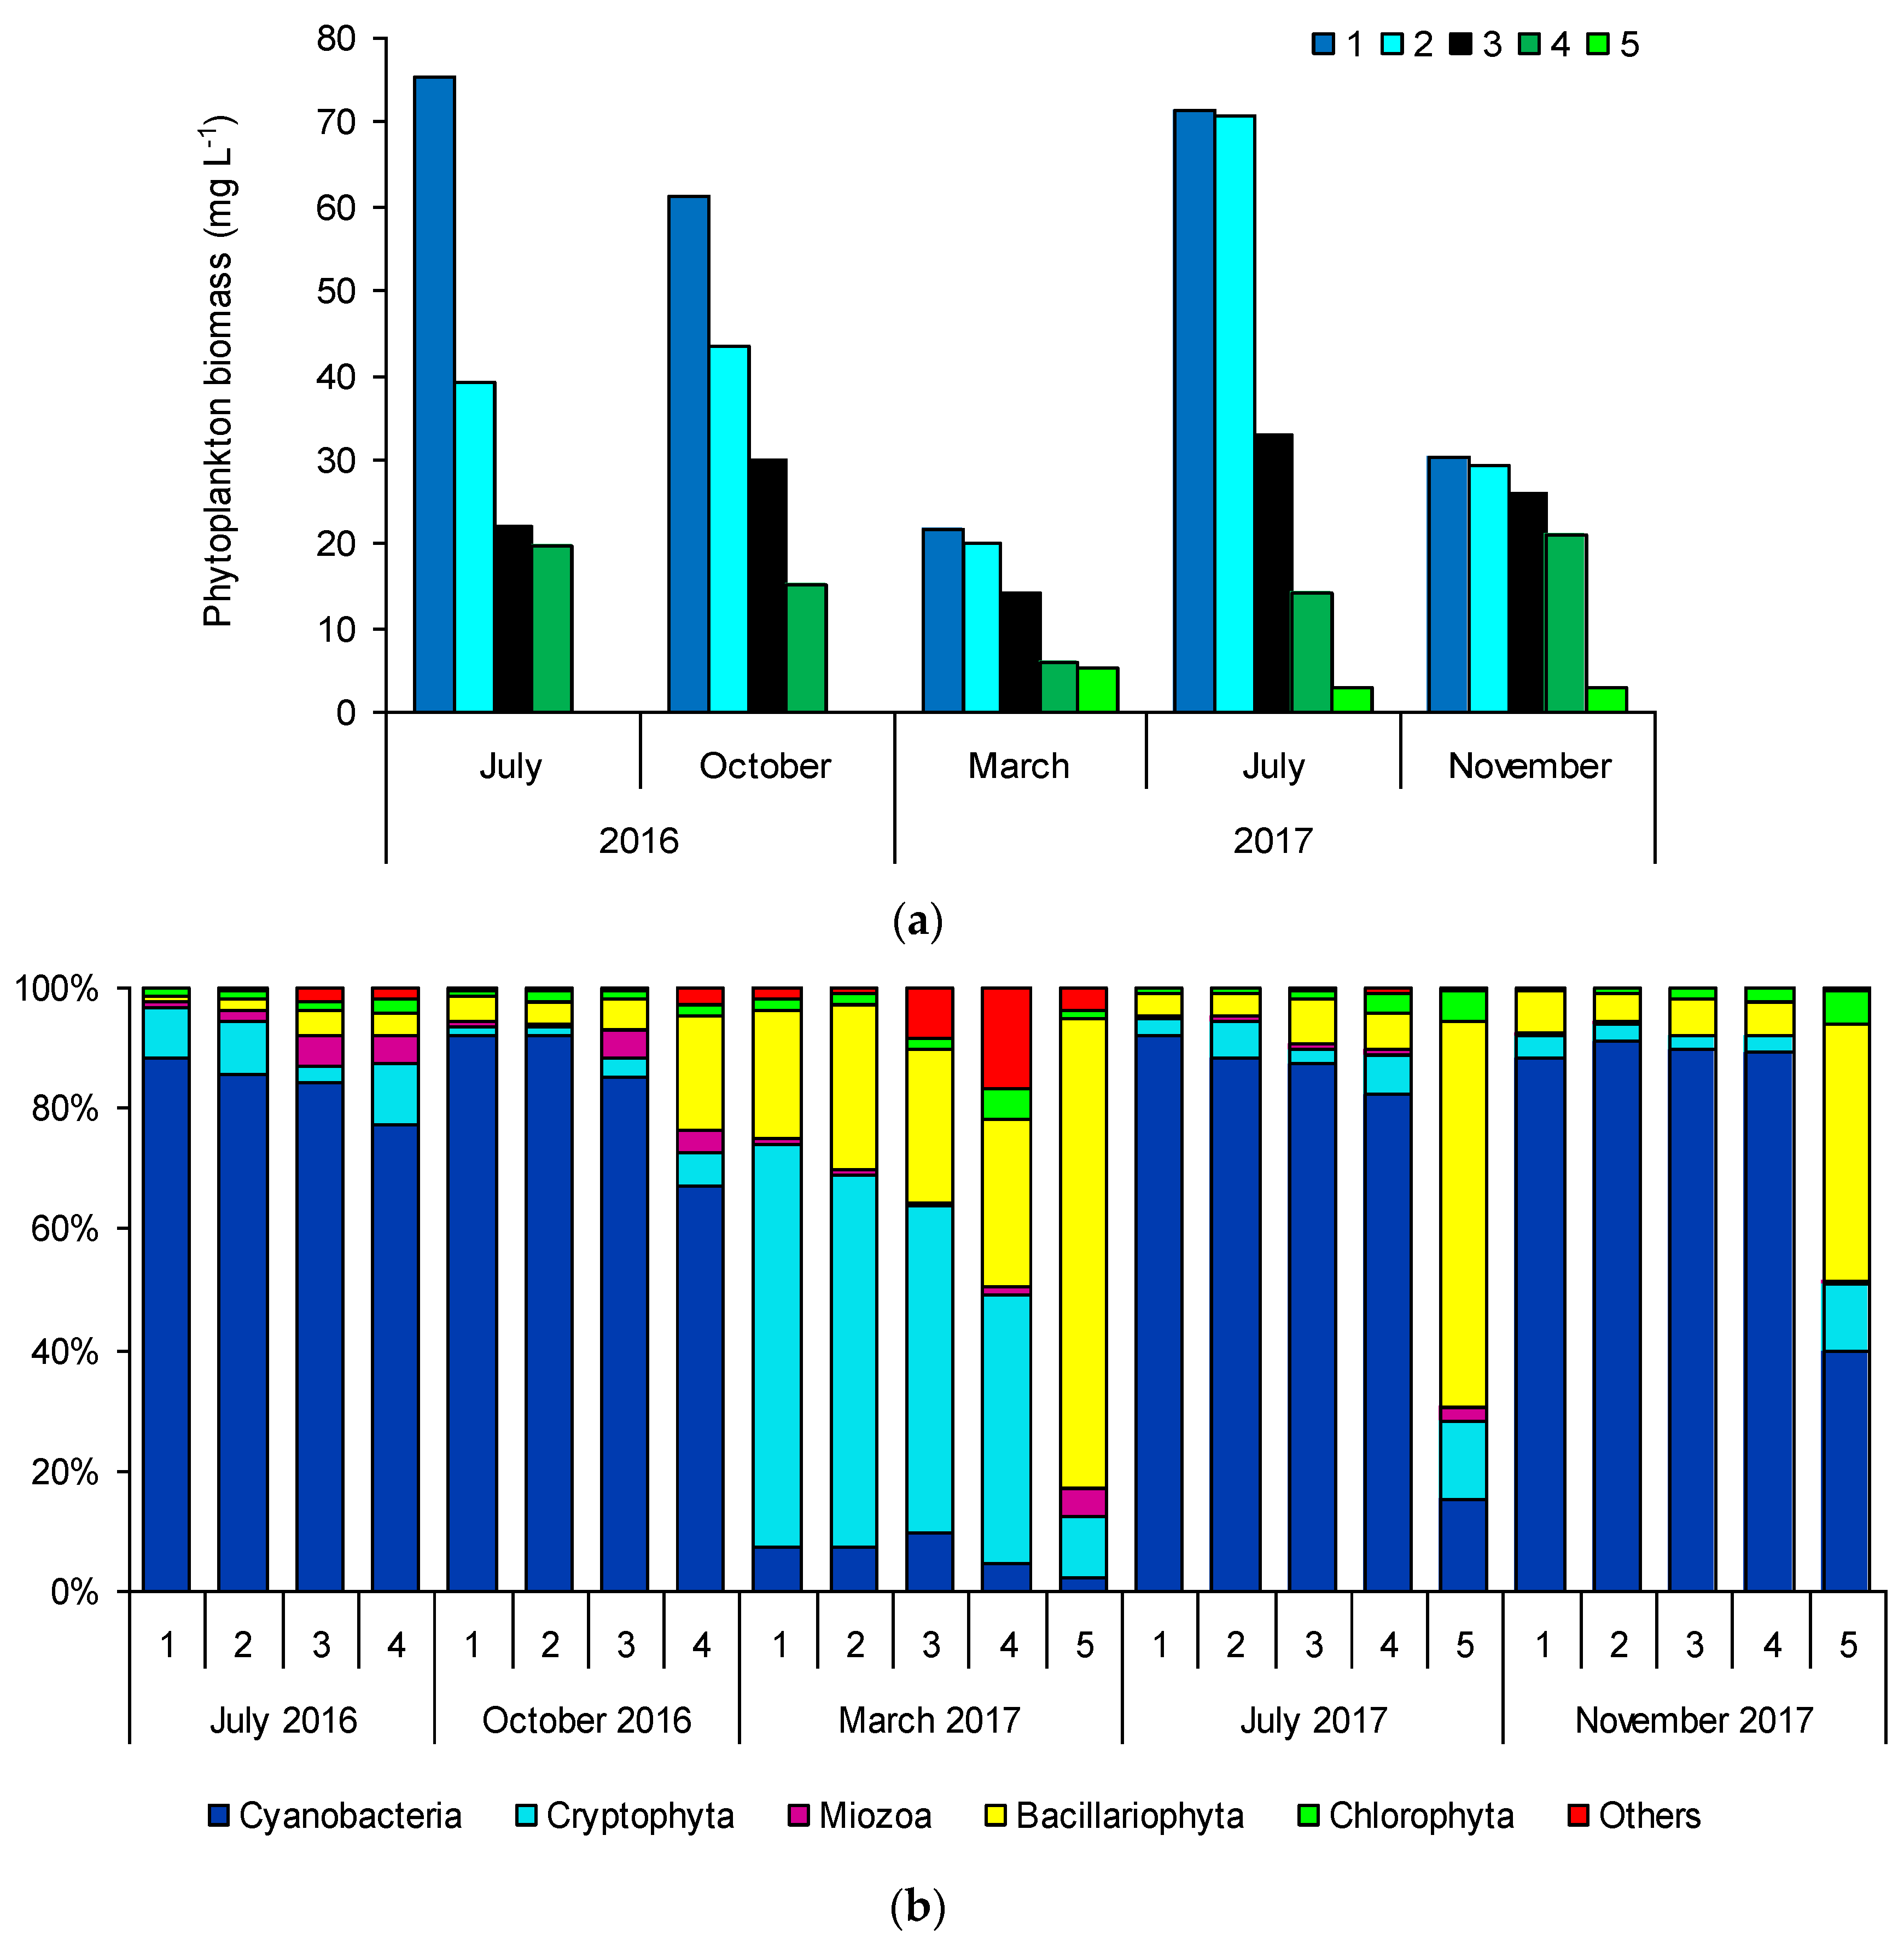
Throughout the growth season in both the studied years, the phytoplankton biomass ranged from 3.0 to 75.4 mg L−1 (Figure 3a). The highest biomass was always recorded at site 1. The total biomass distinctly decreased with the increasing distance from the island and the minimal values were noted at sites 4 and 5 in 2016 and 2017, respectively. The differences in spatial distribution were statistically significant (KW-H (4;23) = 15.8696; p = 0.0032), and the highest were recorded between sites: 1 and 5; 2 and 5. Thus, a clear tendency towards considerable decrease in the total biomass along the increasing distance from the island was recorded.
Cyanobacteria were the main phytoplankton components in Lake Warnołty (sites 1–4) in summer and autumn (Figure 3b). The most intensive blooms of cyanobacteria (up to 66 mg L−1) were always recorded at the closest site to the cormorant’s island. The least intensive blooms, in turn, were noted in the furthest area. Thus, the spatial differences between the studied sites were significant (KW-H (4;23) = 12.229; p = 0.0157). Dominants included primarily potentially toxic or toxic filamentous taxa such as Pseudanabaena limnetica (Lemmermann) Komárek, Planktolyngbya limnetica (Lemmermann) Komárková-Legnerová & Cronberg, Limnothrix redekei (Goor) Meffert and Planktothrix agardhii (Gomont) Anagnostidis & Komárek. In spring, the highest contribution had cryptophytes and diatoms. A different composition was recorded at site 5 (Lake Śniardwy) where in spring and summer, diatoms dominated, accounting for 70% of the total phytoplankton biomass; while in autumn, both diatoms and cyanobacteria were the main phytoplankton contributors (each ca. 40%).

3.3. Heterotrophic Nanoflagellate (HNF) Biomass

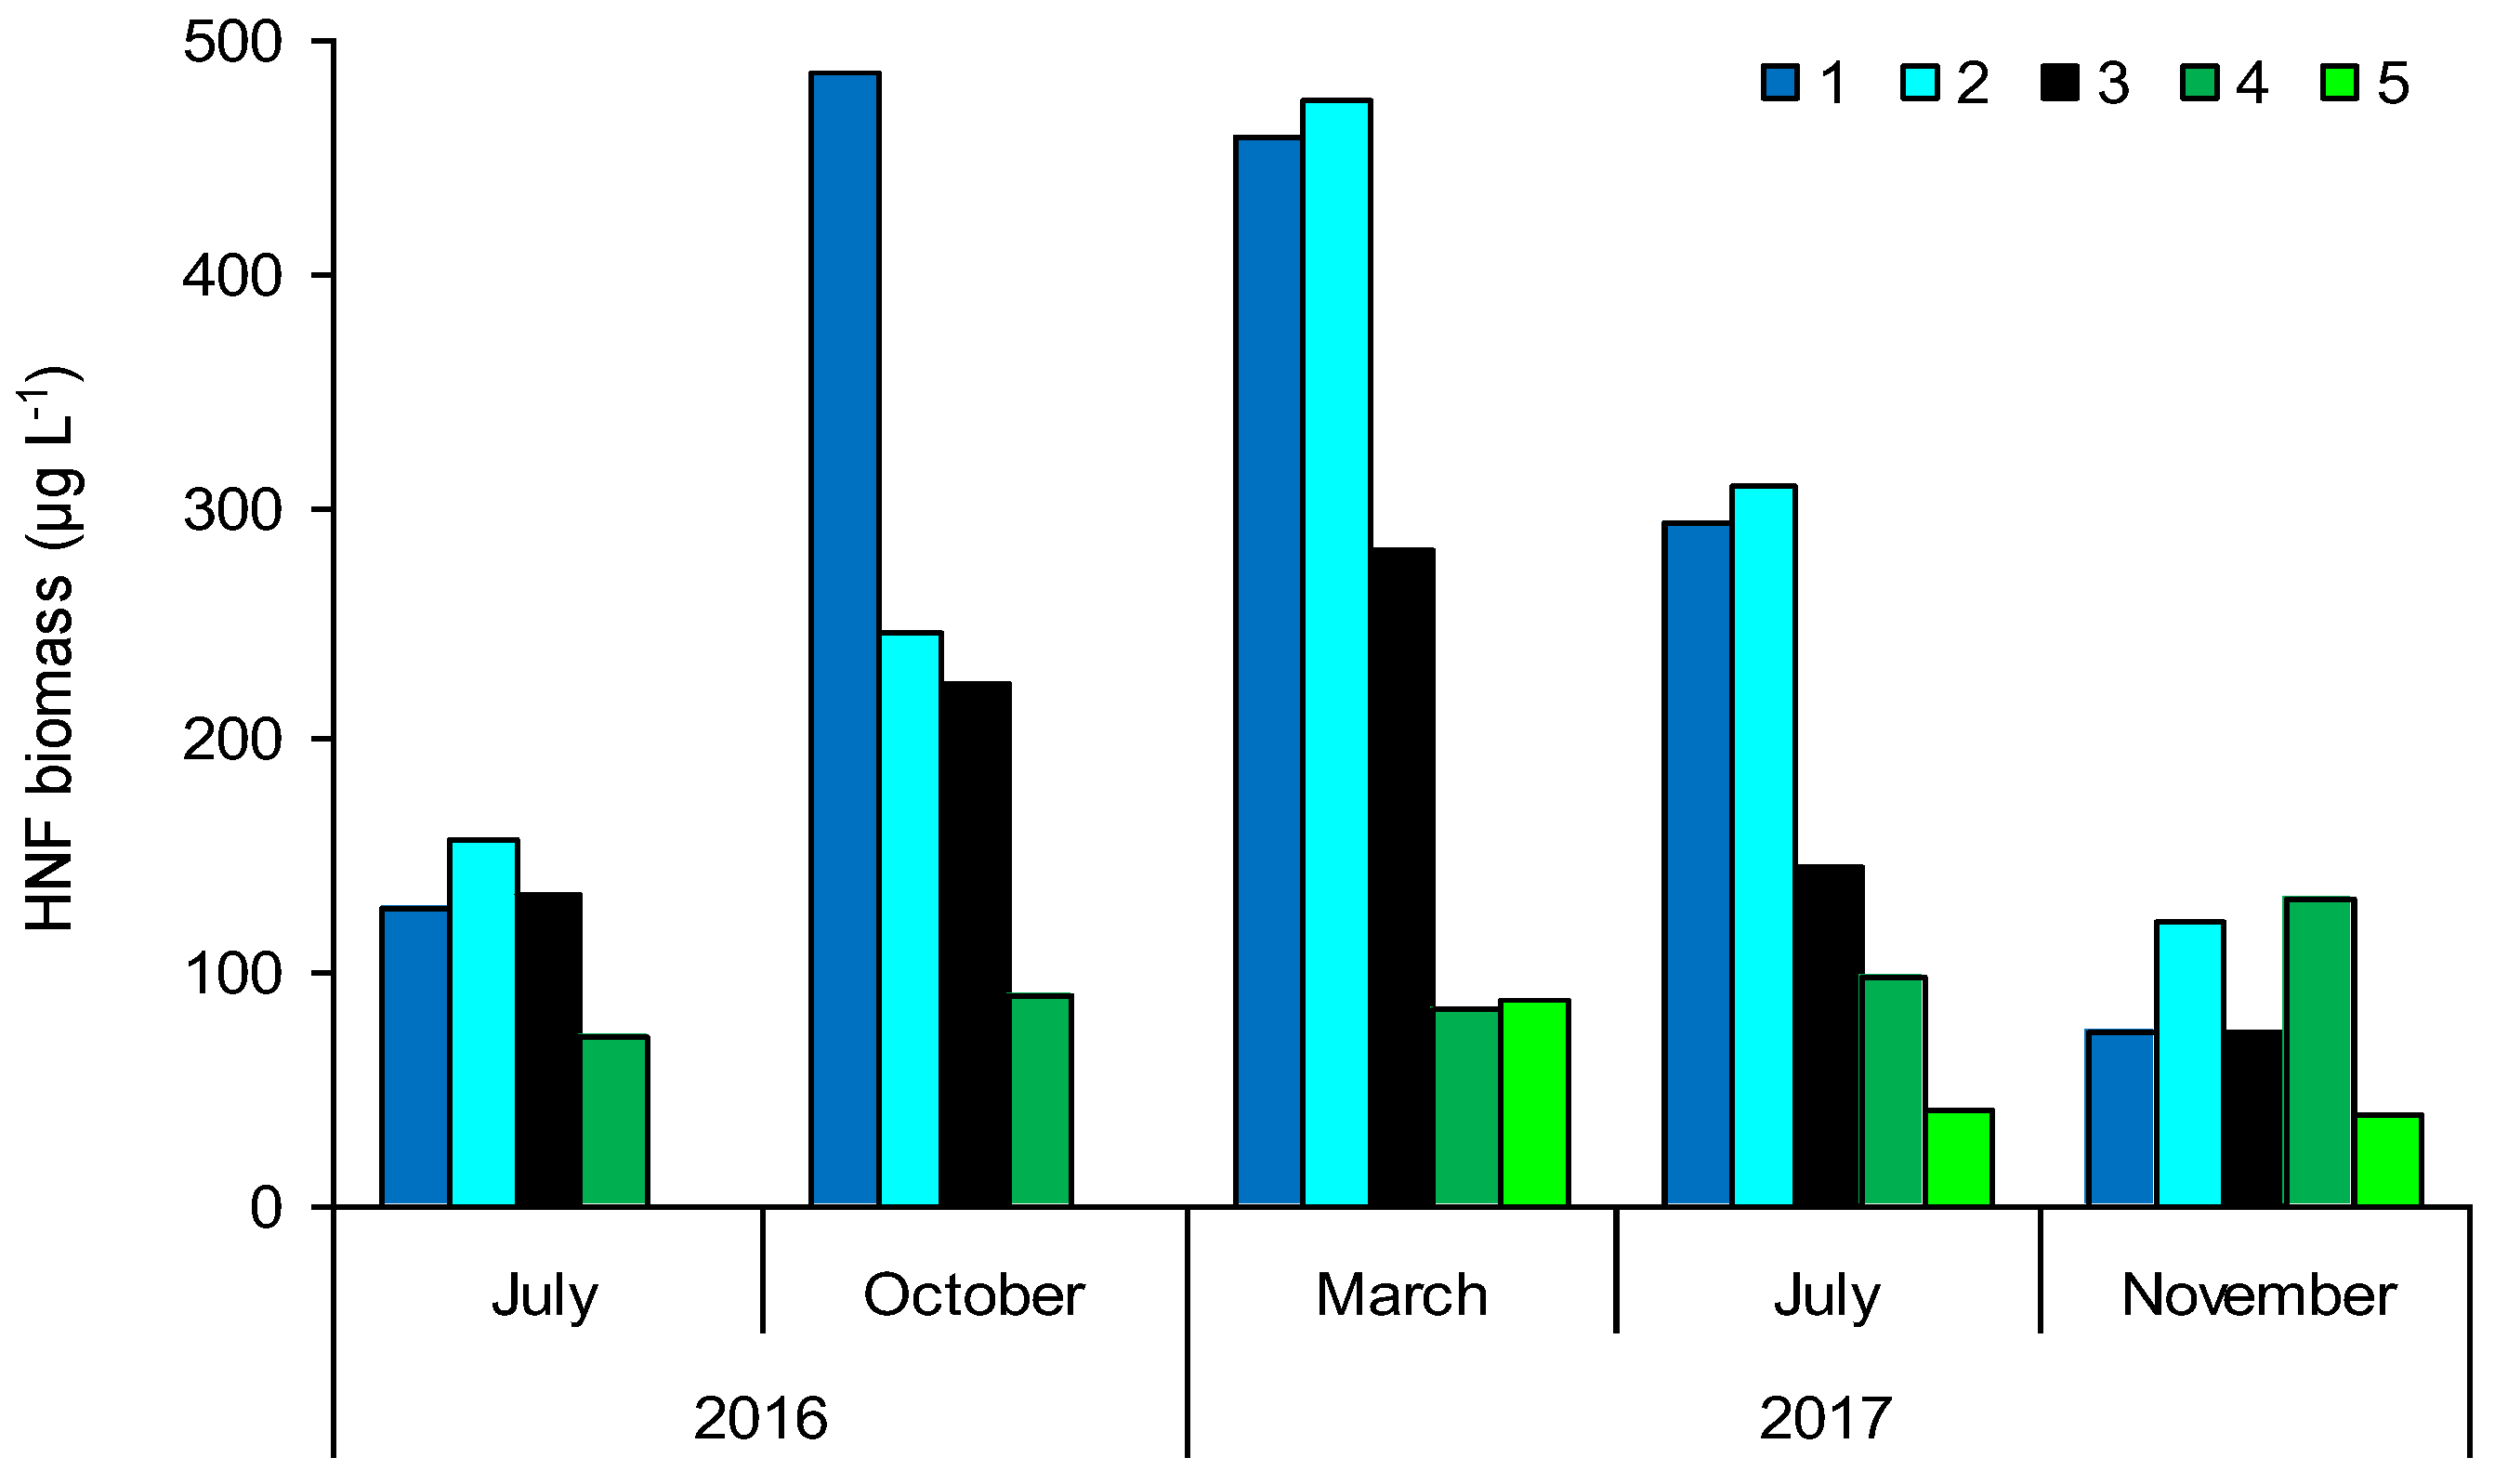
In July 2016, the biomass of HNF was about two-fold lower at site 4 than at the other sites (Figure 4). A distinct difference between sampling sites was also observed in October 2016. The highest HNF biomass was then observed at site 1, while the lowest was at site 4. The five-fold difference between the minimal and maximal values was recorded in March and July 2017, and the biomass of HNF decreased gradually with an increasing distance from the island. During autumn, the biomass was more or less uniformly distributed among the sampling sites. Generally, the HNF biomass differed significantly in spatial distribution (KW-H (4;23) = 11.0725; p = 0.0258).

3.4. Ciliate Biomass and Composition

Clear differences in the distribution of ciliate biomass were observed between the first and second year of the study. In July 2016, the highest ciliate biomass (962.5 µg L−1) was noted at site 2, while in October, the biomass was almost identical at sites 1 and 2 (Figure 5a). At this time, the highest value was recorded at site 3, while the lowest was at site 4. In 2017, the highest values of ciliate biomass in all of the studied months were recorded at site 2, while the lowest was at site 5, i.e., in Lake Śniardwy. Generally, the ciliate biomass differed significantly in spatial distribution (KW-H (4;23) = 11.0957; p = 0.0255).
The share of ciliate orders to the total ciliate biomass differed between the sampling sites, months, and years (Figure 5b). Oligotrichida (represented mainly by Tintinnidium fluviatile (Stein), Halteria grandinella (Müller), Strombidium spp., Rimostrombidium humile (Penard)), Haptorida (mainly Pelagodileptus trachelioides (Zacharias), Mesodinium spp. and Askenasia sp.), and Peritrichida (mainly species of the genus Vorticella) were an important component of ciliate biomass. Oligotrichida distinctly dominated in March and July 2017 at all sites, accounting for 29–66% of the total biomass. Haptorids were dominant in 2016, constituting 34–49% of the total biomass. Peritrichida dominated and/or co-dominated in November 2017 at most sites (28–50% of the total biomass). Although small bacterivorous scuticociliates were not a dominant component of ciliate community, their contribution to the total biomass in July 2017 distinctly decreased along the increasing distance from the island (from 11% to about 1%).

3.5. Rotifer and Crustacean Biomass and Composition

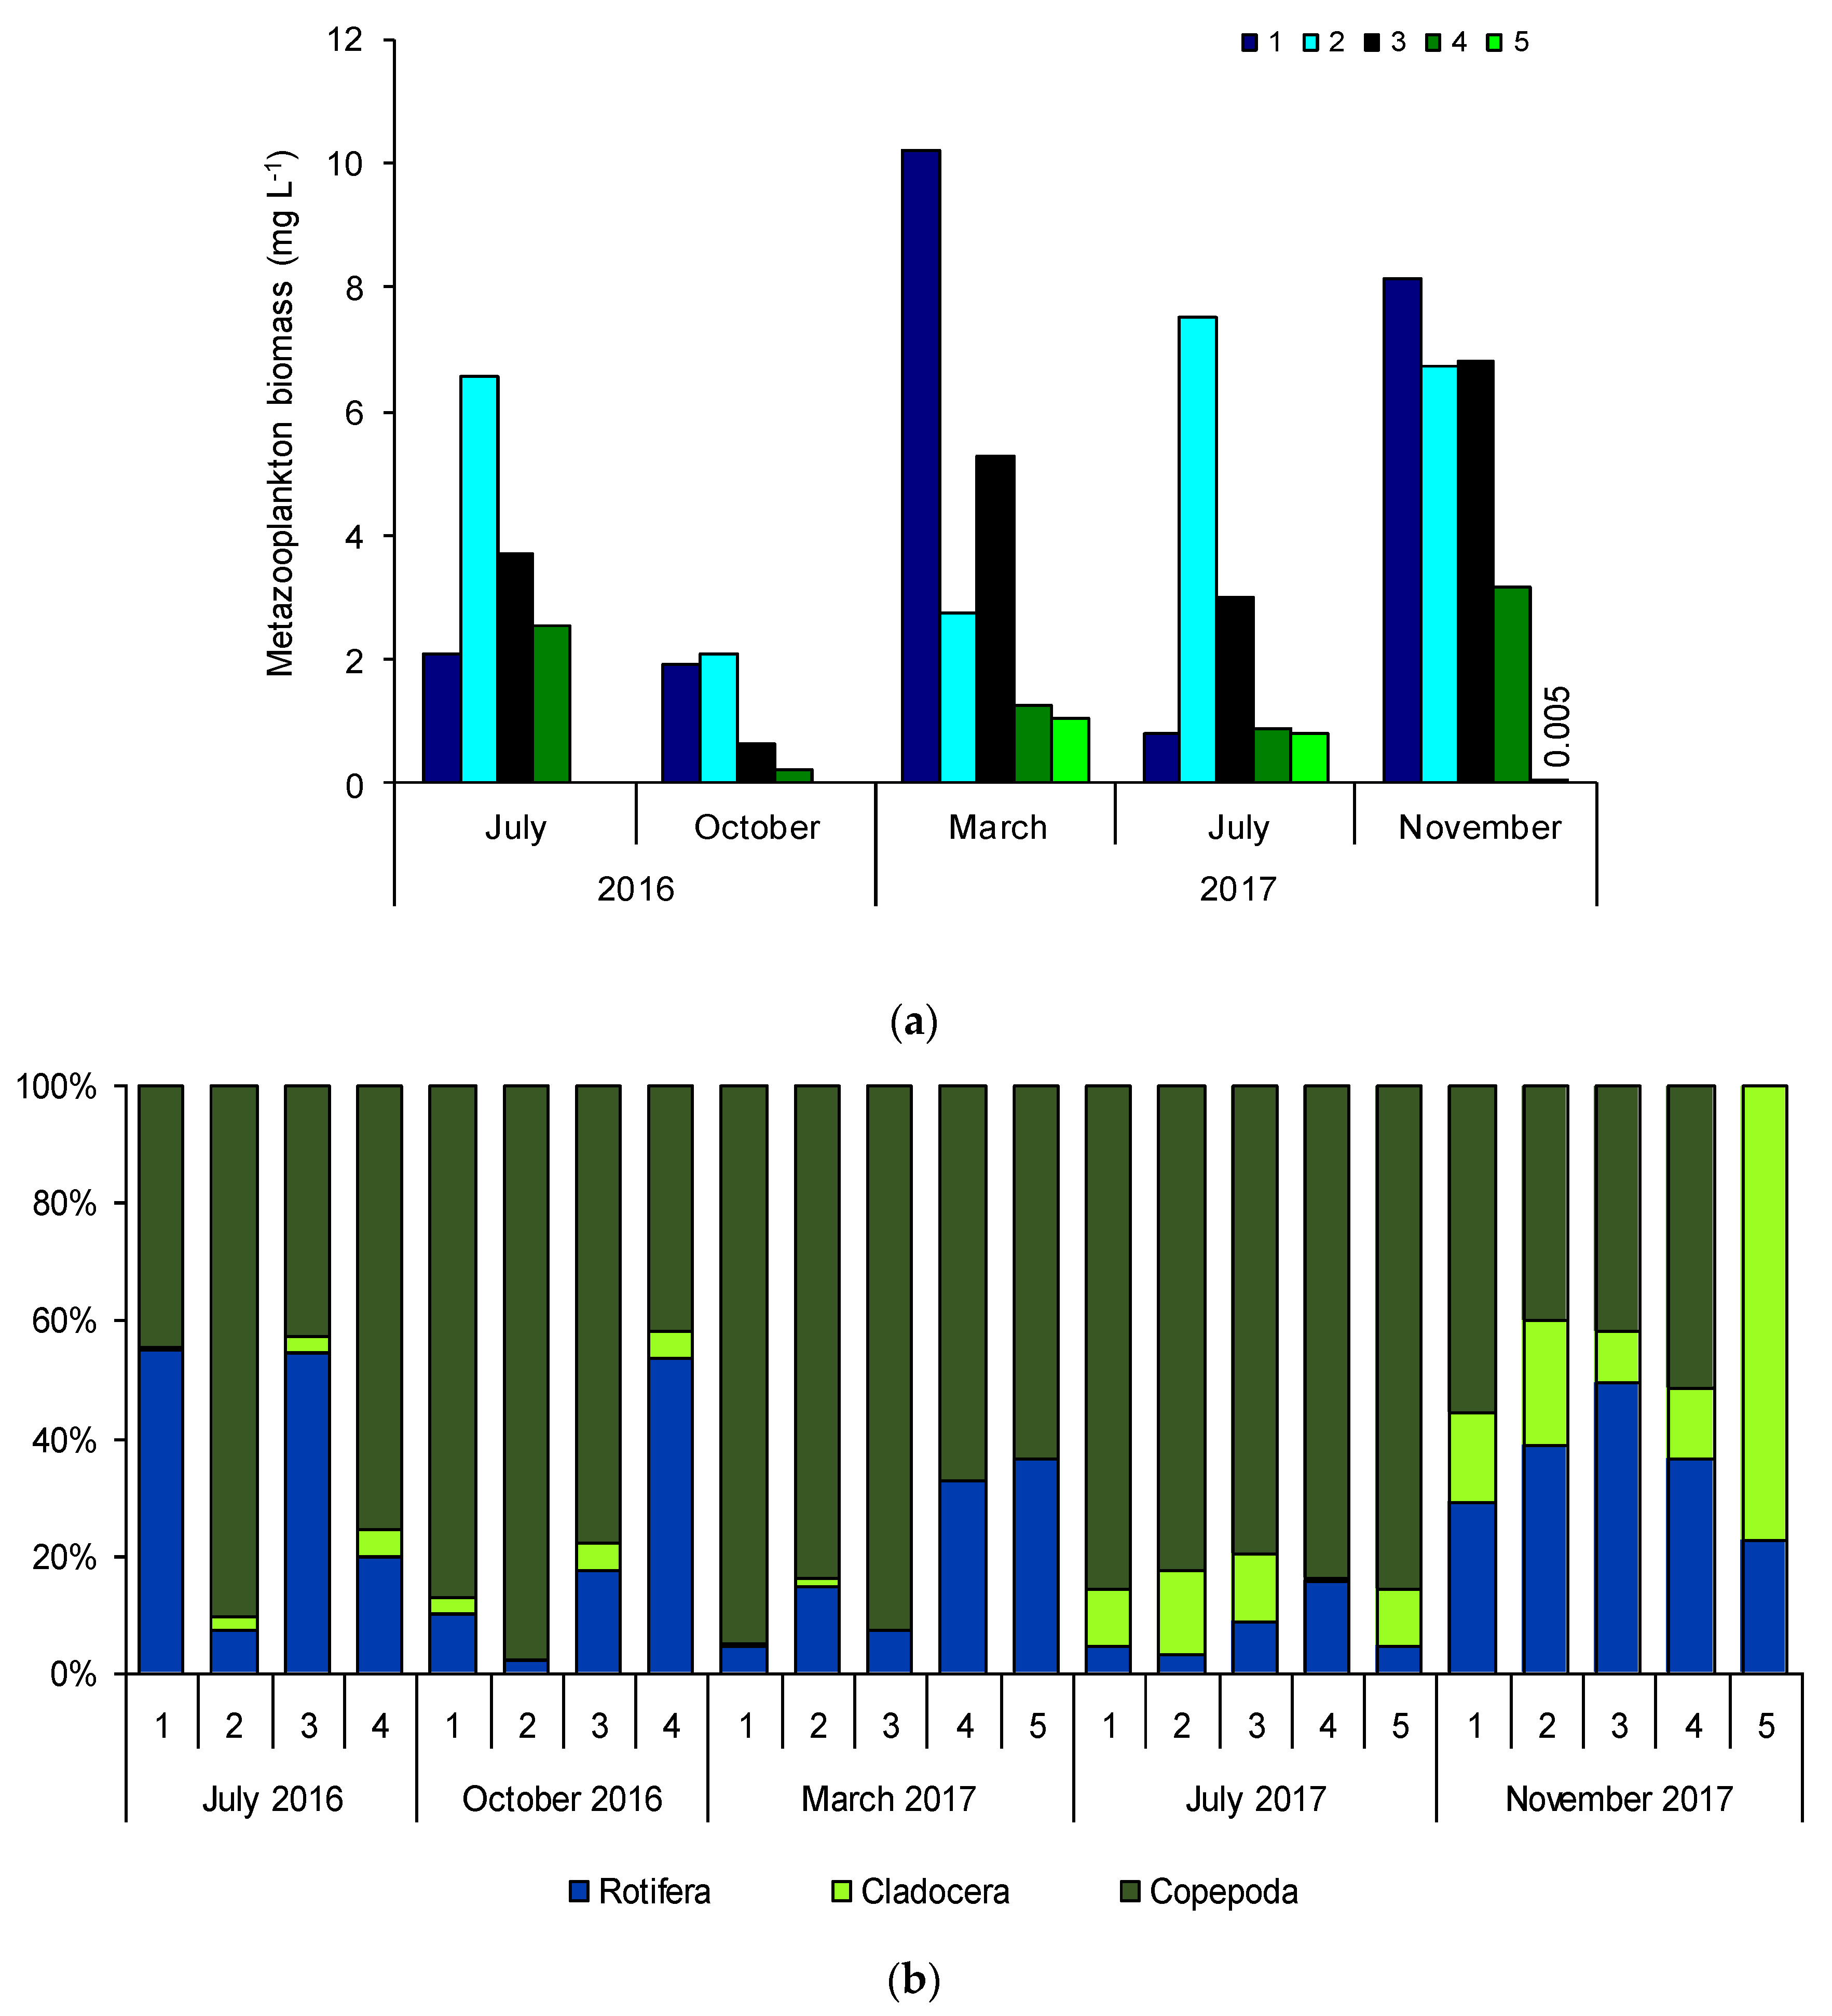
The total metazooplankton (rotifers, copepods and cladocerans) biomass was differently distributed in a spatial scale (Figure 6a). In colder months (March, November), the highest biomasses were recorded at site 1, while in warmer months (July, October) at site 2. The highest biomass values of 10.2 and 7.5 mg L−1 were noted at both sites, respectively. The total biomass showed an almost similar decreasing tendency for phytoplankton biomass. In all months of 2017, the lowest biomasses were observed at site 5.
Copepods were one of the main metazooplankton contributors (44–98% of the total biomass) except for site 5 in November 2017 where they were not recorded (Figure 6b). Rotifers were the second most important group and contributed 2–55% of the total biomass. The lowest contribution or even absence in zooplankton had usually cladocerans, except for one occasion (November 2017) at site 5 when they accounted for 77% of the total biomass. The significant differences in spatial distribution were found only for copepods (KW-H (4;23) = 10.4704; p = 0.0332). Generally, rotifers were primarily represented by the small-sized species, such as Filinia longiseta (Ehrenberg), Keratella cochlearis f. tecta (Gosse), Polyarthra euryptera Wierzejski, Keratella quadrata (Müller) and Brachionus angularis Gosse. Large-sized predatory Asplanchna priodonta Gosse was a dominant species in autumn at most sites, accounting for 28–81% of the total biomass. Among cladocerans, medium-sized Daphnia cucullata G.O. Sars, D. galeata G.O. Sars, Bosmina coregoni coregoni (Baird), and Ceriodaphnia quadrangula (O.F. Müller) dominated. Copepods were mainly composed of Thermocyclops oithonoides (Sars G.O.) and Eudiaptomus graciloides (Lilljeborg) that co-dominated, as well as Macrocyclops albidus (Jurine) and Mesocyclops leuckarti (Claus).

3.6. Relationships between Biotic and Abiotic Parameters

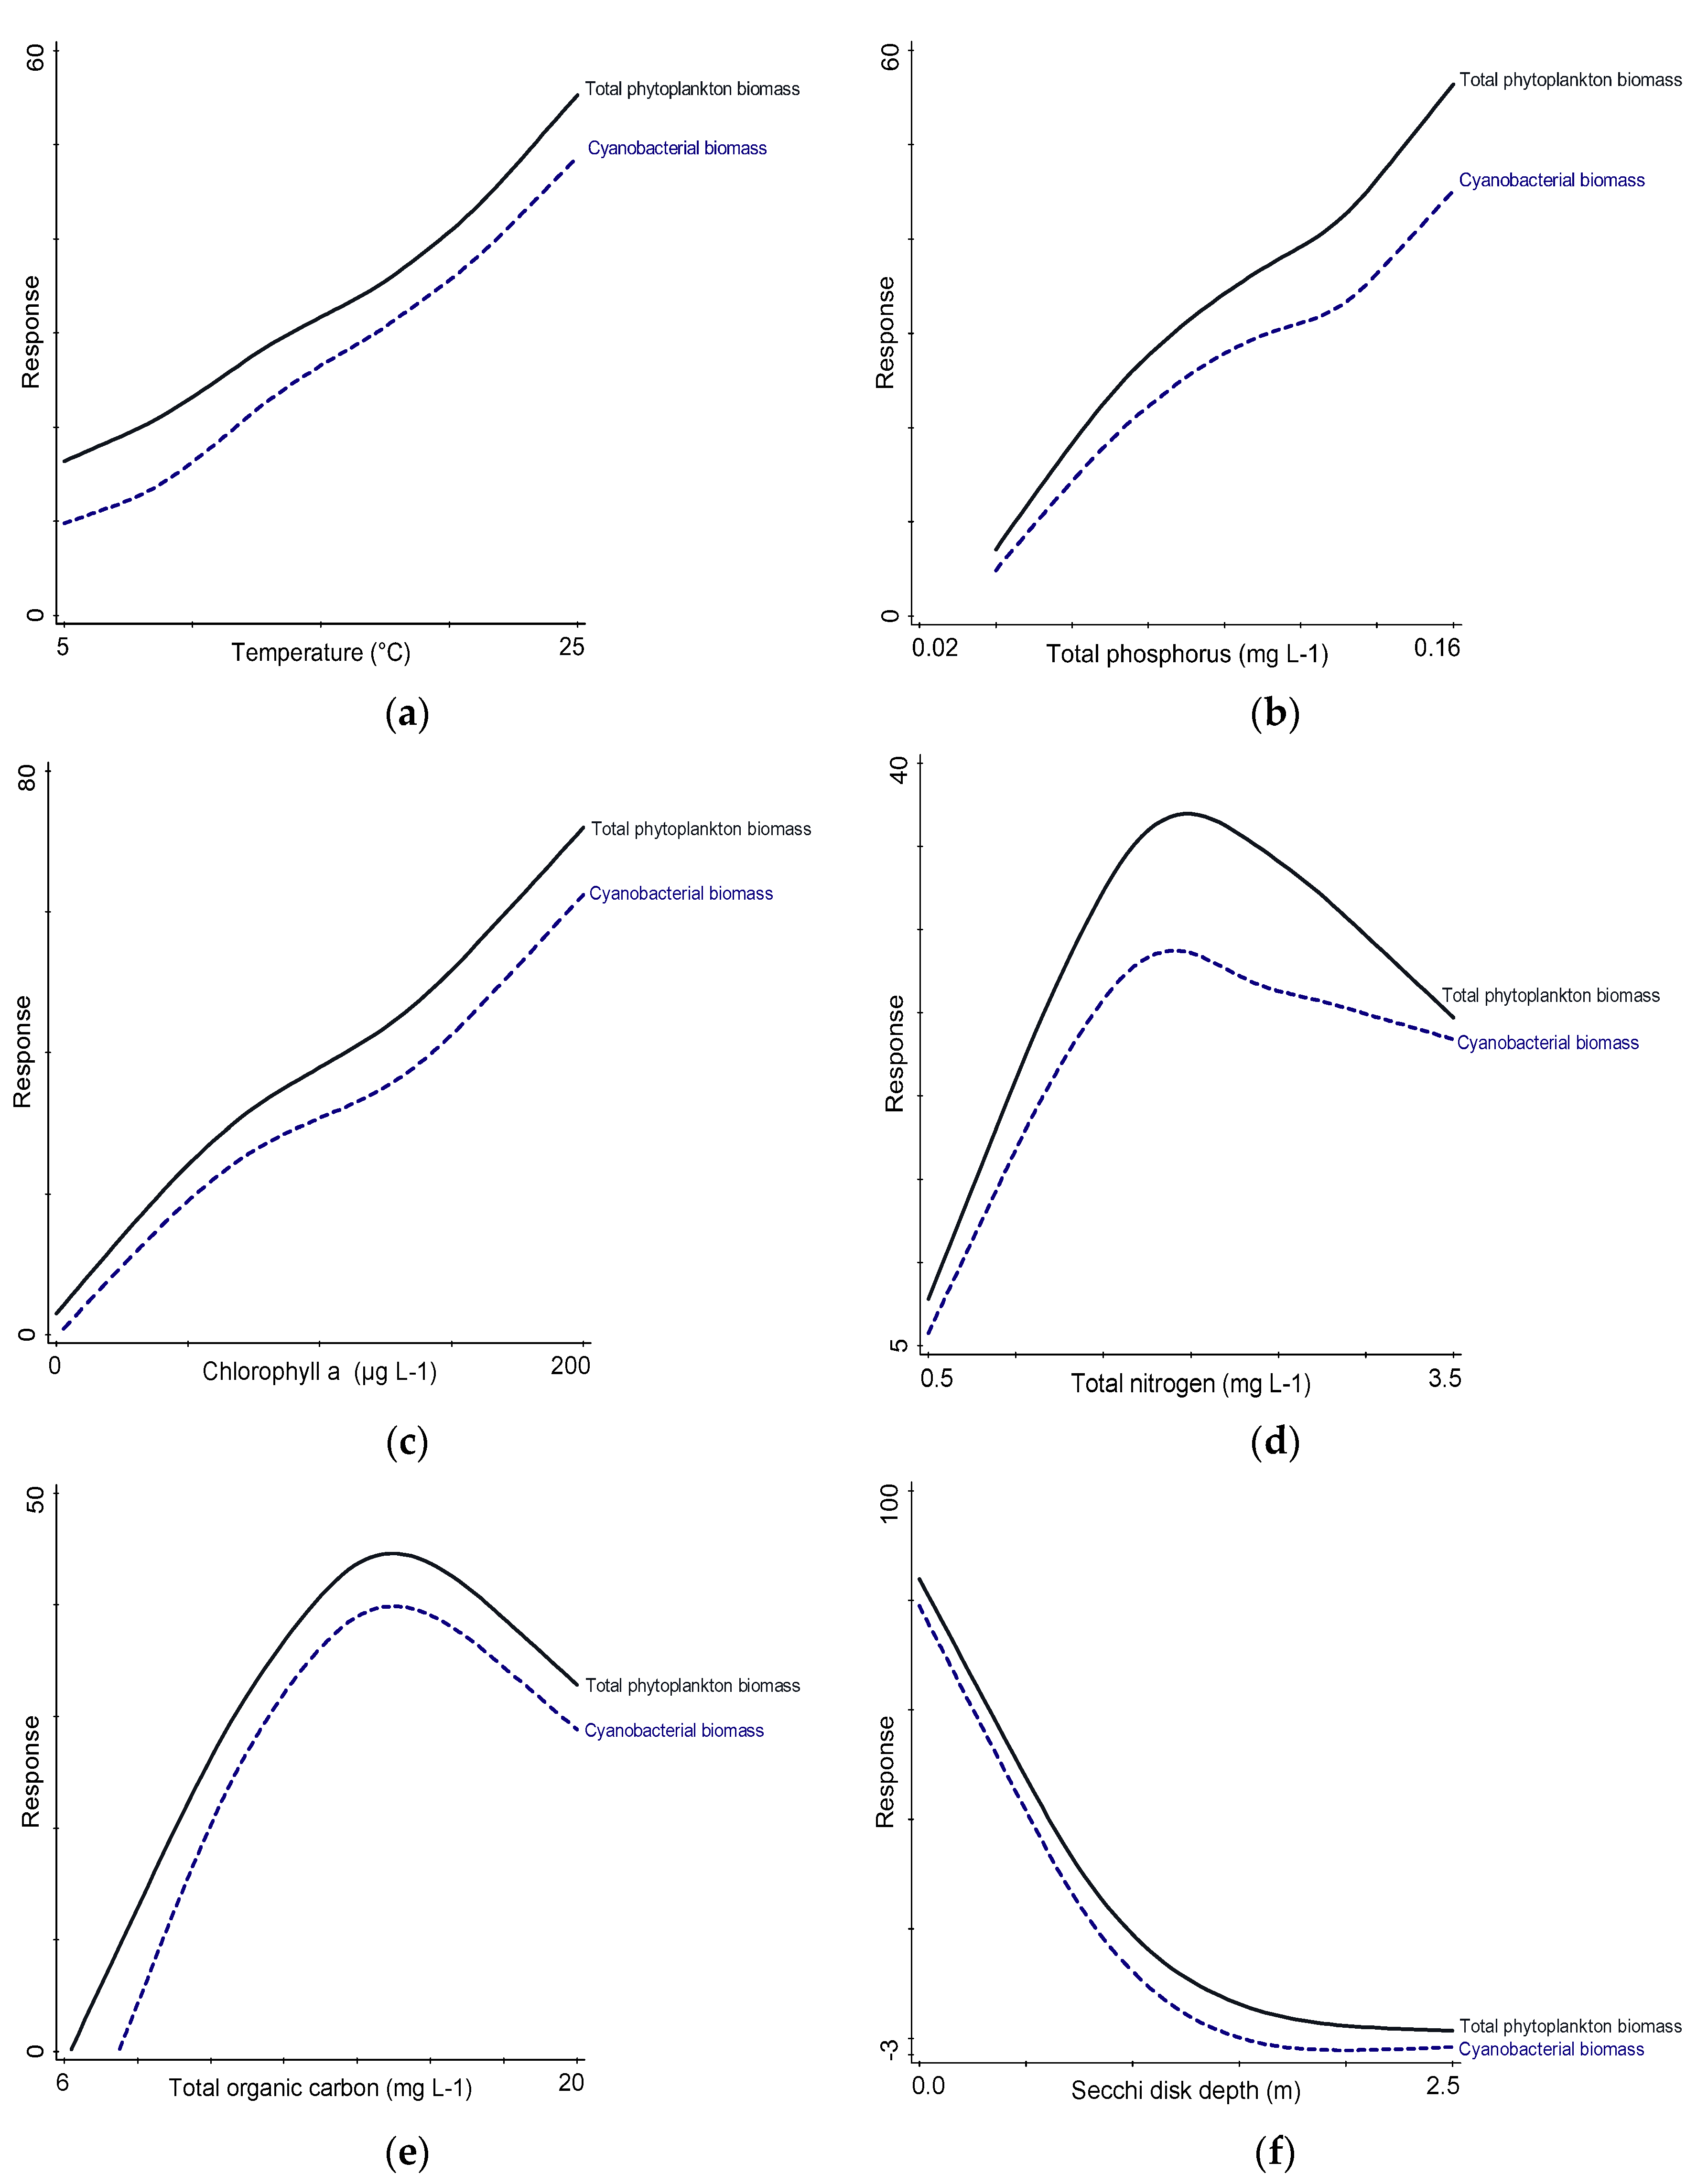
Based on GAMs, the total phytoplankton biomass as well as cyanobacterial biomass showed a similar response to environmental parameters (Figure 7, Table 2). They were positively related to temperature (Figure 7a), TP (Figure 7b), and Chl-a (Figure 7c). A rapid increase in biomass was observed at TN concentrations up to 2 mg L−1, while a gradual decrease was seen at higher concentrations (Figure 7d). A similar tendency was recorded for total organic carbon (Figure 7e). The negative relationships were found between phytoplankton biomass and water transparency (Figure 7f).
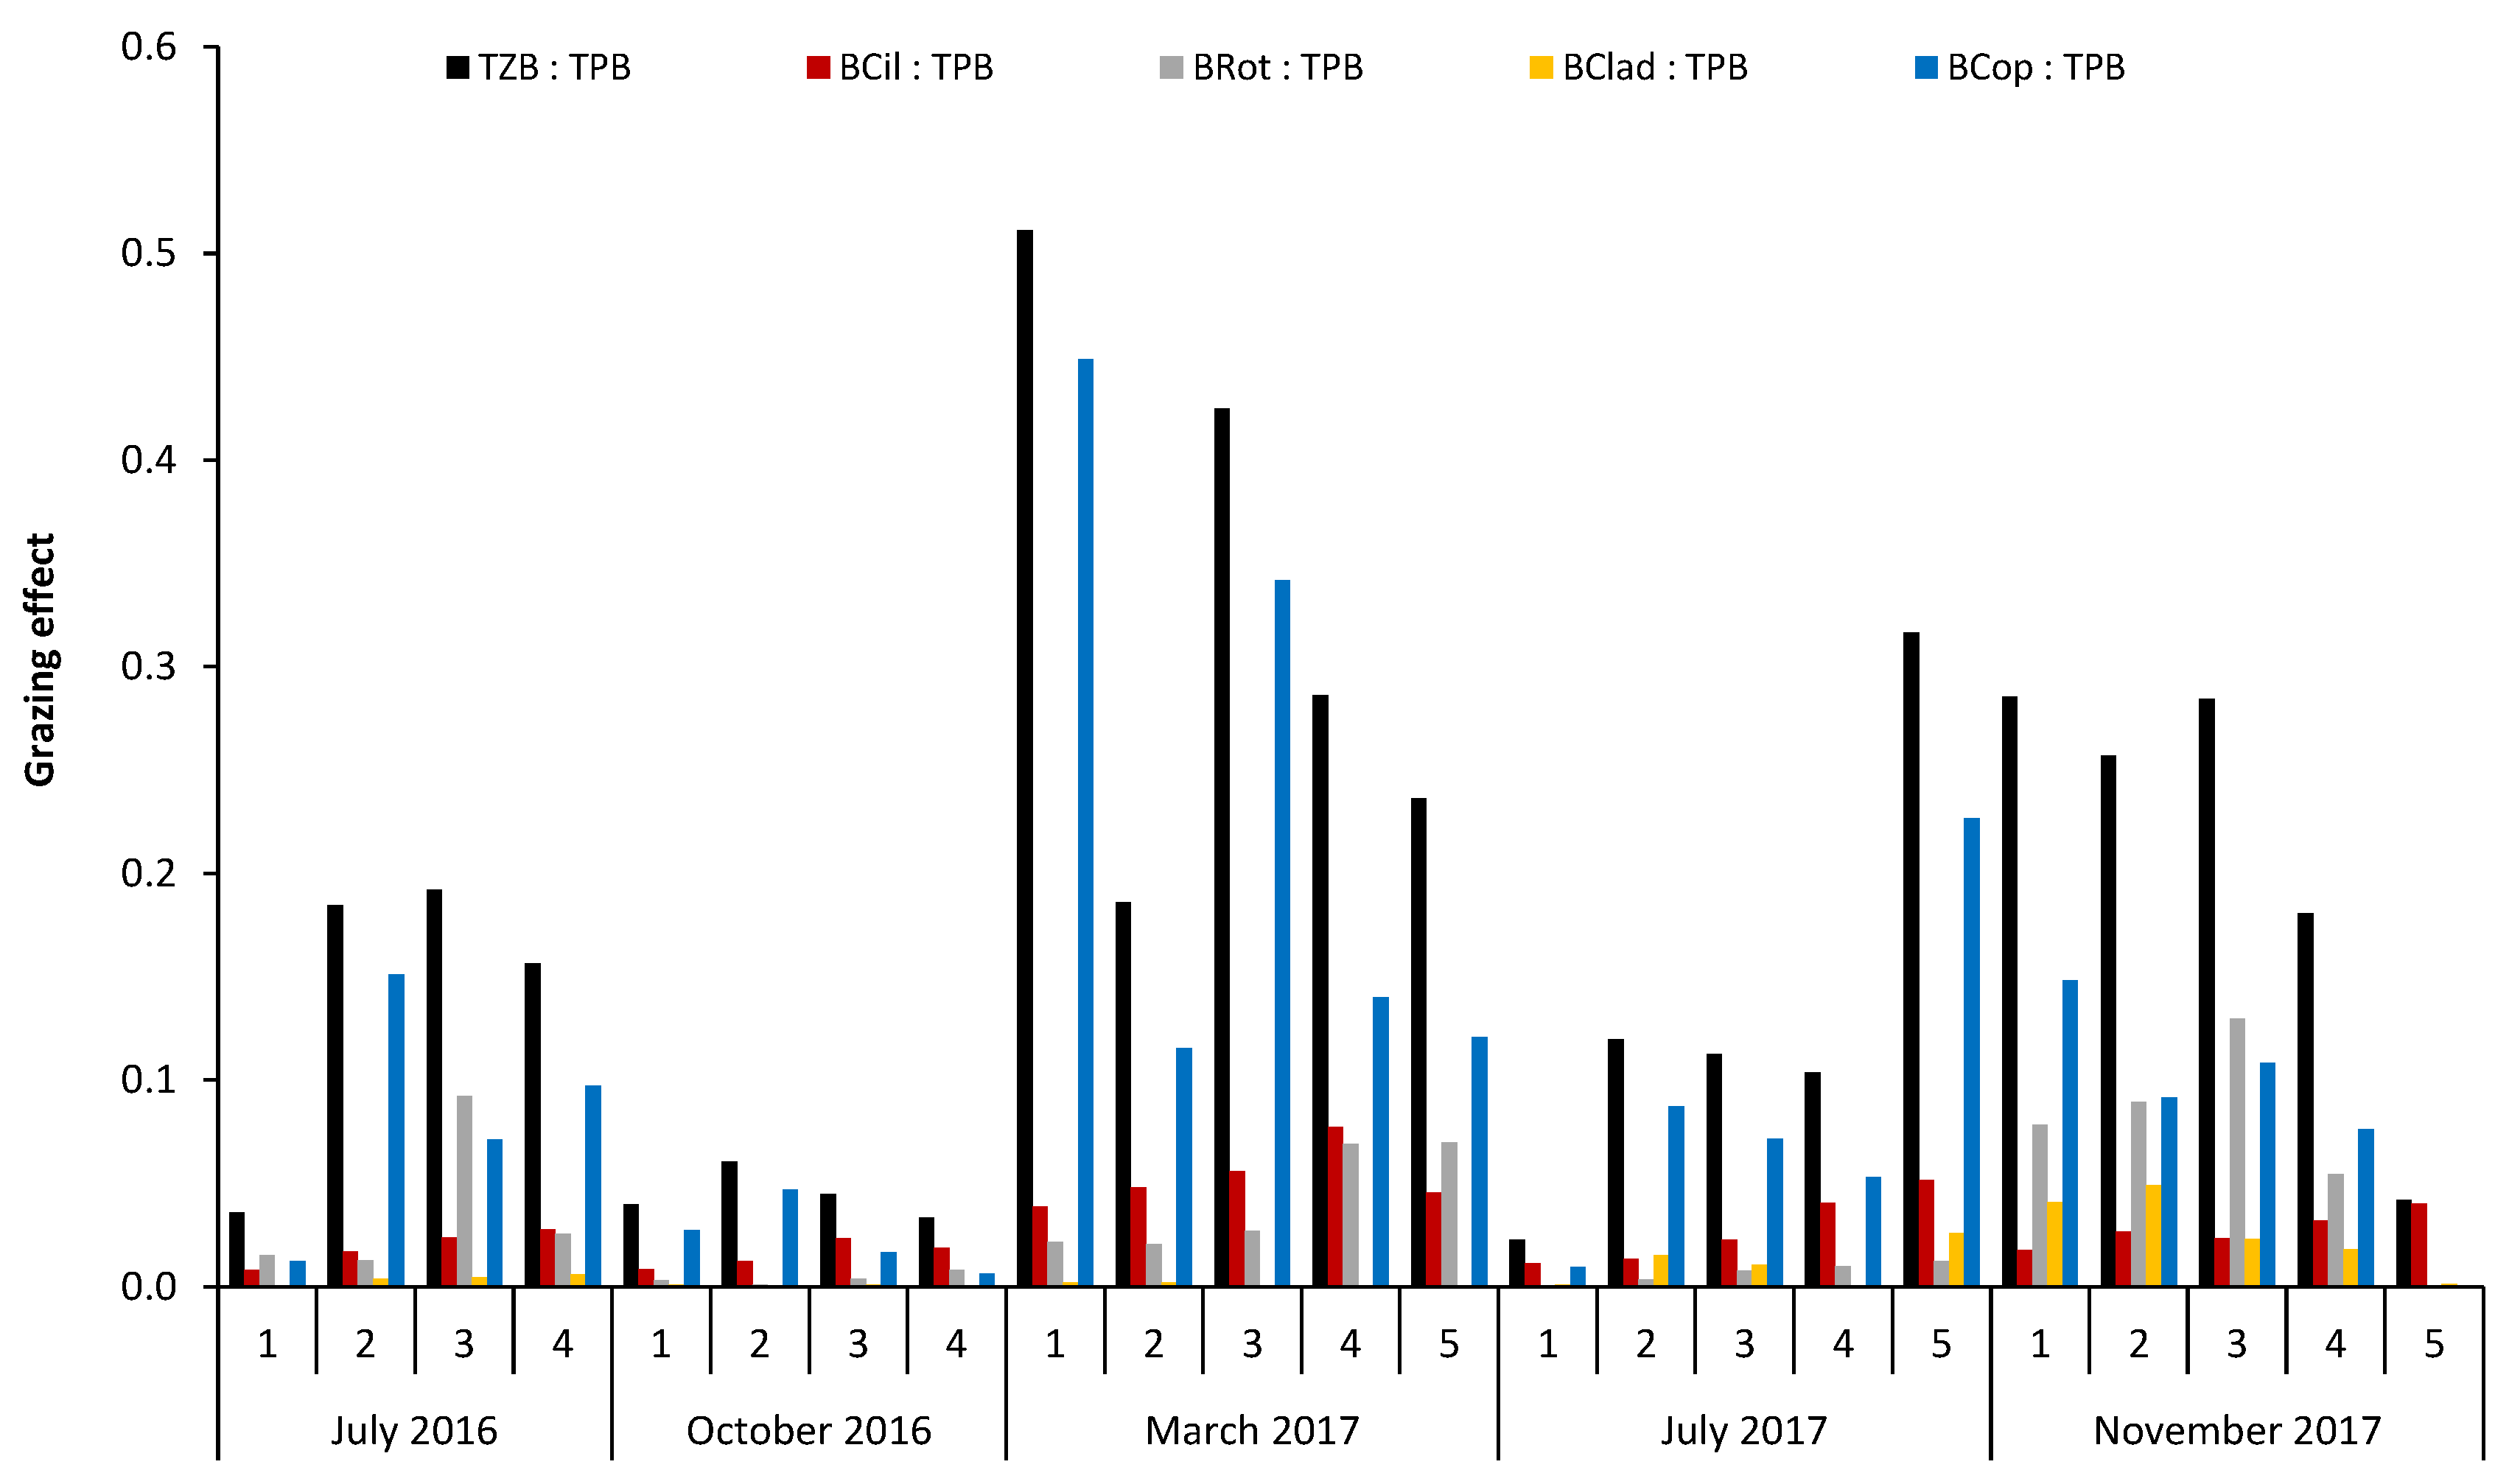
The highest zooplankton grazing effect on phytoplankton was observed in March when relative cyanobacterial biomass was ca. 2–10% (Figure 8). In this month, the zooplankton:phytoplankton biomass ratios including also individual zooplankton groups were 0.329, 0.053, 0.042, 0.001, and 0.233 on average for TZB:TPB, BCil:TPB, BRot:TPB, BClad:TPB, and BCop:TPB, respectively. The grazing effect was markedly lower when the relative biomass of cyanobacteria was higher (approximately 86%) in other months. In a temporal scale, the decreasing tendency of grazing effect was recorded as follows: March > November > July > October. The exceptionally low biomass of zooplankton was recorded in October 2016 when the biomass of cyanobacteria-dominated phytoplankton was very high. The main role in grazing effect played primarily copepods. In a spatial scale, the tendency to a higher grazing effect was noted in the area far from the island with a maximum at the furthest site 5 located in Lake Śniardwy.
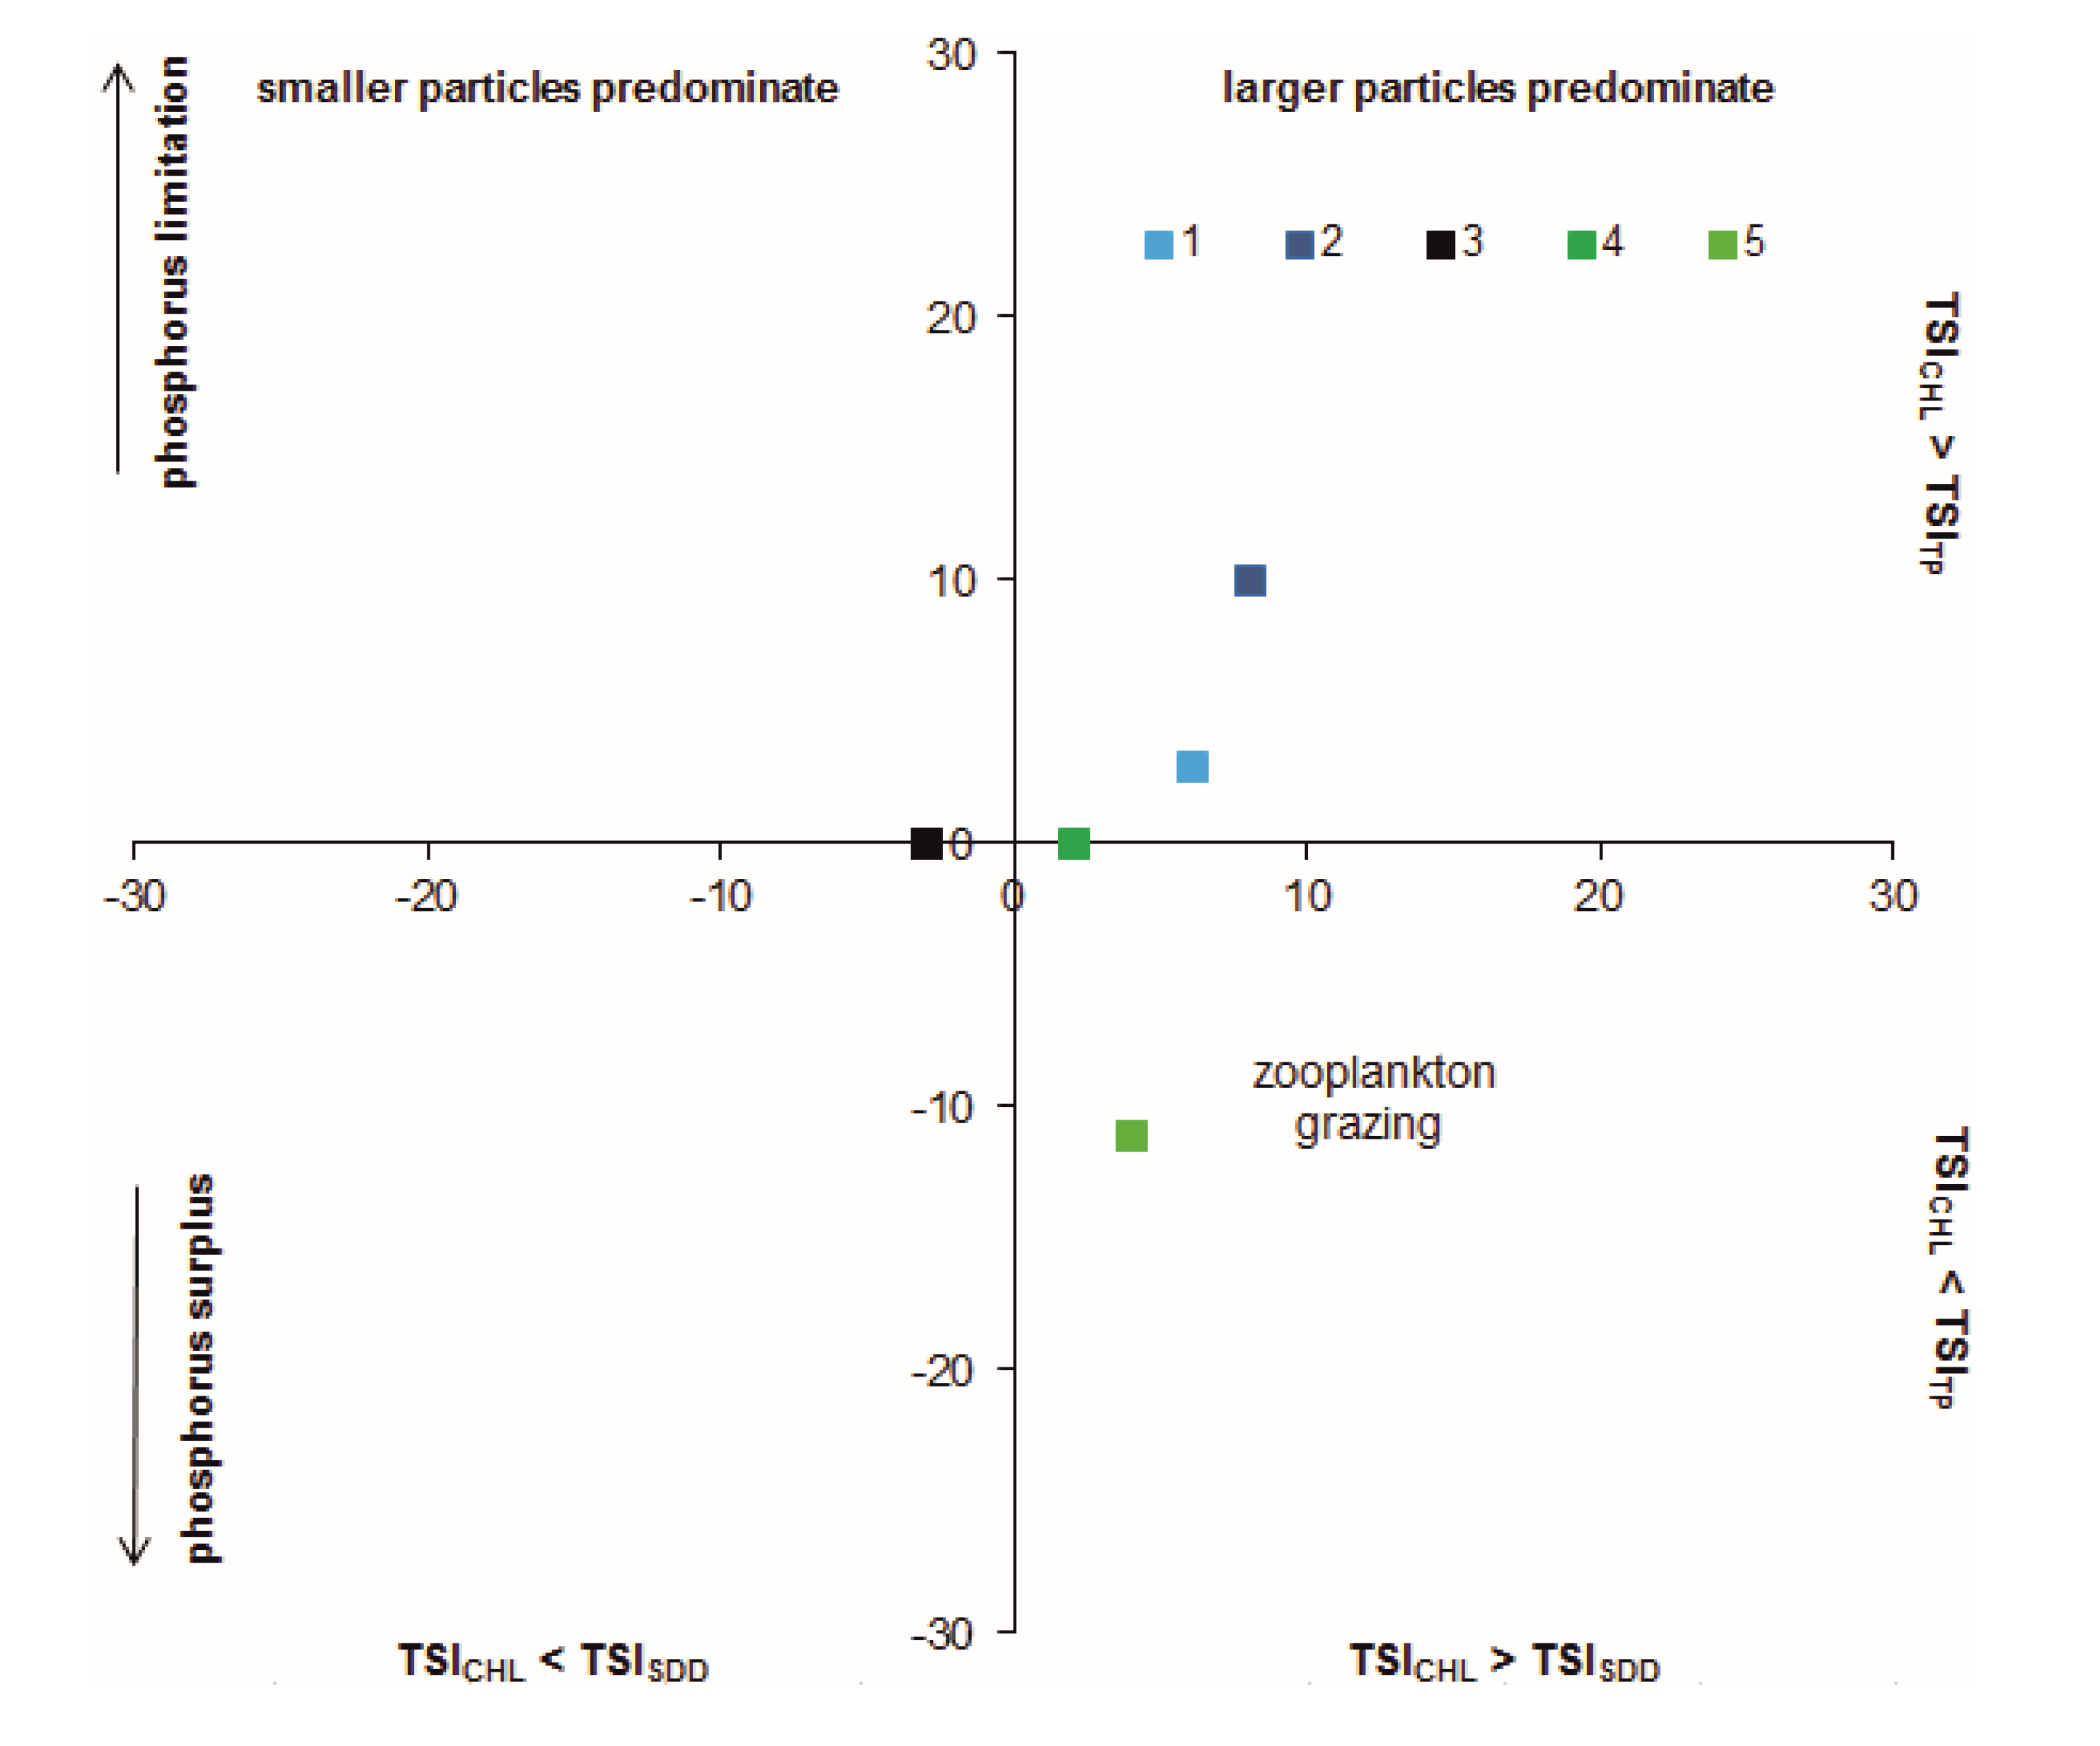
The mutual relations between partial indices of the trophic states confirmed that zooplankton grazing played a major role at site 5 (Figure 9). The values of TSICHL were higher than TSISDD except for site 3. In contrast, the TSICHL and TSITP relations changed along the increasing distance, and the values of TSICHL were higher, equal or lower than values of TSITP at sites 1–2, 3–4 and 5, respectively.

4. Discussion

Lake Warnołty is an example of water bodies being under limited human activities and legal protection (nature reserve) of the breeding and hunting sites for a lot of wetland birds including cormorants, which are the top piscivorous predators. Recently, the pressure of cormorants (inhabiting the Warnowska island) on this lake and neighboring Lake Śniardwy has become much stronger compared to 2005 [25]. Our studies confirmed that the highest content of nutrients (primarily phosphorus) and chlorophyll a simultaneously with the lowest water transparency were observed in the area closely related to that island. The trophic state index calculated for each sampling site indicated, thus, the hypertrophic conditions close to cormorant’s island in Lake Warnołty. The highest trophic state recorded close to the island suggests that cormorants may play a major role in the worsening of water quality. Such a negative role (direct or indirect) of cormorants confirmed also the studies carried out in the case of a smaller colony in the north-western Poland by Klimaszyk and Rzymski [20], Klimaszyk et al. [21,22]. The elevated nutrient concentrations were found in the littoral (at edge of the cormorant colony) compared to a considerably smaller amount in the pelagic zone. The maximal differences of twenty-fold and three-fold were recorded in the TP content and mineral nitrogen content, respectively [21].
Hypertrophic (TSI 72) conditions of Lake Warnołty were gradually mitigated along the increasing distance from the island towards eutrophic at sites 4 (TSI 60) and 5 (TSI 58). The values of the TN/TP ratio significantly increased from 17 to 27 suggesting the increase of P-limiting conditions [48,49]. Site 4, with abundant submerged and emergent vegetation was located near the outflow from Lake Warnołty in the area called a “buffer zone” which, in turn, played a major role in limiting bloom spreading along the lake-to-lake continuum. This effect was visible in chemical and biological parameters recorded at site 5, i.e., in Lake Śniardwy. Furthermore, the important role of zooplankton in phytoplankton inhibition, manifested in relations TSITP to TSICHL, i.e., excess phosphorus relative to the predicted phytoplankton biomass [47], and a high zooplankton grazing effect was confirmed for site 5.
The cormorant’s effect on primary producers was also clearly mitigated along the increasing distance from the island. Thus, the tendency to decrease in biomass the total phytoplankton and cyanobacteria was recorded. Their biomass maxima (of ca. 75 mg L−1 and 66 mg L−1, respectively) were recorded close to the island. This may suggest that cormorant-related hypertrophic conditions can participate in forming a site-specific habitat for primary producers. On the other hand, this water area was under the lowest grazing effect of zooplankton on phytoplankton expressed by their biomass ratio close to 0, especially in the warmer months. At this time, the filamentous cyanobacteria, primarily non-N2 fixing of the genera Planktothrix, Pseudanabaena, Planktolyngbya and Limnothrix dominated the phytoplankton. The tendency to form large colonies e.g., filaments cause some cyanobacteria species to be less edible or even inedible by zooplankton, thus, they may disturb the proper functioning of aquatic food webs [50]. Similar biomass and structure of cyanobacteria were recorded in one of the most degraded urban lakes in Poland [51,52], being under high human impact. Filamentous cyanobacteria usually have some adverse effects on zooplankton, primarily leading to reducing the growth rate of the population and clogging the filtering apparatus [53,54,55,56], changing the zooplankton functional diversity [57] or just being a low quality and toxic food [58,59,60]. Among zooplankton, the most abundant were primarily small-sized rotifers (Filinia longiseta, Keratella cochlearis f. tecta and Polyarthra euryptera) and medium-sized cladocerans (primarily Daphnia cucullata) and copepods (Thermocyclops oithonoides, Eudiaptomus graciloides), which are not effective in limiting the growth of filamentous cyanobacteria [61]. The other findings suggest that zooplankton are even able to indirect stimulate the cyanobacterial growth, e.g., by elimination of more edible phytoplankton or by resupply of nutrients, e.g., [62,63,64,65]. The growth rates of most herbivorous rotifers and other zooplankters are usually proportional to the quantity of phytoplankton [66]. The zooplankton-cyanobacteria and/or cyanobacteria-zooplankton relationships differ in various ecosystems, and in the case of larger-sized zooplankton they may be positive [67] or negative [57]. Considering the small-sized protozoan ciliates (e.g., algivorous Rimostrombidium humile, omnivorous Mesodinium pulex, bacterivorous Halteria grandinella), their effect on cyanobacteria is not so obvious [68]. Considering the smallest-sized heterotrophic nanoflagellates (HNF), their positive impacts can be confirmed for both single-celled and colonial picocyanobacteria with 0.2–2.0 μm size because they usually participate in the nutrient regeneration as it was previously found [69]. On the other hand, HNF can also negatively affect the smallest-sized cyanobacteria by grazing. In our studies, colonial picocyanobacteria of the genera Aphanocapsa, Aphanothece or Anathece never dominated in phytoplankton. Furthermore, all zooplanktonic organisms are very important due to their different roles played in controlling such easily edible cyanobacteria [69].
The dynamics, accumulation and distribution of cyanobacterial blooms are controlled by many factors, including wind strength, which leads to their uneven horizontal distribution. It is documented that phytoplankton biomass and composition in a shallow lake is influenced by wind [70]. It is also commonly believed that zooplankton may also be spread by the wind over a great distance. In shallow lakes, wind-driven sediment resuspension is a common feature. Low speed wind is favorable for cyanobacteria [71]. Winds in the vicinity of the studied Lake Warnołty drift the blooms towards Lake Śniardwy (personal observations during sampling occasions consistent with the generally prevailing wind direction in this region of Poland).
All dominant phyto- and zooplankton species are well-known indicators of highly eutrophicated waters. Globally, an establishment of protected aquatic areas (e.g., protecting the breeding sites for a lot of wetland birds and hunting sites for carnivorous birds such as cormorants) should positively contribute to species protection. In fact, such protection and uncontrolled increase of waterbirds become more often the real threat to water quality and unexpected nutrient-related changes in the functioning of an aquatic ecosystem like in the studied lake. The governments of numerous countries have decided to protect the great cormorant, according to the Birds Directive. Despite the strict protection, it is well documented that the great cormorants have a complex negative impact on aquatic ecosystems. They can increase the concentrations of nitrogen, phosphorus, dissolved organic carbon, and electrical conductivity, while reducing water transparency. Cormorants cause local or global changes in species structure towards more eutrophic species of algae and macrophytes, which lead to microbial pollution [72], and in abundance, species composition, and size-age structure of fish communities [25], which in turn may have a significant impact on the lower trophic levels.
Furthermore, global warming, elevated trophic state, and decreased density of large-sized grazers [73] exert a strong influence on cyanobacteria-dominated phytoplankton. A general trend of a successive increase in the average annual air temperature in the same region [74] as the studied lake showed that the average annual temperature, after 2000 compared to the 46-year (1953–1999) mean temperature, was always higher and the annual deviations have reached to 2.2 °C up to date. In our study, the average water temperature was 21.2 °C and 14.0 °C in July and October 2016, respectively, and 7.8 °C, 18.2 °C and 6.6 °C in March, July and November 2017, respectively. This suggests that temperature conditions in the vicinity of Lake Warnołty can be favorable to form persistent cyanobacterial blooms, also in a longer time period or even the year-round, about which we still know little. Furthermore, it is highly possible that cormorants in Lake Warnoły and the other Polish lakes [20,21,22,23] similar to pelicans in Greek Lake Lesser Prespa [75] may contribute to guanotrophication and locally lead to the occurrence of harmful blooms. Future research towards the monitoring of the cormorant impact on water quality, including persistence and intensity of harmful cyanobacteria, should be continued.

5. Conclusions

The results of a 2-year study confirmed that a large area of lake waters was subjected to quite an intensive impact of great cormorants. In fact, it is almost the whole lake, because their impact was noticeable even up to 1.6 kilometers from the island (site 3), except for site 4, which can be treated as a buffer zone at the water outflow from Lake Warnołty to Lake Śniardwy. It was manifested in the relatively high chlorophyll a content (up to 180 µg L−1) and intense phytoplankton blooms (up to 75 mg L−1), with simultaneous quite high ciliate and copepod biomass and very low water transparency. Filamentous cyanobacteria (Pseudanabaena limnetica, Planktolyngbya limnetica, Limnothrix redekei and Planktothrix agardhii) were the main phytoplankton components at most sampling sites in Lake Warnołty during the summer and autumn periods. The most intensive blooms of cyanobacteria (up to 66 mg L−1) were always recorded at the site located near the cormorant roosting colony. Copepods (Thermocyclops oithonoides, Eudiaptomus graciloides) played the main role in the controlling phytoplankton biomass. The concentrations of nutrients (mainly phosphorus) and chlorophyll a; the values of TSI and its partial indices; as well as the biomass of phytoplankton (including cyanobacteria), protozooplankton and metazooplankton decreased gradually along the increasing distance from the island. In contrast, the water transparency and zooplankton grazing effect and the values of TN/TP ratio (from 17 to 27) significantly increased. However, all the dominant phytoplankton and zooplankton species were typical of highly eutrophic waters.
This all suggests that cormorants might have a significant impact on the deterioration of water quality and can contribute to faster water eutrophication. Thus, the protection of breeding sites for many waterbirds becomes a real threat for the functioning of aquatic ecosystems because of unexpectedly high load of nutrients supplied by birds, mainly great cormorants.

Author Contributions

Conceptualization: A.N.-K., K.K., E.B.-K., K.S. and P.T.; field work: K.K. and P.T.; formal analysis: A.N.-K., K.K., E.B.-K., K.S. and P.T.; writing and editing original draft preparation: A.N.-K. All co-authors, have read and helped with the interpretation of the results, provided critical feedback. All authors have read and agreed to the published version of the manuscript.

Funding

This research was financed through Inland Fisheries Institute in Olsztyn within its statutory research activity (topic no. S-009 and S-011).

Acknowledgments

We are grateful to Joanna Hutorowicz, Jakub Pyka, and Stanisław Sidorski for chemical analyses.

Conflicts of Interest

The authors declare no conflict of interest.

References

  1. Huisman, J.; Codd, G.A.; Paerl, H.W.; Ibelings, B.W.; Verspagen, J.M.H.; Visser, P.M. Cyanobacterial blooms. Nature 2018, 16, 471–483. [Google Scholar] [CrossRef] [PubMed]
  2. Monchamp, M.E.; Spaak, P.; Domaizon, I.; Dubois, N.; Bouffard, D.; Pomati, F. Homogenization of lake cyanobacterial communities over a century of climate change and eutrophication. Nat. Ecol. Evol. 2018, 2, 317–324. [Google Scholar] [CrossRef] [PubMed] [Green Version]
  3. Wilk-Woźniak, E. An introduction to the ‘micronet’ of cyanobacterial harmful algal blooms (CyanoHABs): Cyanobacteria, zooplankton and microorganisms: A review. Mar. Freshw. Res. 2019. [Google Scholar] [CrossRef]
  4. Yan, D.; Xu, H.; Yang, M.; Lan, J.; Hou, W.; Wang, F.; Zhang, J.; Zhou, K.; An, Z.; Goldsmith, Y. Responses of cyanobacteria to climate and human activities at Lake Chenghai over the past 100 years. Ecol. Ind. 2019, 104, 755–763. [Google Scholar] [CrossRef]
  5. Jeppesen, E.; Canfield, D.E.; Bachmann, R.W.; Søndergaard, M.; Havens, K.E.; Johansson, L.S.; Lauridsen, T.L.; Sh, T.; Rutter, R.P.; Warren, G.; et al. Toward predicting climate change effects on lakes: A comparison of 1656 shallow lakes from Florida and Denmark reveals substantial differences in nutrient dynamics, metabolism, trophic structure, and top-down control. Inland Waters 2020. [Google Scholar] [CrossRef]
  6. Godlewska, M.; Izydorczyk, K.; Kaczkowski, Z.; Jóźwik, A.; Długoszewski, B.; Ye, S.; Lian, Y.; Guillard, J. Do Fish and blue-green algae blooms coexist in space and time? Fish. Res. 2016, 173, 93–100. [Google Scholar] [CrossRef]
  7. Godlewska, M.; Balk, H.; Kaczkowski, Z.; Jurczak, T.; Izydorczyk, K.; Długoszewski, B.; Jaskulska, A.; Gągała-Borowska, I.; Mankiewicz-Boczek, J. Night fish avoidance of Microcystis bloom revealed by simultaneous hydroacoustic measurements of both organisms. Fish. Res. 2018, 207, 74–84. [Google Scholar] [CrossRef] [Green Version]
  8. Krztoń, W.; Kosiba, J.; Pociecha, A.; Wilk-Woźniak, E. The effect of cyanobacterial blooms on bio- and functional diversity of zooplankton communities. Biodivers. Conserv. 2019, 28, 1815–1835. [Google Scholar] [CrossRef] [Green Version]
  9. Budzyńska, A.; Rosińska, J.; Pełechata, A.; Toporowska, M.; Napiórkowska-Krzebietke, A.; Kozak, A.; Messyasz, B.; Pęczuła, W.; Kokociński, M.; Szeląg-Wasielewska, E.; et al. Environmental factors driving the occurrence of the invasive cyanobacterium Sphaerospermopsis aphanizomenoides (Nostocales) in temperate lakes. Sci. Total Environ. 2019, 650, 1338–1347. [Google Scholar] [CrossRef]
  10. Paerl, H.W.; Paul, V.J. Climate change: Links to global expansion of harmful cyanobacteria. Water Res. 2012, 46, 1349–1363. [Google Scholar] [CrossRef]
  11. Paerl, H.W.; Hall, N.S.; Calandrino, E.S. Controlling harmful cyanobacterial blooms in a world experiencing anthropogenic and climatic-induced change. Sci. Total Environ. 2011, 40, 1739–1745. [Google Scholar] [CrossRef] [PubMed]
  12. Ibelings, B.; Havens, K. Cyanobacterial toxins: A qualitative meta-analysis of concentrations, dosage and effects in freshwater, estuarine and marine biota. Adv. Exp. Med. Biol. 2008, 619, 675–732. [Google Scholar] [PubMed]
  13. Meriluoto, J.; Blaha, L.; Bojadzija, G.; Bormans, M.; Brient, L.; Codd, G.A.; Drobac, D.; Faassen, E.J.; Fastner, J.; Hiskia, A.; et al. Toxic cyanobacteria and cyanotoxins in European waters—Recent progress achieved through the CYANOCOST Action and challenges for further research. Adv. Oceanogr. Limnol. 2017, 8, 161–178. [Google Scholar] [CrossRef] [Green Version]
  14. Kobos, J.; Błaszczyk, A.; Hohlfeld, N.; Toruńska-Sitarz, A.; Krakowiak, A.; Hebel, A.; Stryk, K.; Grabowska, M.; Toporowska, M.; Kokociński, M.; et al. Cyanobacteria and cyanotoxins in Polish freshwater bodies. Oceanol. Hydrobiol. Stud. 2013, 42, 358–378. [Google Scholar] [CrossRef] [Green Version]
  15. Mantzouki, E.; Lürling, M.; Fastner, J.; de Senerpont Domis, L.; Wilk-Woźniak, E.; Koreivienė, J.; Seelen, L.; Teurlincx, S.; Verstijnen, Y.; Krztoń, W.; et al. Temperature Effects Explain Continental Scale Distribution of Cyanobacterial Toxins. Toxins 2018, 10, 156. [Google Scholar] [CrossRef] [PubMed] [Green Version]
  16. Dziga, D.; Maksylewicz, A.; Maroszek, M.; Budzynska, A.; Kozak, A.; Rosinska, J.; Napiorkowska-Krzebietke, A.; Toporowska, M.; Grabowska, M.; Meriluoto, J. The biodegradation of microcystins in temperate freshwater bodies with previous cyanobacterial history. Ecotoxicol. Environ. Saf. 2017, 145, 420–430. [Google Scholar] [CrossRef]
  17. Krevš, A.; Koreivienė, J.; Mažeikaitė, S. Plankton food web structure during cyanobacteria bloom in the highly eutrophic Lake Gineitiškės. Ekologija 2010, 56, 47–54. [Google Scholar] [CrossRef]
  18. Van Eerden, M.; van Rijn, S.; Volponi, S.; Paquet, J.Y.; Carss, D.N. Cormorants and the European Environment: Exploring Cormorant Status and Distribution on a Continental Scale; INTERCAFE COST Action 635 Final Report I; NERC/Centre for Ecology & Hydrology on behalf of COST: Lancaster, UK, 2012; Available online: http://www.intercafeproject.net (accessed on 15 January 2020).
  19. Grémillet, D.; Nazirides, T.; Nikolaou, H.; Crivelli, A.J. Fish are not safe from great cormorants in turbid water. Aquat. Biol. 2012, 15, 187–194. [Google Scholar] [CrossRef]
  20. Klimaszyk, P.; Rzymski, P. Impact of cormorant (Phalacrocorax carbo sinensis L.) colonies on microbial pollution in lakes. Limnol. Rev. 2013, 13, 139–145. [Google Scholar] [CrossRef] [Green Version]
  21. Klimaszyk, P.; Joniak, T.; Rzymski, P. Roosting colony of cormorants (Phalacrocorax carbo sinensis L.) as a source of nutrients for the lake. Limnol. Rev. 2014, 14, 111–119. [Google Scholar]
  22. Klimaszyk, P.; Piotrowicz, R.; Rzymski, P. Changes in physico-chemical conditions and macrophyte abundance in a shallow soft-water lake mediated by a Great Cormorant roosting colony. J. Limnol. 2015, 74, 114–122. [Google Scholar] [CrossRef]
  23. Gwiazda, R.; Jarocha, K.; Szarek-Gwiazda, E. Impact of a small cormorant (Phalacrocorax carbo sinensis) roost on nutrients and phytoplankton assemblages in the littoral regions of a submontane reservoir. Biologia 2010, 65, 742–748. [Google Scholar] [CrossRef]
  24. Gagnon, K.; Yli-Rosti, J.; Jormalainen, V. Cormorant-induced shifts in littoral communities. Mar. Ecol. Prog. Ser. 2015, 541, 15–30. [Google Scholar] [CrossRef] [Green Version]
  25. Traczuk, P.; Kapusta, A. Great cormorant (Phalacrocorax carbo) predation on pikeperch (Sander lucioperca L.) in shallow eutrophic lakes in Poland. Arch. Pol. Fish 2017, 25, 123–130. [Google Scholar] [CrossRef] [Green Version]
  26. Krzywosz, T.; Traczuk, P. Impact of the great cormorant in lakes in the Masurian region. In Sustainable Exploitation of Fishery Resources in Light of Their Status in 2009; Mickiewicz, M., Ed.; Wyd. IRS: Olsztyn, Poland, 2010; pp. 133–142. [Google Scholar]
  27. Traczuk, P.; Chybowski, Ł.; Ulikowski, D.; Kapusta, A. The great cormorant (Phalococorax carbo) in northeastern Poland—A summary of a decade of research. In Commercial and Recreational Fisheries in 2015; Mickiewicz, M., Wołos, A., Eds.; Wyd. IRS: Olsztyn, Poland, 2016; pp. 89–102. [Google Scholar]
  28. Utermöhl, H. Guidance on the quantitative analysis of phytoplankton—Methods. Mitt. Int. Ver. Theor. Angew. Limnol. 1958, 9, 1–38. (In German) [Google Scholar]
  29. Napiórkowska-Krzebietke, A.; Kobos, J. Assessment of the cell biovolume of phytoplankton widespread in coastal and inland water bodies. Water Res. 2016, 104, 532–546. [Google Scholar] [CrossRef]
  30. Huber-Pestalozzi, G. Das phytoplankton des Süβwassers. Systematik und Biologie. 7 Teil, 1 Häfte: Chlorophyceae (Grünalgen) Ordnung Chlorococcales. In Die Binnengewässer Einzeldarstellungen aus der Limnologie und Ihren Nachbargebieten; Thienemann, A., Ed.; E. Schweizerbart’sche Verlasbuchhandlung: Stuttgart, Germany, 1983; pp. 1–1044. [Google Scholar]
  31. Krammer, K.; Lange-Bertalot, H. Bacillariophyceae 1. Teil: Naviculaceae. In Süβwasserflora von Mitteleuropa; Pascher, A., Ed.; VEB Gustaw Fischer Verlag: Jena, Germany, 1986; pp. 1–876. [Google Scholar]
  32. Krammer, K.; Lange-Bertalot, H. Bacillariophyceae 2. Teil: Epithemiaceae, Surirellaceae. In Süβwasserflora von Mitteleuropa; Pascher, A., Ed.; Gustaw Fischer Verlag: Stuttgart, Germany; New York, NY, USA, 1988; pp. 1–596. [Google Scholar]
  33. Krammer, K.; Lange-Bertalot, H. Bacillariophyceae 3. Teil: Centrales, Fragilariaceae, Eunotiaceae. In Süβwasserflora von Mitteleuropa; Pascher, A., Ed.; Gustaw Fischer Verlag: Stuttgart, Germany; Jena, Germany, 1991; pp. 1–576. [Google Scholar]
  34. Komárek, J.; Anagnostidis, K. Cyanoprokaryota 2. Teil: Oscillatoriales. In Süβwasserflora von Mitteleuropa; Pascher, A., Ed.; Gustaw Fischer Verlag: Stuttgart, Germany; Jena, Germany, 2005; pp. 1–759. [Google Scholar]
  35. Guiry, M.D.; Guiry, G.M. AlgaeBase; World-Wide Electronic Publication, National University of Ireland: Galway, Ireland, 2008; Available online: http://www.algaebase.org (accessed on 4 March 2020).
  36. Porter, K.G.; Feig, Y.S. The use of DAPI for identifying and counting aquatic microflora. Limnol. Oceanogr. 1980, 25, 943–948. [Google Scholar] [CrossRef]
  37. Foissner, W.; Berger, H.; Schaumburg, J. Identification and Ecology of Limnetic Plankton Ciliates; Informationberichte des Bayer Landesamtes für Wasserwirtschaft: München, Germany, 1999; pp. 1–793. [Google Scholar]
  38. Flössner, D. Krebstiere (Crustacea), Kiemen- und Blattfüßer (Branchiopoda), Fischläuse (Branchiura); VEB Gustav Fischer Verlag: Jena, Germany, 1972. [Google Scholar]
  39. Radwan, S.; Bielańska-Grajner, I.; Ejsmont-Karabin, J. Część ogólna, Monogononta—Część systematyczna. 32.A. In Wrotki (Rotifera). Fauna Słodkowodna Polski. 32; Radwan, S., Ed.; Polskie Towarzystwo Hydrobiologiczne, Uniwersytet Łódzki, Oficyna Wydawnicza Tercja: Łódź, Poland, 2004; pp. 1–146. [Google Scholar]
  40. Rybak, J.I.; Błędzki, L.A. Widłonogi, Copepoda: Cyclopoida, Klucz do oznaczania; Biblioteka Monitoringu Środowiska: Warszawa, Poland, 2005. [Google Scholar]
  41. Ejsmont-Karabin, J. Empirical equations for biomass calculation of planktonic rotifers. Pol. Arch. Hydrob. 1998, 45, 513–522. [Google Scholar]
  42. Bottrell, H.H.; Duncan, A.; Gliwicz, Z.M.; Grygierek, E.; Herzig, A.; Hillbright, I.A.; Kurasawa, H.; Larsson, P.; Weglenska, T. A review of some problems in zooplankton production studies. Norw. J. Zool. 1976, 24, 419–456. [Google Scholar]
  43. APHA. Standard Methods for Examination of Water & Wastewater; American Public Health Association: New York, NY, USA, 1999.
  44. Carlson, R.E. A trophic state index for lakes. Limnol. Oceanogr. 1977, 22, 361–369. [Google Scholar] [CrossRef] [Green Version]
  45. Kratzer, C.R.; Brezonik, P.L. A Carlson type trophic state index for nitrogen in Florida lakes. Water Res. Bull. 1981, 17, 713–715. [Google Scholar] [CrossRef]
  46. Carlson, R.E.; Simpson, J. A Coordinator’s Guide to Volunteer Lake Monitoring Methods; North American Lake Management Society: Madison, WI, USA, 1996; pp. 1–96.
  47. Carlson, R.E.; Havens, K.E. Simple Graphical Methods for the Interpretation of Relationships between Trophic State Variables. Lake Reserv. Manag. 2005, 21, 107–118. [Google Scholar] [CrossRef]
  48. Sakamoto, M. Primary production by phytoplankton community in some Japanese lakes and its dependence on lake depth. Arch. Hydrobiol. 1966, 62, 1–28. [Google Scholar]
  49. Paerl, H.W.; Fulton, R.S.; Moisander, P.H.; Dyble, J. Harmful freshwater algal blooms, with an emphasis on cyanobacterial. Sci. World 2001, 1, 76–113. [Google Scholar] [CrossRef]
  50. Kozak, A.; Celewicz-Gołdyn, S.; Kuczyńska-Kippen, N. Cyanobacteria in small water bodies: The effect of habitat and catchment area conditions. Sci. Total Environ. 2019, 646, 1578–1587. [Google Scholar] [CrossRef] [PubMed]
  51. Napiórkowska-Krzebietke, A.; Dunalska, J. Phytoplankton-based recovery requirement for urban lakes in the implementation of the Water Framework Directive’s ecological targets. Oceanol. Hydrobiol. Stud. 2015, 44, 109–119. [Google Scholar] [CrossRef]
  52. Napiórkowska-Krzebietke, A.; Dunalska, J.A.; Zębek, E. Taxa-specific eco-sensitivity in relation to phytoplankton bloom stability and ecologically relevant lake state. Acta Oecol. 2017, 81, 10–21. [Google Scholar]
  53. DeMott, W.R.; Gulati, R.D.; Van Donk, E. Daphnia food limitation in three hypertrophic Dutch lakes: Evidence for exclusion of large-bodied species by interfering filaments of cyanobacteria. Limnol. Oceanogr. 2001, 46, 2054–2060. [Google Scholar] [CrossRef]
  54. Bednarska, A.; Łoś, J.; Dawidowicz, P. Daphnia as a model organism in limnology and aquatic biology: Some aspects of its reproduction and development. J. Limnol. 2011, 70, 353–358. [Google Scholar] [CrossRef] [Green Version]
  55. Dembowska, E.A.; Napiórkowski, P.; Mieszczankin, T.; Józefowicz, S. Planktonic indices in the evaluation of the ecological status and the trophic state of the longest lake in Poland. Ecol. Indic. 2015, 56, 15–22. [Google Scholar] [CrossRef]
  56. Harke, M.J.; Steffen, M.M.; Gobler, C.J.; Otten, T.G.; Wilhelm, S.W.; Wood, S.A.; Paerl, H.W. A review of the global ecology, genomics, and biogeography of the toxic cyanobacterium, Microcystis spp. Harmful Algae 2016, 54, 4–20. [Google Scholar] [CrossRef] [PubMed] [Green Version]
  57. Josué, I.I.P.; Cardoso, S.J.; Miranda, M.; Mucci, M.; Ger, K.A.; Roland, F.; Marinho, M.M. Cyanobacteria dominance drives zooplankton functional dispersion. Hydrobiologia 2019, 831, 149–161. [Google Scholar] [CrossRef]
  58. Hansson, L.-A.; Gustafsson, S.; Rengefors, K.; Bomark, L. Cyanobacterial chemical warfare affects zooplankton community composition. Freshw. Biol. 2007, 52, 1290–1301. [Google Scholar] [CrossRef]
  59. Tillmanns, A.R.; Wilson, A.E.; Pick, F.R.; Sarnelle, O. Meta-analysis of cyanobacterial effects on zooplankton population growth rate: Species-specific responses. Fund. Appl. Limnol. 2008, 171, 285–295. [Google Scholar] [CrossRef]
  60. Barrios, C.A.Z.; Nandini, S.; Sarma, S.S.S. Effect of crude extracts from cyanobacterial blooms in Lake Texcoco (Mexico) on the population growth of Brachionus calyciflorus (Rotifera). Toxicon 2017, 139, 45–53. [Google Scholar] [CrossRef]
  61. Von Rückert, G.; Giani, A. Biological interactions in the plankton community of a tropical eutrophic reservoir: Is the phytoplankton controlled by zooplankton? J. Plankton Res. 2008, 30, 1157–1168. [Google Scholar] [CrossRef] [Green Version]
  62. Gołdyn, R.; Kowalczewska-Madura, K. Interactions between phytoplankton and zooplankton in the hypertrophic Swarzędzkie Lake in western Poland. J. Plankton Res. 2008, 30, 33–42. [Google Scholar] [CrossRef] [Green Version]
  63. Ger, K.A.; Panosso, R.; Lürling, M. Consequences of acclimation to Microcystis on the selective feeding behavior of the calanoid copepod Eudiaptomus gracilis. Limnol. Oceanogr. 2011, 56, 2103–2114. [Google Scholar] [CrossRef]
  64. Kozak, A.; Gołdyn, R.; Dondajewska, R. Phytoplankton composition and abundance in restored Maltański Reservoir under the influence of physico-chemical variables and zooplankton grazing pressure. PLoS ONE 2015, 10, e0124738. [Google Scholar] [CrossRef] [PubMed] [Green Version]
  65. Onandia, G.; Dias, J.D.; Miracle, M.R. Zooplankton grazing on natural algae and bacteria under hypertrophic conditions. Limnetica 2015, 34, 541–560. [Google Scholar]
  66. Nandini, S.; Sarma, S.S.S.; Amador-López, R.J.; Bolaños-Muñoz, S. Population growth and body size in five rotifer species in response to variable food concentration. J. Freshw. Ecol. 2007, 22, 1–10. [Google Scholar] [CrossRef] [Green Version]
  67. Jia, J.; Shi, W.; Chen, Q.; Lauridsen, T.L. Spatial and temporal variations reveal the response of zooplankton to cyanobacteria. Harmful Algae 2017, 64, 63–73. [Google Scholar] [CrossRef] [PubMed]
  68. Kosiba, J.; Wilk-Woźniak, E.; Krztoń, W. The effect of potentially toxic cyanobacteria on ciliates (Ciliophora). Hydrobiologia 2019, 827, 325–335. [Google Scholar] [CrossRef] [Green Version]
  69. Cai, J.; Hodoki, Y.; Ushio, M.; Nakano, S. Influence of potential grazers on picocyanobacterial abundance in Lake Biwa revealed with empirical dynamic modeling. Inland Waters 2020. [Google Scholar] [CrossRef]
  70. Carrick, H.J.; Aldridge, F.J.; Schelske, C.L. Wind influences phytoplankton biomass and composition in a shallow, productive lake. Limnol. Oceanogr. 1993, 38, 1179–1192. [Google Scholar] [CrossRef]
  71. Hadas, O.; Kaplan, A.; Sukenik, A. Long-term changes in cyanobacteria populations in Lake Kinneret (Sea of Galilee), Israel: An eco-physiological outlook. Life 2015, 5, 418–431. [Google Scholar] [CrossRef]
  72. Klimaszyk, P.; Rzymski, P. The complexity of ecological impacts induced by great cormorants. Hydrobiologia 2016, 771, 13–30. [Google Scholar] [CrossRef] [Green Version]
  73. Schulhof, M.A.; Shurin, J.B.; Declerck, S.A.J.; Van de Waal, D.B. Phytoplankton growth and stoichiometric responses to warming, nutrient addition and grazing depend on lake productivity and cell size. Glob. Chang. Biol. 2019, 25, 2751–2762. [Google Scholar] [CrossRef] [Green Version]
  74. Napiórkowska-Krzebietke, A. Phytoplankton response to fish-induced environmental changes in a temperate shallow pond-type lake. Arch. Pol. Fish. 2017, 25, 211–264. [Google Scholar] [CrossRef] [Green Version]
  75. Maliaka, V.; Verstijnen, Y.J.M.; Faassen, E.J.; Smolders, A.J.P.; Lürling, M. Effects of guanotrophication and warming on the abundance of green algae, cyanobacteria and microcystins in Lake Lesser Prespa, Greece. PLoS ONE 2020, 15, e0229148. [Google Scholar] [CrossRef] [Green Version]
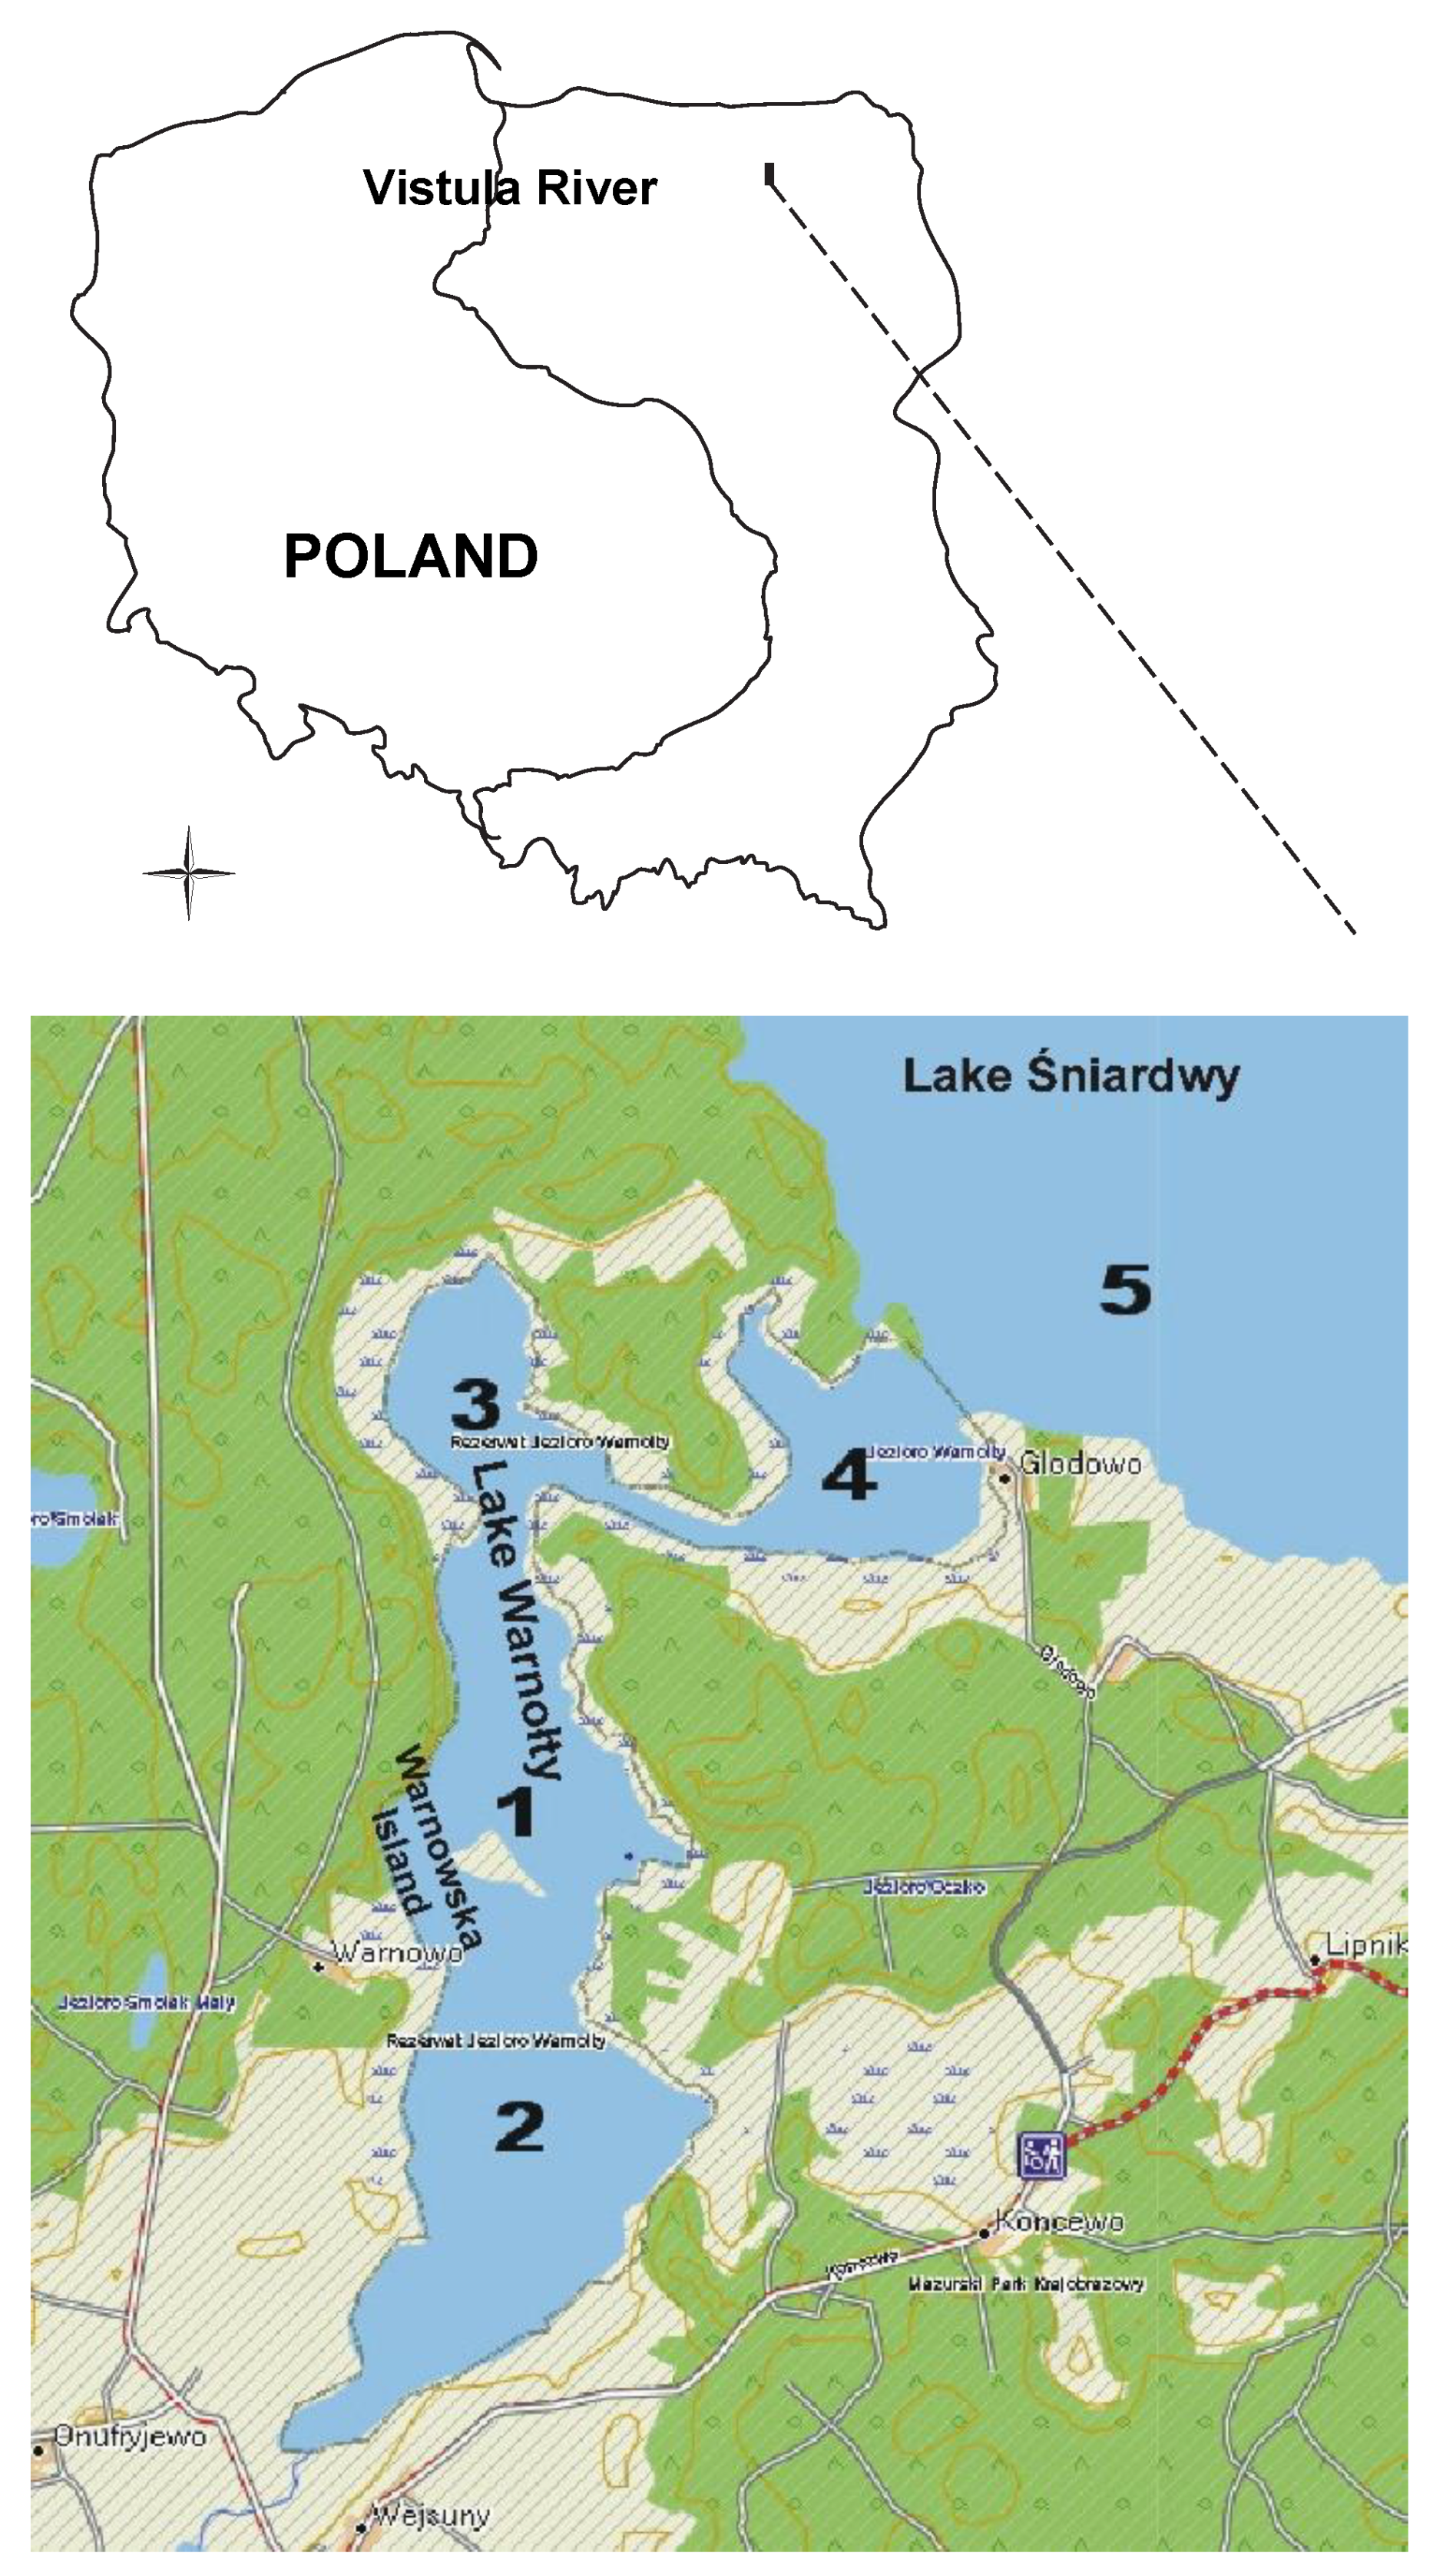
Figure 1. Location of sampling sites in Lake Warnołty (sites 1–4) and Lake Śniardwy (site 5).
Water 12 01252 g001
Figure 2. Spatial distribution of the main environmental parameters: total phosphorus (a), total nitrogen (b), total organic carbon (c), chlorophyll a (d), Secchi disk depth (e) and electrical conductivity (f); significant differences between sampling sites: the letters a and b indicate significant differences between sites: * KW-H (4;23) = 18.5918; p = 0.0009; ** KW-H (4;23) = 18.029; p = 0.0012; *** KW-H (4;23) = 13.5351; p = 0.0089; **** KW-H (4;23) = 17.6; p = 0.0015.
Water 12 01252 g002aWater 12 01252 g002b
Figure 3. Temporal and spatial distribution of the total phytoplankton biomass (a) and composition (b); sites 1–4 in Lake Warnołty, site 5 in Lake Śniardwy.
Water 12 01252 g003
Figure 4. Temporal and spatial distribution of heterotrophic nanoflagellate (HNF) biomass; sites 1–4 in Lake Warnołty, site 5 in Lake Śniardwy.
Water 12 01252 g004
Figure 5. Temporal and spatial distribution of ciliate biomass (a) and composition (b); sites 1–4 in Lake Warnołty, site 5 in Lake Śniardwy.
Water 12 01252 g005
Figure 6. Temporal and spatial distribution of rotifer and crustacean biomass (a) and composition (b); sites 1–4 in Lake Warnołty, site 5 in Lake Śniardwy.
Water 12 01252 g006
Figure 7. The GAM-based response of the total phytoplankton and cyanobacteria biomasses to water temperature (a), total phosphorus (b), chlorophyll a (c), total nitrogen (d), total organic carbon, (e) and Secchi disk depth (f).
Water 12 01252 g007
Figure 8. The zooplankton grazing effect on phytoplankton including biomass ratios; TPB—total phytoplankton biomass, TZB—total zooplankton biomass, BCil—ciliate biomass, BRot—rotifer biomass, BClad—cladoceran biomass, BCop—copepod biomass, sites 1–4 in Lake Warnołty, site 5 in Lake Śniardwy.
Water 12 01252 g008
Figure 9. Trophic state index (TSI) deviation plot at sites 1–4 in Lake Warnołty and site 5 in Lake Śniardwy; possible interpretations made on the basis of Carlson and Havens [47] findings.
Water 12 01252 g009
Table 1. Trophic state index (TSI) and its partial indices based on summer data on chlorophyll a (TSICHL), Secchi disk depth (TSISDD), total phosphorus (TSITP), total nitrogen (TSITN) at five sites in Lake Warnołty.
Sampling SitesTSICHLTSISDDTSITPTSITNTSIState *
17771746572hypertrophic
27870686370eutrophic
36669666065eutrophic
46260625660eutrophic
55248636858eutrophic
* classification of trophic state according to Carlson and Simpson [47].
Table 2. Generalized additive models for total phytoplankton and cyanobacteria response to environmental variables.
PredictorrFp
Total phytoplankton
T0.4933.20.06157
TP0.5965.50.01238
TN0.3631.50.24410
T x nutrients0.70721.00.00016
Cyanobacteria
T0.5253.80.03985
TP0.4973.30.05846
TN0.2920.92520.58725
T x nutrients0.66916.90.00049
Explanation of predictors: T—water temperature, TP—total phosphorus, TN—total nitrogen.