Article

Characterizing the Reactivity of Metallic Iron for Water Treatment: H2 Evolution in H2SO4 and Uranium Removal Efficiency

1
School of Earth Science and Engineering, Hohai University, Fo Cheng Xi Road 8, Nanjing 211100, China
2
Biosystems and Environmental Engineering Research Group, Department of Soil Science and Agricultural Engineering, University of Zimbabwe, P.O. Box MP167, Mt. Pleasant, Harare, Zimbabwe
3
Department of Chemistry, Faculty of Sciences, University of Douala, B.P. 24157 Douala, Cameroon
4
Angewandte Geologie, Universität Göttingen, Goldschmidtstraße 3, D-37077 Göttingen, Germany
*
Authors to whom correspondence should be addressed.
Water 2020, 12(6), 1523; https://doi.org/10.3390/w12061523
Submission received: 17 April 2020 / Revised: 22 May 2020 / Accepted: 23 May 2020 / Published: 27 May 2020
(This article belongs to the Section Wastewater Treatment and Reuse)

Abstract

:
Metallic iron (Fe0) has been demonstrated as an excellent material for decentralized safe drinking water provision, wastewater treatment and environmental remediation. An open issue for all these applications is the rational material selection or quality assurance. Several methods for assessing Fe0 quality have been presented, but all of them are limited to characterizing its initial reactivity. The present study investigates H2 evolution in an acidic solution (pH 2.0) as an alternative method, while comparing achieved results to those of uranium removal in quiescent batch experiments at neutral pH values. The unique feature of the H2 evolution experiment is that quantitative H2 production ceased when the pH reached a value of 3.1. A total of twelve Fe0 specimens were tested. The volume of molecular H2 produced by 2.0 g of each Fe0 specimen in 560 mL H2SO4 (0.01 M) was monitored for 24 h. Additionally, the extent of U(VI) (0.084 mM) removal from an aqueous solution (20.0 mL) by 0.1 g of Fe0 was characterized. All U removal experiments were performed at room temperature (22 ± 2 °C) for 14 days. Results demonstrated the difficulty of comparing Fe0 specimens from different sources and confirmed that the elemental composition of Fe0 is not a stand-alone determining factor for reactivity. The time-dependent changes of H2 evolution in H2SO4 confirmed that tests in the neutral pH range just address the initial reactivity of Fe0 materials. In particular, materials initially reacting very fast would experience a decrease in reactivity in the long-term, and this aspect must be incorporated in designing novel materials and sustainable remediation systems. An idea is proposed that could enable the manufacturing of intrinsically long-term efficient Fe0 materials for targeted operations as a function of the geochemistry.

1. Introduction

Metallic iron (Fe0) is a reactive material that has been used to produce solid iron corrosion products (FeCPs), which are excellent contaminant scavengers [1,2,3,4,5]. Fe0 has been industrially used for water treatment since the 1850s [1,6,7,8,9,10,11]. Fe0 is a low-cost and readily available material, with demonstrated suitability for the design of decentralized treatment systems for safe drinking water [12] and domestic wastewater [13]. Therefore, “remediation using Fe0” is currently regarded as one of the best available technologies in the global effort to achieve Goal 6 of the UN Sustainable Development Goals (SDGs): Ensure availability and sustainable management of water and sanitation for all [14,15,16]. However, the Fe0 remediation technology as a whole suffers from lack of reliable methods to characterize the intrinsic reactivity of used materials [17,18,19,20,21,22,23].
Information regarding the intrinsic reactivity of Fe0 materials for water treatment is confusing. Li et al. [21] recently summarized the state-of-the-art knowledge on the characterization methods of Fe0 for water treatment. This excellent review article with 247 references concluded that due to the inherent limitations of each technique, no single characterization method on its own can “offer all of the necessary information” for the rational selection of Fe0 materials for field applications. However, the approaches used by the large majority of articles reviewed by Li et al. [21] were limited to characterizing the pristine Fe0 specimens before and after equilibration with contaminants. In a few cases, the systems were characterized at start, at selected time intervals, and at the end of the experiments [24,25,26]. As a way forward, Li et al. [21] suggested the need to systematically characterize Fe0/H2O systems several times during the experiment and use the results to interpret their contaminant removal efficiency in a holistic approach. However, this approach is time-consuming, expensive, and not even accessible to lowly equipped laboratories such as those in the developing world [27,28]. In other words, the rational approach suggested by Li et al. [21] will be of little help if research institutions with limited instrumental facilities are to contribute to “effectively translate existing knowledge into practical solutions” [14,29]. Therefore, efficient and affordable approaches that can be applied in lowly equipped laboratories are urgently needed to characterize the intrinsic reactivity of Fe0 materials. In fact, the chemistry of the Fe0/H2O system could support this effort.
Table 1 summarizes some relevant reactions that can be used as a basis for the development of approaches for the evaluation of the efficiency of Fe0/H2O systems for water treatment. Equation (1) corresponds to the electrochemical dissolution of Fe0 by water (iron corrosion) and shows that Fe0 can be universally used to produce H2 [30]. In other words, the stoichiometry of Equation (1) can be used to achieve the following: (i) characterize the extent of iron corrosion [31,32] and (ii) determine the iron content of Fe0-based materials [19,33]. The reaction shown in Equation (1) is more intensive at acidic pH values (consumption of H+) than under alkaline conditions. In fact, at pH ≤ 4.5, iron corrosion occurs according to the “H2 evolution” mechanism (Table 2). For higher pH values, iron corrodes according to the “O2 adsorption” mechanism (Table 2). The expression “O2 adsorption” corresponds to the old view that iron is corroded by molecular O2 [34]. It is well-established that at pH > 4.5, a heterogeneous oxide scale develops on the Fe0 surface as shown in Equations (2) to (4), and this scale is responsible for contaminant removal in Fe0/H2O systems [8,10,16,28,35,36]. The strong interactions of the oxide scale with several contaminants (including U(VI)) have been identified as a key confounding factor in efforts to characterize the reactivity of Fe0 materials for water treatment [24,37]. This situation has motivated Noubactep et al. [38] to introduce ligand-based tools for reactivity characterization (e.g., EDTA test). Our research group used Ethylenediaminetetraacetic acid (EDTA) to complex FeII and delay formation of solid FeCPS. Recently, Lufingo et al. [22] successfully tested 1,10-Phenanthroline (Phen) as a better complexing agent for characterizing Fe0 specimens (Phen test). For each test, the slope of the line [Fe] = f(t) (kEDTA and kPhen) represents the initial corrosion rate.
Fe0 + 2 H+ ⇔ Fe2+ + H2
Fe2+ + 2 OH ⇔ Fe(OH)2
2 Fe(OH)2 + ½ O2 + H2O ⇔ 2 Fe(OH)3
Fe(OH)3 ⇔ FeOOH; Fe2O3, Fe3O4
Fe2+ + EDTA ⇔ Fe(EDTA)2+
Table 2 summarizes the state-of-the-art knowledge on using the stoichiometry of Equation (1) to characterize the intrinsic reactivity of Fe0 materials. All other available tools are based on the stoichiometry of secondary reactions as it is now established that contaminant reduction by Fe0 (electrons from Fe0) is impossible under environmental conditions [10,36,39,40]. Further, adsorption and co-precipitation with in situ generated FeCPs are the fundamental mechanisms of contaminant removal in Fe0/H2O systems [8,10,16,36,37]. In this work, uranium removal in different Fe0/H2O systems is used as representative of contaminant removal-based tools to discuss the suitability of H2 evolution as an alternative tool to assist material selection for field application.
Fe0 materials used for water treatment are not originally manufactured for this purpose [42,43]. Hence, they do not show any compositional characteristics making them particularly suitable for the subsurface applications [17,18,19,21]. In fact, among the factors influencing the long-term behavior of Fe0 (e.g., crystallinity, iron impurity, surface state, morphology), only the surface state and the morphology can probably be characterized in short-term laboratory experiments. Therefore, methods to characterize or simulate the long-term reactivity of Fe0 materials for water treatment are still needed. This understanding is also crucial for the design and manufacture of new Fe0 materials with tailored contaminant removal efficiency.
The objectives of this study are to (i) test selected Fe0 for their hydrogen production in an acidic solution, (ii) compare their capacity to remove U(VI) from an aqueous solution, and (iii) discuss the trends in the long-term efficiency of Fe0 materials for water treatment.

2. Experimental Section

2.1. Iron Materials

A total of twelve iron materials was selected and used in this study. Four of them were commercially available Fe0 materials for groundwater remediation termed as: (i) “DRI”, (ii) “GGG”, (iii) “HGG”, and (iv) “HGM”. DRI is Eisenschwamm from ISPAT GmbH, Hamburg; GGG is Graugußeisengranulat from G. Maier Metallpulver GmbH, Rheinfelden; HGG is Hartgußgranulat from Hermens; and HGM is Hartgußstrahlmittel from Würth—all in Germany. DRI is a direct reduced iron, while the other materials were cast irons with different geometrical shapes. The other four materials were model carbon steels termed as: (i) “C15”, (ii) “C45”, (iii) “C60”, and (iv) “C100”, primarily differing in their carbon content (i.e., 0.15%, 0.45%, 0.60%, and 1.00%, respectively). Two other selected iron materials were mild steels of different classes termed as: (i) “ST1” and (ii) “ST2”. ST1 had an elevated chromium content (8.6% Cr), while ST2 had an elevated sulfur content (0.287% S). The remaining two materials were scrap irons from a metal recycling company (Metallaufbereitung Zwickau) termed as: (i) “S15” and (ii) “S69”. S15 was a mixture of mild steels from various origins, while S69 was a similar mixture of cast irons.
Apart from DRI, the commercially available Fe0 materials were used in their typical state and form (i.e., “as received” state). All other samples were crushed into small pieces, sieved and the particles sizes ranging between 1.0 and 1.6 mm were used in the experiments without any further pre-treatment.
Table 3 summarizes the elemental compositions of the materials based on analyses made using X-Ray fluorescence spectrometry. Figure 1 presents an overview of the distribution of iron impurities in the selected materials. It can be clearly seen that the materials primarily differ in their carbon (C) and silicon (Si) contents. Thus, based on the C content, the tested materials can be divided into three classes: (i) GGG, HGG, HGM, and S69 containing more than 3% C (cast irons), (ii) the seven other materials containing less than 2% C, and mild steels, and (iii) DRI (1.9% C), belonging to the third class, characterized by a specific manufacturing technology, which yielded porous materials [6,44]. All these materials were irregular in shape (filings and shavings) with rough surfaces. An exception was HGM, which had a regular spherical shape, homogeneous size (ϕ = 1.2 mm), and a smooth surface. DRI had a very rough surface and even porosity. HGM and the two scrap irons (S15 and S69) were visibly covered with rust, whereas all the other materials retained their metallic glaze.

2.2. Experimental Methods

2.2.1. Hydrogen Evolution

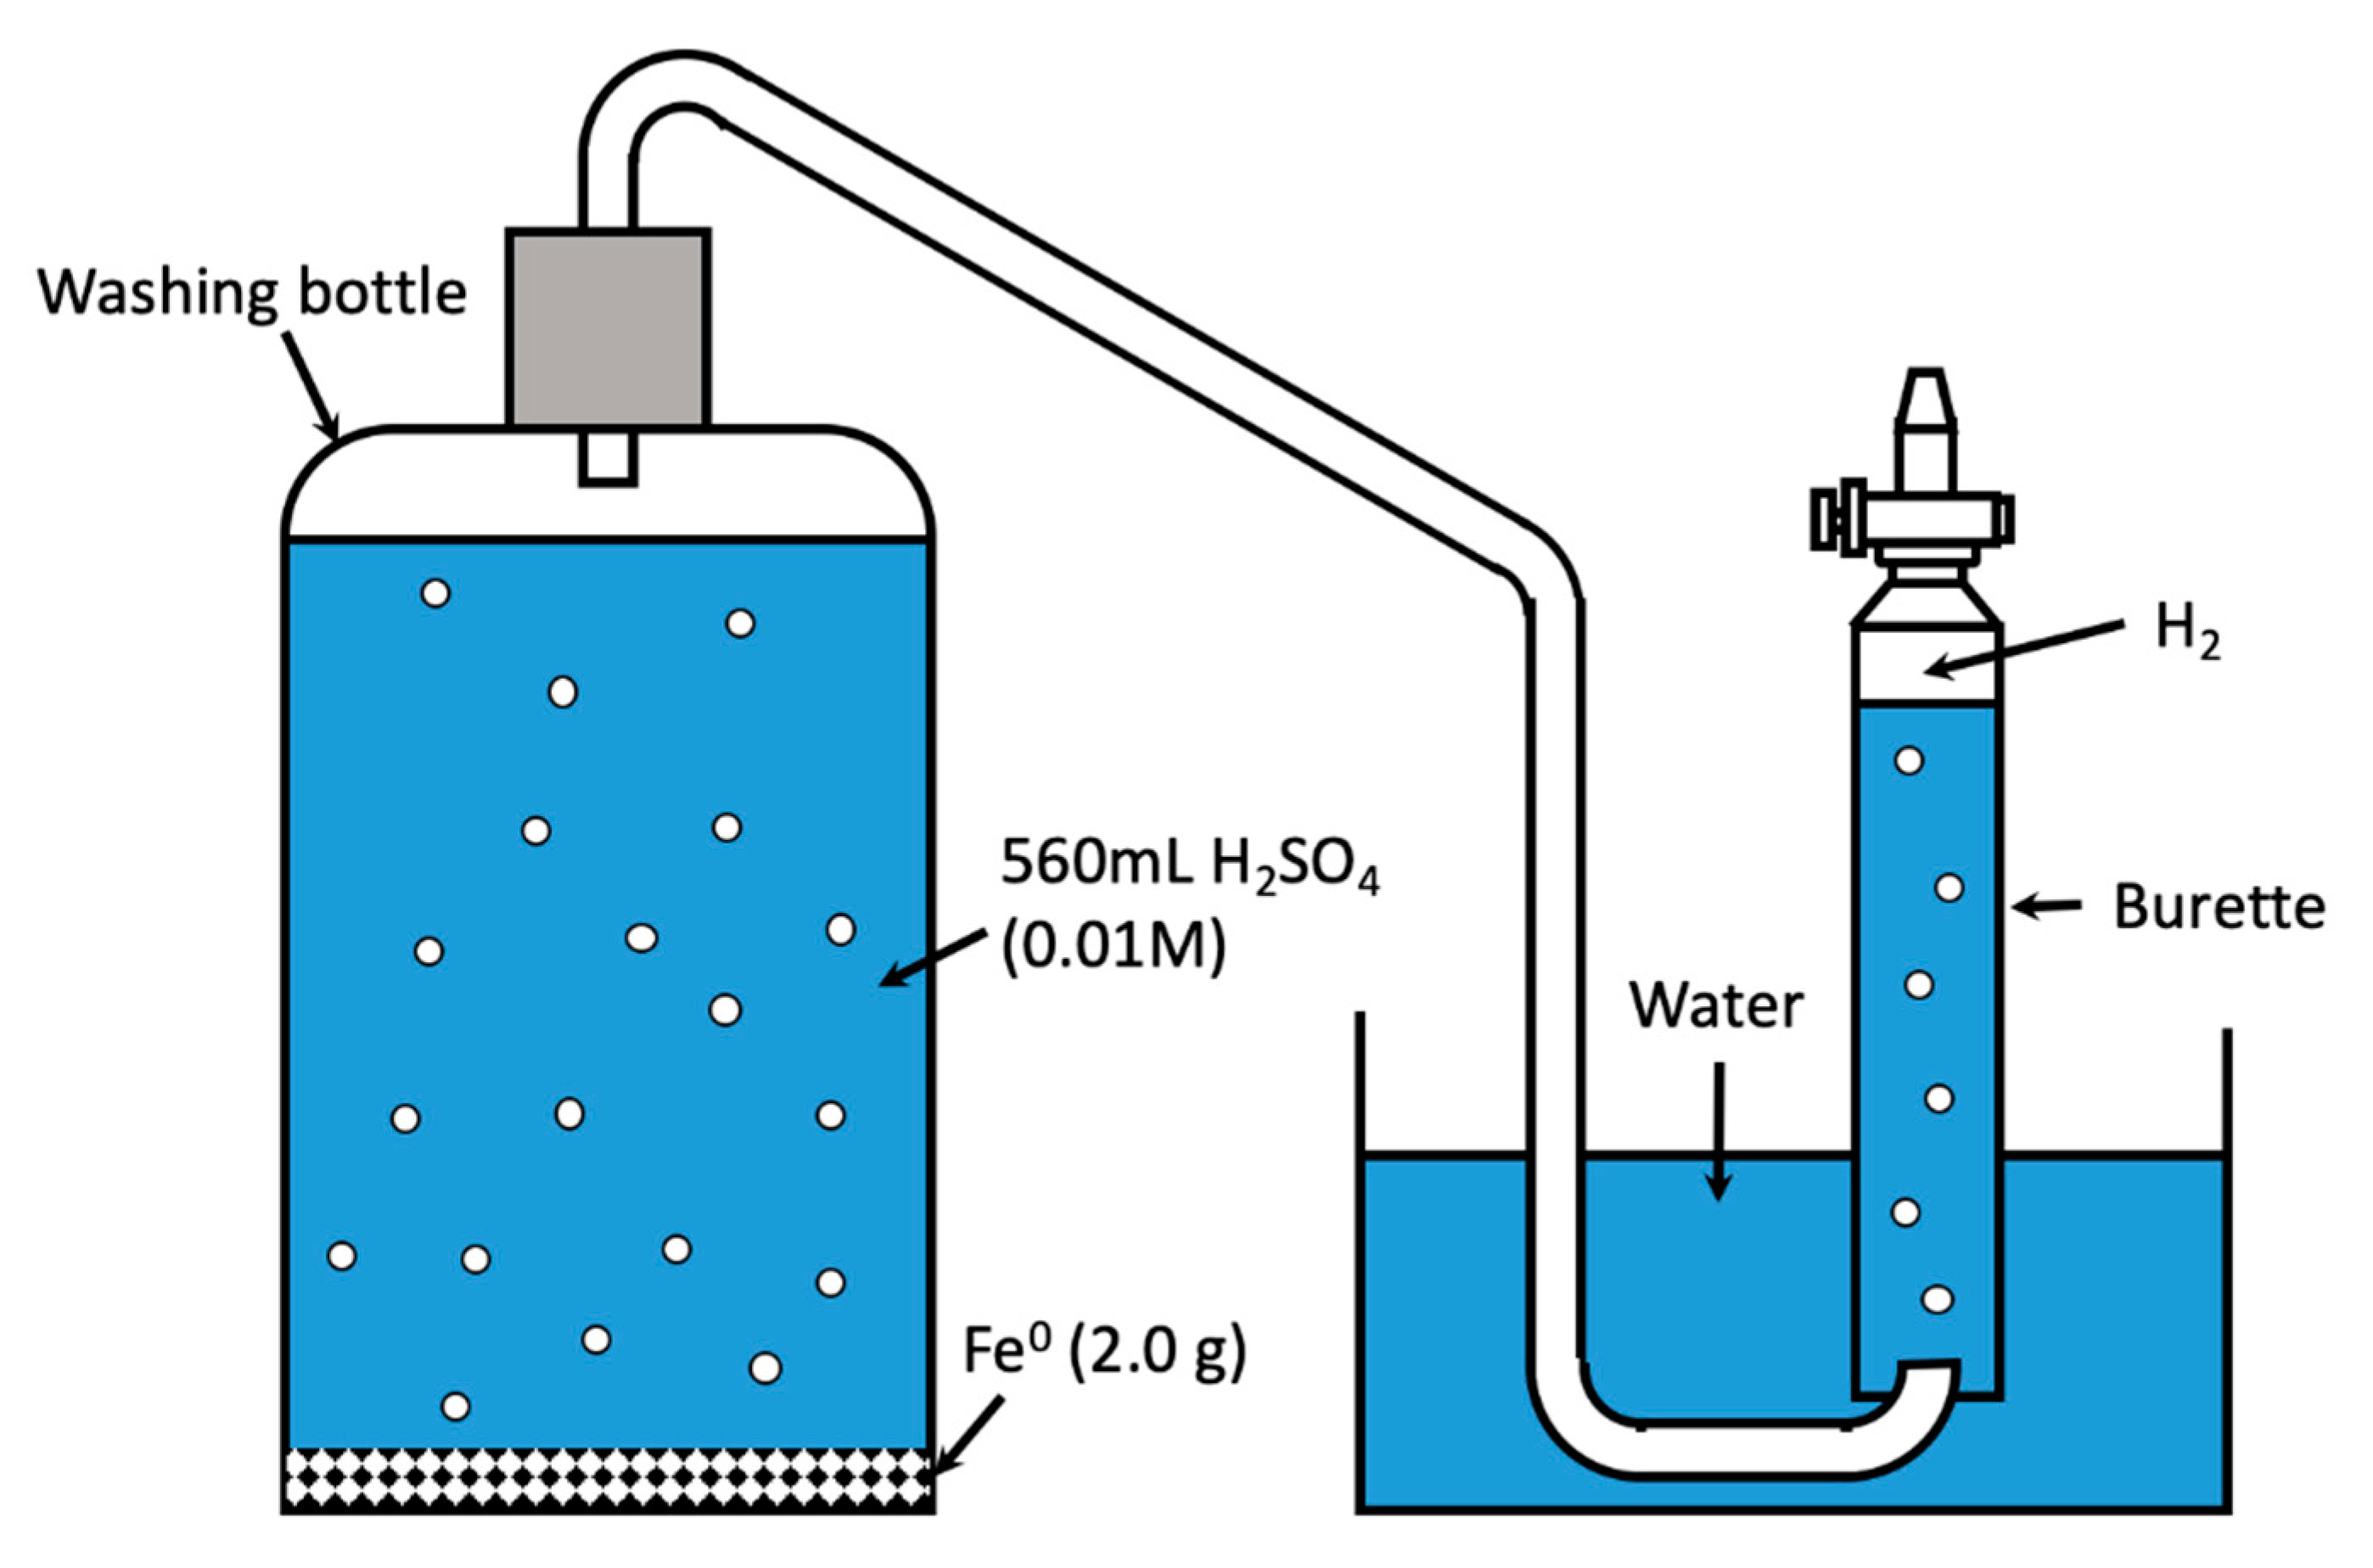
A total of 2.0 g of each Fe0 material was allowed to react in a glass washing bottle (500 mL graduated capacity) for 28 h with 0.01 M H2SO4 (pH = 2.0) at a constant temperature of 22 ± 2 °C. During the course of the experiment, the volume of molecular hydrogen (H2) produced was directly measured as a function of time. Measurements were done using the experimental setup described in Figure 2 [32]. The washing bottle was connected to a pneumatic trough using a rubber tube. The produced H2 was collected in a graduated burette, initially filled with tap water. The produced H2 could then fill the burette by displacing the water in it. The total volume of the solution in the glass wash bottle was 560 mL and contained 2820 mg/L of SO42− and 10.5 mg/L of SiO2. The total volume of H2SO4 was used to reduce the head space in the reaction vessels (washing bottle). The addition of SiO2 and SO42− and the corresponding concentrations were from a laboratory manual on corrosion testing (Manfred Paul—personal communication). The hydrogen production stopped when the pH value was about 3.0 to 3.2. The iron concentration at the end of the experiment was about 21 mM (1176 mg/L).

2.2.2. Uranium Removal

The experiments for uranium removal were performed in triplicates. A total of 0.1 g of each Fe0 material was allowed to react for 14 days in sealed and graduated assay tubes containing 20.0 mL of a U(VI) solution (20 mg L−1 or 0.084 mM) under ambient laboratory temperature (22 ± 2 °C). The U(VI) solution was prepared from UO2(NO3)2·6H2O in tap water. The used assay tubes had a graduated capacity of 16.0 mL, but the total volume was used to reduce the head space in the reaction vessels. The resulting Fe0 mass loading was 5 g L−1. The experiments were conducted with the tap water of the city of Freiberg (Saxony, Germany), with an average composition (mg L−1) of: Cl: 7.5; NO3: 17.5; SO42−: 42.0; Na+: 7.1; K+: 1.6; Mg2+: 6.8; Ca2+: 37.1, and its initial pH was 8.4. The tubes were not agitated but turned up-side down at the beginning of the equilibration and then allowed to react undisturbed (quiescent experiments). The tubes were shielded from direct sunlight and left on the laboratory bench for the duration of the experiment.

2.3. Analytical Methods

Analysis for uranium was performed after reduction to U(IV) with the Asernazo III method ([45] and references cited therein). Uranium concentrations were determined by a HACH UV-Visible Spectrophotometer at a wavelength of 665.0 nm using 1.0 cm glass cells. Dissolved iron was determined using FerroVer iron reagent [46]. All chemicals and reagents used for experiments and analysis were of analytical grade. The pH values were measured by combined glass electrodes (WTW Co., Weinheim, Germany). The electrodes were calibrated with nine standards following a multi-point calibration protocol [47] and in agreement with the new IUPAC recommendation [48].

2.4. Expression of the Experimental Results

In order to characterize the magnitude of the tested materials for uranium removal, the removal efficiency (E) was calculated (Equation (6)):
E = [1 − (C/C0)] × 100%
where C0 is the initial solution uranium concentration (20.0 mg L−1), while C gives the residual uranium concentration after the removal experiment.
Correlation was used to determine the relationship between the H2 produced and uranium removal efficiency (E) and kEDTA using SPSS. The correlation coefficient (r) was used to assess the goodness of fit at probability level p = 0.05.

3. Results and Discussion

3.1. Molecular Hydrogen Production

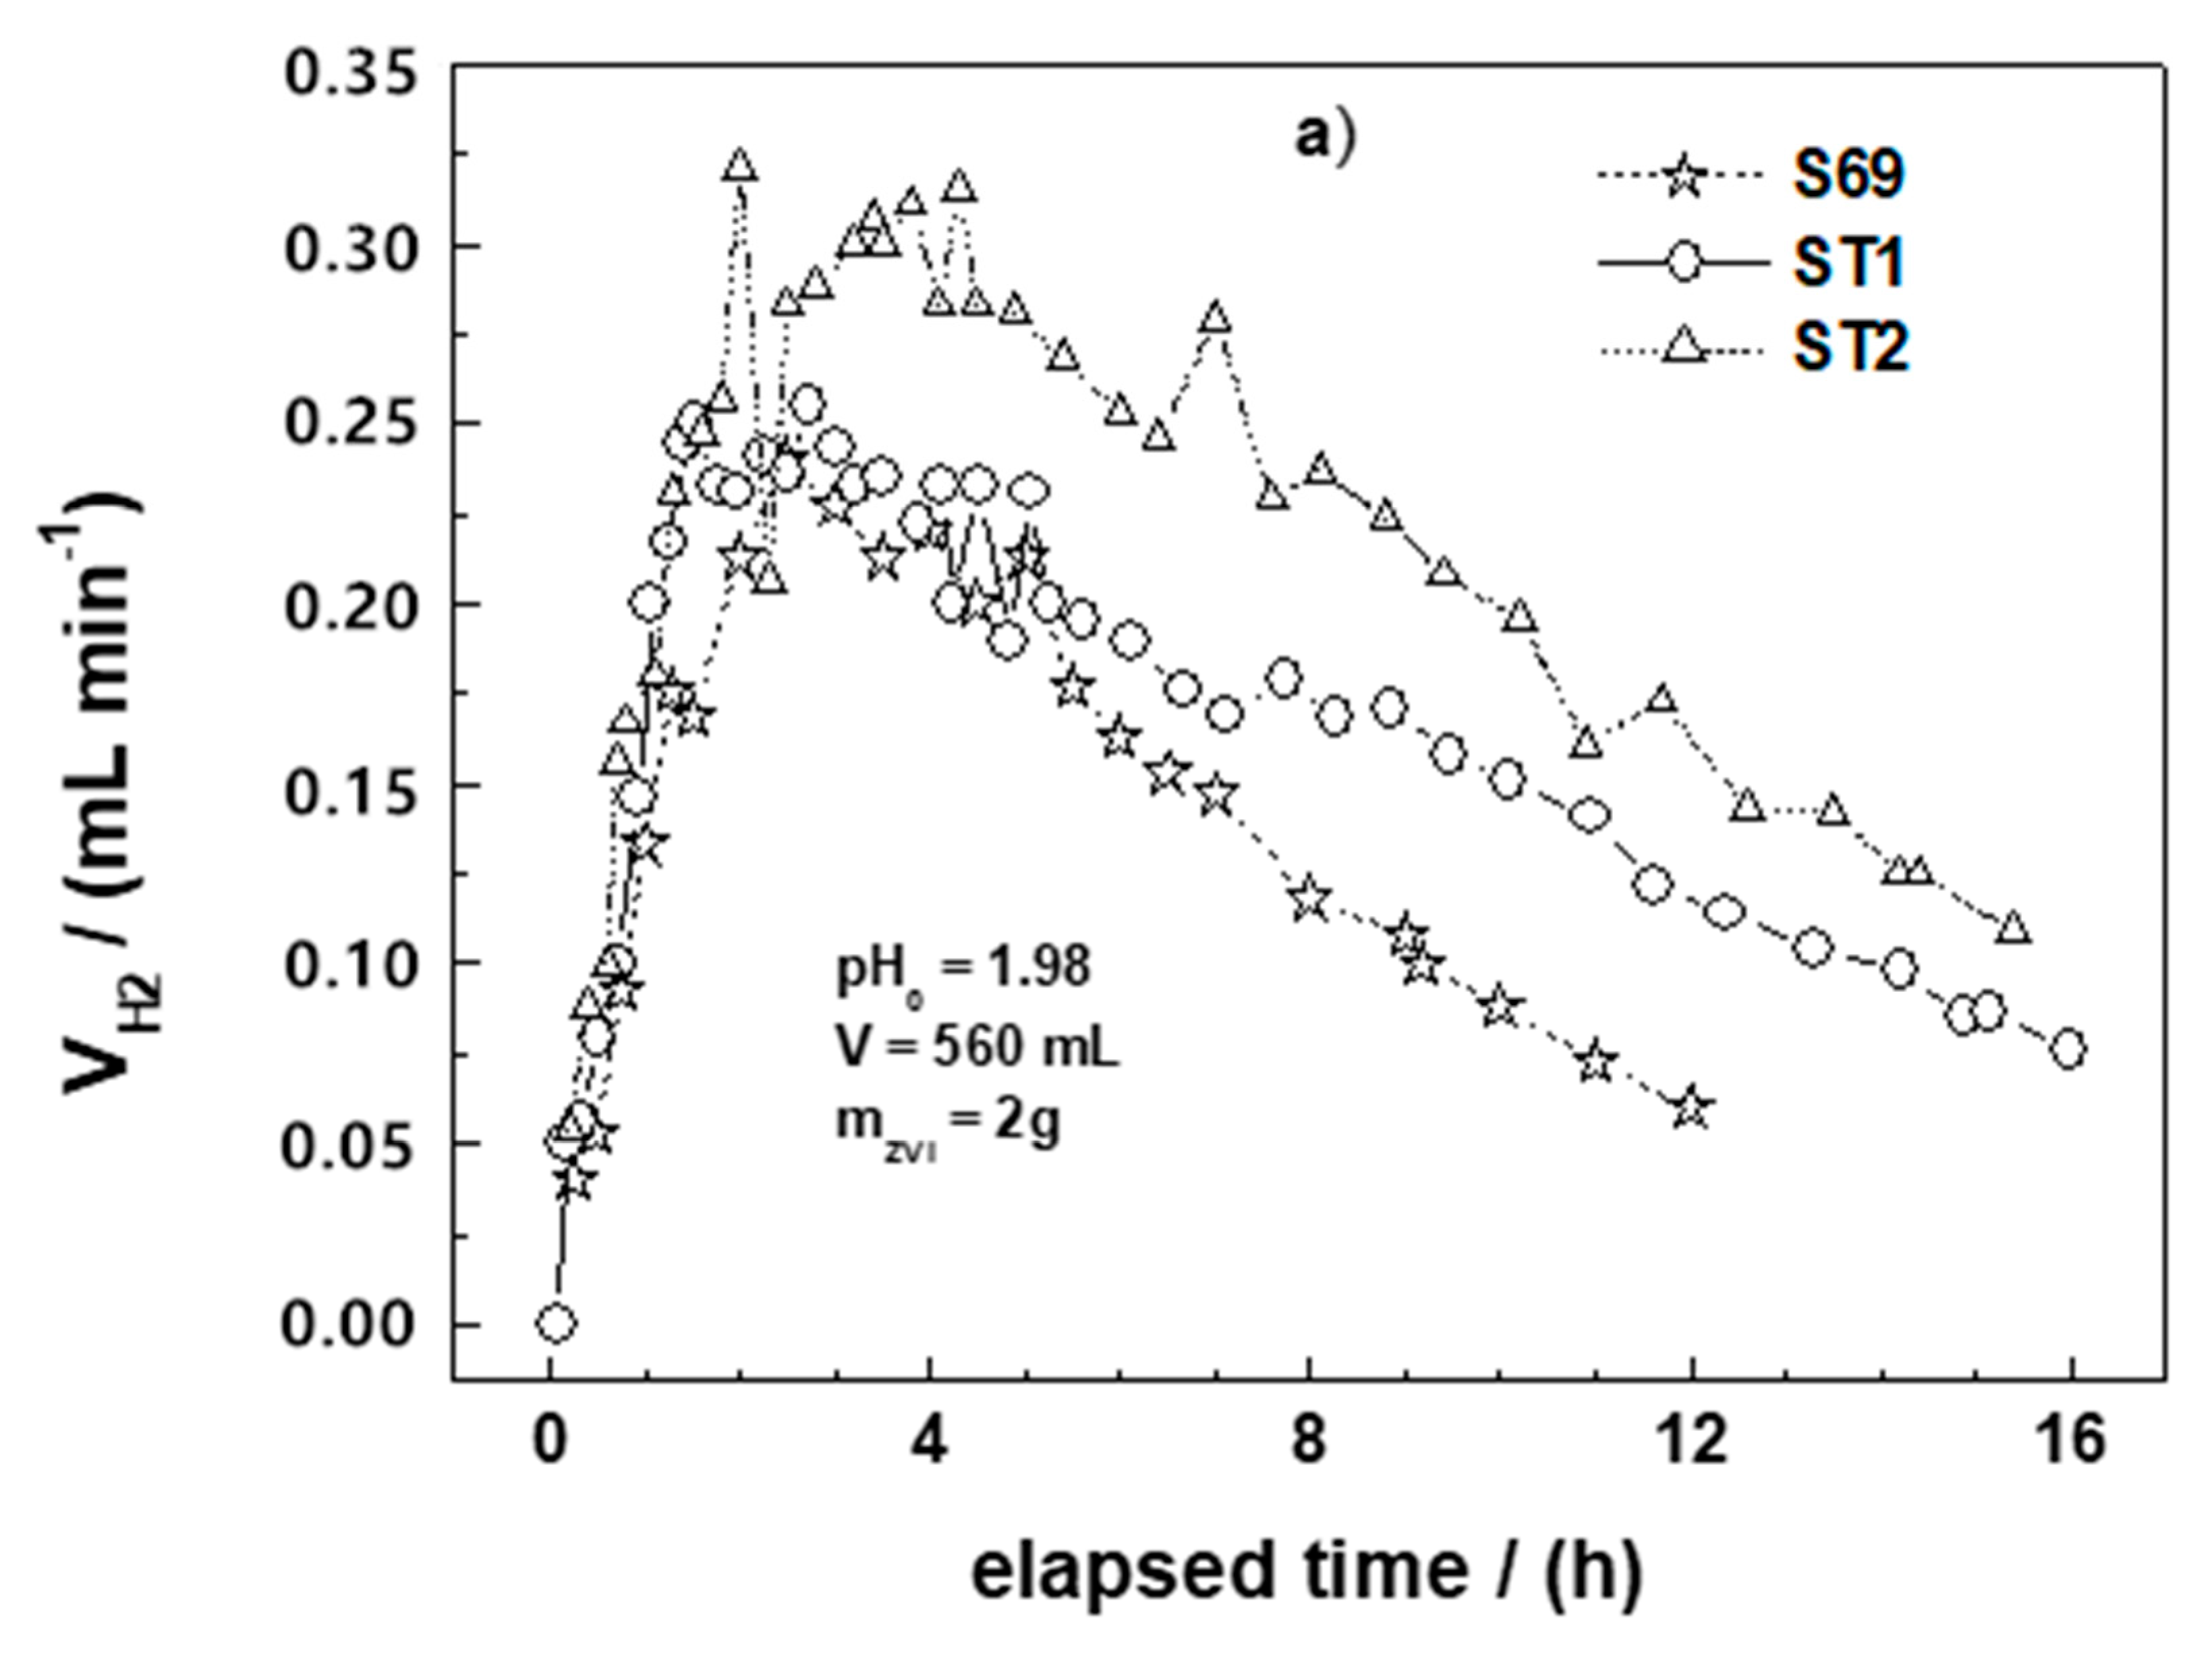
Figure 3a–c summarizes the results of the H2 production experiments for all tested materials. In each figure, the curve for S69 is included for comparison. It can be seen from these figures that the behaviors of most materials are very similar. A typical H2 production curve can be divided into three stages: (i) Stage 1 is characterized by a rapid increase of H2 production rate, (ii) Stage 2 is characterized by a slower H2 production rate and a relatively short plateau, and (iii) Stage 3 is characterized by the continuous decrease of the H2 production rate.
Apart from ST1 and ST2 experiments, which were terminated after 16 h, the recordings of the volumes of H2 produced by individual Fe0 materials were stopped after 24 h. However, to enable a good comparative discussion, Figure 3 presents only the evolutions of the H2 production rates recorded during the first 16 h of experiment for all materials. Changes in the concentrations of H+ (pH value) and iron were not recorded. It is however obvious that both values continuously increased until the end of the experiment [32]. Table 4 summarizes these results.
It can be seen from Table 4 and Figure 3 that the H2 evolution of the individual systems was different. For example, the volume of H2 produced after 24 h varied from 40 mL for HGM to 149 mL for DRI, while the values for ST1 and ST2 were 152 and 192 mL, respectively, after only 16 h. The time at which the maximum H2 production rate was achieved varied between 0.1 h for DRI and 5.9 h for HGG. According to Reardon [41], the in-situ formed FeCPs shielding the pristine Fe0 surface strongly influence the H2 production rate, and its dissolution increases the pH without producing H2. This is a plausible explanation for the relatively lower H2 production of S15 and S69. However, the very low capacity of HGM at producing H2 cannot only be justified by the presence of FeCPs. Even its smooth surface and regular spherical form are possibly not the only reasons for this low efficiency. For a better discussion, data on the thermal treatment of materials during their manufacturing process are needed [18,19,21,43]. The temperature to which a material is heated can significantly influence its reactivity [49,50,51]. For example, Scendo and Szczerba [51] observed that the thermal treatment of C45 mild steel coated with WC-5Co-15Al2O3 at 800 °C increases its initial corrosion rate by more than four times compared to a material of the same specimen treated at 400 °C. In the same study, coating was done using Al2O3 to increase the material resistance to chemical corrosion as suggested by thermogravimetric measurements. It is therefore likely that thermal treatment could have suppressed the reactivity of HGM. Consequently, the best way to bring clarity to this question is to manufacture and test a set of several forms of iron materials from the same initial bulk material. This will elucidate the effects of material manufacturing process on reactivity.
Figure 3c shows the most important aspect of the H2 production experiment. The curves for DRI, HGG, and HGM are representative for all materials and will be discussed later (Section 4.2). In fact, only DRI and HGM are primarily different from all other materials. The H2 production rate is very fast for DRI and stops after about 8 h. The H2 production rate for HGG follows the typical 3-stage curve described above. Specifically, the H2 production rate for HGM begins very slowly, reaching a maximum after 1.4 h, and then remains constant for the rest of the experiment (i.e., even after 16 h). A discussion on the significance of these different profiles for the long-term performance of Fe0 materials will be given later (Section 4.2).

3.2. Uranium Removal

Table 4 summarizes the results of uranium removal by the Fe0 materials in tap water. It can be seen from Table 4 that under the given experimental conditions the per cent total removal of uranium (E) varies from 76% for ST1 to 93% for S69. The order of uranium removal efficiencies increased as follows: ST1 < HGG < ST2 < HGM < C45 < C15 < C60 < C100 < GGG < S15 < DRI < S69. From this trend, it is obvious that uranium removal is influenced by many factors. First, a comparison of HGM and HGG (cast irons) shows that HGM with a smooth surface depicted a greater removal efficiency than that of HGG. A similar observation is made when comparing the efficiencies of rough S69 to that of rough and porous DRI. Second, HGM covered with rust was slightly more efficient (82%) at removing uranium from the aqueous solution than ST2 with metal glaze appearance (80%). This result seems obvious but is pointed out because the difference was not really significant (2%). Finally, S15 and C100 (mild steels) were more efficient at uranium removal than HGM and HGG (cast irons). Under such experimental conditions, uranium is removed from the aqueous phase via co-precipitation with aging FeCPs [38,52,53]. In the absence of any pre-treatments, for materials initially covered with rust, adsorption onto rust will surely occur first. This explains why, compared to the other Fe0 materials, the initially rusted Fe0 materials (i.e., S69, S15, and rough and porous DRI) depicted the greatest removal efficiencies (E values). This experiment has shown that the surface state (roughness), the porosity (surface area), and the oxidation state (rust presence) of Fe0 materials can affect their reactivity under near-natural conditions.

3.3. Comparing H2 Production and Uranium Removal

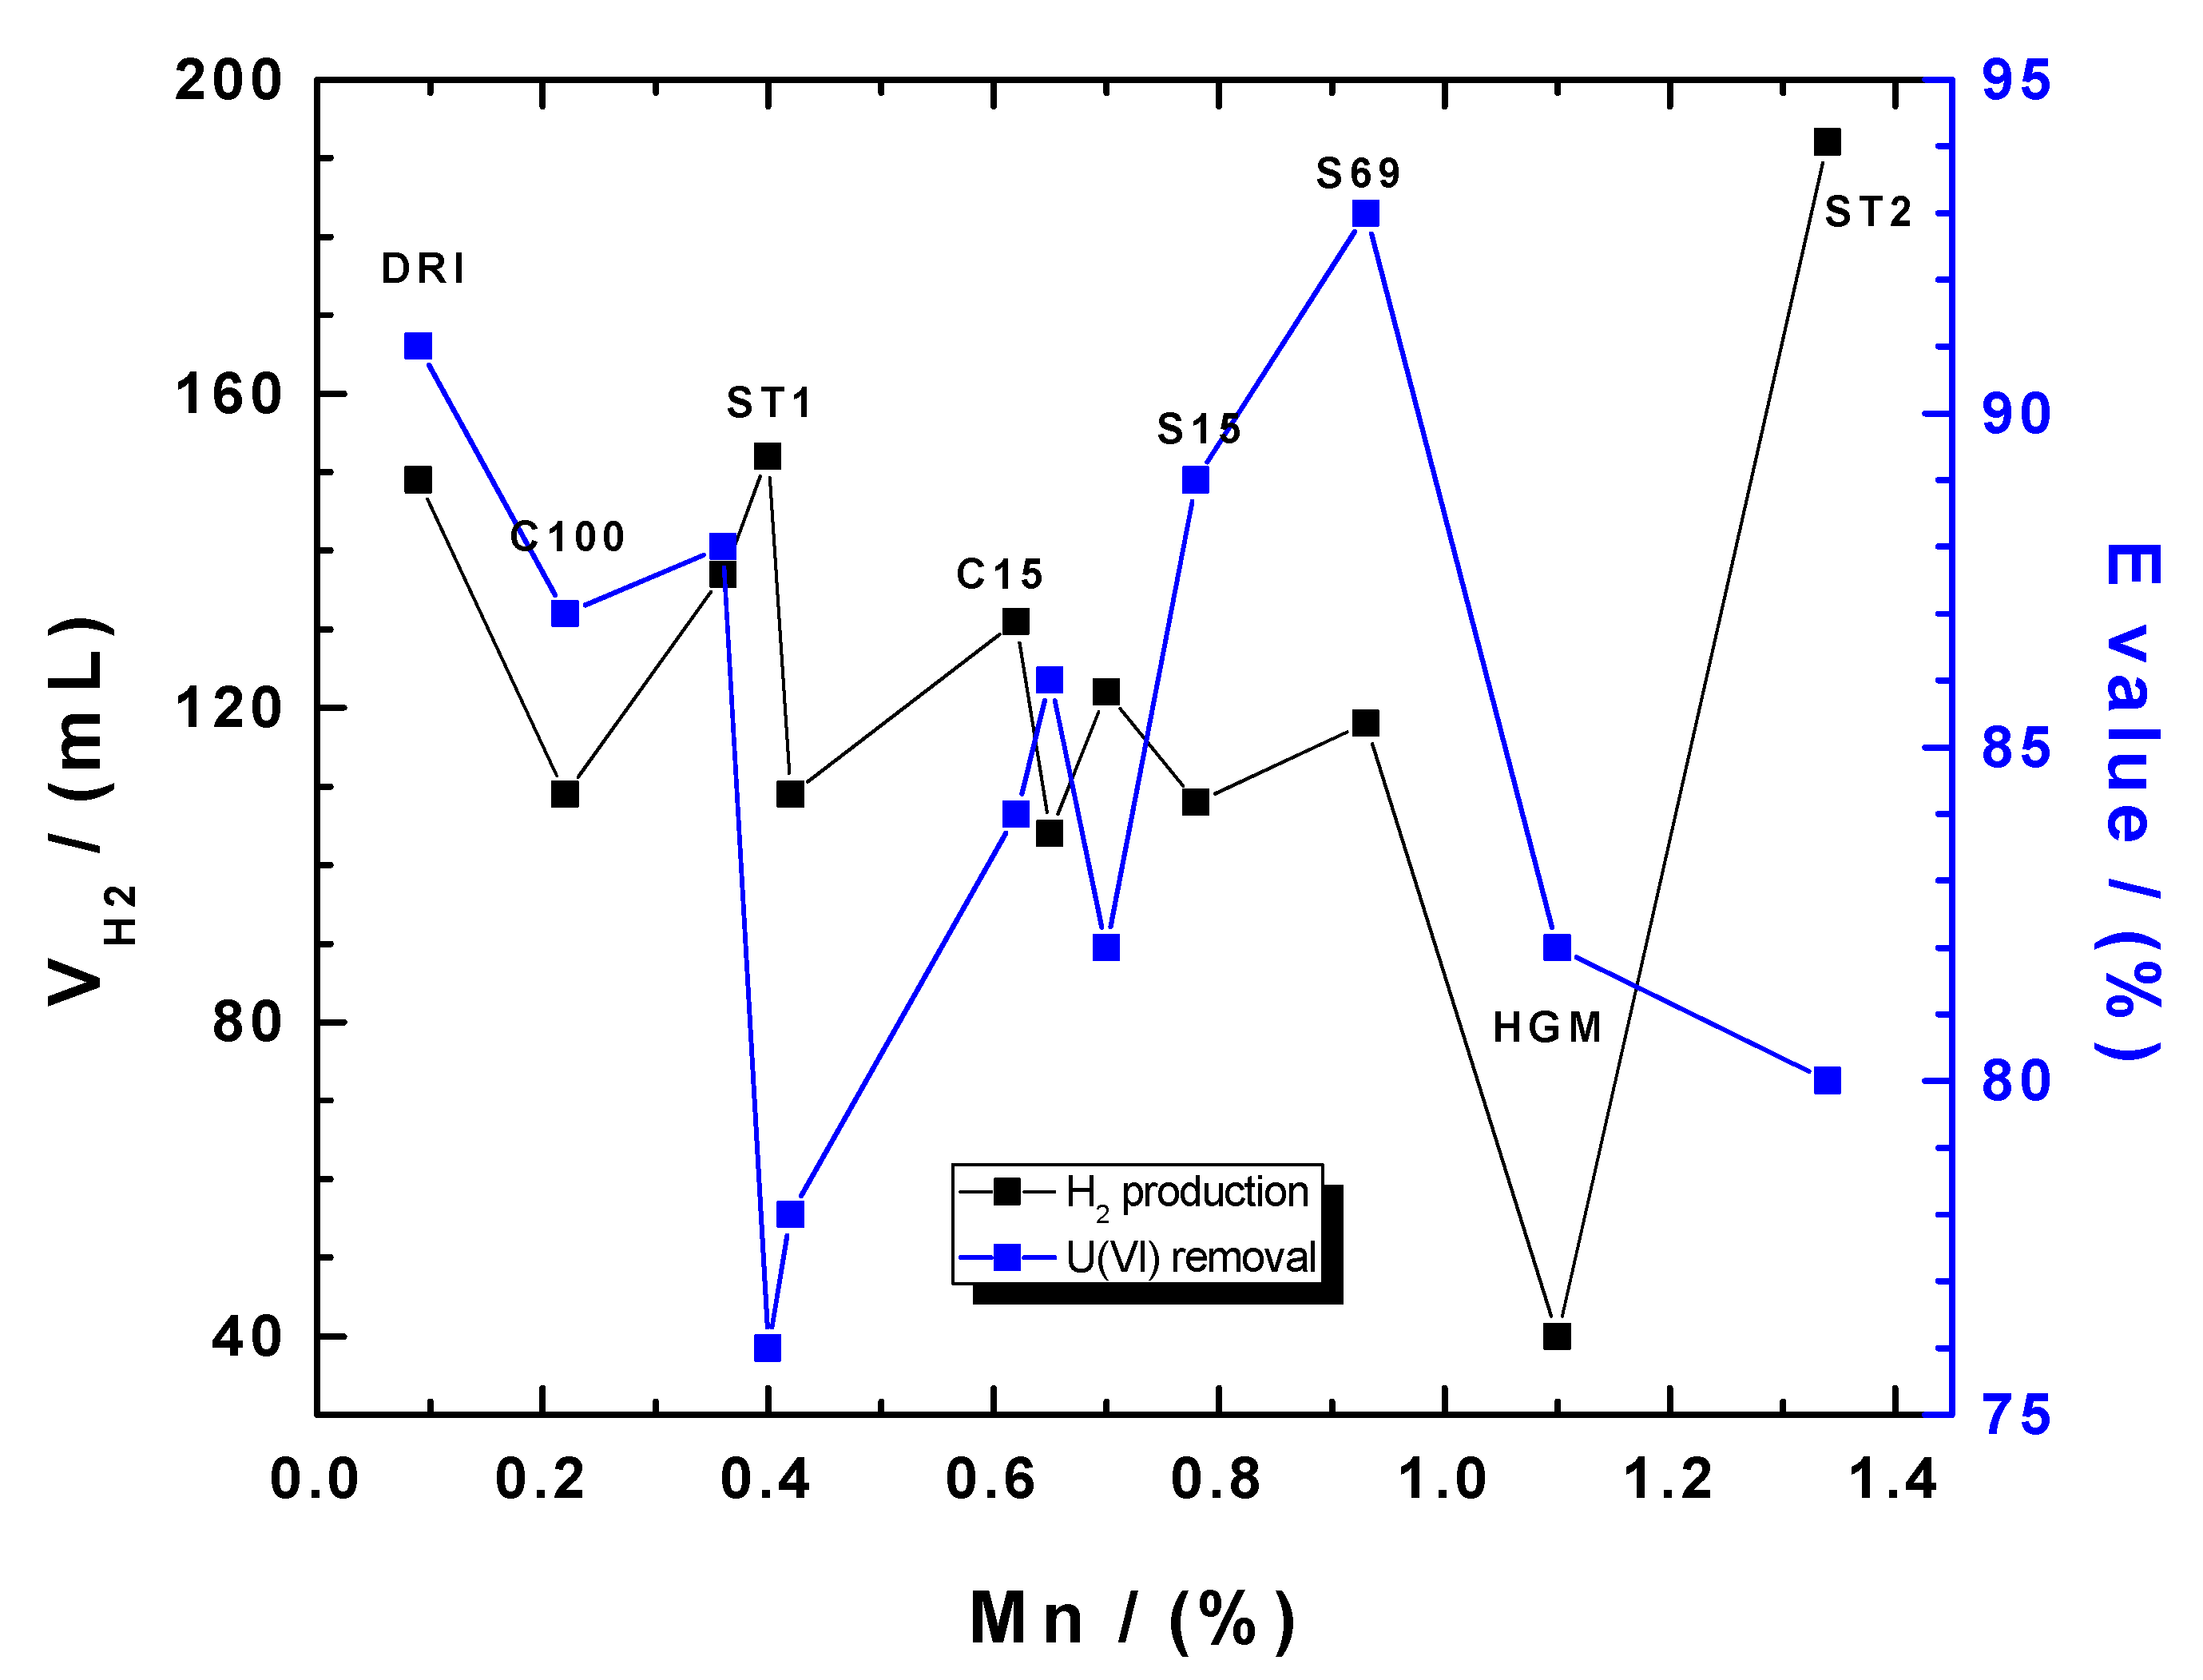
Figure 4 compares the volume of produced molecular hydrogen (H2) and uranium removal efficiency as a function of the manganese content (% Mn) of the tested materials. The volume of H2 produced by individual materials varies from 40 mL for HGM to 192 mL for ST2. The increasing order of the material performances at producing H2 as confirmed by Table 4 is as follows: HGM < C60 < S15 < HGG ≈ C100 < S69 < C45 < C15 < GGG < DRI < ST1 < ST2. Notably, the increasing order for total uranium removal efficiency (E values) by the various materials is not different from the trend presented in Section 3.2: ST1 < HGG < ST2 < HGM < C45 < C15 < C60 < C100 < GGG < S15 < DRI < S69. A comparative analysis from Figure 4 clearly shows that data are scattered, without any trend. This suggests that H2 evolution and uranium removal are two independent processes. In fact, it can be clearly seen that the highest values of one do not always directly correspond, on average, to the highest nor the lowest values of the other. The following results clearly illustrate the lack of a trend: (i) the material which produced the highest volume of H2 (ST2) was among the least efficient materials at removing uranium; (ii) DRI was on one hand among the materials with the highest E values, and on the other hand, equally among those which produced the highest H2 volume; (iii) HGM produced the lowest volume of H2 but performed better at uranium removal than ST2; and (iv) S69 which depicted the greatest uranium removal efficiency was neither among the materials which produced the highest nor the lowest H2 volume. It thus appears that there is no direct causality relationship between H2 evolution and uranium removal and vice versa. In other words, unlike with the EDTA test [38], there is no correlation between the H2 production test and uranium removal. With the EDTA test of Noubactep et al. [38], the dissolution behavior of Fe0 in a 2.0 mM EDTA complexing solution was found to directly represent the reactivity of Fe0 materials for uranium removal. Correlation analysis confirmed no significant relationship between H2 produced and E (r = −0.168, p = 0.3). However, a weak but significant relationship was observed between uranium removal efficiency (E) and KEDTA (r = 0.56, p = 0.03).
In an attempt to develop tests for reactivity characterization for Fe0 materials used for groundwater remediation or water treatment screening, many research groups have used a comparative study based on contaminant removal in aqueous solution to validate their tests [18,19,22,38,54,55]. Table 5 gives some details about some of these researches. Compared to the H2 production test evaluated in the current study, which was performed at pH 2, a common point to all the other tests is that they were developed at pH > 4.5. Under this near-natural experimental condition, it can be seen that Noubactep et al. [38] used uranium removal to validate their EDTA test. The EDTA test was years later used as reference by Lufingo et al. [22] to validate the Phen test. Kim et al. [18] used the removal of CAHs and PCP by Fe0 to validate the Iodine method. CAHs were also used a year earlier by Velimirovic et al. [54] to validate the H2 evolution at neutral pH values. From this presentation, two key points can be derived: (i) uranium is a reliable compound for validating a Fe0 reactivity characterization test, and (ii) a correlation between the H2 production test and a probe contaminant removal by Fe0 is lacking. This indicates that the production of H2 under acidic conditions is the main reason why an absence of correlation between the H2 production test and uranium removal is observed in the present study. In fact, H2 evolution at pH 2 occurs with a completely different mechanism to that of uranium removal by Fe0 under environmental conditions. Therefore, the main merit of the H2 production test as presented in this study is to show the trends of Fe0 reactivity during the initial phase of the experiment under neutral pH values (Figure 5).

4. Fe0 Materials for Water Treatment

4.1. Fe0 Materials

Cast iron and mild steel are unequaled in terms of mechanical and physical properties derived from alloying and heat-treatment. Almost all these materials corrode in a wide range of aqueous environments [20,23,33,38,56,57,58]. Some general statements occur in the literature on the effects of alloying on the corrosion properties of cast iron and mild steel in water [57,59]. Despite the large number of publications about cast iron and mild steel corrosion, the interaction of the alloying components and impurities has not yet been established; rather, only empirical guides exist [21,34,43,60].
In testing Fe0 (cast iron and mild steel) for groundwater remediation, controversial results have been reported [21,43,61]. This is not surprising, since the materials were not selected and tested systematically but, rather, in an arbitrary manner. Moreover, it is almost impossible to produce two batches of an iron material with exactly identical properties. Therefore, the effect of alloying element on the efficiency of the material can only be assessed by working with different lots of materials from the same producer and, if possible, manufactured under similar conditions [20,22].
This study confirms the results from previous studies suggesting cast irons as better materials for water treatment than mild steels [61,62]. This choice has been mainly justified by their low cost and ready availability. The mode of their homogeneous surface corrosion induced by the presence of regularly distributed traces of sulfur (S) and carbides (Fe3C) in their structure are further arguments for their preference [32,60].
Note that cast iron and mild steel such as those currently used for water treatment were originally manufactured and tested for their corrosion resistance. In such manufacturing and testing processes, efforts are made, to exclude corrosive additives or impurities such as sulfur (S) or phosphorus (P) from the resulting materials (Table 3 and Figure 1). Keeping this in mind and considering the demonstrated favorable role of sulfur in the decontamination process with Fe0 [37,63,64], it is logical that Fe0/S composites have shown increased performance for water treatment [65,66]. Therefore, in manufacturing conventional Fe0 materials, efforts have to be undertaken to avoid the presence of classical alloying elements such as Ni and Cr, while additives or impurities that increase contaminant removal can be allowed. This is particularly important, if the materials are to be obtained from recycled materials. If on the contrary, materials are to be obtained from iron ores, there is no need of alloying in the classical sense [6,44]. To sum up, S is to be considered as an alloying element for Fe0 materials that are to be manufactured by direct reduction from iron ores [66].

4.2. Long-Term Performance of Fe0 Materials

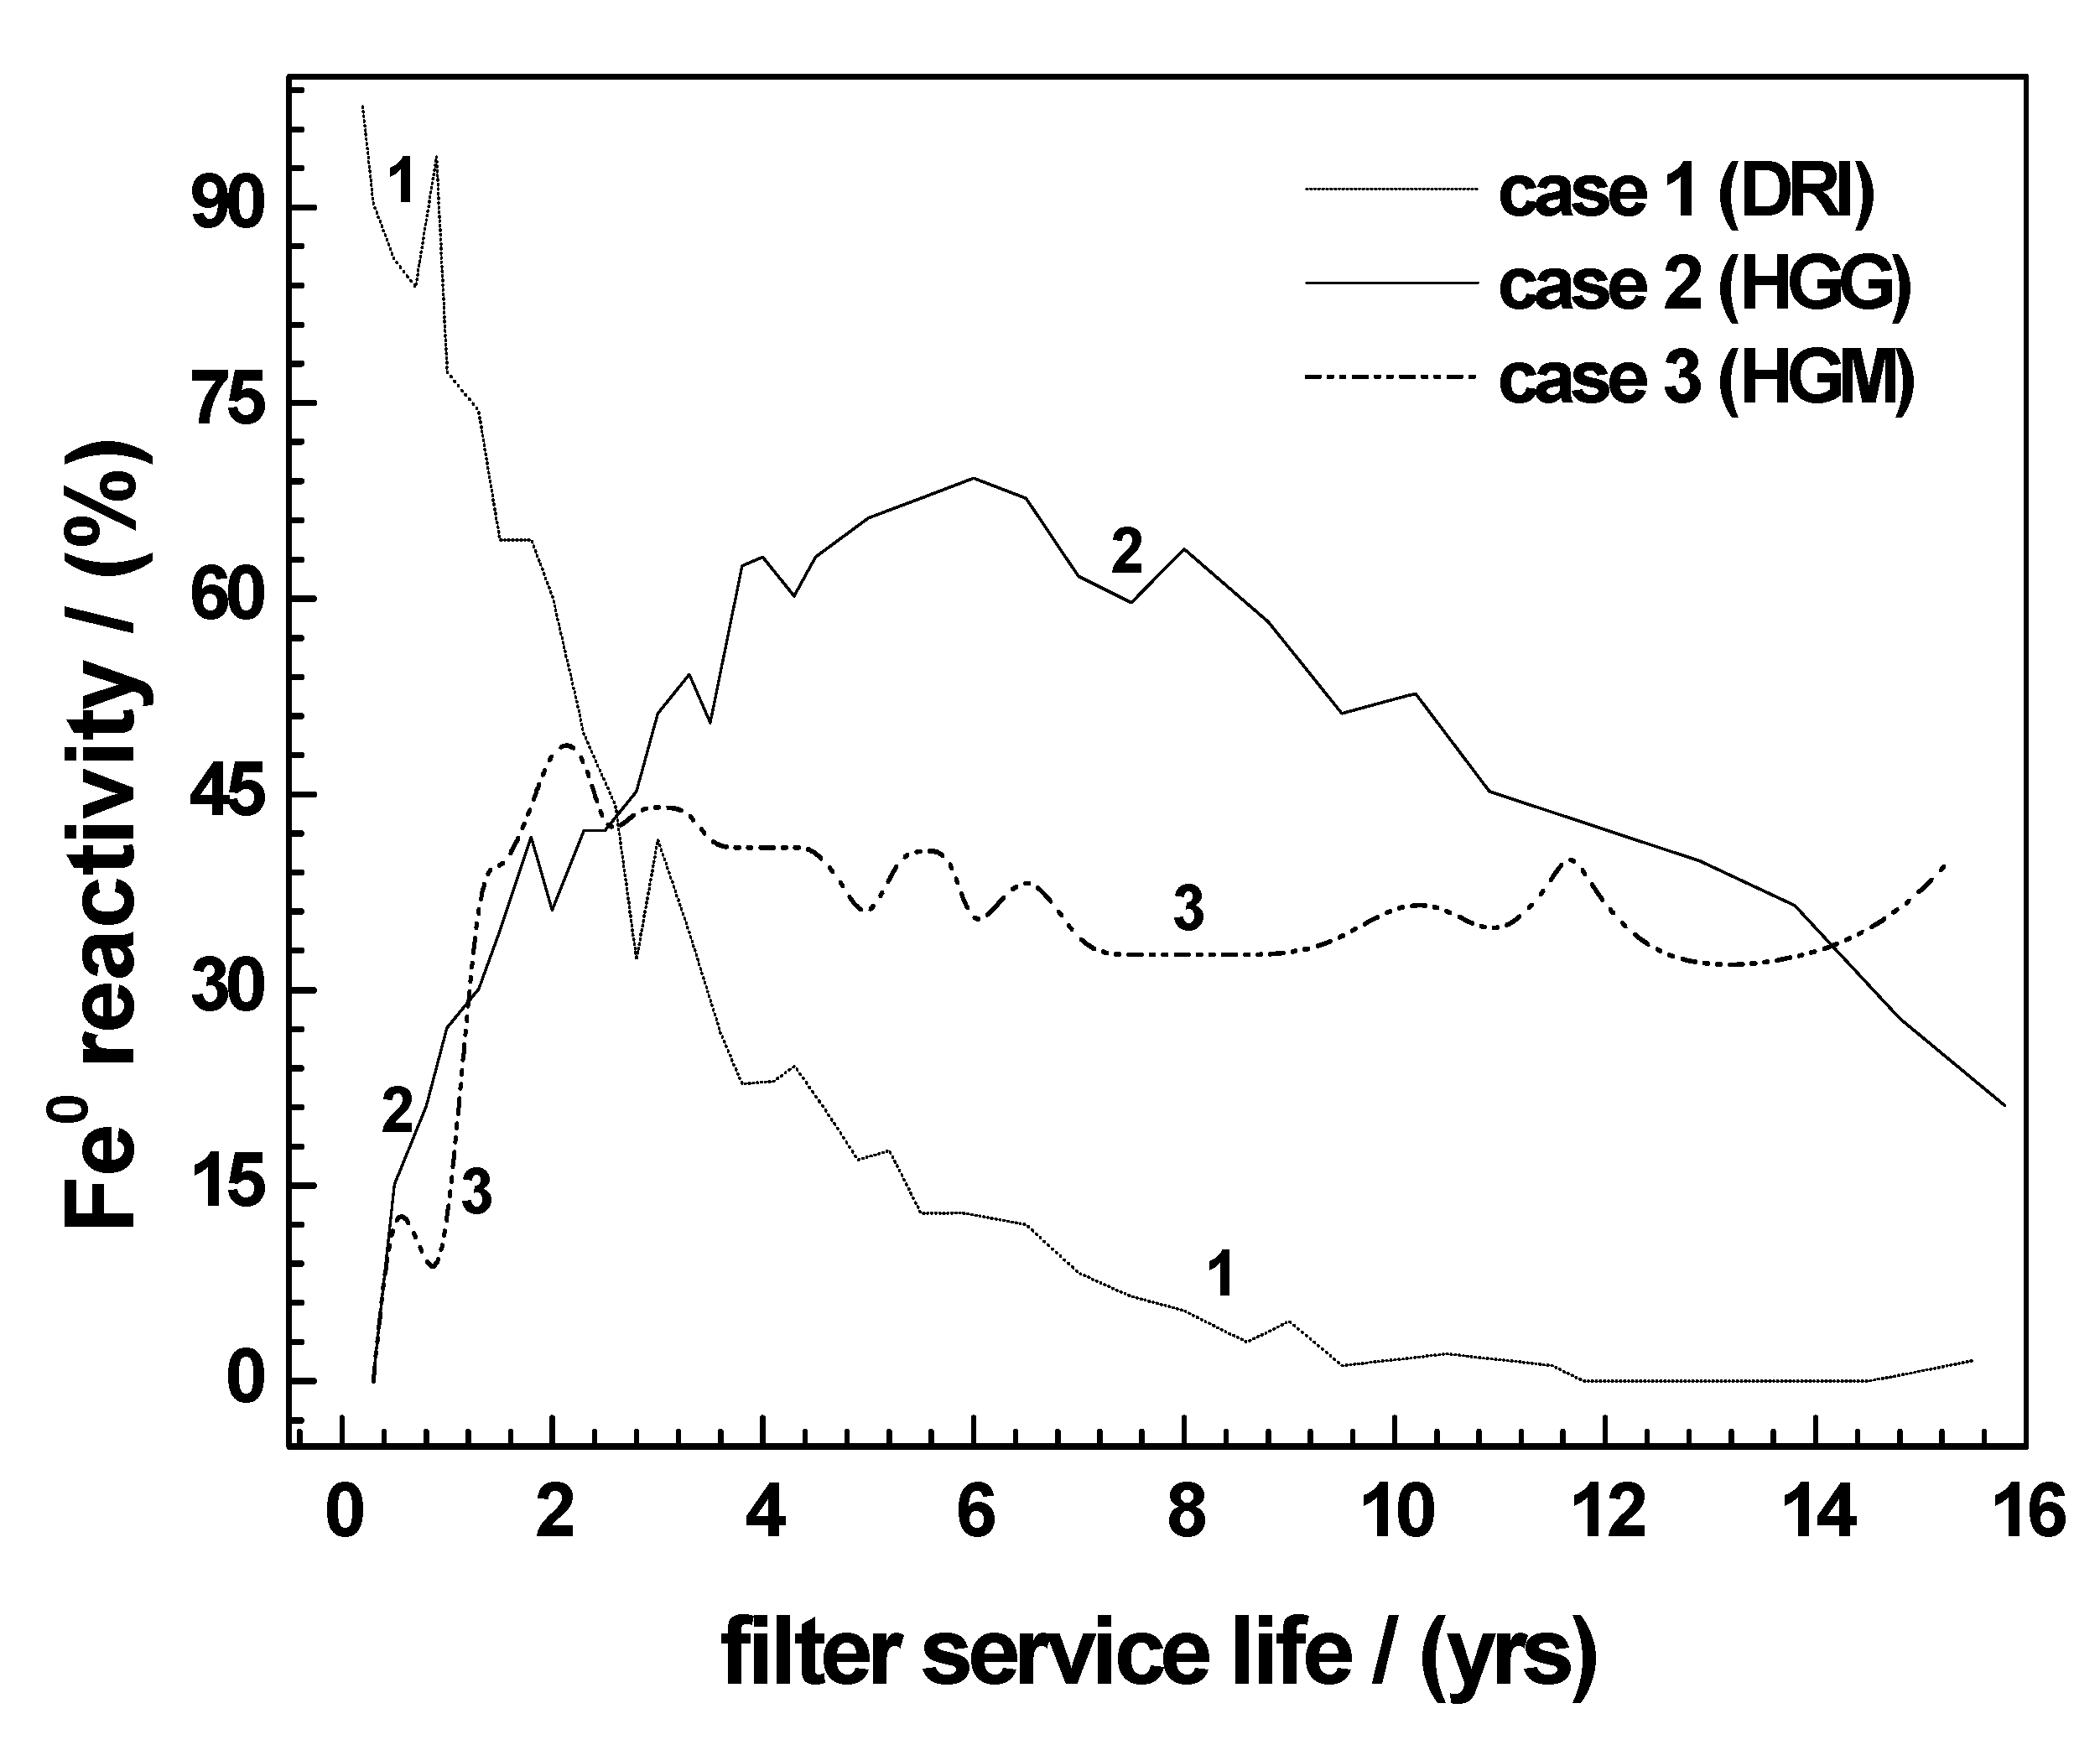
Available or new materials for water treatment have to be tested for their long-term performance as a function of the site-specific conditions. Some insights on the long-term performance of the Fe0 material can be gleaned from the three main cases evident in Figure 5. The scenarios have been deduced from Figure 3c by changing the time from hours to years on the x-axes and transforming the H2 production rate on the y-axes to an arbitrary normalized relative reactivity for DRI, HGG, and HGM. The resulting trends suggest that, in any natural environment, Fe0 materials can be sought (newly manufactured or selected from available materials) that are able to react in three different ways. The first class of materials (case 1) encompasses those which react very rapidly in their initial phase of exploitation as a reactive barrier, and the reactivity then decreases continually with the time. This scenario can be helpful for the following conditions: (i) if the contaminant source is well-identified (i.e., point source) and (ii) the contaminant transport to the barrier is rapid, and it is not expected that more contaminant will be produced over time (instantaneous). Typical examples include spillages and once-off leakages from underground utility pipes. In this case, it is possible that the active lifespan of the Fe0 material (here 5–8 years) be sufficient for satisfactory decontamination.
The second class of materials (case 2) reacts slowly in the initial phase of the reactive bed operation, and the reactivity increases continually to a maximum (4th to 8th year). Thereafter, the reactivity decreases progressively with time. Assuming that there is no additional source of contaminant, such a material can assure a satisfactory decontamination for 20 years or more, since its final corrosion rate (i.e., after 16 years) is still considerable (30%). By then, the contaminant concentration should have decreased considerably. Typical real-life examples may include mining sites with potential for generating acid mine drainage, where initial contaminant release may be initially slow, reaching a peak at a given time, before dropping due to exhaustion of the contaminant source.
The third class of materials (case 3) reacts slowly in the initial phase of the reactive bed operation, and the corrosion rate remains constant for decades. It is obvious that this case is the ideal condition being implicitly considered for modelling purposes, even though the “initiation phase” is often ignored. However, little has been done to consider local site-specific aspects such as the nature of pollution source (instantaneous versus continuous) and time evolution of contaminants [32,40].
Taken together, these deductions imply that the suitable materials are not necessarily the most reactive materials as suggested by laboratory experiments based on the current testing approaches [20,22,38,40,67]. In some cases, for a specific application, a mixture of materials from different classes can be helpful. For example, if it is expected that the contaminant concentration will decrease considerably after 3 years and remain constant for a long time, then a mixture of materials from the classes 1 and 2 or classes 1 and 3 can be used. Thus, the suitable material for each remediation problem should be decided on a case-by-case basis taking into account the nature of the pollution sources and its evolution over time.

4.3. Future Perspectives

Fe0 materials used for water treatment and environmental remediation comprise of iron filings, iron composites (e.g., bimetallics), iron nails, iron wire, nano-Fe0 including its composites, scrap iron, sponge iron, and steel wool originating from a variety of primary manufacturing processes. Each material is unique in its intrinsic reactivity and so is its efficiency for the treatment of a given polluted water [22,23]. Past efforts to understand the reason for differences in material efficiencies have examined the elemental composition, the metallurgical properties, and the surface properties including the surface area [21,43,68]. The surface of the in situ generated oxide scale has also been examined. The results of three decades of intensive research can be summarized in one statement as follows: There is no apparent correlations arising between observed efficiency for contaminant removal and physico-chemical characteristics of the materials [20,21,22,23,42,68].
The large majority of the available works has focused on differentiating the Fe0 reactivity based on their efficiency for the removal of selected contaminants [19,38]. The shortcomings of this approach have already been largely discussed [18,19,21,22]. It will just be recalled and stressed here that contaminant removal in Fe0/H2O systems is not an electro-chemical process. Thus, the stoichiometry of iron corrosion cannot be used to assess the extent of Fe0 depletion. Sixteen (16) years ago, Lee et al. [69] regretted that mechanistic discussions are performed without mass balance considerations, yet this situation has not changed to date [16,28]. The mass balance should start with that of iron. For example, under the experimental conditions of this work, 2.0 g or 35.7 mM of Fe0 is allowed to dissolve in 0.01 H2SO4. Then, if complete Fe0 depletion is achieved, 800 cm3 of molecular H2 is produced according to Equation (1). Table 4 shows that ST2 is the material releasing the largest H2 volume (192 cm3). Thus, the maximum ratio of material depletion was ¼ (25%). A similar calculation for the EDTA test reveals that just 0.12% of used material (0.1 g) is depleted at solution saturation. In this case, solution saturation corresponds to Fe: EDTA = 1:1, equivalent to [Fe] = 112 mg L−1 (2 mM). In real systems, Fe0 dissolution is certainly slower, but the discussion of its impact on the decontamination process is complicated by the evidence that experimental vessels were more or less vigorously mixed, and the mixing intensities were different from one work to another [36,70].
To the best of the authors’ knowledge, the H2 evolution test used herein is novel in the peer-review literature. Only Landis et al. [68] has reported on a similar approach in a conference proceeding. In Landis et al. [68], the authors used a 1:1 HCl digestion of “as received” Fe0 specimens (Fe0 + atmospheric FeCPs) and monitored the elemental composition of the leachate using inductively coupled plasma (ICP) analyses. On the contrary, the H2 evolution at pH 2.0 (H2SO4-0.01 M) used in the current study is rooted on the evidence that quantitative H2 production by a fixed amount of Fe0 will stop when its dissolution raises the pH to values close to 3.1. Therefore, an artificial system is created, wherein the trends of reactivity of various Fe0 specimens can be differentiated. In other words, in the H2 evolution test under acidic conditions, far more Fe0 dissolution occurs than under natural conditions, and Fe0 dissolution occurs with a different mechanism. However, a realistic understanding of the trend of the time-dependent Fe0 depletion is obtained and should be used as a basis for future modeling works.
For field implementations, fundamental and technical obstacles are expected, which should be addressed for sustainable remediation systems. For example, the formation of FeCPs (Fe hydroxides and oxides) implies a concomitant decrease of the corrosion kinetics, and thus, a decrease of the kinetics of generation of contaminant scavengers with increasing service life. Furthermore, the volumetric expansive nature of aqueous iron corrosion causes a decrease of the hydraulic conductivity in filtration systems [71,72,73]. In other words, the challenge of the Fe0 research community is to design long-term efficient systems, while accounting for two inherent characteristics of aqueous iron corrosion. The two inherent characteristics are: (i) decreased reaction rates due to formation of FeCPs (“reactivity loss”) and (ii) decreased hydraulic conductivity (permeability loss). This statement corresponds to the state-of-the-art knowledge on Fe0 filters as summarized thirteen years ago by Henderson and Demond [74]. Yet nearly 22 years later, this has not changed, suggesting that the past two decades can be regarded as lost ones [37]. The root cause for this stagnation was identified by Ghauch [10] and attributed to the refusal of the research community to reconsider the mechanistic discussion. Specifically, the critical reviews of Noubactep [36,70] demonstrating that Fe0 is not likely to play any significant direct role (electron transfer) in the documented reductive processes have remained largely ignored. This view is in tune with the concept of Khudenko [75], who used copper salts to induce reductive transformation of organic pollutants by primary iron corrosion products (FeII and H/H2 species). In other words, for the rational design of sustainable Fe0-based filtration systems, engineers are facing difficulties in determining the appropriate Fe0 amount to use and the thickness of the reactive layer [16,76]. The H2 evolution test presented herein has further deepened the vagueness as it illustrated that an initially very reactive material can become much less reactive after some time. However, revealing this is a chance to systematically conduct long-term pilot testing of Fe0-based remediation systems. A rule of thumb is, “no experiment lasting for less than one year can be considered as long enough” as far as long-term testing of filtration systems is concerned [5,23,76].

5. Conclusions

This study supports the evidence that cast irons are more suitable than mild steels for water treatment. Moreover, selected scrap irons can be successfully used instead of commercial materials. Next to the chemical composition of cast iron and middle steels, their surface state (roughness, porosity, corrosion state) appears to determine the efficiency in removing uranium from aqueous solutions. A larger number of parameters seems to influence the contaminant removal. Their individual effects can only be assessed by carefully manufacturing materials and testing them under relevant conditions. It is expected that this approach will enable the manufacture of iron materials appropriate for various site-specific conditions.
Information generated from this study is important for the application of Fe0 for remediation processes. While researchers have been concerned about the possible cessation of the remediation process once iron oxides are formed on the surface of metallic iron, Huang et al. [77] for instance showed that, under anoxic conditions, the magnetite coating will not hinder nitrate reduction provided sufficient aqueous Fe2+ is present in the system. In fact, iron corrosion (Fe2+ production) cannot stop, since the formation of adhesive layer of iron oxides is not possible [16,78,79,80,81]. Thus, the most important question now is to know whether in the long-term the produced amount of Fe2+ (FeCPs) will satisfactorily yield the expected remediation effect. Therefore, on the one hand, materials able to corrode intrinsically in the long-term are to be manufactured and tested. On the other hand, the selection of a material for a target application is to be performed in such a way that the corrosion enhancement (or inhibition) in site specific conditions can be taken into account.

Author Contributions

Conceptualization, C.N.; formal analysis, A.I.N.-T., R.H., W.G., A.N., and C.N.; investigation, C.N.; methodology, C.N.; writing—original draft, C.N. and A.I.N.-T.; writing—review and editing, A.I.N.-T., R.H., W.G., A.N., and C.N. All authors have read and agreed to the published version of the manuscript.

Funding

This work is supported by the Ministry of Science and Technology of China through the Program “Research on Mechanism of Groundwater Exploitation and Seawater Intrusion in Coastal Areas” (Project Code 20165037412) and by the Ministry of Education of China through “the Fundamental Research Funds for the Central Universities” (Project Code: 2015B29314). It is also supported by Jiangsu Provincial Department of Education (Project Code 2016B1203503) and Postgraduate Research and Practice Innovation Program of Jiangsu Province (Project Code: SJKY19_0519, 2019B60214).

Acknowledgments

The authors would like to express their gratitude to R. Köber from the Institute of Earth Science of the University of Kiel, who kindly provided the commercial Fe0 samples. The model steels C15, C45, C60, and C100 were provided by Zimdars from the Institute of Material Technique of the Technical University Mining Academy Freiberg; the samples denoted as ST1 and ST2 were kindly recommended and provided by M. Sekul from the workshop of the Institute of Geology (Technical University Mining Academy Freiberg). The manuscript was improved by insightful comments of anonymous reviewers from Water. Data on H2 evolution are from the PhD work of CN, achieved in the framework of the grant “Deutsche Forschungsgemeinschaft (DFG-GK 272)”. We acknowledge support by the German Research Foundation and the Open Access Publication Funds of the Göttingen University.

Conflicts of Interest

The authors declare no conflict of interest.

References

  1. Devonshire, E. The purification of water by means of metallic iron. J. Frankl. Inst. 1890, 129, 449–461. [Google Scholar] [CrossRef]
  2. Brown, G.E., Jr.; Henrich, V.E.; Casey, W.H.; Clark, D.L.; Eggleston, C.; Felmy, A.; Goodman, D.W.; Grätzel, M.; Maciel, G.; McCarthy, M.I.; et al. Metal oxide surfaces and their interactions with aqueous solutions and microbial organisms. Chem. Rev. 1999, 99, 77–174. [Google Scholar] [CrossRef] [Green Version]
  3. You, Y.; Han, J.; Chiu, P.C.; Jin, Y. Removal and inactivation of waterborne viruses using zerovalent iron. Environ. Sci. Technol. 2005, 39, 9263–9269. [Google Scholar] [CrossRef] [PubMed]
  4. Bradley, I.; Straub, A.; Maraccini, P.; Markazi, S.; Nguyen, T.H. Iron oxide amended biosand filters for virus removal. Water Res. 2011, 45, 4501–4510. [Google Scholar] [CrossRef] [PubMed] [Green Version]
  5. Tepong-Tsindé, R.; Ndé-Tchoupé, A.I.; Noubactep, C.; Nassi, A.; Ruppert, H. Characterizing a newly designed steel-wool-based household filter for safe drinking water provision: Hydraulic conductivity and efficiency for pathogen removal. Processes 2019, 7, 966. [Google Scholar] [CrossRef] [Green Version]
  6. Bischof, G. The Purification of Water: Embracing the Action of Spongy Iron on Impure Water; Bell and Bain: Glasgow, UK, 1873; p. 19. [Google Scholar]
  7. Lauderdale, R.A.; Emmons, A.H. A method for decontaminating small volumes of radioactive water. J. Am. Water Work. Assoc. 1951, 43, 327–331. [Google Scholar] [CrossRef]
  8. Gheju, M. Hexavalent chromium reduction with zero-valent iron (ZVI) in aquatic systems. Water Air Soil Pollut. 2011, 222, 103–148. [Google Scholar] [CrossRef]
  9. Obiri-Nyarko, F.; Grajales-Mesa, S.J.; Malina, G. An overview of permeable reactive barriers for in situ sustainable groundwater remediation. Chemosphere 2014, 111, 243–259. [Google Scholar] [CrossRef]
  10. Ghauch, A. Iron-based metallic systems: An excellent choice for sustainable water treatment. Freib. Online Geosci. 2015, 38, 1–80. [Google Scholar]
  11. Guan, X.; Sun, Y.; Qin, H.; Li, J.; Lo, I.M.C.; He, D.; Dong, H. The limitations of applying zero-valent iron technology in contaminants sequestration and the corresponding countermeasures: The development in zero-valent iron technology in the last two decades (1994–2014). Water Res. 2015, 75, 224–248. [Google Scholar] [CrossRef]
  12. Banerji, T.; Chaudhari, S. A cost-effective technology for arsenic removal: Case study of zerovalent iron-based IIT Bombay arsenic filter in West Bengal. In Water and Sanitation in the New Millennium; Nath, K., Sharma, V., Eds.; Springer: New Delhi, India, 2017. [Google Scholar]
  13. Wakatsuki, T.; Esumi, H.; Omura, S. High performance and N, P removable on-site domestic wastewater treatment system by multi-soil-layering method. Water Sci. Technol. 1993, 27, 31–40. [Google Scholar] [CrossRef]
  14. Hering, J.G.; Maag, S.; Schnoor, J.L. A call for synthesis of water research to achieve the sustainable development goals by 2030. Environ. Sci. Technol. 2016, 50, 6122–6123. [Google Scholar] [CrossRef] [PubMed] [Green Version]
  15. Nanseu-Njiki, C.P.; Gwenzi, W.; Pengou, M.; Rahman, M.A.; Noubactep, C. Fe0/H2O filtration systems for decentralized safe drinking water: Where to from here? Water 2019, 11, 429. [Google Scholar] [CrossRef] [Green Version]
  16. Hu, R.; Yang, H.; Tao, R.; Cui, X.; Xiao, M.; Amoah, B.K.; Cao, V.; Lufingo, M.; Soppa-Sangue, N.P.; Ndé-Tchoupé, A.I.; et al. Metallic iron for environmental remediation: Starting an overdue progress in knowledge. Water 2020, 12, 641. [Google Scholar] [CrossRef] [Green Version]
  17. Btatkeu-K, B.D.; Miyajima, K.; Noubactep, C.; Caré, S. Testing the suitability of metallic iron for environmental remediation: Discoloration of methylene blue in column studies. Chem. Eng. J. 2013, 215–216, 959–968. [Google Scholar] [CrossRef] [Green Version]
  18. Kim, H.; Yang, H.; Kim, J. Standardization of the reducing power of zero-valent iron using iodine. J. Environ. Sci. Health Part A 2014, 49, 514–523. [Google Scholar] [CrossRef]
  19. Li, S.; Ding, Y.; Wang, W.; Lei, H. A facile method for determining the Fe0 content and reactivity of zero-valent iron. Anal. Methods 2016, 8, 1239–1248. [Google Scholar] [CrossRef]
  20. Hu, R.; Cui, X.; Xiao, M.; Qiu, P.; Lufingo, M.; Gwenzi, W.; Noubactep, C. Characterizing the suitability of granular Fe0 for the water treatment industry. Processes 2019, 7, 652. [Google Scholar] [CrossRef] [Green Version]
  21. Li, J.; Dou, X.; Qin, H.; Sun, Y.; Yin, D.; Guan, X. Characterization methods of zerovalent iron for water treatment and remediation. Water Res. 2019, 148, 70–85. [Google Scholar] [CrossRef]
  22. Lufingo, M.; Ndé-Tchoupé, A.I.; Hu, R.; Njau, K.N.; Noubactep, C. A novel and facile method to characterize the suitability of metallic iron for water treatment. Water 2019, 11, 2465. [Google Scholar] [CrossRef] [Green Version]
  23. Hildebrant, B.; Ndé-Tchoupé, A.I.; Lufingo, M.; Licha, T.; Noubactep, C. Steel wool for water treatment: Intrinsic reactivity and defluoridation efficiency. Processes 2020, 8, 265. [Google Scholar] [CrossRef] [Green Version]
  24. Lavine, B.K.; Auslander, G.; Ritter, J. Polarographic studies of zero valent iron as a reductant for remediation of nitroaromatics in the environment. Microchem. J. 2001, 70, 69–83. [Google Scholar] [CrossRef]
  25. Furukawa, Y.; Kim, J.-W.; Watkins, J.; Wilkin, R.T. Formation of ferrihydrite and associated iron corrosion products in permeable reactive barriers of zero-valent iron. Environ. Sci. Technol. 2002, 36, 5469–5475. [Google Scholar] [CrossRef] [PubMed]
  26. Luo, P.; Bailey, E.H.; Mooney, S.J. Quantification of changes in zero valent iron morphology using X-ray computed tomography. J. Environ. Sci. 2013, 25, 2344–2351. [Google Scholar] [CrossRef]
  27. Btatkeu-K, B.D.; Tchatchueng, J.B.; Noubactep, C.; Caré, S. Designing metallic iron based water filters: Light from methylene blue discoloration. J. Environ. Manag. 2016, 166, 567–573. [Google Scholar] [CrossRef] [PubMed]
  28. Noubactep, C. Metallic iron for environmental remediation: Prospects and limitations. In A Handbook of Environmental Toxicology: Human Disorders and Ecotoxicology; D’Mello, J.P.F., Ed.; CAB International: Wallingford, UK, 2020; Chapter 36; pp. 531–544. [Google Scholar]
  29. Noubactep, C. A framework for technology development in Africa: The case of metallic iron (Fe0) water filters for safe drinking water provision. In Science and Biotechnology in Africa: Proceedings of a Conference on Scientific Advancement; Kapalanga, J., Raphael, D., Mutesa, L., Eds.; Cambridge Scholars Publishing: New Castle, UK, 2020; pp. 111–139. [Google Scholar]
  30. El-Meligi, A.A.; Ismail, N. Hydrogen evolution reaction of low carbon steel electrode in hydrochloric acid as a source for hydrogen production. Int. J. Hydrogen Energy 2009, 34, 91–97. [Google Scholar] [CrossRef]
  31. Reardon, J.E. Zerovalent irons: Styles of corrosion and inorganic control on hydrogen pressure buildup. Environ. Sci. Technol. 2005, 39, 7311–7317. [Google Scholar] [CrossRef]
  32. Noubactep, C. Untersuchungen zur Passiven In-Situ-Immobilisierung von U(VI) aus Wasser. Ph.D. Thesis, TU Bergakademie Freiberg, Freiberg, Germany, 2003; pp. 21, 140. [Google Scholar]
  33. Klas, H.; Steinrath, H. Die Korrosion des Eisens und ihre Verhütung; Stahleisen: Düsseldorf, Germany, 1974; p. 632. [Google Scholar]
  34. Whitman, G.W.; Russel, R.P.; Altieri, V.J. Effect of hydrogen-ion concentration on the submerged corrosion of steel. Ind. Eng. Chem. 1924, 16, 665–670. [Google Scholar] [CrossRef]
  35. Stratmann, M.; Müller, J. The mechanism of the oxygen reduction on rust-covered metal substrates. Corros. Sci. 1994, 36, 327–359. [Google Scholar] [CrossRef]
  36. Noubactep, C. A critical review on the mechanism of contaminant removal in Fe0–H2O systems. Environ. Technol. 2008, 29, 909–920. [Google Scholar] [CrossRef] [Green Version]
  37. Xiao, M.; Hu, R.; Cui, X.; Gwenzi, W.; Noubactep, C. Understanding the operating mode of Fe0/Fe-sulfide/H2O systems for water treatment. Processes 2020, 8, 409. [Google Scholar] [CrossRef] [Green Version]
  38. Noubactep, C.; Meinrath, G.; Dietrich, P.; Sauter, M.; Merkel, B. Testing the suitability of zerovalent iron materials for reactive Walls. Environ. Chem. 2005, 2, 71–76. [Google Scholar] [CrossRef]
  39. Jiao, Y.; Qiu, C.; Huang, L.; Wu, K.; Ma, H.; Chen, S.; Ma, L.; Wu, L. Reductive dechlorination of carbon tetrachloride by zero-valent iron and related iron corrosion. Appl. Catal. B Environ. 2009, 91, 434–440. [Google Scholar] [CrossRef]
  40. Ndé-Tchoupé, A.I. Design and Construction of Fe0-Based Filters for Households. Ph.D. Thesis, University of Douala, Douala, Cameroon, 2019; p. 198. (In French). [Google Scholar]
  41. Reardon, J.E. Anaerobic corrosion of granular iron: Measurement and interpretation of hydrogen evolution rates. Environ. Sci. Technol. 1995, 29, 2936–2945. [Google Scholar] [CrossRef] [PubMed]
  42. Miehr, R.; Tratnyek, G.P.; Bandstra, Z.J.; Scherer, M.M.; Alowitz, J.M.; Bylaska, J.E. Diversity of contaminant reduction reactions by zerovalent iron: Role of the reductate. Environ. Sci. Technol. 2004, 38, 139–147. [Google Scholar] [CrossRef] [PubMed]
  43. Birke, V.; Schuett, C.; Burmeier, H.; Friedrich, H.-J. Impact of trace elements and impurities in technical zero-valent iron brands on reductive dechlorination of chlorinated ethenes in groundwater. In Permeable Reactive Barrier Sustainable Groundwater Remediation; Naidu, R., Birke, V., Eds.; CRC Press: Boca Raton, FL, USA, 2015; ISBN 978-1-4822-2447-4. [Google Scholar]
  44. Hussam, A.; Munir, A.K.M. A simple and effective arsenic filter based on composite iron matrix: Development and deployment studies for groundwater of Bangladesh. J. Environ. Sci. Health 2007, 42, 1869–1878. [Google Scholar] [CrossRef]
  45. Meinrath, G.; Volke, P.; Helling, C.; Dudel, E.G.; Merkel, P. Determination and interpretation of environmental water samples contaminated by uranium mining activities. Fresenius J. Anal. Chem. 1999, 364, 191–202. [Google Scholar] [CrossRef]
  46. HACH DR/2000: UV-Vis Spectrophotometer (Procedures and Reference): Parameters, Methods, and Ranges. Available online: https://www.hach.com/dr-2000-spectrophotometer/product-downloads?id=7640439022 (accessed on 1 May 2020).
  47. Meinrath, G.; Spitzer, P. Uncertainties in determination of pH. Mikrochim. Acta 2000, 135, 155–168. [Google Scholar] [CrossRef]
  48. Buck, R.P.; Rondinini, S.; Covington, A.K.; Baucke, F.G.K.; Brett, C.M.A.; Camoes, M.F.; Milton, M.J.T.; Mussini, T.; Naumann, R.; Pratt, K.W.; et al. Measurement of pH: Definition, standards, and procedures (IUPAC recommendations 2002). Pure Appl. Chem. 2002, 74, 2169–2200. [Google Scholar] [CrossRef] [Green Version]
  49. Ahaneka, I.E.; Kamal, A.R.; Ogunjirin, O.A. Effects of heat treatment on the properties of mild steel using quenchants. Front. Sci. 2012, 2, 153–158. [Google Scholar] [CrossRef] [Green Version]
  50. Seikh, A.H. Influence of heat treatment on the corrosion of microalloyed steel in sodium chloride solution. J. Chem. 2013, 2013. [Google Scholar] [CrossRef] [Green Version]
  51. Scendo, M.; Szczerba, K. influence of heat treatment on corrosion of mild steel coated with WC-Co-Al2O3 cermet composite produced by electrospark deposition. Int. J. Electrochem. Sci. 2019, 14, 1009–1023. [Google Scholar] [CrossRef]
  52. Noubactep, C.; Meinrath, G.; Dietrich, P.; Merkel, B. Mitigating uranium in groundwater: Prospects and limitations. Environ. Sci. Technol. 2003, 37, 4304–4308. [Google Scholar] [CrossRef] [PubMed] [Green Version]
  53. Noubactep, C.; Schöner, A.; Meinrath, G. Mechanism of uranium (VI) fixation by elemental iron. J. Hazard. Mater. 2006, 132, 202–212. [Google Scholar] [CrossRef] [Green Version]
  54. Velimirovic, M.; Larsson, P.-O.; Simons, Q.; Bastiaens, L. Reactivity screening of microscale zerovalent irons and iron sulphides towards different CAHs under standardized experimental conditions. J. Hazard. Mater. 2013, 252–253, 204–212. [Google Scholar] [CrossRef]
  55. Velimirovic, M.; Larsson, P.-O.; Simons, Q.; Bastiaens, L. Impact of carbon, oxygen and sulphur content of microscale zerovalent iron particles on its reactivity towards CAHs. Chemosphere 2013, 93, 2040–2045. [Google Scholar] [CrossRef]
  56. Piwowarsky, E. Gußeisen; Springer: Berlin/Heidelberg, Germany, 1951; p. 1070. [Google Scholar]
  57. Uhlig, H.H. Korrosion und Korrosionsschutz; Akademie Verlag: Berlin, Germany, 1975; p. 412. [Google Scholar]
  58. Mercer, A.D.; Lumbard, E.A. Corrosion of mild steel in water. Br. Corros. J. 1995, 30, 43–55. [Google Scholar] [CrossRef]
  59. Noubactep, C.; Schöner, A. Fe0-based alloys for environmental remediation: Thinking outside the box. J. Hazard. Mater. 2009, 165, 1210–1214. [Google Scholar] [CrossRef]
  60. Talbot, D.; Talbot, J. Corrosion Science & Technology; CRC Press LLC: Boca Raton, FL, USA; New York, NY, USA; Washington, DC, USA; London, UK, 1998; p. 406. [Google Scholar]
  61. Támara, M.L.; Butler, E.C. Effects of iron purity and groundwater characteristics on rates and products in the degradation of carbon tetrachloride by iron metal. Environ. Sci. Technol. 2004, 38, 1866–1876. [Google Scholar] [CrossRef]
  62. Rodenhäuser, J. Iron Material for the Remediation of DNAPL-Polluted Groundwater. Masters’s Thesis, The Royal Institute of Technology Stockholm, Stockholm, Sweden, 2003; p. 37. [Google Scholar]
  63. Lipczynska-Kochany, E.; Harms, S.; Milburn, R.; Sprah, G.; Nadarajah, N. Degradation of carbon tetrachloride in the presence of iron and sulphur containing compounds. Chemosphere 1994, 29, 1477–1489. [Google Scholar] [CrossRef]
  64. Butler, C.E.; Hayes, F.K. Factors influencing rates and products in the transformation of trichloroethylene by iron sulfide and iron metal. Environ. Sci. Technol. 2001, 35, 3884–3891. [Google Scholar] [CrossRef] [PubMed]
  65. Allred, B.J. Laboratory evaluation of zero valent iron and sulfur-modified iron for agricultural drainage water treatment. Ground Water Monit. Remediat. 2012, 32, 81–95. [Google Scholar] [CrossRef]
  66. Allred, B.J.; Tost, B.C. Laboratory comparison of four iron-based filter materials for water treatment of trace element contaminants. Water Environ. Res. 2014, 86, 2221–2232. [Google Scholar] [CrossRef] [PubMed]
  67. Hu, R.; Ndé-Tchoupé, A.I.; Lufingo, M.; Xiao, M.; Nassi, A.; Noubactep, C.; Njau, K.N. The impact of selected pre-treatment procedures on iron dissolution from metallic iron specimens used in water treatment. Sustainability 2019, 11, 671. [Google Scholar] [CrossRef] [Green Version]
  68. Landis, R.L.; Gillham, R.W.; Reardon, E.J.; Fagan, R.; Focht, R.M.; Vogan, J.L. An examination of zero-valent iron sources used in permeable reactive barriers. In Proceedings of the 3rd International Containment Technology Conference, Tallahassee, FL, USA, 10–13 June 2001. [Google Scholar]
  69. Lee, G.; Rho, S.; Jahng, D. Design considerations for groundwater remediation using reduced metals. Korean J. Chem. Eng. 2004, 21, 621–628. [Google Scholar] [CrossRef]
  70. Noubactep, C. Processes of contaminant removal in “Fe0–H2O” systems revisited. The importance of co-precipitation. Open Environ. J. 2007, 1, 9–13. [Google Scholar] [CrossRef] [Green Version]
  71. Domga, R.; Togue-Kamga, F.; Noubactep, C.; Tchatchueng, J.B. Discussing porosity loss of Fe0 packed water filters at ground level. Chem. Eng. J. 2015, 263, 127–134. [Google Scholar] [CrossRef]
  72. Moraci, N.; Lelo, D.; Bilardi, S.; Calabrò, P.S. Modelling long-term hydraulic conductivity behaviour of zero valent iron column tests for permeable reactive barrier design. Can. Geotech. J. 2016, 53, 946–961. [Google Scholar] [CrossRef]
  73. Noubactep, C. Predicting the hydraulic conductivity of metallic iron filters: Modeling gone astray. Water 2016, 8, 162. [Google Scholar] [CrossRef] [Green Version]
  74. Henderson, A.D.; Demond, A.H. Long-term performance of zero-valent iron permeable reactive barriers: A critical review. Environ. Eng. Sci. 2007, 24, 401–423. [Google Scholar] [CrossRef] [Green Version]
  75. Khudenko, B.M. Feasibility evaluation of a novel method for destruction of organics. Water Sci. Technol. 1991, 23, 1873–1881. [Google Scholar] [CrossRef]
  76. Naseri, E.; Ndé-Tchoupé, A.I.; Mwakabona, H.T.; Nanseu-Njiki, C.P.; Noubactep, C.; Njau, K.N.; Wydra, K.D. Making Fe0-based filters a universal solution for safe drinking water provision. Sustainability 2017, 9, 1224. [Google Scholar] [CrossRef] [Green Version]
  77. Huang, Y.H.; Zhang, T.C.; Shea, P.J.; Comfort, S.D.J. Effects of oxide coating and selected cations on nitrate reduction by iron metal. J. Environ. Qual. 2003, 32, 1306–1315. [Google Scholar] [CrossRef] [PubMed] [Green Version]
  78. Briehl, H. Chemie der Werkstoffe; B.G. Teubner: Stuttgart, Germany, 1995; p. 334. [Google Scholar]
  79. Souvent, P.; Pirc, S. Pollution caused by metallic fragments introduced into soils because of World War I activities. Environ. Geol. 2001, 40, 317–323. [Google Scholar] [CrossRef]
  80. Noubactep, C. The suitability of metallic iron for environmental remediation. Environ. Prog. 2010, 29, 286–291. [Google Scholar] [CrossRef] [Green Version]
  81. Noubactep, C. The fundamental mechanism of aqueous contaminant removal by metallic iron. Water SA 2010, 36, 663–670. [Google Scholar] [CrossRef] [Green Version]
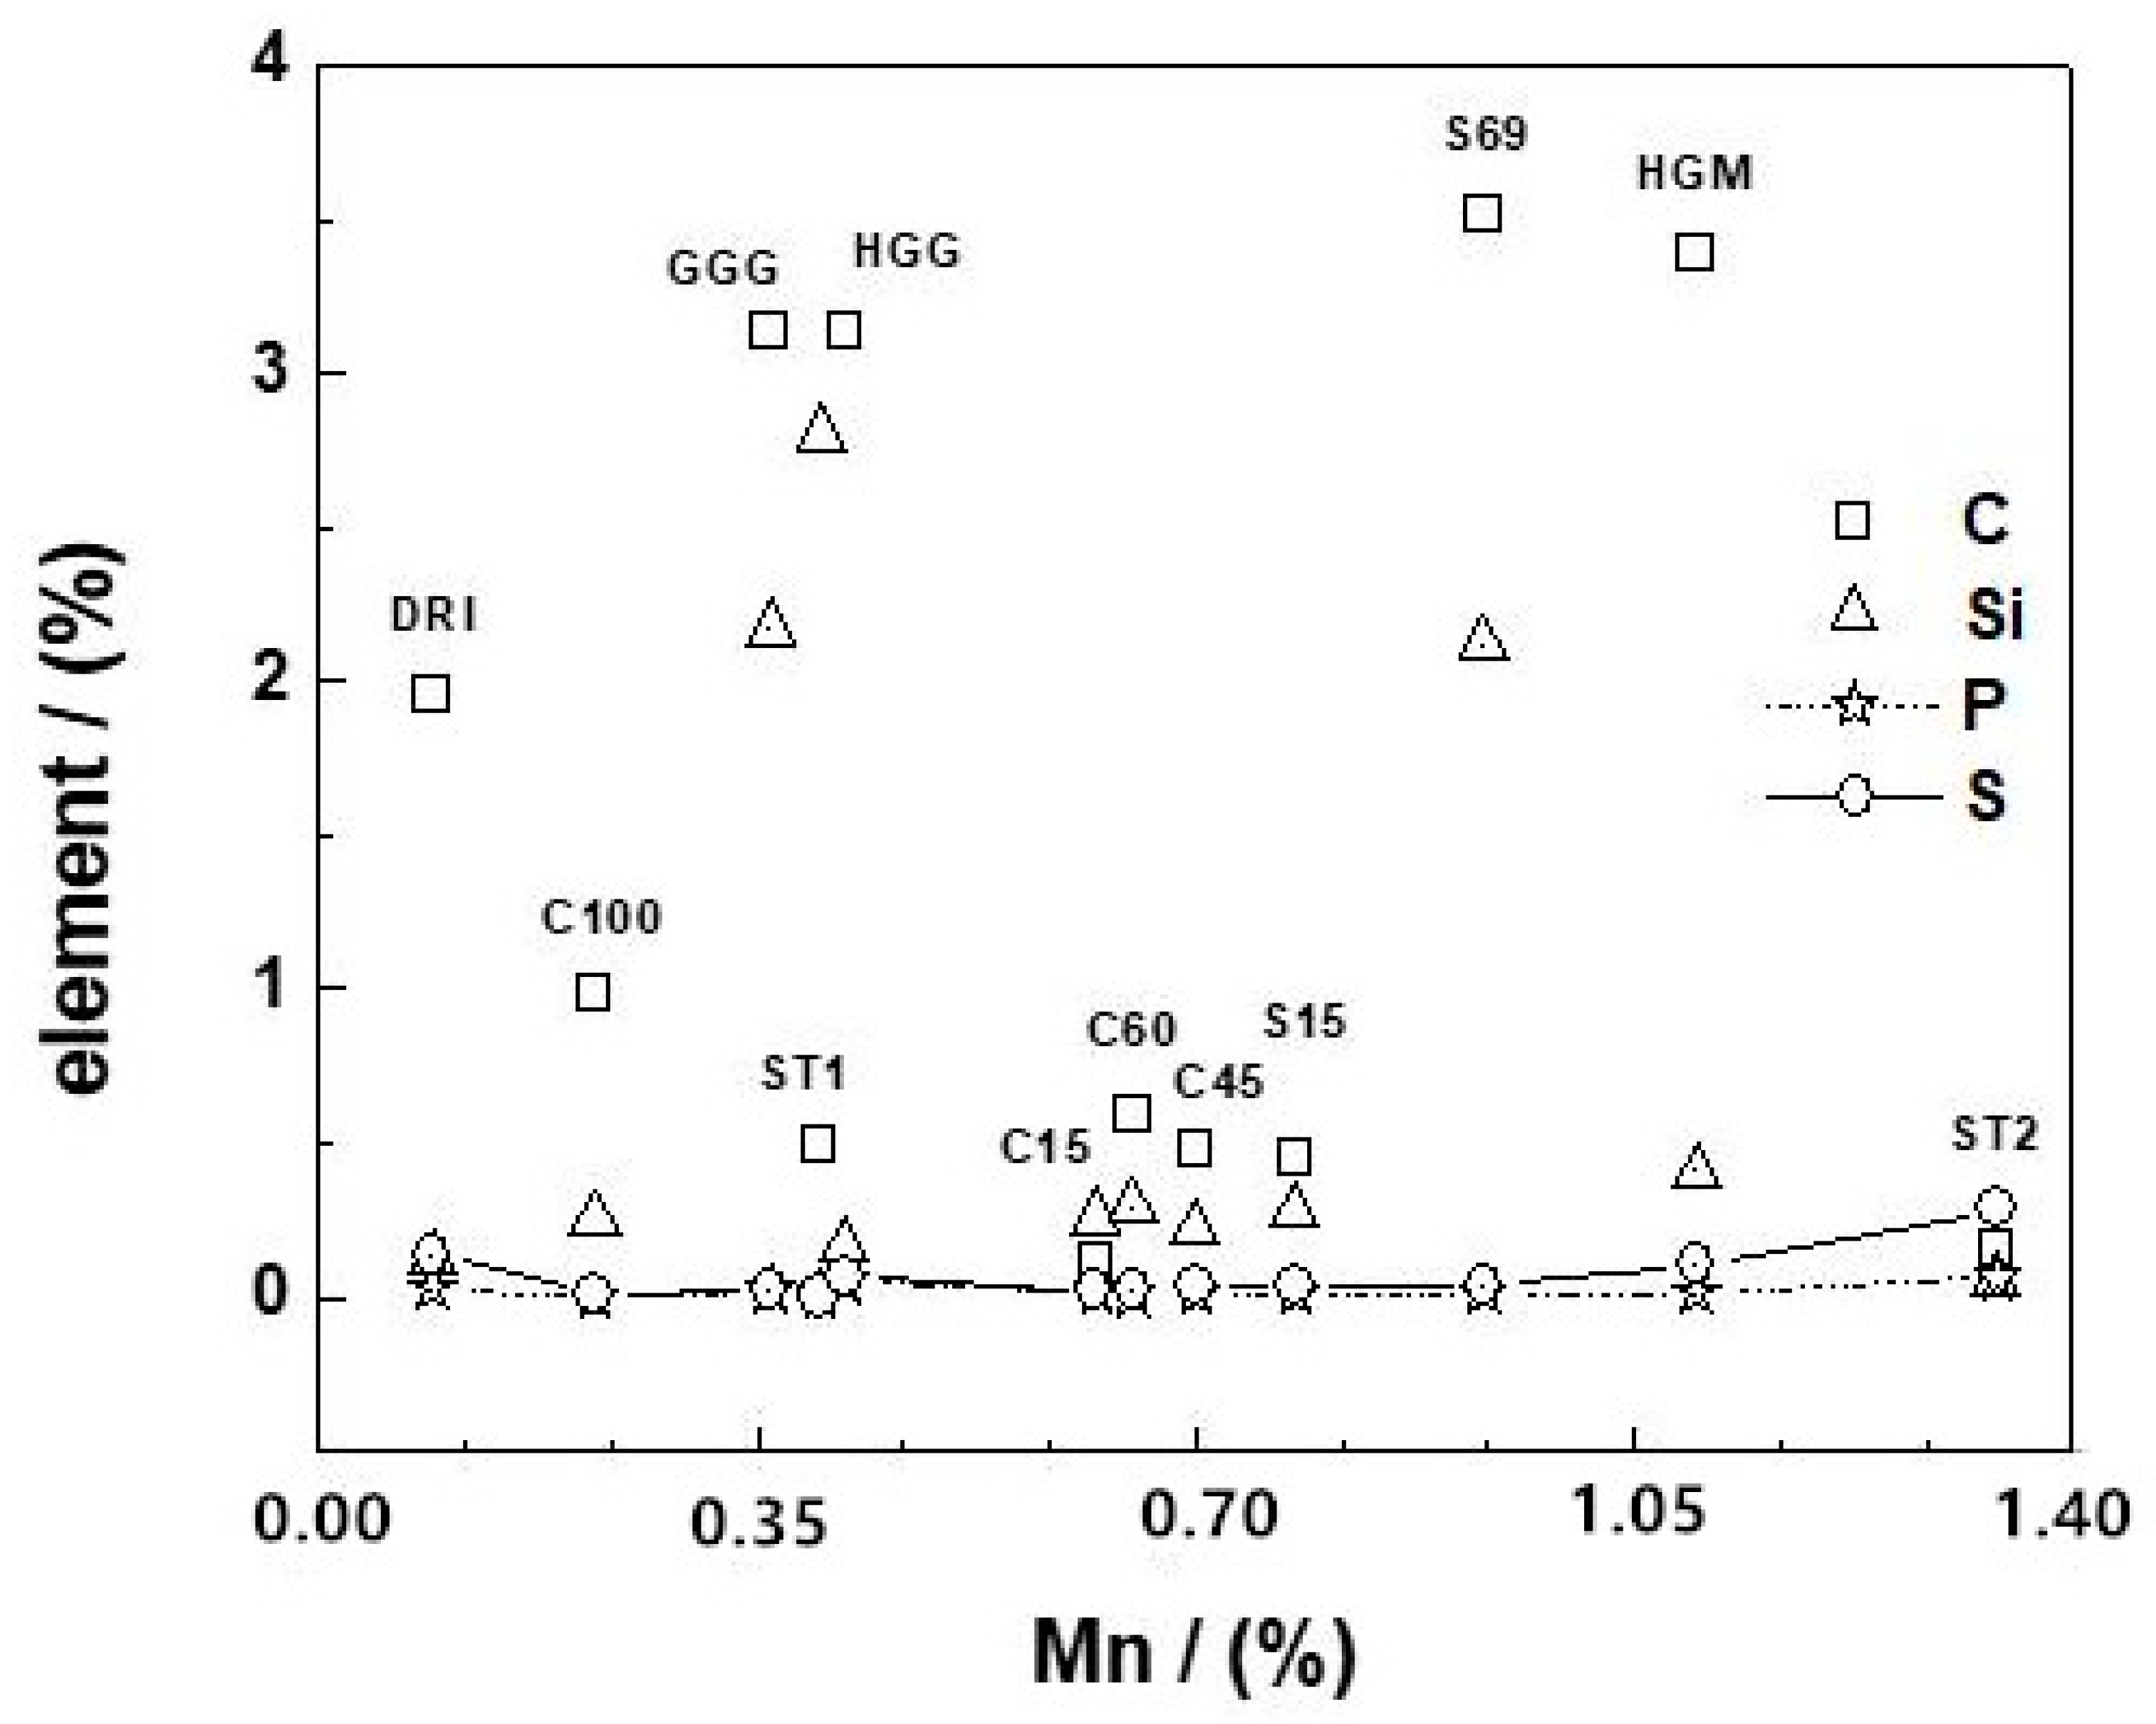
Figure 1. Distribution of carbon (C), silicon (Si), phosphorus (P), and sulfur (S) in the used iron materials as a function of their manganese content (% Mn). The represented lines (for P and S) are not fitting functions but just join the points to ease visualization. The codes of the individual materials are indicated on the curve for carbon content based on data from Table 3.
Water 12 01523 g001
Figure 2. Schematic diagram of the pneumatic trough for the collection of H2. H2 generated in the washing glass induces the displacement of water in the inverted burette. The H2 volume corresponds to that of displaced water.
Water 12 01523 g002
Figure 3. Rate of molecular hydrogen production (VH2) as a function of time for the Fe0 materials tested in this work: (a) ST1, ST2, and S69; (b) model mild steels (C15, C45, C60, C100) and scrap irons (S15, S69); (c) commercial Fe0 (GGG, HGG, HGM, DRI) and S69. The experiments were conducted at 22 ± 2 °C. ZVI stands for Fe0. The represented lines are not fitting functions, but they just connect points to ease visualization.
Water 12 01523 g003aWater 12 01523 g003b
Figure 4. Changes of the volume of produced molecular hydrogen (H2) and the percent U(VI) removal as a function of the manganese content (% Mn). The codes of selected Fe0 specimens are indicated. The represented lines are not fitting functions, but they just connect points to ease visualization.
Water 12 01523 g004
Figure 5. Idealized relative reactivity of Fe0 materials as a function of the reactive barrier service life. The three scenarios are deduced from the reactivity of DRI, HGG, and HGM for H2 production in H2SO4 (pH 2). For illustration purposes, the elapsed time was changed from hours to years, and the normalization of the reactivity was done arbitrarily.
Water 12 01523 g005
Table 1. Some relevant reactions for the discussion of the efficiency of metallic iron (Fe0) in remediation Fe0/H2O systems.
ProcessReaction
Iron oxidationFe0 + 2 H+Fe2+ + H2
Formation of Fe(OH)2Fe2+ + 2 OHFe(OH)2
Formation of Fe(OH)32 Fe(OH)2 + ½ O2 + H2O2 Fe(OH)3
Aging of Fe(OH)3Fe(OH)3FeOOH; Fe2O3, Fe3O4
Fe2+ complexationFe2+ + EDTAFe(EDTA)2+
Table 2. Comparison of used Fe0 reactivity characterization methods for materials selection for water treatment.
MethodFe0 Dissolution in H2SO4Fe0 Dissolution in H2OFe0 Dissolution in Complexing Solutions (EDTA, Phen)
Test conditions2.0 ≤ pH ≤ 3.1Neutral pHNeutral pH
Monitored parameterH2 volumeH2 volumeFe concentration
Test duration (hours)24200 ≤ t ≤ 384024 ≤ t ≤ 96
Used Fe0 mass (g)2.075 ≤ m ≤ 6000.01 ≤ m ≤ 0.10
Number of used chemicals101 to 4
Corrosion mechanismH2 evolutionO2 adsorptionO2 adsorption
AdvantagesUses only lab accessories and H2SO4, no scientific instrument;
Enables the exhaustion of Fe0 dissolution within a reasonable time.
Uses no scientific instrument. Fe0 corrosion is not artificially accelerated.Controls Fe0 corrosion to make it a linear function of time;
Simulates natural conditions;
Uses only a spectrophotometer.
DisadvantagesH2 evolution is not the mechanism occurring in natural systems and water filters.Measured H2 volume represents an excess and cannot be strictly related to the stoichiometry of Equation (1);
The experiments last for longer time and needs larger Fe0 amounts
Only the initial dissolution kinetics are recorded;
In the EDTA test, Fe dissolved from corrosion products (hydroxides and oxides) are also recorded.
ReferencesNoubactep [32], This studyReardon [31,41]Lufingo et al. [22], Noubactep et al. [38]
Table 3. Elemental composition of iron materials used in this study.
Fe0Element (%)
CSiMnPSCrMoNiFe
ST10.492.800.400.0110.0038.600.030.1587.52
ST20.150.051.340.0680.2870.120.030.0897.88
C150.120.260.620.0190.0230.084n.d. *0.055bal. **
C450.480.220.700.0120.0380.12n.d.0.13bal.
C600.590.290.650.0070.0270.19n.d.0.093bal.
C1000.990.250.220.0020.0080.078n.d.0.051bal.
DRI1.960.120.090.0270.140.003n.d.<0.001bal.
GGG3.132.170.360.0220.0290.077n.d.0.056bal.
HGG3.130.170.420.0530.0650.16n.d.0.23bal.
HGM3.390.411.10n.d.0.1050.34n.d.0.088bal.
S693.522.120.93n.d.n.d.0.66n.d.n.d.bal.
S150.450.280.78n.d.n.d.2.67n.d.1.34bal.
(*) n.d. = not determined and (**) bal. = balance.
Table 4. Summary of the results of hydrogen (H2) production in H2SO4 (pH 2) and percentage removal (E) of uranium by Fe0 materials in tap water. (VH2)24 is the H2 volume after 24 h; vmax is the maximum H2 production rate at time tvmax; [Fe] is the aqueous iron concentration at the end of the H2 production experiment (28 h). kEDTA is the corrosion rate in a 2 mM EDTA solution [42].
Fe0(VH2)24 (mL)vmax (mL/min)tvmax (h)[Fe] (mM)E (%)kEDTA (M h−1)
ST1 **1520.242.722.1761.35
ST2 **1920.313.825.2801.95
C151310.205.0n.d. *841.92
C451220.281.2n.d.821.95
C601040.225.2n.d.861.94
C1001090.232.5n.d.871.83
DRI1491.050.122.4911.86
GGG1370.221.721.7881.82
HGG1090.205.921.8781.54
HGM400.051.412.8821.55
S151080.303.219.8891.98
S691180.242.522.3932.06
(*) n.d. = not determined; (**) H2 production; the experiment was stopped after 16 h.
Table 5. Summary of the existing Fe0 materials reactivity characterization methods validated via comparison of results with that of contaminant removal. “CAHs” stand for “chlorinated aliphatic hydrocarbons” and “PCP” for “Pentachlorophenol”.
Characterization TestMonitored ParameterUsed ChemicalCompounds Used for ValidationReference
Iodine methodI3 reduction rate constantIodineCAHs and PCPKim et al. [18]
Ferric methodFe concentrationFerric ironCu(II) and TCELi et al. [19]
H2 evolutionH2 volumeNoneCAHsVelimirovic et al. [54]
EDTA testFe concentrationEDTAU(VI)Noubactep et al. [38]
Phen testFe concentration1,10 PhenanthrolineEDTA testLufingo et al. [22]
H2 evolutionH2 volumeH2SO4Not validatedThis study