Comparison of ERA5-Land and UERRA MESCAN-SURFEX Reanalysis Data with Spatially Interpolated Weather Observations for the Regional Assessment of Reference Evapotranspiration


Abstract
:1. Introduction
2. Materials and Methods
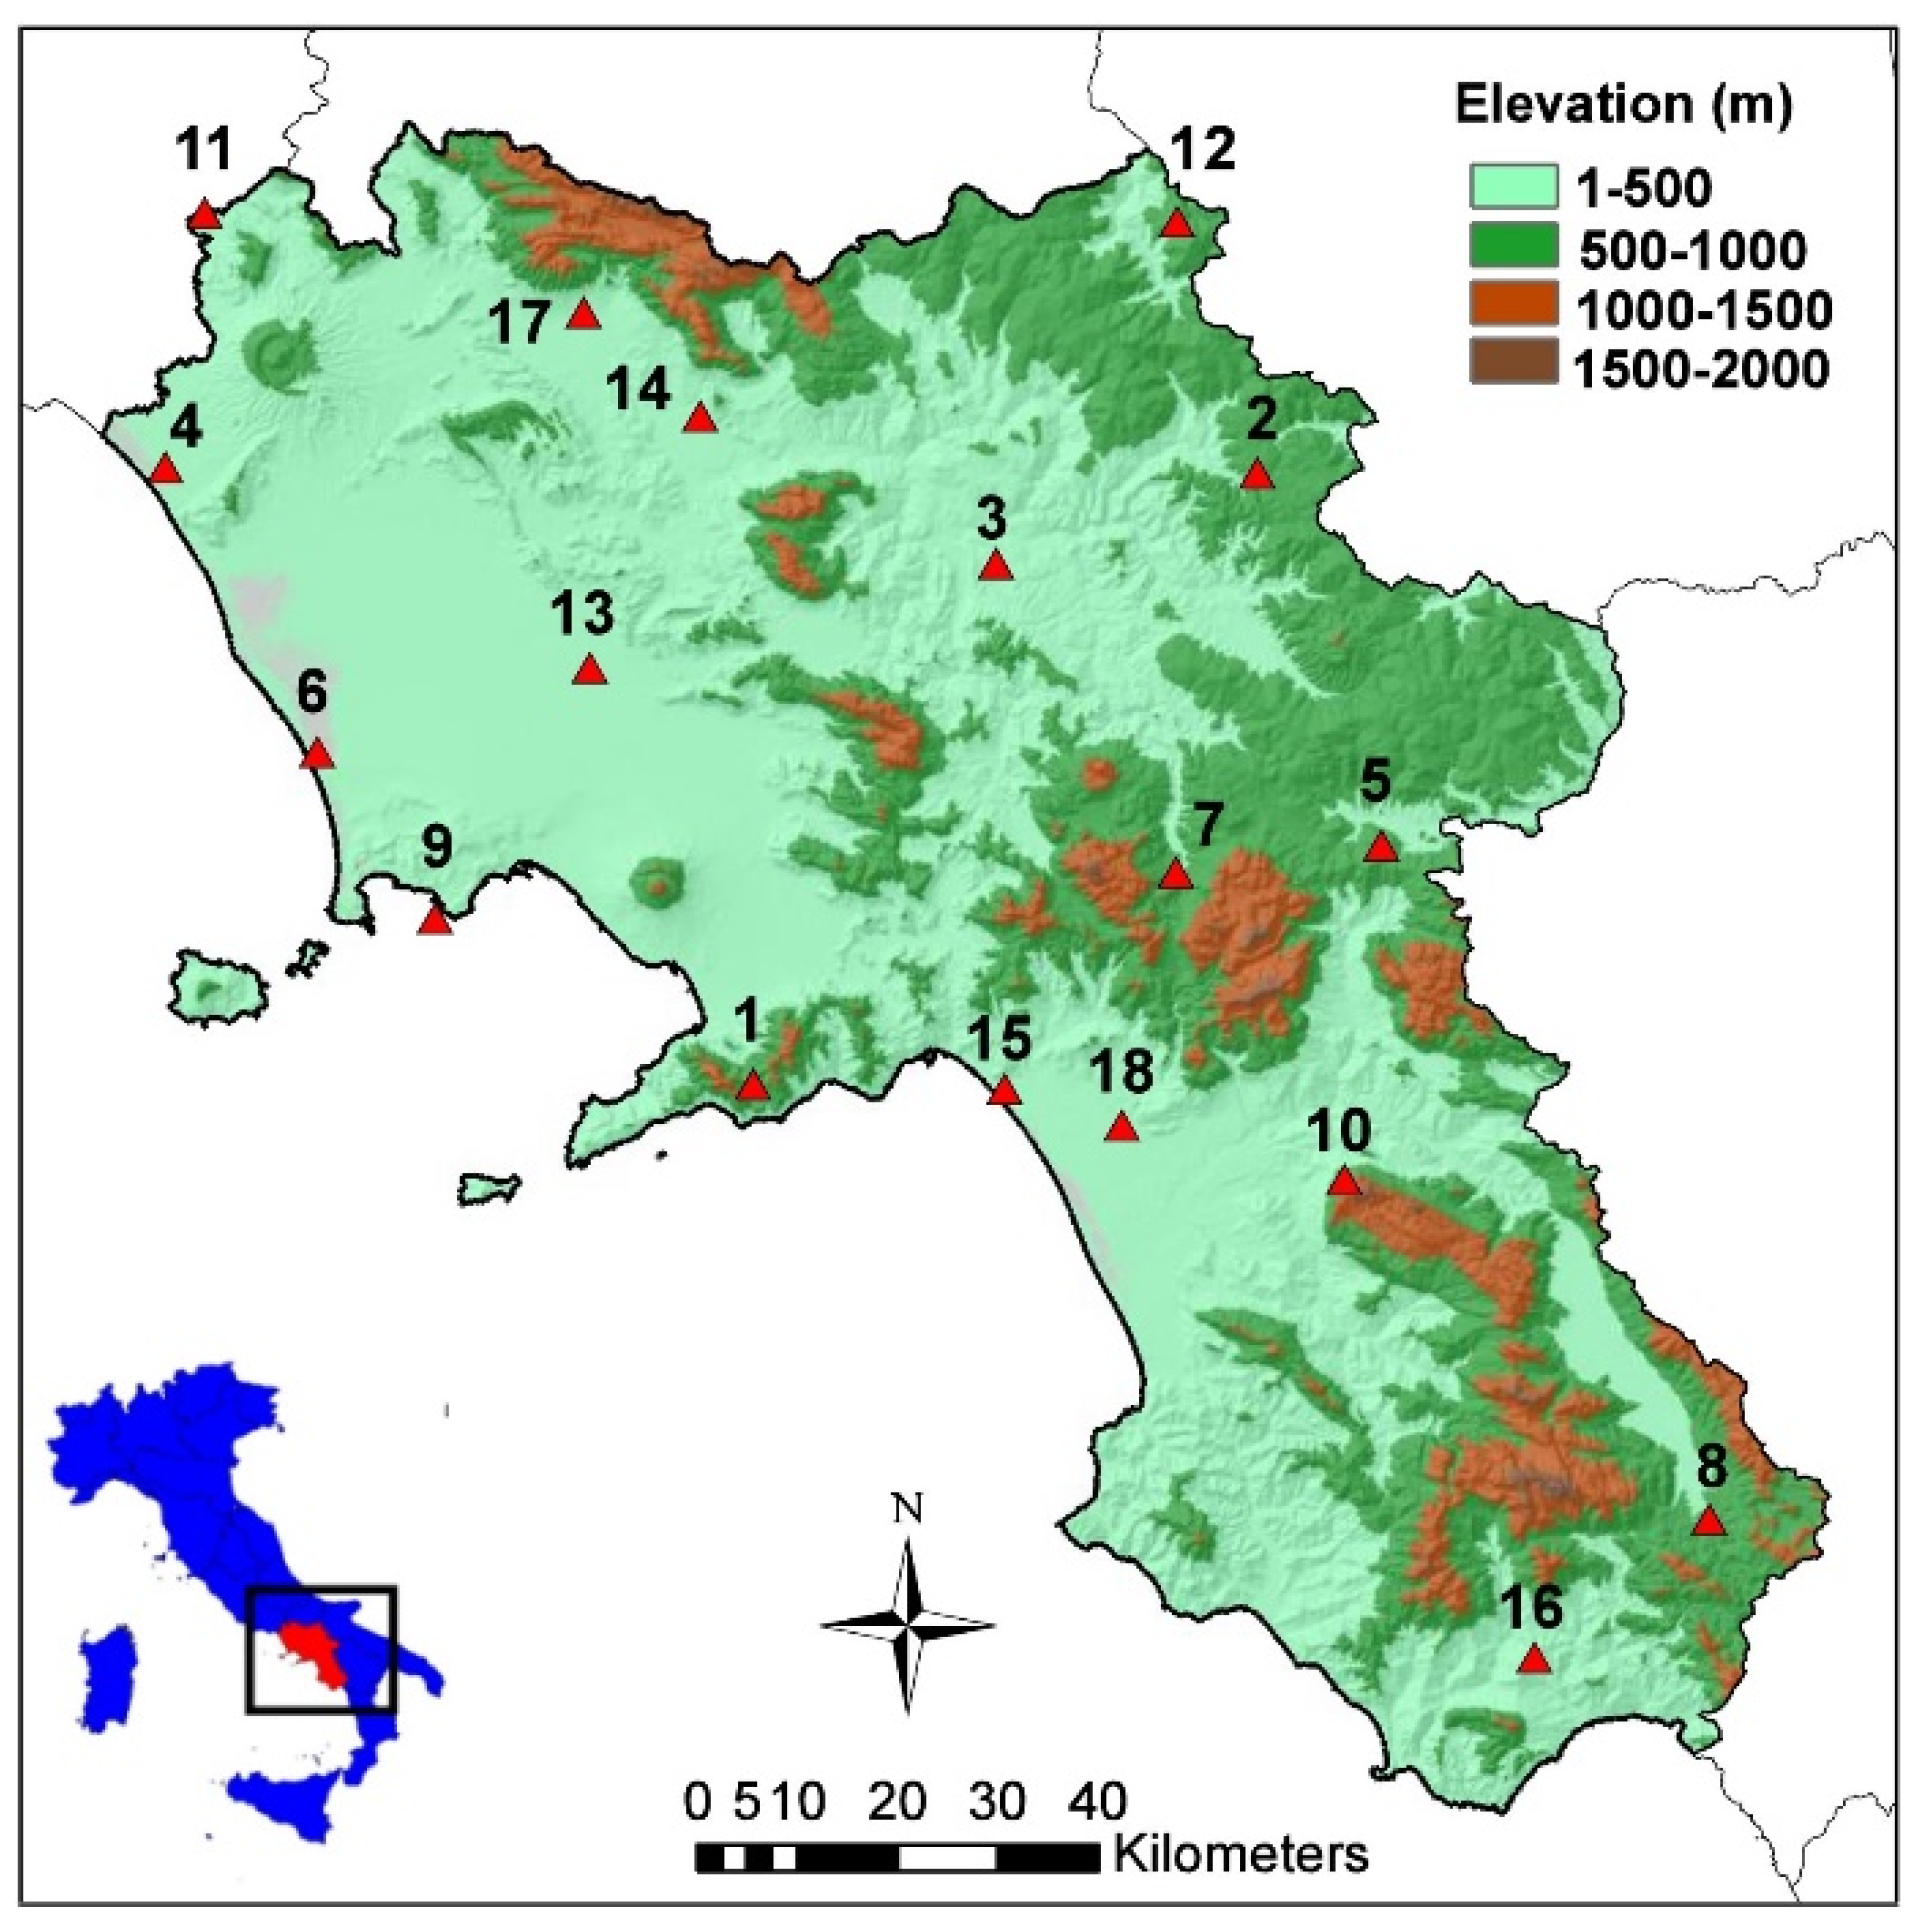
2.1. Study Area
2.2. Reanalysis Data
2.3. Geostatistical Interpolation of Ground Sensor Data and Cross-Validation for Evaluating Performances
2.4. Reference Evapotranspiration Model
- is the latent heat of vaporization;
- Δ is the slope of the vapor pressure curve (kPa °C−1);
- γ is the psychometric constant (kPa °C−1);
- T is the daily mean air temperature at 2 m height (°C) computed as the average between the daily maximum (Tmax) and minimum (Tmin) air temperature at 2 m height at the highest available temporal resolution of data;
- WS is the wind speed at 2 m height above ground (m s−1) computed from the wind speed at 10 m above the ground by multiplying for a factor of about 0.75 given by the logarithmic equation of the wind speed profile [15];
- VPD is the daily vapor pressure deficit (kPa), computed as function of Tmax and Tmin and relative humidity, RH. If available, dew point temperature (Tdew) is used for computing VPD, instead of RH);
- Rn is the net radiation at the crop surface (MJ m−2 day−1) and G is the soil heat flux density (MJ m−2 day−1). The net radiation (Rn) was calculated as the difference between the incoming net shortwave radiation and the outgoing net long-wave radiation. The incoming net shortwave radiation is a fraction of the incoming shortwave solar radiation (RS), computed for the reference crop by setting the albedo equal to 0.23.
2.5. Statistical Indicators for Performance Analysis
3. Results
3.1. Performance Analysis on Weather Data
3.2. Performance Analysis on Reference Evapotranspiration
Performance Analysis on Monthly Basis
4. Discussion and Conclusions
Author Contributions
Funding
Acknowledgments
Conflicts of Interest
Appendix A. Kriging Interpolation
Appendix B. The Network of Temperature Sensors and Sensitivity of the Kriging Estimator to Network Density


References
- Magnan, A.K.; Ribera, T. Global adaptation after Paris Climate mitigation and adaptation cannot be uncoupled. Science 2016, 352, 1280–1282. [Google Scholar] [CrossRef]
- Salerno, F. Adaptation Strategies for Water Resources: Criteria for Research. Water 2017, 9, 805. [Google Scholar] [CrossRef] [Green Version]
- Thenkabail, P.S.; Biradar, C.M.; Turral, H.; Noojipady, P.; Li, Y.J.; Vithanage, J.; Dheeravath, V.; Velpuri, M.; Schull, M.; Cai, X.L.; et al. An Irrigated Area Map of the World (1999) Derived from Remote Sensing. Research Report # 105; International Water Management Institute: Battaramulla, Sri Lanka, 2006; p. 74. Available online: http://www.iwmigiam.org (accessed on 10 July 2014).
- Wriedt, G.; van der Velde, M.; Aloe, A.; Bouraoui, F. A European irrigation map for spatially distributed agricultural modelling. Agric. Water Manag. 2009, 96, 771–789. [Google Scholar] [CrossRef]
- Siebert, S. Global Map of Irrigation Areas Version 4.0.1.; Food and Agriculture Organization of the United Nations (FAO): Rome, Italy, 2007; Available online: http://www.fao.org/nr/water/aquastat/quickWMS/irrimap.htm (accessed on 21 July 2012).
- Döll, P.; Siebert, S. Global modelling of irrigation water requirements. Water Resour. Res. 2002, 38, 8:1–8:10. [Google Scholar] [CrossRef]
- Thoidou, E. Climate adaptation strategies: Cohesion policy 2014–2020 and prospects for Greek regions. Manag. Environ. Q. 2017, 28, 350–367. [Google Scholar] [CrossRef]
- Consoli, S.; Vanella, D. Comparisons of satellite-based models for estimating evapotranspiration fluxes. J. Hydrol. 2014, 513, 475–489. [Google Scholar] [CrossRef]
- Vuolo, F.; D´Urso, G.; De Michele, C.; Bianchi, B.; Cutting, M. Satellite-based irrigation advisory services: A common tool for different experiences from Europe to Australia. Agric. Water Manag. 2015, 147, 82–89. [Google Scholar] [CrossRef]
- Campos, I.; Balbontin, C.; González-Piqueras, J.; González-Dugo, M.P.; Neale, C.; Calera, A. Combining water balance model with evapotranspiration measurements to estimate total available water soil water in irrigated and rain-fed vineyards. Agric. Water Manag. 2016, 165, 141–152. [Google Scholar] [CrossRef]
- Calera, A.; Campos, I.; Osann, A.; D’Urso, G.; Menenti, M. Remote Sensing for Crop Water Management: From ET Modelling to Services for the End Users. Sensors 2017, 17, 1104. [Google Scholar] [CrossRef] [Green Version]
- Chirico, G.B.; Pelosi, A.; De Michele, C.; Falanga Bolognesi, S.; D’Urso, G. Forecasting potential evapotranspiration by combining numerical weather predictions and visible and near-infrared satellite images: An application in southern Italy. J. Agric. Sci. 2018, 156, 702–710. [Google Scholar] [CrossRef]
- Longo-Minnolo, G.; Vanella, D.; Consoli, S.; Intrigliolo, D.S.; Ramírez-Cuestac, J.M. Integrating forecast meteorological data into the ArcDualKc model for estimating spatially distributed evapotranspiration rates of a citrus orchard. Agric. Water Manag. 2020, 231, 105967. [Google Scholar] [CrossRef]
- Pelosi, A.; Villani, P.; Falanga Bolognesi, S.; Chirico, G.B.; D’Urso, G. Predicting Crop Evapotranspiration by Integrating Ground and Remote Sensors with Air Temperature Forecasts. Sensors 2020, 20, 1740. [Google Scholar] [CrossRef] [PubMed] [Green Version]
- Allen, R.G.; Pereira, L.S.; Raes, D.; Smith, M. Crop Evapotranspiration—Guidelines for Computing Crop Water Requirements, Irrigation and Drain—FAO Irrigation and Drainage Paper No. 56; FAO: Rome, Italy, 1998. [Google Scholar]
- Battisti, R.; Bender, F.D.; Sentelhas, P.C. Assessment of different gridded weather data for soybean yield simulations in Brazil. Theor. Appl. Climatol. 2018, 135, 237–247. [Google Scholar] [CrossRef]
- Senay, G.B.; Verdin, J.P.; Lietzow, R.; Melesse, A.M. Global daily reference evapotranspiration modeling and evaluation. J. Am. Water Resour. Assoc. 2008, 44, 969–979. [Google Scholar] [CrossRef]
- Lewis, C.S.; Geli, H.M.E.; Neale, C.M.U. Comparison of the NLDAS weather forcing model to agrometeorological measurements in the western United States. J. Hydrol. 2014, 510, 385–392. [Google Scholar] [CrossRef]
- Strong, C.; Khatri, K.B.; Kochanski, A.K.; Lewis, C.S.; Allen, L.N. Reference evapotranspiration from coarse-scale and dynamically downscaled data in complex terrain: Sensitivity to interpolation and resolution. J. Hydrol. 2017, 548, 406–418. [Google Scholar] [CrossRef] [Green Version]
- Heuvelink, G.B.M.; Pebesma, E.J. Spatial aggregation and soil process modelling. Geoderma 1999, 89, 47–65. [Google Scholar] [CrossRef]
- McVicar, T.R.; Van Niel, T.G.; Li, L.-T.; Hutchinson, M.F.; Mu, X.-M.; Liu, Z.-H. Spatially distributing monthly reference evapotranspiration and pan evaporation considering topographic influences. J. Hydrol. 2007, 338, 196–220. [Google Scholar] [CrossRef]
- Raziei, T.; Pereira, L.S. Spatial variability analysis of reference evapotranspiration in Iran utilizing fine resolution gridded datasets. Agric. Water Manag. 2013, 126, 104–118. [Google Scholar] [CrossRef] [Green Version]
- Raziei, T.; Pereira, L.S. Estimation of ET0 with Hargreaves-Samani and FAO-PM temperature methods for a wide range of climates in Iran. Agric. Water Manag. 2013, 121, 1–18. [Google Scholar] [CrossRef]
- Tomas-Burguera, M.; Vicente-Serrano, S.M.; Grimalt, M.; Begueri, S. Accuracy of reference evapotranspiration (ET0) estimates under data scarcity scenarios in the Iberian Peninsula. Agric. Water Manag. 2017, 182, 103–116. [Google Scholar] [CrossRef] [Green Version]
- Hargreaves, G.H.; Samani, Z.A. Reference crop evapotranspiration from temperature. Trans. ASAE 1985, 1, 96–99. [Google Scholar] [CrossRef]
- Priestley, C.H.B.; Taylor, R.J. On the assessment of surface heat flux and evaporation using large-scale parameters. Mon. Weather Rev. 1972, 100, 81–92. [Google Scholar] [CrossRef]
- Pereira, A.R. The Priestley–Taylor parameter and the decoupling factor for estimating reference evapotranspiration. Agric. For. Meteorol. 2004, 194, 50–63. [Google Scholar] [CrossRef]
- Pelosi, A.; Chirico, G.B.; Falanga Bolognesi, S.; De Michele, C.; D’Urso, G. Forecasting crop evapotranspiration under standard conditions in precision farming. In Proceedings of the 2019 IEEE International Workshop on Metrology for Agriculture and Forestry, MetroAgriFor 2019—Proceedings, Portici, Italy, 24–26 October 2019; pp. 174–179. [Google Scholar]
- Mendicino, G.; Senatore, A. Regionalization of the Hargreaves Coefficient for the Assessment of Distributed Reference Evapotranspiration in Southern Italy. J. Irrig. Drain. Eng. 2013, 139, 349–362. [Google Scholar] [CrossRef]
- Jung, C.G.; Lee, D.R.; Moon, J.W. Comparison of the Penman-Monteith method and regional calibration of the Hargreaves equation for actual evapotranspiration using SWAT-simulated results in the Seolma-cheon basin, South Korea. Hydrol. Sci. J. 2016, 61, 793–800. [Google Scholar] [CrossRef]
- Senatore, A.; Parrello, C.; Almorox, J.; Mendicino, G. Exploring the Potential of Temperature-Based Methods for Regionalization of Daily Reference Evapotranspiration in Two Spanish Regions. J. Irrig. Drain. Eng. 2020, 146, 05020001. [Google Scholar] [CrossRef]
- Ren, X.; Martins, D.S.; Qu, Z.; Paredes, P.; Pereira, L.S. Daily reference evapotranspiration for hyper-arid to moist sub-humid climates in Inner Mongolia, China: II. Trends of ET0 and weather variables and related spatial patterns. Water Resour. Manag. 2016, 30, 3793–3814. [Google Scholar] [CrossRef]
- Bojanowski, J.S.; Vrieling, A.; Skidmore, A.K. A comparison of data sources for creating a long-term time series of daily gridded solar radiation for Europe. Sol. Energy 2014, 99, 152–171. [Google Scholar] [CrossRef]
- Cammalleri, C.; Ciraolo, G. A simple method to directly retrieve reference evapotranspiration from geostationary satellite images. Int. J. Appl. Earth Obs. Geoinf. 2013, 21, 149–158. [Google Scholar] [CrossRef]
- Sheffield, J.; Goteti, G.; Wood, E.F. Development of a 50-year high-resolution global dataset of meteorological forcings for land surface modeling. J. Clim. 2006, 19, 3088–3111. [Google Scholar] [CrossRef] [Green Version]
- Kanamitsu, M.; Ebisuzaki, W.; Woollen, J.; Yang, S.H.; Hnilo, J.J.; Fiorino, M.; Potter, G.L. NCEP—DOE AMIP-II reanalysis (R-2). Bull. Am. Meteor. Soc. 2002, 83, 1631–1643. [Google Scholar] [CrossRef]
- Rienecker, M.M.; Suarez, M.J.; Gelaro, R.; Todling, R.; Bacmeister, J.; Liu, E.; Bosilovich, M.G.; Schubert, S.D.; Takacs, L.; Kim, G.K.; et al. MERRA: NASA’s modern-era retrospective analysis for research and applications. J. Clim. 2011, 24, 3624–3648. [Google Scholar] [CrossRef]
- Dee, D.P.; Uppala, S.M.; Simmons, A.J.; Berrisford, P.; Poli, P.; Kobayashi, S.; Andrae, U.; Balmaseda, M.A.; Balsamo, G.; Bauer, D.P.; et al. The ERA-Interim reanalysis: Configuration and performance of the data assimilation system. Q. J. R. Meteorol. Soc. 2011, 137, 553–597. [Google Scholar] [CrossRef]
- Boulard, D.; Castel, T.; Camberlin, P.; Sergent, A.S.; Bréda, N.; Badeau, V.; Rossi, A.; Pohl, B. Capability of a regional climate model to simulate climate variables requested for water balance computation: A case study over northeastern France. Clim. Dyn. 2016, 46, 2689–2716. [Google Scholar] [CrossRef]
- Srivastava, P.K.; Han, D.; Rico-Ramirez, M.A.; Islam, T. Comparative assessment of evapotranspiration derived from NCEP and ECMWF global datasets through Weather Research and Forecasting model. Atmos. Sci. Lett. 2013, 28, 4419–4432. [Google Scholar] [CrossRef]
- Martins, D.S.; Paredes, P.; Raziei, T.; Pires, C.; Cadima, J.; Pereira, L.S. Assessing reference evapotranspiration estimation from reanalysis weather products. An application to the Iberian Peninsula. Int. J. Climatol. 2017, 37, 2378–2397. [Google Scholar] [CrossRef]
- Tian, D.; Martinez, C.J. Comparison of two analog-based downscaling methods for regional reference evapotranspiration forecasts. J. Hydrol. 2012, 475, 350–364. [Google Scholar] [CrossRef]
- Pelosi, A.; Medina, H.; Van den Bergh, J.; Vannitsem, S.; Chirico, G.B. Adaptive Kalman filtering for post-processing of ensemble numerical weather predictions. Mon. Weather Rev. 2017, 145, 4837–4854. [Google Scholar] [CrossRef]
- Medina, H.; Tian, D.; Srivastava, P.; Pelosi, A.; Chirico, G.B. Medium-range reference evapotranspiration forecasts for the contiguous United States based on multi-model numerical weather predictions. J. Hydrol. 2018, 562, 502–517. [Google Scholar] [CrossRef]
- Paredes, P.; Martins, D.S.; Pereira, L.S.; Cadima, J.; Pires, C. Accuracy of daily estimation of grass reference evapotranspiration using era-interim reanalysis products with assessment of alternative bias correction schemes. Agric. Water Manag. 2018, 210, 340–353. [Google Scholar] [CrossRef]
- Bauer, P.; Thorpe, A.; Brunet, G. The quiet revolution of numerical weather prediction. Nature 2015, 525, 47–55. [Google Scholar] [CrossRef] [PubMed]
- Ridal, M.; Olsson, E.; Unden, P.; Zimmermann, K.; Ohlsson, A. Uncertainties in Ensembles of Regional Re-Analyses. Deliverable D2.7 HARMONIE Reanalysis Report of Results and Dataset 2017. Available online: http://www.uerra.eu/component/dpattachments/?task=attachment.download&id=296 (accessed on 18 July 2019).
- Bazile, E.; Abida, R.; Verelle, A.; Le Moigne, P.; Szczypta, C. MESCAN-SURFEX Surface Analysis. Deliverable D2.8 of the UERRA Project 2017. Available online: http://www.uerra.eu/publications/deliverable-reports.html (accessed on 18 July 2019).
- Hersbach, H.; Bell, B.; Berrisford, P.; Hirahara, S.; Horányi, A.; Muñoz-Sabater, J.; Nicolas, J.; Peubey, C.; Radu, R.; Schepers, D.; et al. The ERA5 Global Reanalysis. Q. J. R. Meteorol. Soc. 2020. submitted. [Google Scholar]
- Copernicus Climate Change Service. ERA5-Land Hourly Data from 2001 to Present ECMWF. Available online: https://cds.climate.copernicus.eu/doi/10.24381/cds.e2161bac (accessed on 18 July 2019).
- Pelosi, A.; Furcolo, P. An amplification model for the regional estimation of extreme rainfall within orographic areas in Campania region (Italy). Water 2015, 7, 6877–6891. [Google Scholar] [CrossRef] [Green Version]
- Pelosi, A.; Medina, H.; Villani, P.; D’Urso, G.; Chirico, G.B. Probabilistic forecasting of reference evapotranspiration with a limited area ensemble prediction system. Agric. Water Manag. 2016, 178, 106–118. [Google Scholar] [CrossRef]
- Soci, C.; Bazile, E.; Besson, F.; Landelius, T. High-resolution precipitation reanalysis system for climatological purposes. Tellus A 2016, 68, 1–19. [Google Scholar] [CrossRef] [Green Version]
- UERRA Regional Reanalysis for Europe on Single Levels from 1961 to 2019. Available online: https://cds.climate.copernicus.eu/cdsapp#!/dataset/reanalysis-uerra-europe-single-levels?tab=form (accessed on 18 July 2019).
- ERA5-Land Hourly Data from 1981 to Present. Available online: https://cds.climate.copernicus.eu/cdsapp#!/dataset/reanalysis-era5-land?tab=form (accessed on 12 January 2020).
- UERRA Product User Guide. Available online: http://datastore.copernicus-climate.eu/documents/uerra/D322_Lot1.4.1.2_User_guides_v3.3.pdf (accessed on 18 July 2019).
- Copernicus Regional Reanalysis for Europe (CERRA). Available online: https://climate.copernicus.eu/copernicus-regional-reanalysis-europe-cerra (accessed on 10 February 2020).
- ERA5-Land: Data Documentation. Available online: https://confluence.ecmwf.int/display/CKB/ERA5-Land%3A+data+documentation (accessed on 12 January 2020).
- Hofstra, N.; Haylock, M.; New, M.; Jones, P.; Frei, C. Comparison of six methods for the interpolation of daily, European climate data. J. Geophys. Res. Atmos. 2008, 113, D21110. [Google Scholar] [CrossRef] [Green Version]
- Luo, W.; Taylor, M.C.; Parker, S.R. A comparison of spatial interpolation methods to estimate continuous wind speed surfaces using irregularly distributed data from England and Wales. Int. J. Clim. 2008, 28, 947–959. [Google Scholar] [CrossRef]
- Berndt, C.; Haberlandt, U. Spatial interpolation of climate variables in Northern Germany—Influence of temporal resolution and network density. J. Hydrol. Reg. Stud. 2018, 15, 184–202. [Google Scholar] [CrossRef]
- Rehman, S.; Ghori, S.G. Spatial estimation of global solar radiation using geostatistics. Renew. Energy 2000, 21, 583–605. [Google Scholar] [CrossRef]
- Alsamamra, H.; Ruiz-Arias, J.A.; Pozo-Vazquez, D.; Tovar-Pescador, J. A comparative study of ordinary and residual kriging techniques for mapping global solar radiation over southern Spain. Agric. For. Meteorol. 2009, 149, 1343–1357. [Google Scholar] [CrossRef]
- Journée, M.; Bertrand, C. Improving the spatio-temporal distribution of surface solar radiation data by merging ground and satellite measurements. Remote Sens. Environ. 2010, 114, 2692–2704. [Google Scholar] [CrossRef]
- Prudhomme, C.; Reed, D. Mapping extreme rainfall in a mountainous region using geostatistical techniques: A case study in Scotland. Int. J. Climatol. 1999, 19, 1337–1356. [Google Scholar] [CrossRef]
- Jarvis, C.H.; Stuart, N. A comparison among strategies of interpolating maximum and minimum daily air temperatures. Part I: The selection of “guiding” topographic and land cover variables. J. Appl. Meteorol. 2001, 40, 1060–1074. [Google Scholar] [CrossRef]
- Hudson, G.; Wackernagel, H. Mapping temperature using kriging with external drift: Theory and example from Scotland. Int. J. Climatol. 1994, 14, 77–91. [Google Scholar] [CrossRef]
- Stahl, K.; Moore, R.D.; Floyer, J.A.; Asplin, M.G.; McKendry, I.G. Comparison of approaches for spatial interpolation of daily air temperature in a large region with complex topography and highly variable station density. Agric. For. Meteorol. 2006, 139, 224–236. [Google Scholar] [CrossRef]
- Di Piazza, A.; Lo Conti, F.; Viola, F.; Eccel, E.; Noto, L.V. Comparative Analysis of Spatial Interpolation Methods in the Mediterranean Area: Application to Temperature in Sicily. Water 2015, 7, 1866–1888. [Google Scholar] [CrossRef] [Green Version]
- Odeh, I.O.A.; McBratney, A.B.; Chittleborough, D.J. Further results on prediction of soil properties from terrain attributes: Heterotopic cokriging and regression-kriging. Geoderma 1995, 67, 215–226. [Google Scholar] [CrossRef]
- Holdaway, M.R. Spatial modelling and interpolation of monthly temperature using kriging. Clim. Res. 1996, 6, 215–225. [Google Scholar] [CrossRef] [Green Version]
- Ahmed, S.; de Marsily, G. Comparison of geostatistical methods for estimating transmissivity using data on transmissivity and specific capacity. Water Resour. Res. 1987, 23, 1717–1737. [Google Scholar] [CrossRef]
- Journel, A.G.; Huijbregts, C.J. Mining Geostatistics; Academic Press: London, UK, 1978. [Google Scholar]
- Cressie, N. Statistics for Spatial Data; John Wiley and Sons: New York, NY, USA, 1993. [Google Scholar]
- Furcolo, P.; Pelosi, A.; Rossi, F. Statistical identification of orographic effects in the regional analysis of extreme rainfall. Hydrol. Process. 2016, 30, 1342–1353. [Google Scholar] [CrossRef]
- Viggiano, M.; Busetto, L.; Cimini, D.; Di Paola, F.; Geraldi, E.; Ranghetti, L.; Ricciardelli, E.; Romano, F. A new spatial modeling and interpolation approach for high-resolution temperature maps combining reanalysis data and ground measurements. Agric. For. Meteorol. 2019, 276, 107590. [Google Scholar] [CrossRef]
- Pelosi, A.; Furcolo, P.; Rossi, F.; Villani, P. The characterization of extraordinary extreme events (EEEs) for the assessment of design rainfall depths with high return periods. Hydrol. Process. 2020, 1–17. [Google Scholar] [CrossRef]
- Agri4Cast Resources Portal, Gridded Agro-Meteorological Data in Europe. Available online: https://agri4cast.jrc.ec.europa.eu/DataPortal/ (accessed on 18 July 2019).
- Journel, A.G.; Alabert, F.G. New Method for Reservoir Mapping. J. Pet. Technol. 1990, 40, 7. [Google Scholar] [CrossRef]
- Gomis-Cebolla, J.; Jimenez, J.C.; Sobrino, J.A.; Corbari, C.; Mancini, M. Intercomparison of remote-sensing based evapotranspiration algorithms over amazonian forests. Int. J. Appl. Earth Obs. Geoinf. 2019, 80, 280–294. [Google Scholar] [CrossRef]
- Perera, K.C.; Western, A.W.; Nawarathna, B.; George, B. Forecasting daily reference evapotranspiration for Australia using numerical weather prediction outputs. Agric. For. Meteorol. 2014, 125, 305–313. [Google Scholar] [CrossRef]
- Ricard, S.; Anctil, F. Forcing the Penman-Montheith Formulation with Humidity, Radiation, and Wind Speed Taken from Reanalyses, for Hydrologic Modeling. Water 2019, 11, 1214. [Google Scholar] [CrossRef] [Green Version]


| ID | Name | Elevation (m) | Latitude (°) | Longitude (°) |
|---|---|---|---|---|
| 1 | Agerola METEO | 848 | 40°38′49″ N | 14°32′28″ E |
| 2 | Ariano Irpino METEO | 631 | 41°11′49″ N | 15°8′10″ E |
| 3 | Benevento METEO | 236 | 41°6′54″ N | 14°49′30″ E |
| 4 | Cellole METEO | 9 | 41°11′46″ N | 13°50′17″ E |
| 5 | Conza della Campania METEO | 770 | 40°51′43″ N | 15°16′55″ E |
| 6 | Lago Patria METEO | 1 | 4056′31″ N | 14°1′19″ E |
| 7 | Montella METEO | 515 | 40°50′17″ N | 15°2′20″ E |
| 8 | Montesano Marcellana METEO | 552 | 40°15′22″ N | 15°39′50″ E |
| 9 | Nisida METEO | 88 | 40°47′38″ N | 14°9′50″ E |
| 10 | Postiglione METEO | 660 | 40°33′43″ N | 15°14′13″ E |
| 11 | Rocca d’Evandro METEO | 62 | 41°25′30″ N | 13°52′48″ E |
| 12 | S.Bartolomeo METEO | 750 | 41°25′19″ N | 15°2′28″ E |
| 13 | San Marco Evangelista METEO | 31 | 41°1′12″ N | 14°20′38″ E |
| 14 | S.Salvatore Telesino METEO | 167 | 41°14′49″ N | 14°28′23″ E |
| 15 | Salerno METEO | 13 | 40°38′38″ N | 14°50′13″ E |
| 16 | Torre Orsaia METEO | 413 | 40°7′55″ N | 15°27′32″ E |
| 17 | Alife | 117 | 41°20′20″ N | 14°20′2″ E |
| 18 | Battipaglia | 64 | 40°36′40″ N | 14°58′34″ E |
| Station | T (°C) | WS (m s−1) | VPD (kPa) | RS (W m−2) | ||||
|---|---|---|---|---|---|---|---|---|
| ID | Mean | cv | Mean | cv | Mean | cv | Mean | cv |
| 1 | 18.0 | 0.27 | 2.08 | 0.37 | 0.73 | 0.75 | 224 | 0.35 |
| 2 | 18.7 | 0.27 | 3.17 | 0.38 | 0.8 | 0.67 | 256 | 0.29 |
| 3 | 20.5 | 0.23 | 1.95 | 0.40 | 0.9 | 0.51 | 254 | 0.28 |
| 4 | 21.3 | 0.19 | 2.04 | 0.26 | 0.66 | 0.49 | 259 | 0.26 |
| 5 | 18.2 | 0.29 | 4.64 | 0.47 | 0.74 | 0.76 | 258 | 0.3 |
| 6 | 21.5 | 0.19 | 2.60 | 0.33 | 0.65 | 0.46 | 263 | 0.25 |
| 7 | 18.0 | 0.25 | 1.34 | 0.42 | 0.72 | 0.54 | 240 | 0.32 |
| 8 | 18.4 | 0.24 | 1.55 | 0.23 | 0.63 | 0.57 | 246 | 0.29 |
| 9 | 23.1 | 0.19 | 3.31 | 0.39 | 0.87 | 0.56 | 269 | 0.25 |
| 10 | 18.9 | 0.26 | 4.28 | 0.43 | 0.84 | 0.66 | 248 | 0.33 |
| 11 | 21.1 | 0.21 | 1.27 | 0.39 | 0.79 | 0.54 | 233 | 0.31 |
| 12 | 17.9 | 0.30 | 4.40 | 0.41 | 0.71 | 0.83 | 258 | 0.32 |
| 13 | 23.4 | 0.20 | 2.03 | 0.33 | 1.13 | 0.49 | 243 | 0.28 |
| 14 | 21.4 | 0.21 | 1.99 | 0.45 | 0.9 | 0.56 | 246 | 0.28 |
| 15 | 23.5 | 0.19 | 2.10 | 0.24 | 1.12 | 0.43 | 249 | 0.26 |
| 16 | 20.8 | 0.22 | 2.62 | 0.26 | 0.84 | 0.61 | 251 | 0.3 |
| 17 | 20.8 | 0.21 | 1.2 | 0.42 | 0.91 | 0.53 | 242 | 0.28 |
| 18 | 22.4 | 0.20 | 1.33 | 0.33 | 1.13 | 0.46 | 254 | 0.26 |
| Station | April | May | June | July | August | September | ||||||
|---|---|---|---|---|---|---|---|---|---|---|---|---|
| ID | Mean | cv | Mean | cv | Mean | cv | Mean | cv | Mean | cv | Mean | cv |
| 1 | 2.56 | 0.42 | 3.08 | 0.34 | 4.04 | 0.23 | 4.29 | 0.20 | 3.31 | 0.30 | 2.22 | 0.28 |
| 2 | 2.70 | 0.33 | 3.43 | 0.29 | 4.62 | 0.23 | 5.16 | 0.20 | 4.08 | 0.25 | 2.72 | 0.28 |
| 3 | 2.75 | 0.28 | 3.59 | 0.24 | 4.66 | 0.18 | 5.04 | 0.16 | 4.05 | 0.22 | 2.77 | 0.22 |
| 4 | 2.70 | 0.25 | 3.57 | 0.20 | 4.43 | 0.17 | 4.71 | 0.12 | 3.90 | 0.19 | 2.86 | 0.19 |
| 5 | 2.68 | 0.45 | 3.34 | 0.36 | 4.64 | 0.25 | 5.31 | 0.23 | 4.23 | 0.28 | 2.85 | 0.40 |
| 6 | 2.75 | 0.26 | 3.69 | 0.19 | 4.66 | 0.16 | 4.85 | 0.13 | 3.98 | 0.19 | 2.97 | 0.20 |
| 7 | 2.47 | 0.32 | 3.09 | 0.29 | 4.12 | 0.20 | 4.38 | 0.17 | 3.36 | 0.23 | 2.30 | 0.29 |
| 8 | 2.59 | 0.32 | 3.18 | 0.28 | 4.12 | 0.19 | 4.46 | 0.16 | 3.60 | 0.21 | 2.41 | 0.24 |
| 9 | 3.18 | 0.28 | 4.08 | 0.22 | 5.16 | 0.17 | 5.54 | 0.14 | 4.67 | 0.22 | 3.58 | 0.21 |
| 10 | 2.91 | 0.40 | 3.47 | 0.36 | 4.74 | 0.25 | 5.33 | 0.21 | 4.38 | 0.27 | 3.13 | 0.30 |
| 11 | 2.65 | 0.29 | 3.33 | 0.26 | 4.29 | 0.20 | 4.59 | 0.16 | 3.63 | 0.24 | 2.21 | 0.28 |
| 12 | 2.52 | 0.43 | 3.20 | 0.36 | 4.51 | 0.27 | 5.29 | 0.25 | 4.20 | 0.31 | 2.68 | 0.40 |
| 13 | 3.12 | 0.28 | 3.90 | 0.24 | 4.93 | 0.20 | 5.15 | 0.14 | 4.18 | 0.23 | 3.04 | 0.22 |
| 14 | 2.94 | 0.32 | 3.59 | 0.27 | 4.56 | 0.22 | 4.90 | 0.17 | 4.07 | 0.25 | 2.85 | 0.23 |
| 15 | 3.05 | 0.25 | 4.00 | 0.20 | 4.99 | 0.15 | 5.29 | 0.11 | 4.30 | 0.20 | 3.13 | 0.18 |
| 16 | 2.99 | 0.36 | 3.55 | 0.30 | 4.52 | 0.22 | 5.05 | 0.16 | 4.33 | 0.23 | 3.16 | 0.27 |
| 17 | 2.63 | 0.29 | 3.30 | 0.26 | 4.26 | 0.21 | 4.56 | 0.17 | 3.72 | 0.22 | 2.62 | 0.21 |
| 18 | 2.87 | 0.26 | 3.71 | 0.21 | 4.69 | 0.15 | 4.96 | 0.12 | 4.03 | 0.20 | 2.92 | 0.18 |
© 2020 by the authors. Licensee MDPI, Basel, Switzerland. This article is an open access article distributed under the terms and conditions of the Creative Commons Attribution (CC BY) license (http://creativecommons.org/licenses/by/4.0/).
Share and Cite
Pelosi, A.; Terribile, F.; D’Urso, G.; Chirico, G.B. Comparison of ERA5-Land and UERRA MESCAN-SURFEX Reanalysis Data with Spatially Interpolated Weather Observations for the Regional Assessment of Reference Evapotranspiration. Water 2020, 12, 1669. https://doi.org/10.3390/w12061669
Pelosi A, Terribile F, D’Urso G, Chirico GB. Comparison of ERA5-Land and UERRA MESCAN-SURFEX Reanalysis Data with Spatially Interpolated Weather Observations for the Regional Assessment of Reference Evapotranspiration. Water. 2020; 12(6):1669. https://doi.org/10.3390/w12061669
Chicago/Turabian StylePelosi, Anna, Fabio Terribile, Guido D’Urso, and Giovanni Battista Chirico. 2020. "Comparison of ERA5-Land and UERRA MESCAN-SURFEX Reanalysis Data with Spatially Interpolated Weather Observations for the Regional Assessment of Reference Evapotranspiration" Water 12, no. 6: 1669. https://doi.org/10.3390/w12061669
APA StylePelosi, A., Terribile, F., D’Urso, G., & Chirico, G. B. (2020). Comparison of ERA5-Land and UERRA MESCAN-SURFEX Reanalysis Data with Spatially Interpolated Weather Observations for the Regional Assessment of Reference Evapotranspiration. Water, 12(6), 1669. https://doi.org/10.3390/w12061669