Article

Nitrifying and Denitrifying Microbial Communities in Centralized and Decentralized Biological Nitrogen Removing Wastewater Treatment Systems

by
Sara K. Wigginton
1,*,
Elizabeth Q. Brannon
2,
Patrick J. Kearns
3,
Brittany V. Lancellotti
4,
Alissa Cox
1,
Serena Moseman-Valtierra
5,
George W. Loomis
1 and
Jose A. Amador
1
1
Department of Natural Resources Science, University of Rhode Island, 1 Greenhouse Rd., Kingston, RI 02881, USA
2
Gloucester Marine Genomics Institute, 417 Main Street, Gloucester, MA 01930, USA
3
Department of Microbiology and Molecular Genetics, Plant Resilience Institute, Michigan State University, East Lansing, MI 48823, USA
4
Rubenstein School of Environment and Natural Resources, University of Vermont, Burlington, VT 05405, USA
5
Department of Biological Sciences, University of Rhode Island, 120 Flagg Road, Kingston, RI 02881, USA
*
Author to whom correspondence should be addressed.
Water 2020, 12(6), 1688; https://doi.org/10.3390/w12061688
Submission received: 6 May 2020 / Revised: 2 June 2020 / Accepted: 8 June 2020 / Published: 12 June 2020
(This article belongs to the Special Issue Microbial Ecology of Wastewater Treatment)

Abstract

:
Biological nitrogen removal (BNR) in centralized and decentralized wastewater treatment systems is assumed to be driven by the same microbial processes and to have communities with a similar composition and structure. There is, however, little information to support these assumptions, which may impact the effectiveness of decentralized systems. We used high-throughput sequencing to compare the structure and composition of the nitrifying and denitrifying bacterial communities of nine onsite wastewater treatment systems (OWTS) and one wastewater treatment plant (WTP) by targeting the genes coding for ammonia monooxygenase (amoA) and nitrous oxide reductase (nosZ). The amoA diversity was similar between the WTP and OWTS, but nosZ diversity was generally higher for the WTP. Beta diversity analyses showed the WTP and OWTS promoted distinct amoA and nosZ communities, although there is a core group of N-transforming bacteria common across scales of BNR treatment. Our results suggest that advanced N-removal OWTS have microbial communities that are sufficiently distinct from those of WTP with BNR, which may warrant different management approaches.

1. Introduction

Wastewater treatment plants (WTP) and onsite wastewater treatment systems (OWTS) with biological nitrogen removal (BNR) can lower the concentration of N in effluent before it is discharged to receiving waters [1], lowering the public health and environmental risks associated with N-pollution of ground and surface waters [2,3,4]. In both cases the BNR process employs some type of microbial growth surface and achieves removal by engineering conditions that promote sequential nitrification (NH4+ → NO3) in an oxic zone and denitrification (NO3 → N2O, N2) in a hypoxic/anoxic zone. Nitrogen removal is maximized by recirculation of wastewater between the oxic and hypoxic/anoxic zones.
Because they are designed to promote the same microbial processes and conditions, OWTS with BNR—commonly referred to as advanced N-removal systems—are considered to be a scaled-down version of a WTP with BNR [1], with designs explicitly based on engineering principles underlying a WTP [5,6]. This is based on the expectation that environmental selection—in this case alternating oxic and hypoxic/anoxic conditions—drives microbial community structure [7]. The validity of this assumption can have consequences for effective management of OWTS with BNR.
There are considerable differences between these two types of treatment. Centralized WTPs serve populations ranging from 103 to greater than 106 and receive inputs from a broad range of uses (e.g., homes, businesses, restaurants, manufacturing facilities, stormwater runoff), resulting in wastewater flows that range from 106 to 109 L per day [8,9]. In contrast, most OWTS serve single homes with fewer than 10 people, resulting in wastewater flows of ~103 L per day [1], between 1000 and 1,000,000 × lower than for a WTP. In addition, the hydraulic retention time (HRT) is shorter in a WTP (1 h or less) relative to an OWTS with BNR (8–12 days) [10]. Operation and maintenance conditions at WTPs are closely controlled and monitored continuously in terms of inputs (e.g., flow, C and N levels, pH), process conditions (e.g., aeration rate, dissolved O2, availability of organic C, temperature), and concentration of N in final effluent [11]. In contrast, advanced N-removing OWTS are maintained once or twice a year, with maintenance limited to the physical and mechanical aspects of the systems and are generally not monitored for N levels in treated effluent [1]. Differences in the magnitude and temporal variability of flow, in sources of microorganisms, type and concentration of electron donors and acceptors, and in the control and monitoring of system operations can result in divergent microbial communities involved in N removal in OWTS vs. WTP. Erroneous assumptions about the similarities between these systems with different scales of treatment could result in designs and operation practices that interfere with, rather than promote, the capacity of advanced N- removing OWTS to lower effluent N levels.
The microbiome of WTPs has been well described using culture-independent, high-throughput sequencing techniques [12] that can identify low abundance and transient taxa in WTP communities more accurately than culture-dependent techniques [13,14]. These advances in molecular microbial probing have allowed for analyses of the microbial community of WTPs, which have shown that communities vary as a function of geography [15,16,17], time [18,19,20], influent type [21], and zone within a treatment facility [22]. A number of the N-transforming communities of WTP—including ammonia-oxidizers [23], anammox [24], comammox [25], and denitrification [26]—have been described. Physical and chemical water properties, including levels of dissolved oxygen [27,28] and of NO3 and NH4+ [29,30], pH [20,29], organic C concentration [31], and temperature [27,32], have been identified as important factors shaping the microbial communities responsible for N removal.
The microbiome of OWTS has been the topic of comparatively few studies, mostly using culture-dependent [33,34] or low-throughput sequencing methods [33,35,36,37]. Studies describing the microbial community of OWTS using high-throughput sequencing have focused on the microbial community of the soil treatment area [38,39,40] or of mesocosms representing conventional septic tanks [41,42].
To our knowledge, only two studies have described the microbiome of BNR OWTS at the whole system scale. Brannon et al. [10] compared the abundance of N ammonia-oxidation and nitrous oxide reduction genes among nine advanced N-removal OWTS and a BNR WTP using quantitative PCR. They found that the abundance of nitrification and denitrification genes normalized by nucleic acid concentration differed between the WTP and OWTS, with higher abundance of nitrifiers at the WTP and higher abundance of denitrifies in the OWTS. Wigginton et al. [43] reported on the structure and composition of nitrifying and denitrifying communities in 38 advanced N-removal OWTS within the Greater Narragansett Bay watershed, and found that the most prevalent taxa for both communities were also associated with municipal wastewater treatment plants. They also found that the composition of denitrifying, but not nitrifying, communities was weakly driven by geographical location.
Here, we used high-throughput sequencing to describe the ammonium-oxidizing and nitrous oxide-reducing bacterial communities in nine advanced OWTS with BNR in Jamestown, RI, USA and the Field’s Point WTP BNR in Providence, RI, USA. Because Wigginton et al. [43] suggested that differences in denitrifying communities may be driven by geography, the OWTS included in the present study were all within a small island (90 km2; Jamestown, RI, USA) about approximately 40 km off the WTP, as the crow flies. We sampled the oxic and hypoxic/anoxic zones in the centralized and decentralized systems in June and October of 2016, and compared the structure and composition of the bacterial functional genes ammonia monooxygenase (amoA)—which carries out the first step of ammonia oxidation—and nitrous oxide reductase (nosZ), which carries out the last step of denitrification. Understanding the differences and similarities between microbial communities in BNR WTP and advanced OWTS can help identify which organisms are responsible for N removal at different scales of wastewater treatment. A better understanding of these communities may eventually lead to changes in design and operation that enhance N removal, especially in OWTS.

2. Materials and Methods

2.1. Study Systems

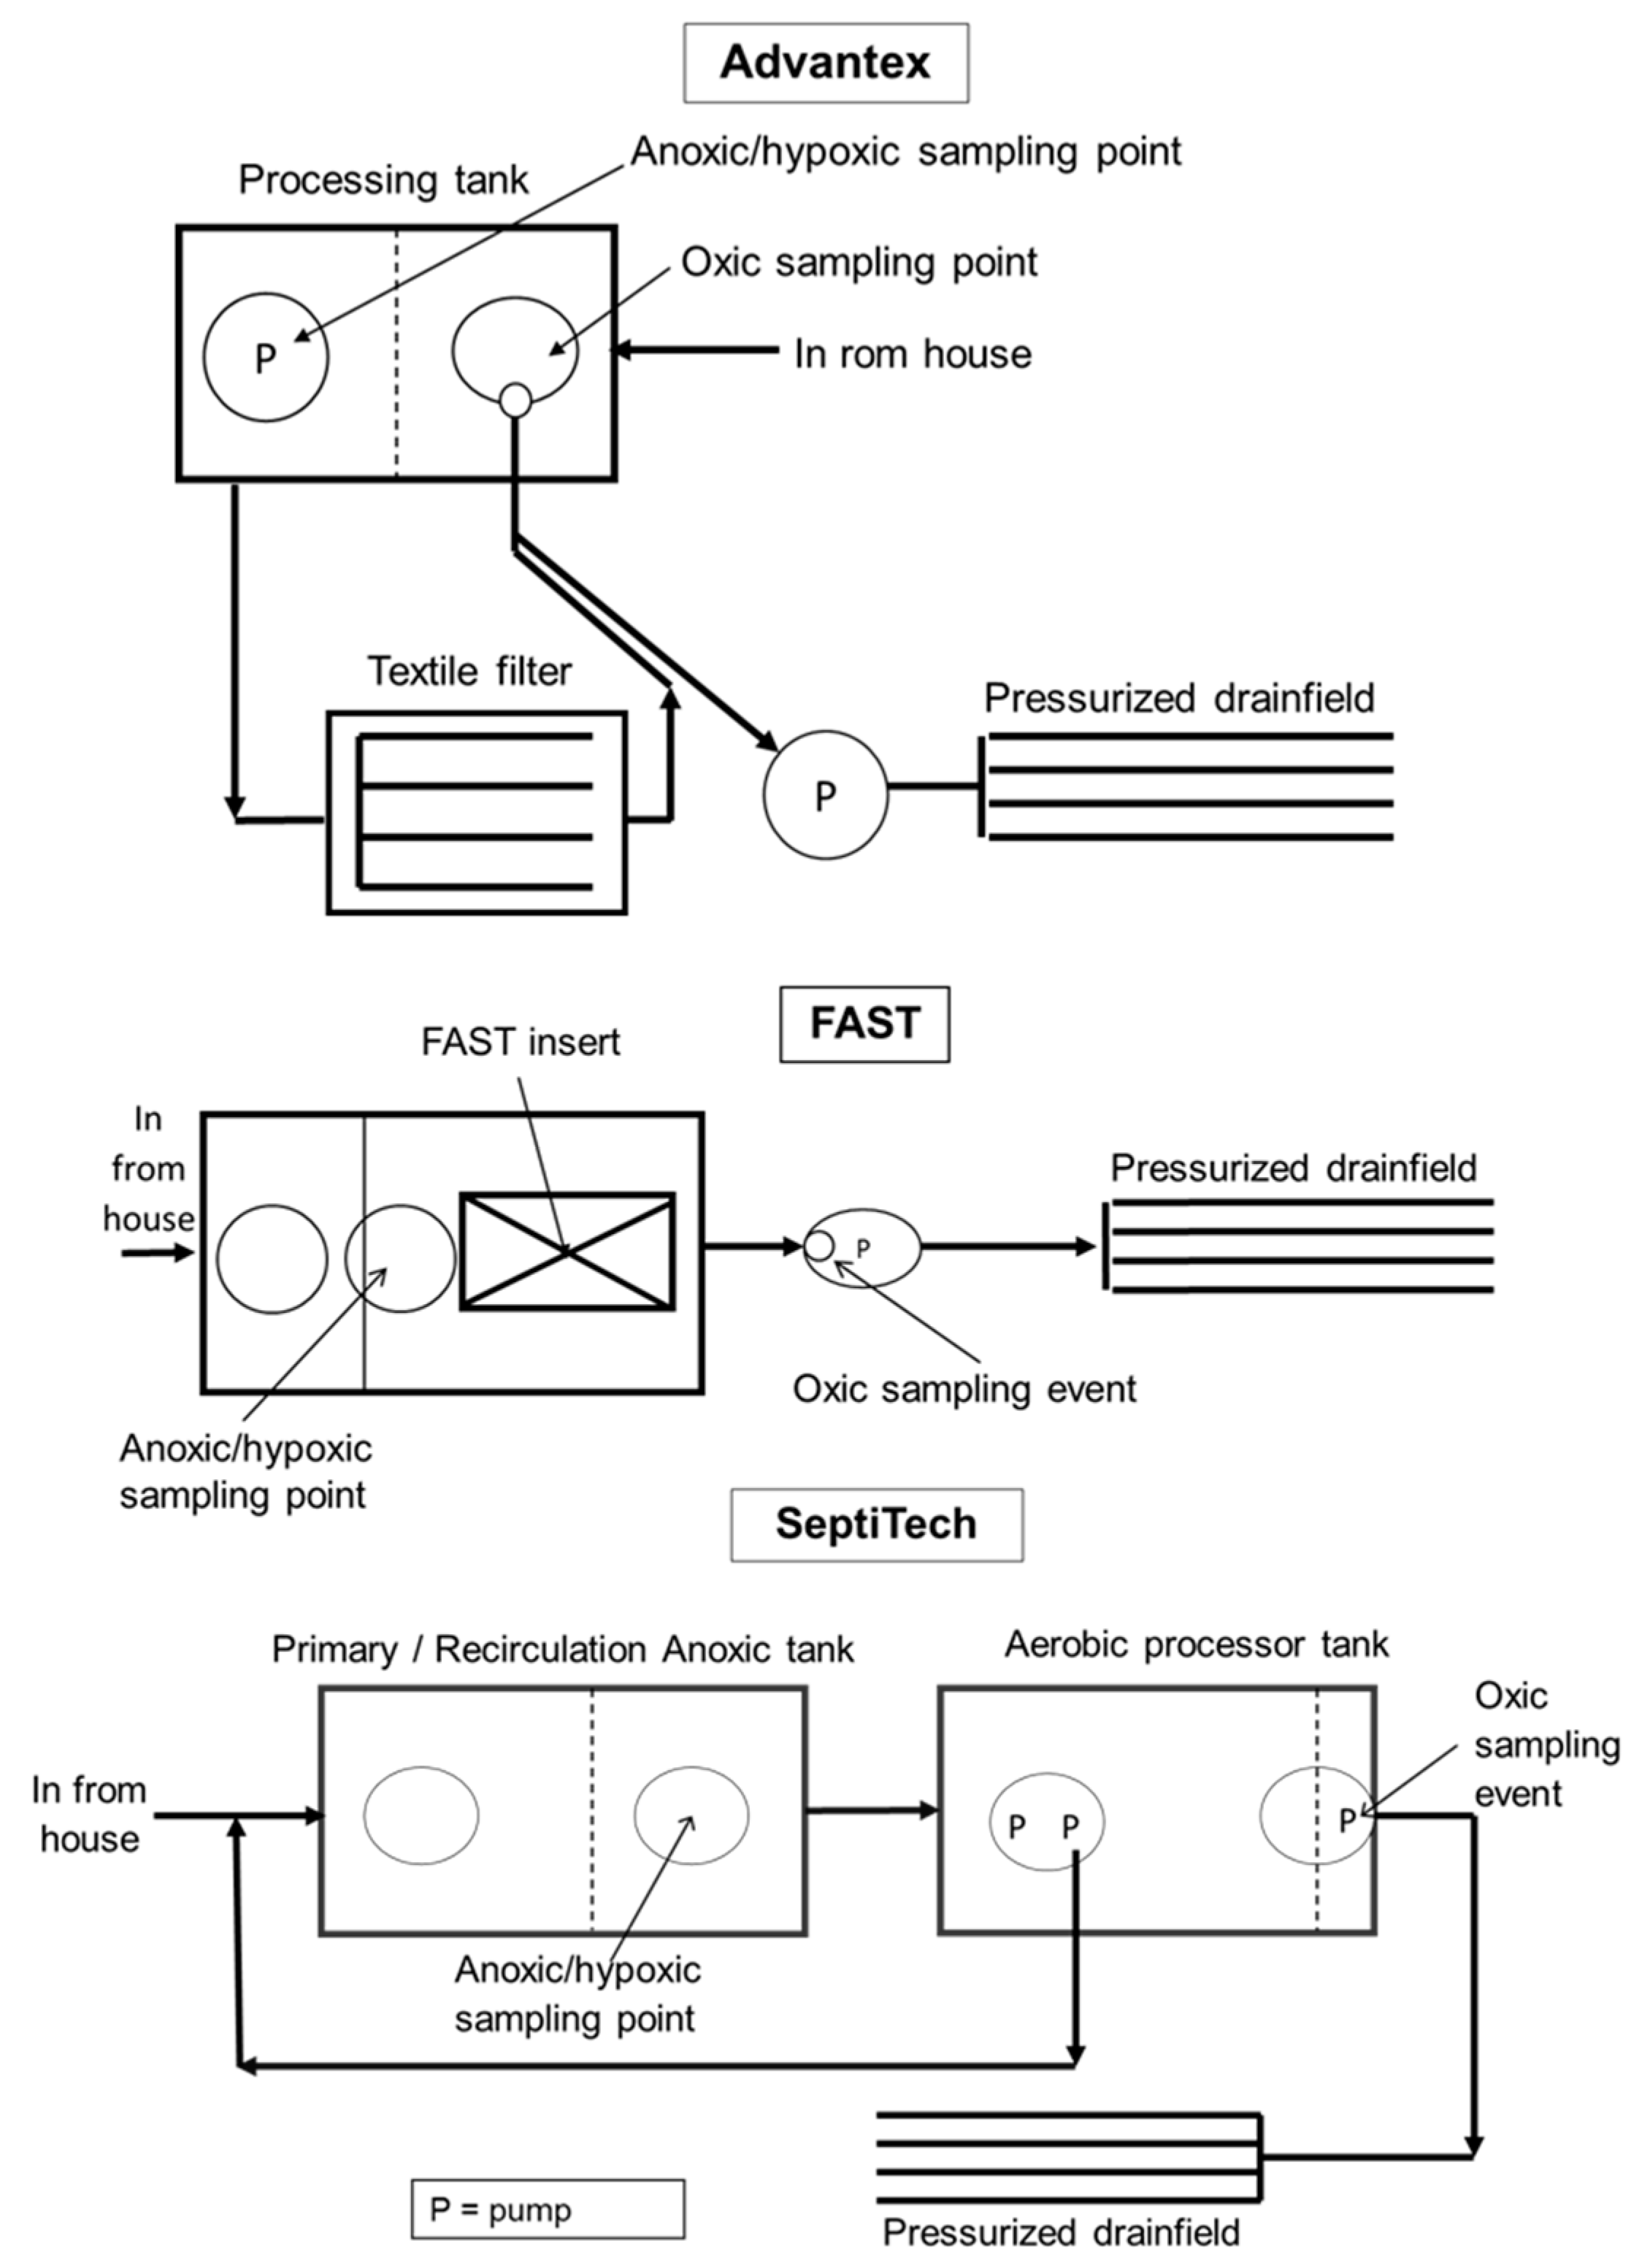
The advanced OWTS and the WTP we studied are in the Rhode Island, USA portion of the Greater Narragansett Bay watershed. The OWTS were located in the town of Jamestown, RI, USA, and served three-bedroom dwellings that used wells as their source of potable water, and represented three of the most commonly used types of advanced N-removing OWTS in the state: Orenco Advantex AX-20® (Sutherlin, OR, USA) (recirculating textile media filter, n = 3), BioMicrobics MicroFAST® (Lenexa, KS, USA) (fixed activated sludge aerobic treatment unit, n = 3), and SeptiTech D Series® (Lewiston, ME, USA) (recirculating trickling filter, n = 3). All three designs include a hypoxic/anoxic (denitrification) zone, and an oxic (nitrification) zone. The AX-20s is a textile filter design that promotes nitrification as water is time-dosed from the septic tank over hanging textile sheets and recirculated back to the processing tank that serves as the denitrification zone. Similarly, SepticTech systems remove nitrogen by time-dosing wastewater over a media filter to promote nitrification; water and sludge are then recirculated back to the processing tank which promotes denitrification. FAST systems have a submerged, fixed-film activated sludge design that promotes nitrification via a surface blower that introduces air into a submerged aerobic treatment insert with a ridged-block type media. The air current produced by the blower moves nitrified wastewater from the aerobic treatment unit into an anoxic/hypoxic area around the insert. The media filters/inserts in these systems are designed to provide habitat for microbial community and biofilm establishment through inputs from the household during a start-up phase (<3 months). Wastewater is recirculated between the nitrification component and the denitrification reactor component via time-dosed pumps in the AX-20 and SeptiTech systems; in the FAST systems, air from the blower forces nitrified effluent from the insert back to the denitrification reactor component through a channel. All OWTS were installed between 2006 and 2014.
The Field’s Point WTP is in Providence, RI, USA and serves approximately 226,000 residents [10]. It provides treatment for combined domestic and industrial wastewater and includes an Integrated Fixed Activated Sludge (IFAS) BNR system as part of secondary treatment. The WTP contains 10 identical open-air tanks each consisting of four zones: pre-anoxic, aerated IFAS, post- anoxic, and re-aeration. A portion of the solids and wastewater are returned to the pre-anoxic zone from the end of the aerated IFAS via internal mixed liquor return. The aerated IFAS zone contains high-density polyethylene cylinder media to provide surface area for biofilm growth. Further description of the WTP and OWTS systems, including average operating parameters (BOD5, NH4+, NO3, temperature, flow, pH, dissolved oxygen (DO), total N) can be found in Appendix A and in Brannon et al. [10] and Lancellotti et al. [44].

2.2. Sample Collection and DNA Extraction

Samples were collected from the WTP and OWTS in June and October of 2016. The oxic and anoxic zones of the nine advanced OWTS were sampled, and one of the IFAS tanks at Field’s Point was sub-sampled by zone (Figure A1). Samples from the oxic zone of OWTS were obtained at the recirculating splitter valve, drainfield pump basin, and discharge pump basin within the processor for Advantex, FAST and SeptiTech technologies, respectively (Figure A2). During each sampling event (June and October 2016), we collected one sample from the anoxic/hypoxic zone (i.e., primary processing tank, Figure A2) of the advances OWTS, and one from the oxic zone (Figure A2), for a total of 36 OWTS samples. At the WTP, all four zones in the tanks were sampled and grouped by treatment (i.e., aerated or anoxic) for analysis (Figure A1). In June, the zones at the WTP were sampled in triplicate and in October the zones were sampled in duplicate, for a total of 20 WTP samples. In all cases sampling took place between 8:00 a.m. and 4:00 p.m. Samples were collected in sterilized, 1-L plastic Nalgene bottles from just below the water surface and stored at 4 °C for a maximum of 8 h before filtering a known volume (~100 mL) of sample onto a sterile, 0.22-μm-pore-size nitrocellulose membrane filter (MilliporeSigma, Burlington, MA, USA). DNA was extracted from the filters using a PowerWater DNA Isolation Kit (MoBio Laboratories, Inc., Carlsbad, CA, USA).
Samples from the WTP were collected from just below the water surface in one of the tanks in the IFAS from each of the four zones: (1) pre-anoxic, (2) aerated IFAS, (3) post-anoxic, and (4) re-aeration (Figure A1). June samples were collected in triplicate and October samples were collected in duplicate. A known volume (~50 mL) of sample was centrifuged at 3000× g for 15 min, the supernatant liquid decanted, and DNA was extracted from the solid pellet using a PowerSoil DNA Isolation Kit (MoBio Laboratories, Inc., Carlsbad, CA, USA). DNA samples were stored at −20 °C or below until analyzed.

2.3. Miseq Illumina Sequencing

Before sequencing, we optimized PCR reactions to amplify nosZ and amoA target amplicons using the primer pairs nosZ 1F (5’ CGY TGT TCM TCG ACA GCC AG 3’) and nosZ 1662R (5’ CGS ACC TTS TTG CCS TYG CG 3’) [45] and amoA 1F (5’ GGG GTT TCT ACT GGT GGT 3’) and amoA 862R (GAA SGC NGA GAA GAA SGC) [46]. Each 50 µL reaction contained: 2.5 µL DNA template, 25 µL BIO-X-ACTTM Short Mix (Bioline, Taunton, MA, USA), 21.25 µL H2O, and 1.25 µL (10 µM) of each amoA primer or 1 µL (10 µM) of nosZ primers. Thermocycler settings for nosZ were: 4 min at 94 °C, 35 amplification cycles (each 60 s at 94 °C, 60 s annealing at 61 °C, and 60 s at 72 °C), and a final extension at 72 °C for 10 min. Thermocycler settings for nosZ were: 4 min at 94 °C, 35 amplification cycles (each 60 s at 94 °C, 60 s annealing at 58 °C, and 60 s 72 °C), and a final extension at 72 °C for 5 min. The resulting amplicons were visualized on a 1% agarose gel to ensure a single band of the correct size (417 and 349 basepairs for nosZ and amoA respectively) was produced and samples were then sequenced at the University of Rhode Island Genomic Sequencing Center (Kingston, RI, USA) on an Illumina Miseq Next Generation Sequencer using MiSeq Reagent kits v2 (500-cycles, Illumina San Diego, CA, USA) Six nosZ (two WTP and four OWTS) and 11 amoA samples (all OWTS) failed to band after PCR amplification and were not sent for sequencing.

2.4. Data Analyses

We used QIIME (version 1.9.1) [47] to join pair end reads, remove sequences that could not be joined, and demultiplex samples following Wigginton et al. [43]. Briefly, we quality-filtered sequences following Bokulich et al. [48], checked for chimeras using USEARCH in de novo mode [49], and clustered sequences into representative OTUs (operational taxonomic units, a proxy for species-level distinction) using swarm [50]. Clusters were based on a 90% identity similarity threshold for nosZ [51] and an 85% identity similarity threshold for amoA [52]. We rarefied data to the lowest sequencing depth—2028 and 1430 sequences per sample for nosZ and amoA, respectively—and calculated alpha diversity metrics (species richness and Shannon’s diversity index) using QIIME (version 1.9.1). To identify representative OTUs for nosZ, we used the nucleotide-nucleotide Basic Local Search Alignment Tool (BLASTn, version 2.6.0, National Center for Biotechnology Information, Bethesda, MD, USA) to construct a reference database to determine the closest sequences in the National Center for Biotechnology Information database [53]. To determine the closest amoA identity matches, we cross referenced each representative sequence against the Ribosomal Database Project (RDP) amoA bacterial database [54]. The complete QIIME pipeline, including information on database construction, can be found at https://github.com/pattyjk/Wigginton_et_al_2018_J_Environ_Qual. Sequence data from our study have been deposited in the Sequence Read Archive (Accession no.: SRP149713; https://www.ncbi.nlm.nih.gov/sra).
We used the vegan package (version 2.5-6) [55] in RStudio (version 1.2.1335, R version 3.6.1) [56] to rarefy samples and calculate beta diversity. We used the packages phyloseq (version 1.30.0) [57] and ggplot2 (version 3.2.1) [58] to calculate and graph principal coordinate analyses (PCoA) and taxonomy bar plots.

3. Results and Discussion

3.1. Species Richness and Diversity

3.1.1. amoA

The median number of unique OTUs of bacteria containing amoA across all dates and zones was 16.5 in OWTS samples (Figure 1), nearly identical to that for all dates and zones in the WTP (16.2). Richness for amoA in the WTP varied considerably among samples and was highest in the anoxic/hypoxic zone in June (37.8 OTUs), with the lowest value (10.5 OTUs) in the anoxic/hypoxic zones in October. The lowest value of amoA richness in the OWTS was 6.7 OTUs in the hypoxic/anoxic zone in October, and the highest value (36.6 OTUs) occurred in the oxic zone in October. Brannon et al. [10] found that the Fields Point WTP had higher specific abundances of amoA compared to advanced OWTS in Jamestown, RI, USA. These results suggest an opposite pattern between abundance and diversity and that nitrifying communities in the WTP exist in large populations with less diversity than OWTS that form smaller, more diverse communities.
The median value of Shannon’s diversity index (a measure of species richness and relative abundance) for amoA was higher in OWTS (2.2) than for the WTP (1.6). We did not observe a clear pattern in diversity in OWTS based on either season or zones. In contrast, amoA diversity at the WTP was higher in June than October in both oxic and anoxic zones, suggesting a seasonal effect on diversity that was not observed in OWTS (Figure 1). The tanks at the WTP are open to the air, and thus more likely affected by weather variables, such as temperature and precipitation, compared to OWTS tanks, which are installed underground. Others have observed lower amoA abundance and phylogenetic diversity with decreasing temperature in NH4+-rich wastewater in WTPs [59]. The similarity in amoA richness and diversity between OWTS and WTP may result, at least in part, from the limited number of taxa that are capable of ammonia oxidation [60].
We observed a high diversity of amoA bacteria in zones engineered to promote anoxic/hypoxic conditions. The transfer of wastewater from aerated to hypoxic/anoxic components may promote diversification of amoA communities in response to low oxygen, by selecting for taxa that are capable of nitrifier denitrification, and/or by consuming O2 that is produced during anaerobic ammonium oxidation [61,62].

3.1.2. nosZ

Across all dates and zones, the median nosZ richness was lower in the OWTS (87 OTUs) than at the WTP (141 OTUs) (Figure 1). At the WTP, the lowest (47 OTUs) and highest (225 OTUs) observed richness both occurred in the oxic zone in June. In the OWTS, the lowest observed richness (25 OTUs) was in the oxic zone and the maximum observed richness (188 OTUs) was in the anoxic/hypoxic zone, both during the June sampling event.
Like species richness, the Shannon’s diversity index for nosZ was consistently higher for the WTP than the OWTS, which had median values of 3.0 and 4.7, respectively (Figure 1). The lowest WTP diversity was 2.4 and the highest value was 5.5, both in the oxic zones during the June sampling event. The lowest diversity value in the OWTS (0.05) was in the anoxic/hypoxic zone in October, and the highest value was 4.4 in the anoxic/hypoxic zone in June. While we observed lower nosZ diversity in OWTS than in the WTP, Brannon et al. [10] found that the WTP had lower specific abundances of nosZ compared to advanced OWTS in Jamestown, RI, USA. The opposite patterns observed between abundance and diversity suggests that N2O reducing communities in the WTP are made up of smaller, highly diverse populations, while OWTS form large, less diverse communities.
The capacity, or size, of a WTP is positively related to microbial diversity [63,64]. Our results are consistent with these findings, with higher diversity of nosZ at the WTP. This is in line with the taxa- space relationship, a well-established ecological niche principle important in structuring microbial communities [65] which, in this case, is related to the amount of niche space available for denitrifiers in wastewater treatment. In addition to providing more niche space, the WTP has inputs of microorganisms from thousands more inhabitants and from industrial waste streams [10], making it more likely to have greater microbial diversity. Differences in diversity metrics among WTPs with different inputs have been reported, with higher diversity in WTP treating domestic wastewater compared to those treating industrial wastewater [20,21].
Taxa possessing nitrous oxide reductase were similarly diverse between oxic and hypoxic/anoxic zones within a type of treatment, suggesting that nosZ communities within a treatment type are not affected by the level of oxygen present. Indeed, strains of Pseudomonas, a genus often associated with wastewater treatment and present in our samples (discussed below), can grow and express nosZ rapidly in NO3 growth media, even in the presence of high oxygen levels [66,67,68]. nosZ diversity is likely not affected by the presence of oxygen because denitrifiers are facultative anaerobes, and some can reduce oxidized N compounds under oxic conditions [69]. Additionally, Chen et al. [70] suggested that some denitrifiers can simultaneously perform aerobic and anaerobic respiration in a single metabolic pathway under dynamic oxygen conditions. Although we did not examine this possibility, a dual pathway reducing O2 and NO3 would be advantageous for bacteria that live in these systems, which have varying oxygen levels and a high NO3 concentration.

3.2. Community Structure

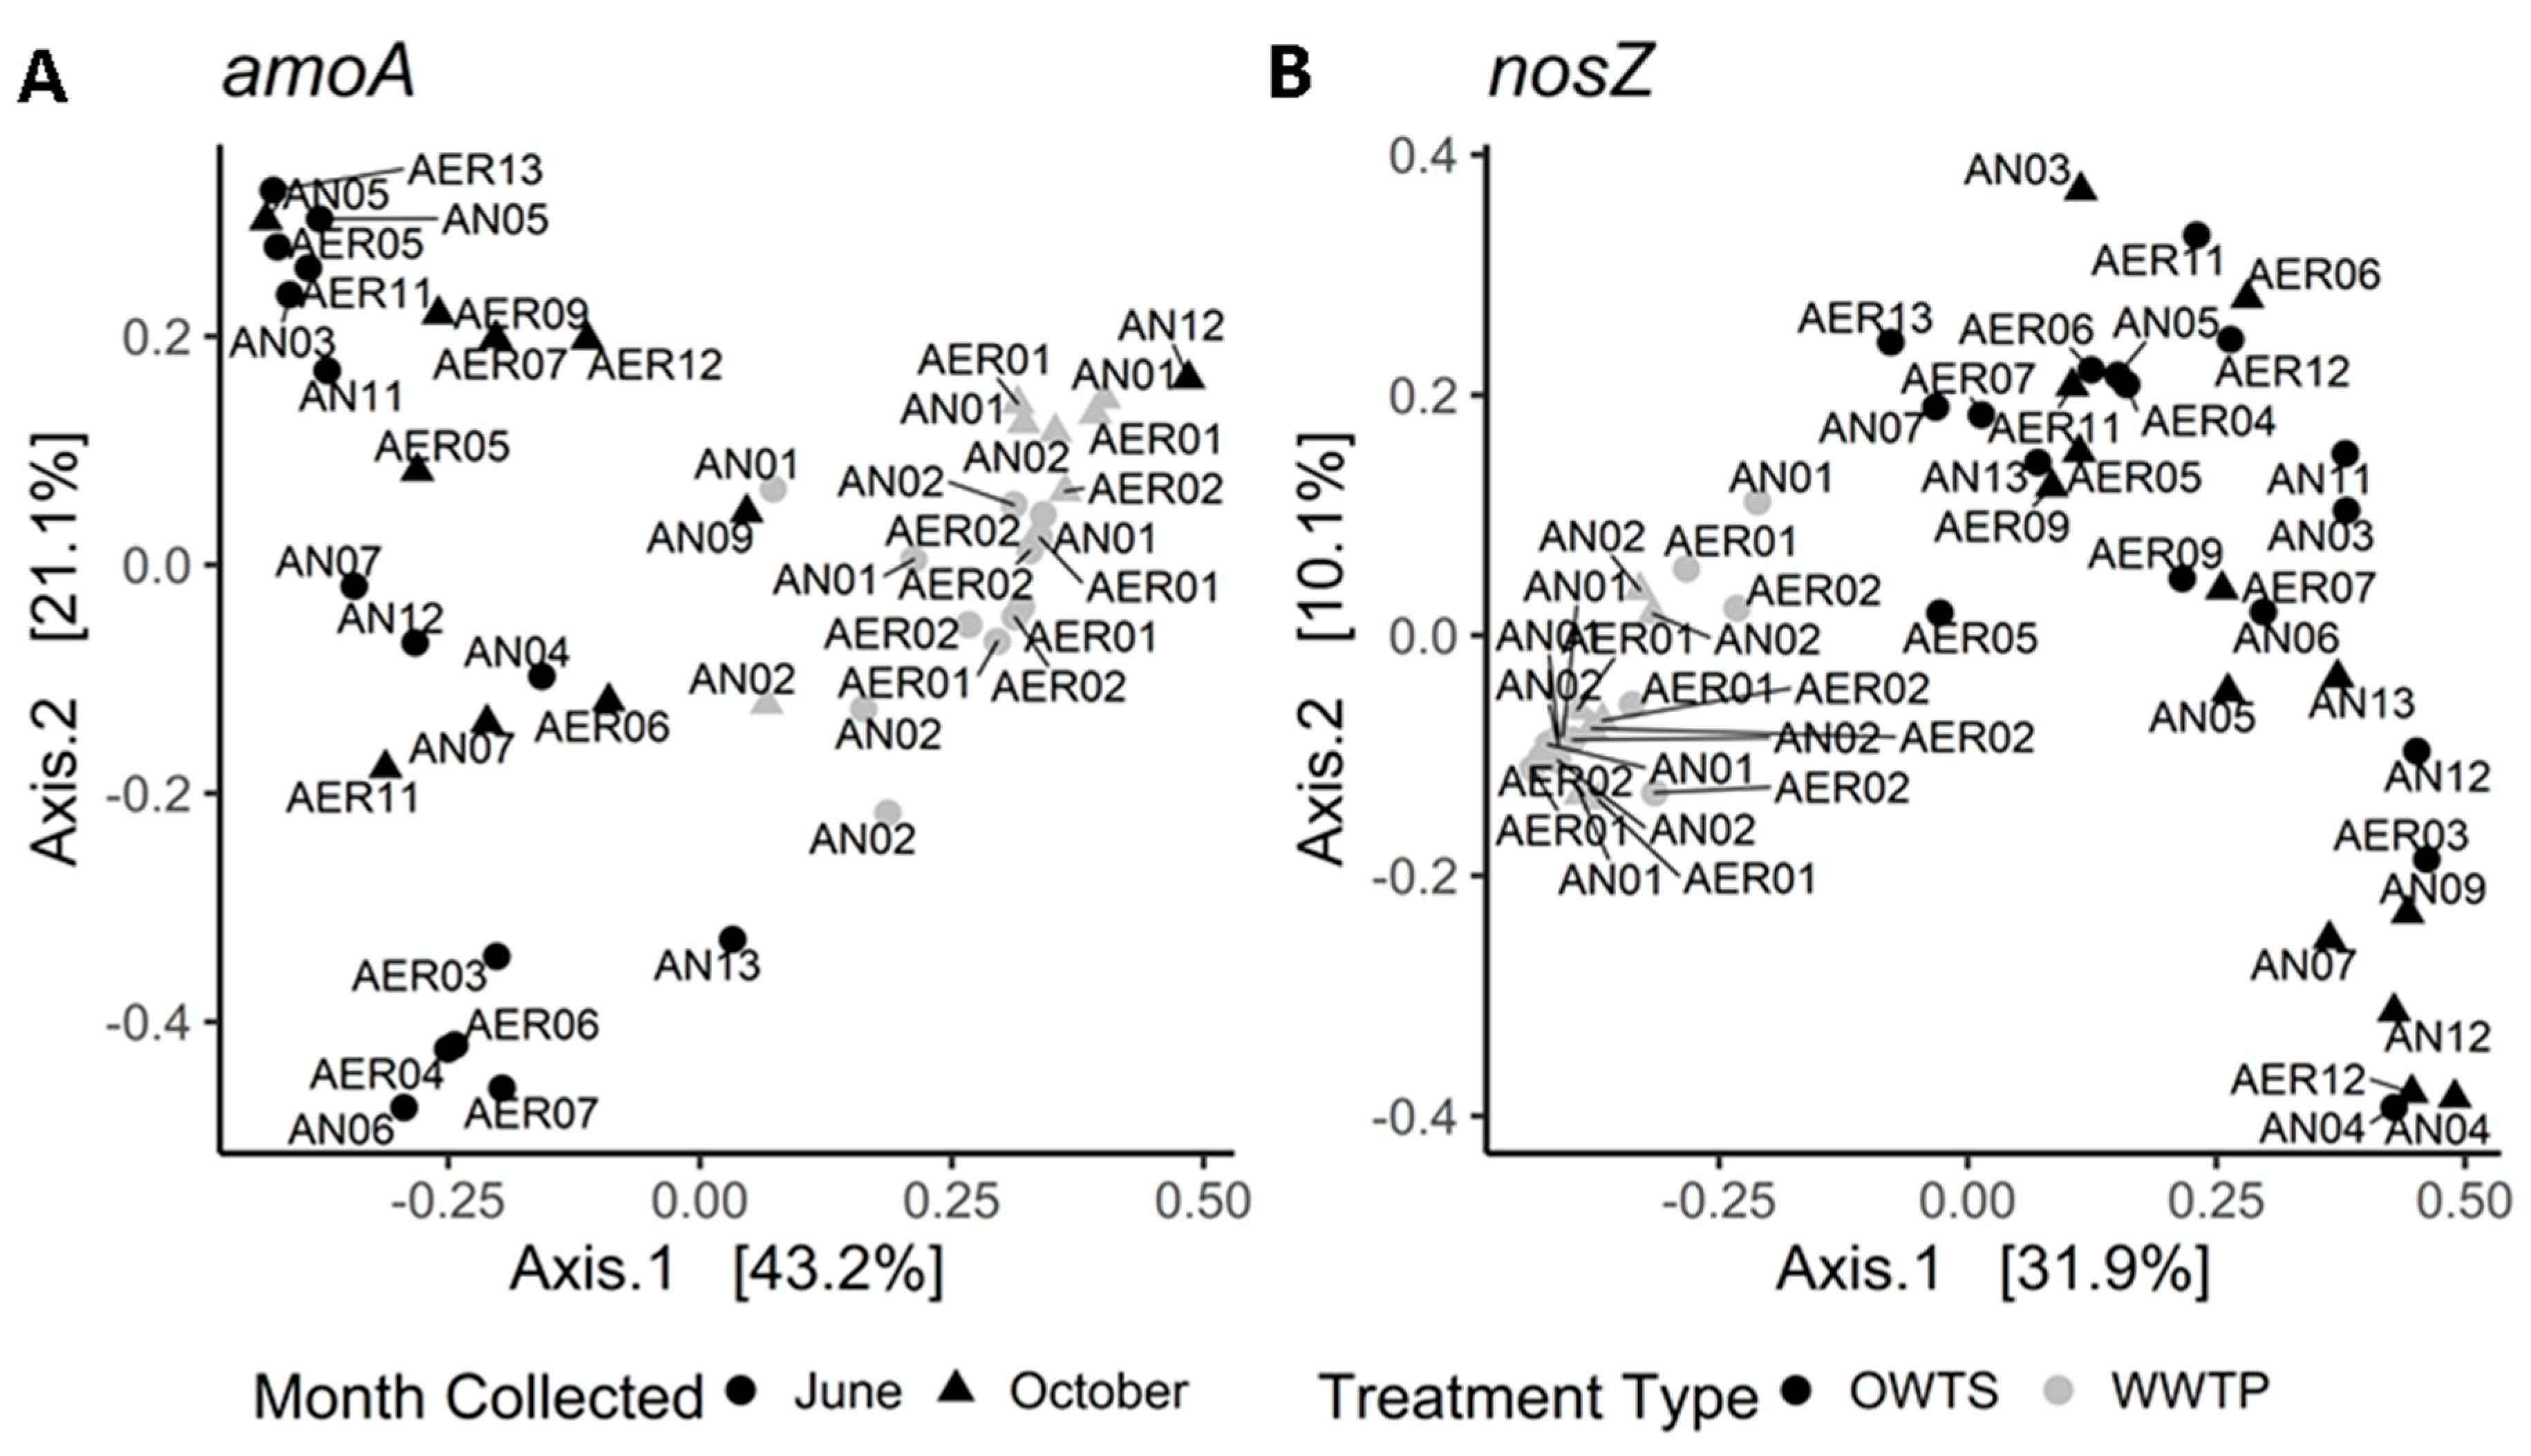
Beta diversity patterns for amoA and nosZ showed clear clustering by treatment type, with OWTS samples clustering separately from WTP samples (Figure 2). The chemical composition of influent—i.e., the type and concentration of substrates and inhibitors—drive community differences in WTPs [71], and likely contribute to differences between treatment types for both genes.
We observed tighter clustering patterns among WTP samples compared to samples collected from OWTS. This is not unexpected, since we subsampled a single WTP vs. nine OWTS, which were separate in space and affected by unique household inputs. It is surprising, however, that all the WTP samples, even those collected from different tanks on different months, cluster more closely together than many of the OWTS samples collected from the same system, on the same month, but in different components (e.g., systems 04 and 07 in Figure 2). This is especially notable, considering the differences in the scale of treatment between WTP and OWTS: BNR treatment zones at the WTP ranged in capacity from 1.4 × 10⁵ to 1.5 × 10⁶ L, whereas the capacity of the largest OWTS component was less than 8.5 × 10³ L. The high level of homogeneity in the WTP may be explained by the high flow and low HRT in this type of treatment compared to the OWTS, which likely causes more mixing of species between WTP zones than takes place between OWTS zones.
Four amoA samples from the anaerobic tanks were distinct from the main WTP cluster (Figure 2). This, in conjunction with the findings of high amoA diversity in anoxic/hypoxic zones discussed above, reinforces the idea that amoA may diversify in response to a low oxygen environment.

3.3. Taxonomy

3.3.1. amoA

After the data were rarefied, we recovered a total of 168 unique amoA sequences from 45 samples collected from the WTP and the nine OWTS. Of these, 72 strains could be matched (85% identity match) to a species in the Ribosomal Database Project (RDP) amoA database [72]. The most ubiquitous ammonia-oxidizing bacteria were in the genera Nitrosomonas and Nitrosospira. Two ammonia- oxidizing species—Nitrosomonas oligotropha and an unidentified nitrifier (OTU 1096)— were present in both types of treatment, in both seasons, and in the oxic and anoxic zones of both treatment types. Nitrosomonas oligotropha is ubiquitous in WTPs [23,73]. Two other Nitrosomonas strains were also ubiquitous across sampling dates and OWTS locations in both treatment types (Table 1). Fan et al. [31] found that Nitrosomonas was among the top four genera detected in the entire microbial community of an activated sludge WTP.
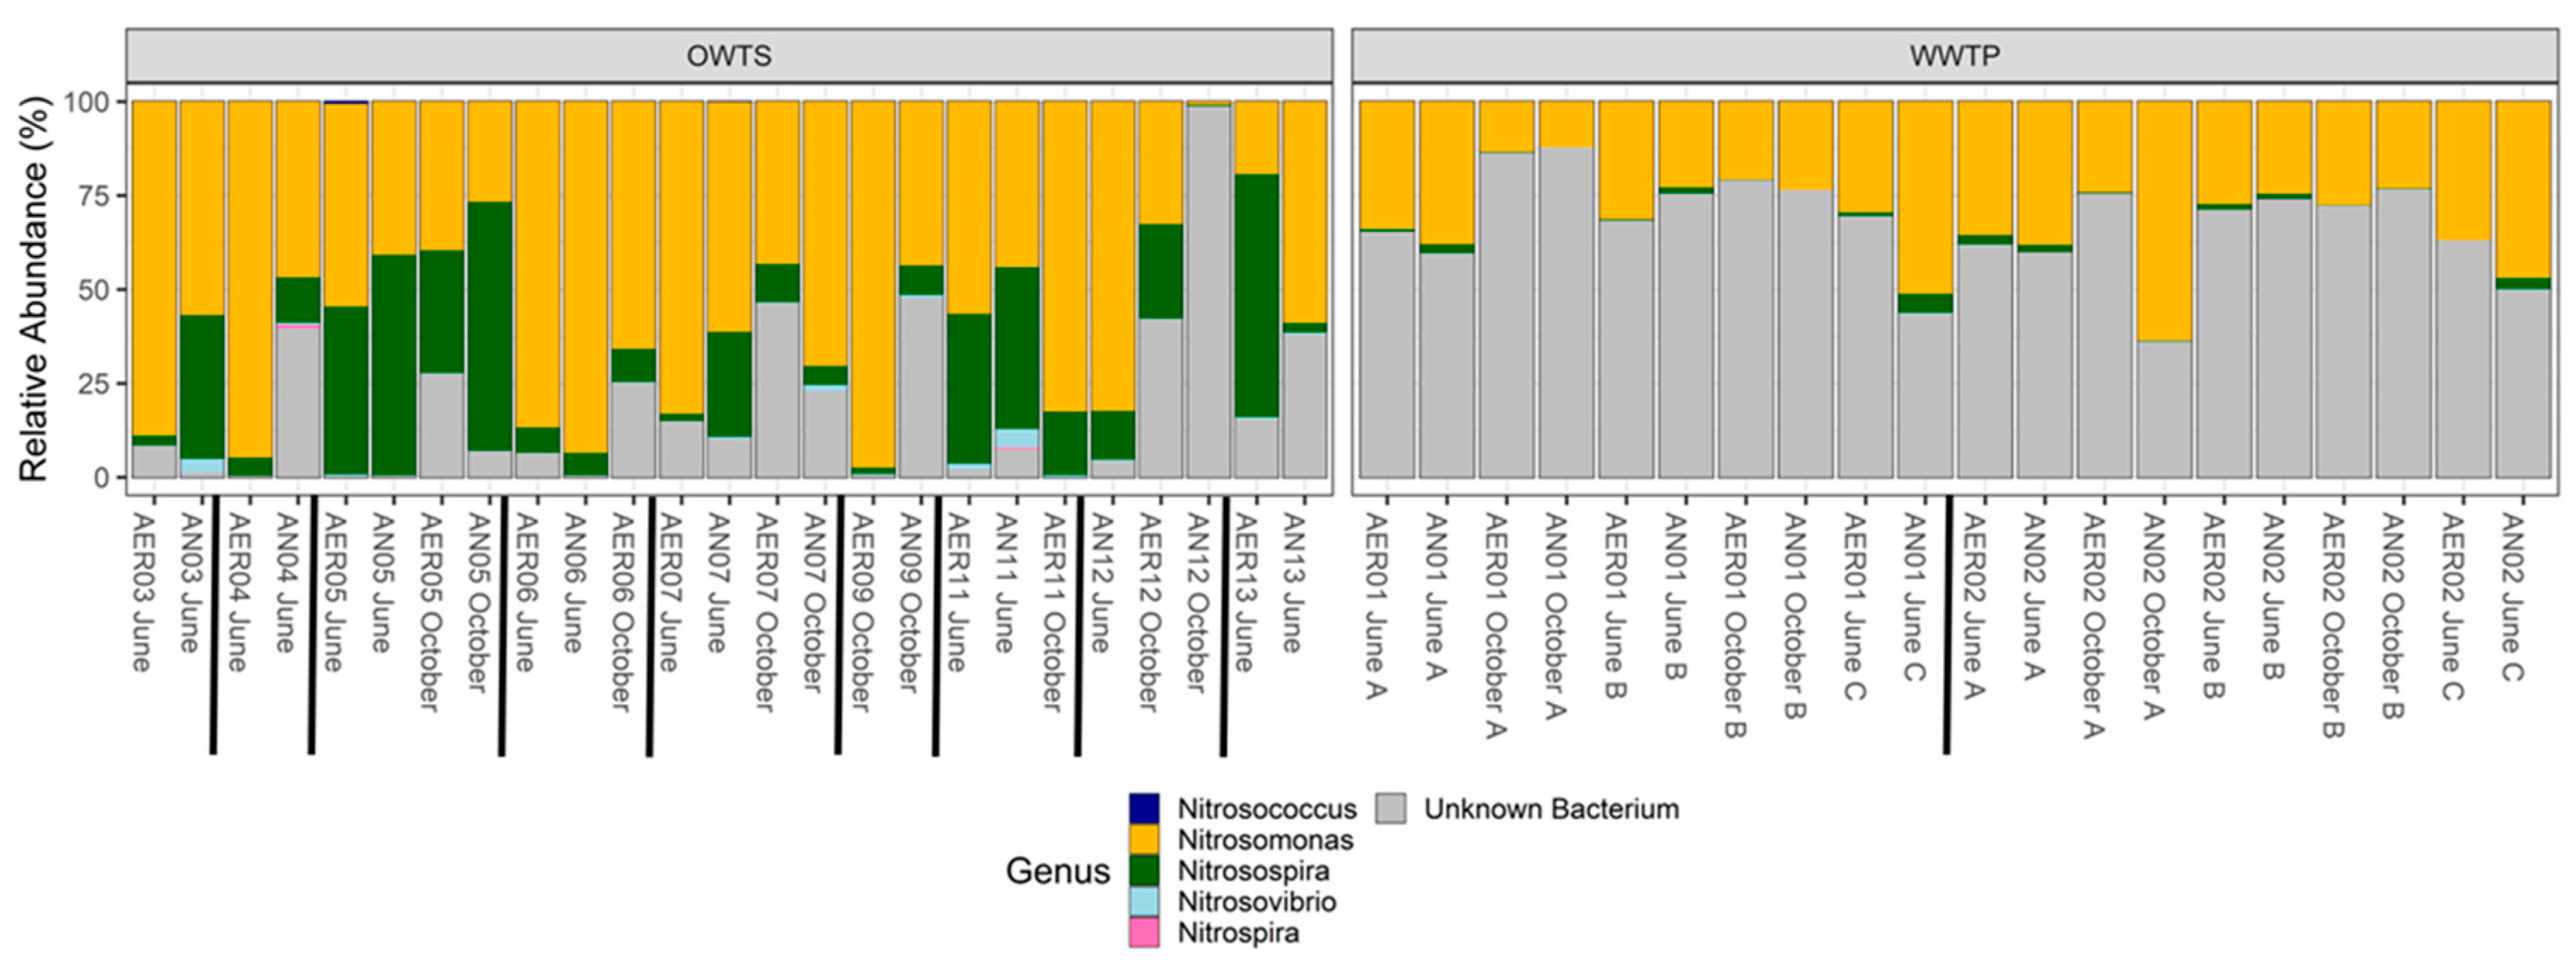
Nitrosospira—the most common nitrifying bacterium found in soil [74]—is likely introduced into an OWTS from soil that enters the tank initially during installation, and possibly when the tank is periodically opened for inspection. Nitrosomonas has a faster growth rate than Nitrosospira in WTPs [71], which may explain why Nitrosospira makes up a higher proportion of the community in OWTS, which have a much longer HRT than the WTP, which is selective for slow-growing organisms. Nitrosospira strains had higher relative abundance in the OWTS than at the WTP, accounting for most of the population in most OWTS samples (Figute 3). Similarly, Nitrosovibrio was better represented in OWTS than in the WTP. Nitrospiria, which can co-oxidize ammonium and nitrite [25], was present in the anoxic zones of two OWTS in June but was not present in the WTP (Figure 3).
Many OTUs abundant in all WTP samples did not match any amoA strains in the RDP database. Most of these were present transiently or completely absent from the OWTS samples. Most sequences do not match strains from any database [75]; however, it is interesting that two wastewater treatment systems designed to promote the same microbial processes would have such different relative proportions of identified and unidentified species represented among the most abundant taxa. As suggested previously, these differences may be caused by the introduction of soil when OWTS are installed and inspected, suggesting that soil is an important source of ammonia-oxidizing bacteria for these systems. This would result in a larger number of identified strains in the OWTS because a portion of their community comes from soil—an ecosystem that has been comparatively better studied than wastewater. For example, a search of ‘amoA soil bacteria’ on the NCBI (National Center for Biotechnology Information) nucleotide database returned 25,224 submissions, whereas searching ‘amoA wastewater bacteria’ returned only 6320 submissions, suggesting that soil amoA communities have been better studied than communities in wastewater. Although the role of diversity and community composition is still being investigated [76], there is evidence that these affect many microbial processes [77,78]. In a mesocosm microbial diversity experiment, Trivedi et al. [79] found that amoA diversity was highly correlated with function. As such, we suggest that soil as an additional source of amoA diversity may be important to maintaining NH4+ oxidation function in the OWTS.

3.3.2. nosZ

In 50 samples from the WTP and OWTS, we identified 601 unique OTUs of nosZ from rarefied data, of which 209 could be matched to a sequence on the NCBI database using a 90% identity similarity threshold [72]. The WTP contained 327 OTUs, while the OWTS contained 421 unique sequences. Although only one nosZ strain—Pseudomonas sp. CC6-YY-74 (Table 1)—was present in all OWTS, we found five OTUs present across all WTP samples. Of these, Aeromonas media WS and Thauera phenylacetica strain TN9 were also common in OWTS, and two unclassified Alphaproteobacteria were absent or transient in many of the OWTS (Table 1). These differences are likely due to the differences in wastewater sources discussed previously. The overlap in dominant strains could be caused by a small group of ubiquitous, generalist wastewater denitrifiers.
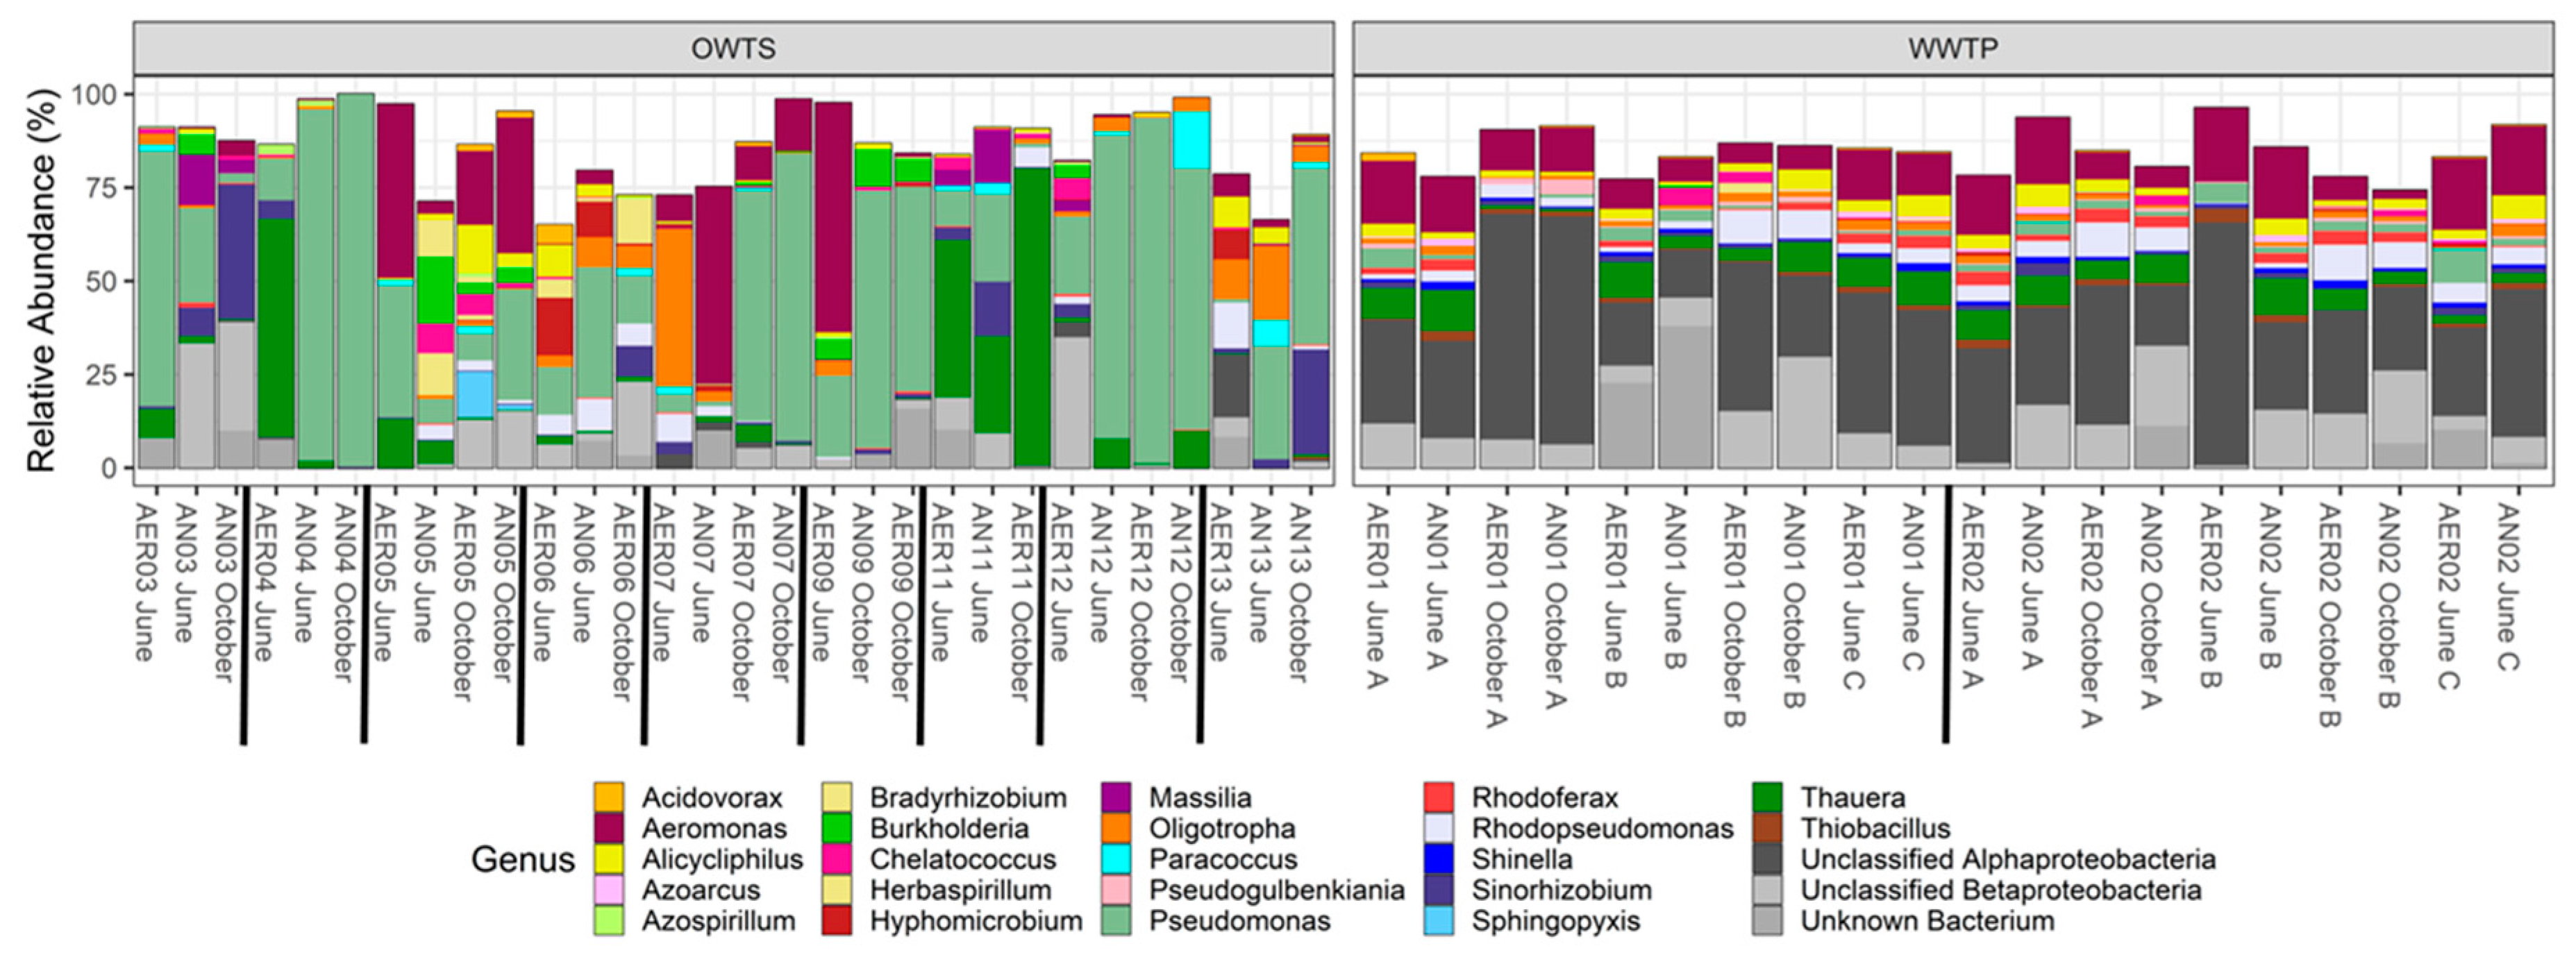
Because there were many nosZ taxa with low relative abundances, we only included the 50 most abundant taxa in bar plots to increase clarity and visibility (Figure 4). Aeromonas and Pseudomonas were widespread N2O reducing genera in both types of treatment. Some OWTS completely lacked one genus or the other, whereas Pseudomonas dominated other systems to the point of near exclusion of all other genera (Figure 4). It is unsurprising that Aeromonas was present throughout both types of treatment systems as it is ubiquitously found in water environments, has been detected in many types of food, is a facultative anaerobe, and includes many strains that are human pathogens [80]. Pseudomonas sp. CC6-YY-74, the ubiquitous N2O reducer, has been cultured under aerobic conditions and its complete genome described, which shows that it is capable of full denitrification as well as five other energy-yielding N-transforming pathways [81]. This ability to use a variety of N compounds for energy and growth likely gives this strain a competitive advantage in high N environments like wastewater. Many of the most common N2O-reducing strains that we observed have been cultivated aerobically (e.g., Aeromonas, Pseudomonas, Shinella), which agrees with our observation of similarities in the nosZ communities of oxic and anoxic/hypoxic zones in the centralized and decentralized treatment systems. Homogeneity in microbial community composition across zones and oxygen gradients was also observed by Zhu et al. [20] at four WTPs in China.
Thauera, Alicycliphilus, Oligotropha, and Rhodopsueudomonas were also important nosZ genera in both types of treatment systems, although again Pseudomonas generally outnumbered these in OWTS systems, especially system 04 (Figure 4 and Table 1). Bradyrhizobium, Sinorhizobium, Burkholderia, and Paracoccus were associated more often with OWTS, whereas Pseudogulbenkiania, Rhodoferax, Shinella, and Thiobacillus were more often associated with the WTP (Figure 4). Certain genera found in higher relative abundances in OWTS are usually found in soil, including N-fixers like Bradyrhizobium and Sinorhizobium. This suggests that the soil entering OWTS during inspection is important to inoculate systems with denitrifying bacteria and, as we proposed with amoA, may be an important source of functional redundancy in N2O reduction populations in OWTS. In their mesocosm diversity experiment, Trivedi et al. [79] found that N2O flux was negatively correlated with nosZ diversity, suggesting that communities with higher diversity are able to reduce higher amounts of N2O. Inoculation with soil may thus provide an important source of nosZ diversity to maintain this function in OWTS.
Genera that were in higher relative abundances in the WTP generally had the ability to survive in environments with lower C concentrations than those in the OWTS. For example, Thiobacillus, a genus that includes facultative and obligate chemolithotrophs and facultative anaerobes [82], may be more competitive in a WTP, where the organic C levels are lower (due to mixing with inputs with low C concentration) relative to OWTS [1]. In contrast, a higher concentration of organic C in OWTS [1] may favor heterotrophic over autotrophic denitrifiers. Other bacteria found preferentially in WTP include the genus Rhodoferax, a purple non-sulfur bacterium that includes strains capable of phototrophy [83] and oxidation of acetate [84], and Shinella zoogloeoides BC026, a strain commonly found in WTP that can use pyridine—a common pollutant in industrial wastewater [85]—aerobically as its sole C, N, and energy source [86].
As was the case for amoA, we observed a higher ratio of strains with a close match on the NCBI’s database in the OWTS than the WTP for the most common species of nosZ (Figure 4), possibly because soil organisms are more likely to be present in higher proportion in the OWTS, and many more soil samples have been submitted to the NCBI database compared to WTP samples. A search of “nosZ soil” on the NCBI nucleotide database returned 15,796 submissions, whereas searching “nosZ wastewater” returned only 791 submissions, suggesting that soil nosZ communities have been better studied than communities in wastewater.

4. Conclusions

There were major differences in ammonia-oxidizing and nitrous oxide-reducing community composition and structure between centralized and decentralized BNR wastewater treatment systems. amoA richness and diversity were similar at the two treatment scales, but nosZ diversity and richness were higher in the WTP than in the OWTS. Ordination analysis of beta diversity showed clear differences in the amoA and nosZ communities between the WTP and the OWTS. Relative abundances of Nitrosomonas and Nitrosospira were different between the WTP and the OWTS. The higher diversity and closer clustering of beta diversity for nosZ in the WTP suggests that the larger scale of treatment supports a wider variety of denitrifiers in sufficiently large numbers to maintain more heterogeneous communities compared to OWTS. We also observed nosZ genera with more diverse metabolic strategies in the WTP. Together, these factors may make the WTP more resilient to environmental changes such as shifts in climate and influent properties. Like nosZ, amoA community composition was more similar within a scale of treatment, but the community of WTP and OWTS had similar alpha diversity metrics, likely because there is a limited number of nitrifying taxa.
The structure and composition of nosZ and amoA communities were similar between oxic and hypoxic/anoxic zones in both types of treatment, suggesting that differences in oxygen concentration within components are not the main drivers of microbial community composition. Although the WTP and OWTS communities were distinct, a small number of ammonium-oxidizing and nitrous oxide-reducing species were ubiquitous across all treatment types, sampling dates, and replicates. Our results also suggest that the introduction of soil bacteria in the OWTS may drive factor differences in amoA and nosZ communities between centralized and decentralized treatment systems. If soil is in fact an important inoculum for N-transforming bacteria in OWTS, soil inputs during installation and the two annual operation and maintenance visits may be important not only to mechanical function, but also to the biological N-removal function of the systems.

Author Contributions

Conceptualization, S.K.W., J.A.A., S.M.-V., G.W.L., E.Q.B., B.V.L.; methodology, S.K.W., E.Q.B., B.V.L., A.C., G.W.L., J.A.A.; software, P.J.K., A.C., S.K.W.; formal analysis, S.K.W., P.J.K., A.C.; investigation, S.K.W., G.W.L., B.V.L., E.Q.B.; resources, J.A.A. and S.M.-V.; data curation, S.K.W. and P.J.K.; writing—original draft preparation, S.K.W. and J.A.A.; writing—review and editing, G.W.L., A.C.; visualization, S.K.W.; supervision, J.A.A; funding acquisition, J.A.A, G.W.L. and S.M.-V. All authors have read and agreed to the published version of the manuscript.

Funding

This project was funded by the USDA National Institute of Food and Agriculture, Hatch Multi-State NE 1545 Project [accession number 1007770], by grant agreement CE96184201 awarded by the U.S. Environmental Protection Agency (USEPA) to the New England Interstate Water Pollution Control Commission (NEIWPCC), in partnership with the Narragansett Bay Estuary Program (NBEP), by grant agreement AWD05317 awarded to the Barnstable County Department of Health and the Environment (BCDHE) by the U.S. Environmental Protection Agency (USEPA) Southeast New England Program (SNEP) for Coastal Watershed Restoration, and by funding from the Rhode Island Science and Technology Advisory Council (05098, 2016). Although the information in this paper has been funded wholly or in part by the U.S. Environmental Protection Agency, it has not undergone the Agency’s publications review process and therefore may not necessarily reflect the views of the Agency; no official endorsement should be inferred. The viewpoints expressed here do not necessarily represent those of the U.S. Environmental Protection Agency, nor does mention of trade names, commercial products, or causes constitute endorsement or recommendation for use.

Acknowledgments

We thank the homeowners and the personnel at the Field’s Point wastewater treatment plant for their willingness to participate in the study. We also thank Janet Atoyan for providing sequencing expertise.

Conflicts of Interest

The authors declare no conflict of interest.

Appendix A

Table A1. Average and standard error of wastewater properties from pre-anoxic, aerated Integrated Fixed Film Activated Sludge (IFAS), post anoxic, and re-aeration zones in the wastewater treatment plant and anoxic/hypoxic and oxic zones in Advantex, FAST, and SeptiTech (onsite wastewater treatment systems). Table and methods for collection originally published in Brannon et al. [10].
System and Zone/CompartmentWater Flow Rate
(MGD)
Water Temp.
(°C)
DO
(mg/L)
pHTotal Inorganic N
(mg N/L)
Ammonium
(mg N/L)
Nitrate
(mg N/L)
BOD5
(mg/L)
WWTP31.9 211 ± 5.0
Pre-Anoxic -- a0.3 ± 0.0 b6.7 ± 0.0 b7.2 ± 0.64.8 ± 0.60.3 ± 0.1-- a
Aerated IFAS 20.3 ± 0.82.8 ± 2.4 b6.7 ± 0.0 b3.3 ± 0.31.1 ± 0.62.0 ± 0.6-- a
Post Anoxic -- a1.6 ± 1.4 b6.5 ± 0.1 b2.1 ± 1.63.0 ± 1.80.2 ± 0.1-- a
Re-Aeration -- a0.5 ± 0.1 b6.6 ± 0.0 b0.5 ± 0.10.0 ± 0.00.5 ± 0.1-- a
Advantex2.1 × 10 −4
Anoxic/hypoxic 19.9 ± 0.20.2 ± 0.26.4 ± 0.115.9 ± 3.114.6 ± 3.01.3 ± 0.394.4 ± 76.9
Oxic 18.6 ± 0.41.8 ± 1.06.4 ± 0.115.7 ± 4.79.1 ± 4.46.6 ± 2.816.9 ± 12.2
FAST9.4 × 10 −5
Anoxic/hypoxic 20.3 ± 0.65.1 ± 1.37.2 ± 0.219.7 ± 9.2 8.4 ± 4.915.0 ± 8.40.0 ± 0.0
Oxic 18.5 ± 0.42.3 ± 0.97.0 ± 0.211.4 ± 2.1 1.7 ± 0.68.4 ± 1.86.0 ± 4.2
SeptiTech1.2 × 10 −4
Anoxic/hypoxic 21.4 ± 1.00.1 ± 0.17.2 ± 0.215.0 ± 5.0 11.5 ± 4.83.5 ± 0.710.3 ± 9.9
Oxic 22.1 ± 1.14.7 ± 1.47.1 ± 0.19.2 ± 1.9 3.1 ± 1.76.0 ± 1.93.7 ± 1.8
a Not determined; b Data for June only.
Figure A1. Aerial view of one of the ten Integrated Fixed Film Activated Sludge (IFAS) tanks at the Field’s Point WTP. White area represents anoxic/hypoxic zones, grey area represents aerated zones, and black bars represent barriers. Water flows from left to right. Modified from Brannon et al. [10].
Water 12 01688 g0a1
Figure A2. Schematic diagram of Advantex, FAST, and SeptiTech technology treatment trains showing sampling locations. P = pump; SP1 = anoxic component; SP2 = oxic component. Modified from Lancellotti et al. [44].
Water 12 01688 g0a2

References

  1. Amador, J.A.; Loomis, G.W. Soil-Based Wastewater Treatment; American Society of Agronomy, Incorporated; Soil Science Society of America, Incorporated; Crop Science Society of America, Incorporated: Madison, WI, USA, 2018; ISBN 9780891189688. [Google Scholar]
  2. Diaz, R.J.; Rosenberg, R. Spreading dead zones and consequences for marine ecosystems. Science (80-) 2008, 321, 926–929. [Google Scholar] [CrossRef] [PubMed]
  3. Huisman, J.; Matthijs, H.C.P.; Visser, P.M. Harmful Cyanobacteria; Aquatic Ecology Series; Version 3; Springer: Dordrecht, The Netherlands, 2005; ISBN 1402030096. [Google Scholar]
  4. Townsend, A.R.; Howarth, R.W.; Bazzaz, F.A.; Booth, M.S.; Cleveland, C.C.; Collinge, S.K.; Dobson, A.P.; Epstein, P.R.; Holland, E.A.; Keeney, D.R.; et al. Human health effects of a changing global nitrogen cycle. Front. Ecol. Environ. 2003, 1, 240–246. [Google Scholar] [CrossRef]
  5. Clifford, E.; Nielsen, M.; Sørensen, K.; Rodgers, M. Nitrogen dynamics and removal in a horizontal flow biofilm reactor for wastewater treatment. Water Res. 2010, 44, 3819–3828. [Google Scholar] [CrossRef] [PubMed]
  6. Oakley, S.M.; Gold, A.J.; Oczkowski, A.J. Nitrogen control through decentralized wastewater treatment: Process performance and alternative management strategies. Ecol. Eng. 2010, 36, 1520–1531. [Google Scholar] [CrossRef]
  7. Nemergut, D.R.; Schmidt, S.K.; Fukami, T.; O’Neill, S.P.; Bilinski, T.M.; Stanish, L.F.; Knelman, J.E.; Darcy, J.L.; Lynch, R.C.; Wickey, P.; et al. Patterns and Processes of Microbial Community Assembly. Microbiol. Mol. Biol. Rev. 2013, 77, 342–356. [Google Scholar] [CrossRef] [PubMed] [Green Version]
  8. USEPA. Management of Small to Medium Sized Municipal Wastewater Treatment Plants; National Service Center for Environmental Publications (NSCEP): Cincinnati, OH, USA, 1979; pp. 1–192.
  9. USEPA. Clean Watersheds Needs Survey 2012—Report to Congress; United States Environmental Protection Agency: Washington, DC, USA, 2012.
  10. Brannon, E.Q.; Moseman-Valtierra, S.M.; Lancellotti, B.V.; Wigginton, S.K.; Amador, J.A.; McCaughey, J.C.; Loomis, G.W. Comparison of N2O Emissions and Gene Abundances between Wastewater Nitrogen Removal Systems. J. Environ. Qual. 2017, 46, 931–938. [Google Scholar] [CrossRef] [PubMed] [Green Version]
  11. USEPA. U.S. Environmental Protection Agency NPDES Permit Writers’ Manual; United States Environmental Protection Agency: Washington, DC, USA, 2010.
  12. Cydzik-Kwiatkowska, A.; Zielińska, M. Bacterial communities in full-scale wastewater treatment systems. World J. Microbiol. Biotechnol. 2016, 32, 66. [Google Scholar] [CrossRef] [Green Version]
  13. McLellan, S.L.; Huse, S.M.; Mueller-Spitz, S.R.; Andreishcheva, E.N.; Sogin, M.L. Diversity and population structure of sewage-derived microorganisms in wastewater treatment plant influent. Environ. Microbiol. 2010, 12, 378–392. [Google Scholar] [CrossRef] [Green Version]
  14. Xia, S.; Duan, L.; Song, Y.; Li, J.; Piceno, Y.M.; Andersen, G.L.; Alvarez-Cohen, L.; Moreno-Andrade, I.; Huang, C.L.; Hermanowicz, S.W. Bacterial community structure in geographically distributed biological wastewater treatment reactors. Environ. Sci. Technol. 2010, 44, 7391–7396. [Google Scholar] [CrossRef]
  15. Hu, M.; Wang, X.; Wen, X.; Xia, Y. Microbial community structures in different wastewater treatment plants as revealed by 454-pyrosequencing analysis. Bioresour. Technol. 2012, 117, 72–79. [Google Scholar] [CrossRef]
  16. Wang, X.; Hu, M.; Xia, Y.; Wen, X.; Ding, K. Pyrosequencing analysis of bacterial diversity in 14 wastewater treatment systems in china. Appl. Environ. Microbiol. 2012, 78, 7042–7047. [Google Scholar] [CrossRef] [PubMed] [Green Version]
  17. Zhang, T.; Shao, M.F.; Ye, L. 454 Pyrosequencing reveals bacterial diversity of activated sludge from 14 sewage treatment plants. ISME J. 2012, 6, 1137–1147. [Google Scholar] [CrossRef]
  18. Ju, F.; Guo, F.; Ye, L.; Xia, Y.; Zhang, T. Metagenomic analysis on seasonal microbial variations of activated sludge from a full-scale wastewater treatment plant over 4 years. Environ. Microbiol. Rep. 2014, 6, 80–89. [Google Scholar] [CrossRef] [PubMed]
  19. Liu, T.; Liu, S.; Zheng, M.; Chen, Q.; Ni, J. Performance Assessment of Full-Scale Wastewater Treatment Plants Based on Seasonal Variability of Microbial Communities via High-Throughput Sequencing. PLoS ONE 2016, 11, e0152998. [Google Scholar] [CrossRef] [PubMed]
  20. Zhang, B.; Yu, Q.; Yan, G.; Zhu, H.; Xu, X.Y.; Zhu, L. Seasonal bacterial community succession in four typical wastewater treatment plants: Correlations between core microbes and process performance. Sci. Rep. 2018, 8, 4566. [Google Scholar] [CrossRef] [PubMed]
  21. Ibarbalz, F.M.; Orellana, E.; Figuerola, E.L.M.; Erijman, L. Shotgun metagenomic profiles have a high capacity to discriminate samples of activated sludge according to wastewater type. Appl. Environ. Microbiol. 2016, 82, 5186–5196. [Google Scholar] [CrossRef] [Green Version]
  22. Ye, L.; Zhang, T. Bacterial communities in different sections of a municipal wastewater treatment plant revealed by 16S rDNA 454 pyrosequencing. Appl. Microbiol. Biotechnol. 2013, 97, 2681–2690. [Google Scholar] [CrossRef] [Green Version]
  23. Zhang, T.; Ye, L.; Tong, A.H.Y.; Shao, M.F.; Lok, S. Ammonia-oxidizing archaea and ammonia-oxidizing bacteria in six full-scale wastewater treatment bioreactors. Appl. Microbiol. Biotechnol. 2011, 91, 1215–1225. [Google Scholar] [CrossRef] [Green Version]
  24. Terada, A.; Zhou, S.; Hosomi, M. Presence and detection of anaerobic ammonium-oxidizing (anammox) bacteria and appraisal of anammox process for high-strength nitrogenous wastewater treatment: A review. Clean Technol. Environ. Policy 2011, 13, 759–781. [Google Scholar] [CrossRef]
  25. Annavajhala, M.K.; Kapoor, V.; Santo-Domingo, J.; Chandran, K. Comammox Functionality Identified in Diverse Engineered Biological Wastewater Treatment Systems. Environ. Sci. Technol. Lett. 2018, 5, 110–116. [Google Scholar] [CrossRef]
  26. Zhang, W.; Yan, C.; Shen, J.; Wei, R.; Gao, Y.; Miao, A.; Xiao, L.; Yang, L. Characterization of Aerobic Denitrifying Bacterium Pseudomonas mendocina Strain GL6 and Its Potential Application in Wastewater Treatment Plant Effluent. Int. J. Environ. Res. Public Health 2019, 16, 364. [Google Scholar] [CrossRef] [Green Version]
  27. Che, Y.; Liang, P.; Gong, T.; Cao, X.; Zhao, Y.; Yang, C.; Song, C. Elucidation of major contributors involved in nitrogen removal and transcription level of nitrogen-cycling genes in activated sludge from WWTPs. Sci. Rep. 2017, 7, 44728. [Google Scholar] [CrossRef] [PubMed]
  28. Wang, Z.; Zhang, X.X.; Lu, X.; Liu, B.; Li, Y.; Long, C.; Li, A. Abundance and diversity of bacterial nitrifiers and denitrifiers and their functional genes in tannery wastewater treatment plants revealed by high-throughput sequencing. PLoS ONE 2014, 9, e113603. [Google Scholar] [CrossRef] [PubMed]
  29. Shu, D.; He, Y.; Yue, H.; Wang, Q. Metagenomic and quantitative insights into microbial communities and functional genes of nitrogen and iron cycling in twelve wastewater treatment systems. Chem. Eng. J. 2016, 290, 21–30. [Google Scholar] [CrossRef]
  30. Yang, B.; Wang, J.; Wang, J.; Xu, H.; Song, X.; Wang, Y.; Li, F.; Liu, Y.; Bai, J. Correlating microbial community structure with operational conditions in biological aerated filter reactor for efficient nitrogen removal of municipal wastewater. Bioresour. Technol. 2018, 250, 374–381. [Google Scholar] [CrossRef] [PubMed]
  31. Fan, X.Y.; Gao, J.F.; Pan, K.L.; Li, D.C.; Dai, H.H. Temporal dynamics of bacterial communities and predicted nitrogen metabolism genes in a full-scale wastewater treatment plant. RSC Adv. 2017, 7, 56317–56327. [Google Scholar] [CrossRef] [Green Version]
  32. Johnston, J.; LaPara, T.; Behrens, S. Composition and Dynamics of the Activated Sludge Microbiome during Seasonal Nitrification Failure. Sci. Rep. 2019, 9, 1–15. [Google Scholar] [CrossRef] [Green Version]
  33. Keegan, M.; Kilroy, K.; Nolan, D.; Dubber, D.; Johnston, P.M.; Misstear, B.D.R.; O’Flaherty, V.; Barrett, M.; Gill, L.W. Assessment of the impact of traditional septic tank soakaway systems on water quality in Ireland. Water Sci. Technol. 2014, 70, 634–641. [Google Scholar] [CrossRef] [Green Version]
  34. Pussayanavin, T.; Koottatep, T.; Eamrat, R.; Polprasert, C. Enhanced sludge reduction in septic tanks by increasing temperature. J. Environ. Sci. Health Part A Toxic/Hazard. Subst. Environ. Eng. 2015, 50, 81–89. [Google Scholar] [CrossRef]
  35. Nie, J.Y.; Zhu, N.W.; Zhao, K.; Wu, L.; Hu, Y.H. Analysis of the bacterial community changes in soil for septic tank effluent treatment in response to bio-clogging. Water Sci. Technol. 2011, 63, 1412–1417. [Google Scholar] [CrossRef]
  36. Robertson, W.D.; Moore, T.A.; Spoelstra, J.; Li, L.; Elgood, R.J.; Clark, I.D.; Schiff, S.L.; Aravena, R.; Neufeld, J.D. Natural Attenuation of Septic System Nitrogen by Anammox. Ground Water 2012, 50, 541–553. [Google Scholar] [CrossRef] [PubMed]
  37. Tomaras, J.; Sahl, J.W.; Siegrist, R.L.; Spear, J.R. Microbial diversity of septic tank effluent and a soil biomat. Appl. Environ. Microbiol. 2009, 75, 3348–3351. [Google Scholar] [CrossRef] [PubMed] [Green Version]
  38. Koottatep, T.; Suksiri, P.; Pussayanavin, T.; Polprasert, C. Development of a Novel Multi-soil Layer Constructed Wetland Treating Septic Tank Effluent with Emphasis on Organic and Ammonia Removals. Water Air Soil Pollut. 2018, 229, 258. [Google Scholar] [CrossRef]
  39. Delgado-Baquerizo, M.; Maestre, F.T.; Reich, P.B.; Jeffries, T.C.; Gaitan, J.J.; Encinar, D.; Berdugo, M.; Campbell, C.D.; Singh, B.K. Microbial diversity drives multifunctionality in terrestrial ecosystems. Nat. Commun. 2016, 7, 10541. [Google Scholar] [CrossRef] [PubMed] [Green Version]
  40. Fernández-Baca, C.P.; Truhlar, A.M.; Omar, A.E.H.; Rahm, B.G.; Walter, M.T.; Richardson, R.E. Methane and nitrous oxide cycling microbial communities in soils above septic leach fields: Abundances with depth and correlations with net surface emissions. Sci. Total Environ. 2018, 640–641, 429–441. [Google Scholar] [CrossRef] [PubMed]
  41. Koottatep, T.; Prapasriket, P.; Pussayanavin, T.; Polprasert, C. Performance of up-flow thermophilic septic tank treating blackwater. Environ. Dev. Sustain. 2019, 22, 3691–3700. [Google Scholar] [CrossRef]
  42. Jin, Z.; Lv, C.; Zhao, M.; Zhang, Y.; Huang, X.; Bei, K.; Kong, H.; Zheng, X. Black water collected from the septic tank treated with a living machine system: HRT effect and microbial community structure. Chemosphere 2018, 210, 745–752. [Google Scholar] [CrossRef]
  43. Wigginton, S.; Brannon, E.; Kearns, P.J.; Lancellotti, B.; Cox, A.; Loomis, G.W.; Amador, J.A. Nitrifying and denitrifying bacterial communities in advanced nitrogen-removal onsite wastewater treatment systems. J. Environ. Qual. 2018, 47, 1163–1171. [Google Scholar] [CrossRef]
  44. Lancellotti, B.V.; Loomis, G.W.; Hoyt, K.P.; Avizinis, E.; Amador, J.A. Evaluation of Nitrogen Concentration in Final Effluent of Advanced Nitrogen-Removal Onsite Wastewater Treatment Systems (OWTS). Water Air Soil Pollut. 2017, 228, 383. [Google Scholar] [CrossRef]
  45. Geets, J.; de Cooman, M.; Wittebolle, L.; Heylen, K.; Vanparys, B.; De Vos, P.; Verstraete, W.; Boon, N. Real-time PCR assay for the simultaneous quantification of nitrifying and denitrifying bacteria in activated sludge. Appl. Microbiol. Biotechnol. 2007, 75, 211–221. [Google Scholar] [CrossRef]
  46. Junier, P.; Kim, O.-S.; Junier, T.; Ahn, T.-S.; Imhoff, J.F.; Witzel, K.-P. Community analysis of betaproteobacterial ammonia-oxidizing bacteria using the amoCAB operon. Appl. Microbiol. Biotechnol. 2009, 83, 175–188. [Google Scholar] [CrossRef] [PubMed] [Green Version]
  47. Caporaso, J.G.; Kuczynski, J.; Stombaugh, J.; Bittinger, K.; Bushman, F.D.; Costello, E.K.; Fierer, N.; Peña, A.G.; Goodrich, J.K.; Gordon, J.I.; et al. QIIME allows analysis of high-throughput community sequencing data. Nat. Methods 2010, 7, 335–336. [Google Scholar] [CrossRef] [PubMed] [Green Version]
  48. Bokulich, N.A.; Subramanian, S.; Faith, J.J.; Gevers, D.; Gordon, J.I.; Knight, R.; Mills, D.A.; Caporaso, J.G. Quality-filtering vastly improves diversity estimates from Illumina amplicon sequencing. Nat. Methods 2013, 10, 57–59. [Google Scholar] [CrossRef] [PubMed]
  49. Edgar, R.C. Search and clustering orders of magnitude faster than BLAST. Bioinformatics 2010, 26, 2460–2461. [Google Scholar] [CrossRef] [Green Version]
  50. Mahé, F.; Rognes, T.; Quince, C.; de Vargas, C.; Dunthorn, M. Swarm: Robust and fast clustering method for amplicon-based studies. PeerJ 2014, 2, e593. [Google Scholar] [CrossRef] [Green Version]
  51. Kearns, P.J.; Angell, J.H.; Feinman, S.G.; Bowen, J.L. Long-term nutrient addition differentially alters community composition and diversity of genes that control nitrous oxide flux from salt marsh sediments. Estuar. Coast. Shelf Sci. 2015, 154, 39–47. [Google Scholar] [CrossRef]
  52. Pester, M.; Rattei, T.; Flechl, S.; Gröngröft, A.; Richter, A.; Overmann, J.; Reinhold-Hurek, B.; Loy, A.; Wagner, M. amoA-based consensus phylogeny of ammonia-oxidizing archaea and deep sequencing of amoA genes from soils of four different geographic regions. Environ. Microbiol. 2012, 14, 525–539. [Google Scholar] [CrossRef] [Green Version]
  53. Camacho, C.; Coulouris, G.; Avagyan, V.; Ma, N.; Papadopoulos, J.; Bealer, K.; Madden, T.L. BLAST+: Architecture and applications. BMC Bioinform. 2009, 10, 421. [Google Scholar] [CrossRef] [Green Version]
  54. Cole, J.R.; Wang, Q.; Fish, J.A.; Chai, B.; McGarrell, D.M.; Sun, Y.; Brown, C.T.; Porras-Alfaro, A.; Kuske, C.R.; Tiedje, J.M. Ribosomal Database Project: Data and tools for high throughput rRNA analysis. Nucleic Acids Res. 2014, 42, D633–D642. [Google Scholar] [CrossRef] [Green Version]
  55. Oksanen, J.; Blanchet, F.G.; Kindt, R.; Legendre, P.; Minchin, P.R.; O’Hara, R.B.; Simpson, G.L.; Solymos, P.; Stevens, M.H.H.; Wagner, H.; et al. Package ‘vegan’. Community Ecol. Package Vers. 2013, 2, 1–295. [Google Scholar]
  56. R Core Team. R: A language and environment for statistical computing. Vienna R Found. Stat. Comput. 2012, 1, 12–21. [Google Scholar]
  57. McMurdie, P.J.; Holmes, S. phyloseq: An R Package for Reproducible Interactive Analysis and Graphics of Microbiome Census Data. PLoS ONE 2013, 8, e61217. [Google Scholar] [CrossRef] [PubMed] [Green Version]
  58. Wickham, H. ggplot2: Elegant Graphics for Data Analysis; Springer: New York, NY, USA, 2016. [Google Scholar]
  59. Roy, D.; McEvoy, J.; Blonigen, M.; Amundson, M.; Khan, E. Seasonal variation and ex-situ nitrification activity of ammonia oxidizing archaea in biofilm based wastewater treatment processes. Bioresour. Technol. 2017, 244, 850–859. [Google Scholar] [CrossRef] [PubMed]
  60. Albright, M.B.N.; Timalsina, B.; Martiny, J.B.H.; Dunbar, J. Comparative Genomics of Nitrogen Cycling Pathways in Bacteria and Archaea. Microb. Ecol. 2018, 77, 597–606. [Google Scholar] [CrossRef] [PubMed]
  61. Kindaichi, T.; Tsushima, I.; Ogasawara, Y.; Shimokawa, M.; Ozaki, N.; Satoh, H.; Okabe, S. In situ activity and spatial organization of anaerobic ammonium-oxidizing (anammox) bacteria in biofilms. Appl. Environ. Microbiol. 2007, 73, 4931–4939. [Google Scholar] [CrossRef] [PubMed] [Green Version]
  62. Ritchie, G.A.; Nicholas, D.J. Identification of the sources of nitrous oxide produced by oxidative and reductive processes in Nitrosomonas europaea. Biochem. J. 1972, 126, 1181–1191. [Google Scholar] [CrossRef] [PubMed] [Green Version]
  63. Valentín-Vargas, A.; Toro-Labrador, G.; Massol-Deyá, A.A. Bacterial Community Dynamics in Full-Scale Activated Sludge Bioreactors: Operational and Ecological Factors Driving Community Assembly and Performance. PLoS ONE 2012, 7, e42524. [Google Scholar] [CrossRef] [PubMed] [Green Version]
  64. Van Der Gast, C.J.; Jefferson, B.; Reid, E.; Robinson, T.; Bailey, M.J.; Judd, S.J.; Thompson, I.P. Bacterial diversity is determined by volume in membrane bioreactors. Environ. Microbiol. 2006, 8, 1048–1055. [Google Scholar] [CrossRef]
  65. Horner-Devine, M.C.; Lage, M.; Hughes, J.B.; Bohannan, B.J.M. A taxa–area relationship for bacteria. Nature 2004, 432, 750–753. [Google Scholar] [CrossRef]
  66. Miyahara, M.; Kim, S.W.; Fushinobu, S.; Takaki, K.; Yamada, T.; Watanabe, A.; Miyauchi, K.; Endo, G.; Wakagi, T.; Shoun, H. Potential of aerobic denitrification by pseudomonas stutzeri TR2 to reduce nitrous oxide emissions from wastewater treatment plants. Appl. Environ. Microbiol. 2010, 76, 4619–4625. [Google Scholar] [CrossRef] [Green Version]
  67. Su, J.J.; Liu, B.Y.; Liu, C.Y. Comparison of aerobic denitrification under high oxygen atmosphere by Thiosphaera pantotropha ATCC 35512 and Pseudomonas stutzeri SU2 newly isolated from the activated sludge of a piggery wastewater treatment system. J. Appl. Microbiol. 2001, 90, 457–462. [Google Scholar] [CrossRef]
  68. Zheng, M.; He, D.; Ma, T.; Chen, Q.; Liu, S.; Ahmad, M.; Gui, M.; Ni, J. Reducing NO and N2O emission during aerobic denitrification by newly isolated Pseudomonas stutzeri PCN-1. Bioresour. Technol. 2014, 162, 80–88. [Google Scholar] [CrossRef] [PubMed]
  69. Ji, B.; Yang, K.; Zhu, L.; Jiang, Y.; Wang, H.; Zhou, J.; Zhang, H. Aerobic denitrification: A review of important advances of the last 30 years. Biotechnol. Bioprocess. Eng. 2015, 20, 643–651. [Google Scholar] [CrossRef]
  70. Chen, J.; Strous, M. Denitrification and aerobic respiration, hybrid electron transport chains and co-evolution. Biochim. Biophys. Acta Bioenerg. 2013, 1827, 136–144. [Google Scholar] [CrossRef] [Green Version]
  71. Chen, Y.; Lan, S.; Wang, L.; Dong, S.; Zhou, H.; Tan, Z.; Li, X. A review: Driving factors and regulation strategies of microbial community structure and dynamics in wastewater treatment systems. Chemosphere 2017, 174, 173–182. [Google Scholar] [CrossRef]
  72. Pruitt, K.D.; Tatusova, T.; Maglott, D.R. NCBI reference sequences (RefSeq): A curated non-redundant sequence database of genomes, transcripts and proteins. Nucleic Acids Res. 2007, 35, 61–65. [Google Scholar] [CrossRef] [Green Version]
  73. Gao, J.; Luo, X.; Wu, G.; Li, T.; Peng, Y. Abundance and diversity based on amoA genes of ammonia-oxidizing archaea and bacteria in ten wastewater treatment systems. Appl. Microbiol. Biotechnol. 2014, 98, 3339–3354. [Google Scholar] [CrossRef]
  74. Aigle, A.; Prosser, J.I.; Gubry-Rangin, C. The application of high-throughput sequencing technology to analysis of amoA phylogeny and environmental niche specialisation of terrestrial bacterial ammonia-oxidisers. Environ. Microbiome 2019, 14, 3. [Google Scholar] [CrossRef] [Green Version]
  75. Land, M.; Hauser, L.; Jun, S.R.; Nookaew, I.; Leuze, M.R.; Ahn, T.H.; Karpinets, T.; Lund, O.; Kora, G.; Wassenaar, T.; et al. Insights from 20 years of bacterial genome sequencing. Funct. Integr. Genom. 2015, 15, 141–161. [Google Scholar] [CrossRef] [Green Version]
  76. Morris, A.; Meyer, K.; Bohannan, B. Linking microbial communities to ecosystem functions: What we can learn from genotype-phenotype mapping in organisms. Philos. Trans. R. Soc. B Biol. Sci. 2020, 375, 20190244. [Google Scholar] [CrossRef] [Green Version]
  77. Maron, P.A.; Sarr, A.; Kaisermann, A.; Lévêque, J.; Mathieu, O.; Guigue, J.; Karimi, B.; Bernard, L.; Dequiedt, S.; Terrat, S.; et al. High microbial diversity promotes soil ecosystem functioning. Appl. Environ. Microbiol. 2018, 84, e02738-17. [Google Scholar] [CrossRef] [Green Version]
  78. Peter, H.; Beier, S.; Bertilsson, S.; Lindström, E.S.; Langenheder, S.; Tranvik, L.J. Function-specific response to depletion of microbial diversity. ISME J. 2011, 5, 351–361. [Google Scholar] [CrossRef] [PubMed] [Green Version]
  79. Trivedi, C.; Delgado-Baquerizo, M.; Hamonts, K.; Lai, K.; Reich, P.B.; Singh, B.K. Losses in microbial functional diversity reduce the rate of key soil processes. Soil Biol. Biochem. 2019, 135, 267–274. [Google Scholar] [CrossRef] [Green Version]
  80. Tomás, J.M. The Main Aeromonas Pathogenic Factors. ISRN Microbiol. 2012, 2012, 256261. [Google Scholar] [CrossRef] [PubMed] [Green Version]
  81. Lin, X.; Zhang, Z.; Zhang, L.; Li, X. Complete genome sequence of a denitrifying bacterium, Pseudomonas sp. CC6-YY-74, isolated from Arctic Ocean sediment. Mar. Genom. 2017, 35, 47–49. [Google Scholar] [CrossRef]
  82. Singleton, P.; Sainsbury, D. Dictionary of Microbiology and Molecular Biology, 3rd ed.; John Wiley & Sons, Ltd.: Chichester, UK, 2006; ISBN 9780470056981. [Google Scholar]
  83. Hiraishi, A.; Hoshino, Y.; Satoh, T. Rhodoferax fermentans gen. nov., sp. nov., a phototrophic purple nonsulfur bacterium previously referred to as the “Rhodocyclus gelatinosus-like” group. Arch. Microbiol. 1991, 155, 330–336. [Google Scholar] [CrossRef]
  84. Finneran, K.T.; Johnsen, C.V.; Lovley, D.R. Rhodoferax ferrireducens sp. nov., a psychrotolerant, facultatively anaerobic bacterium that oxidizes acetate with the reduction of Fe (III). Int. J. Syst. Evol. Microbiol. 2003, 53, 669–673. [Google Scholar] [CrossRef] [Green Version]
  85. Mukherjee, S.; Parekh, V. Review of Purification of Industrial Wastewater. Int. J. Eng. Res. 2016, 5, 379–383. [Google Scholar] [CrossRef]
  86. Bai, Y.; Sun, Q.; Zhao, C.; Wen, D.; Tang, X. Aerobic degradation of pyridine by a new bacterial strain, Shinella zoogloeoides BC026. J. Ind. Microbiol. Biotechnol. 2009, 36, 1391–1400. [Google Scholar] [CrossRef]
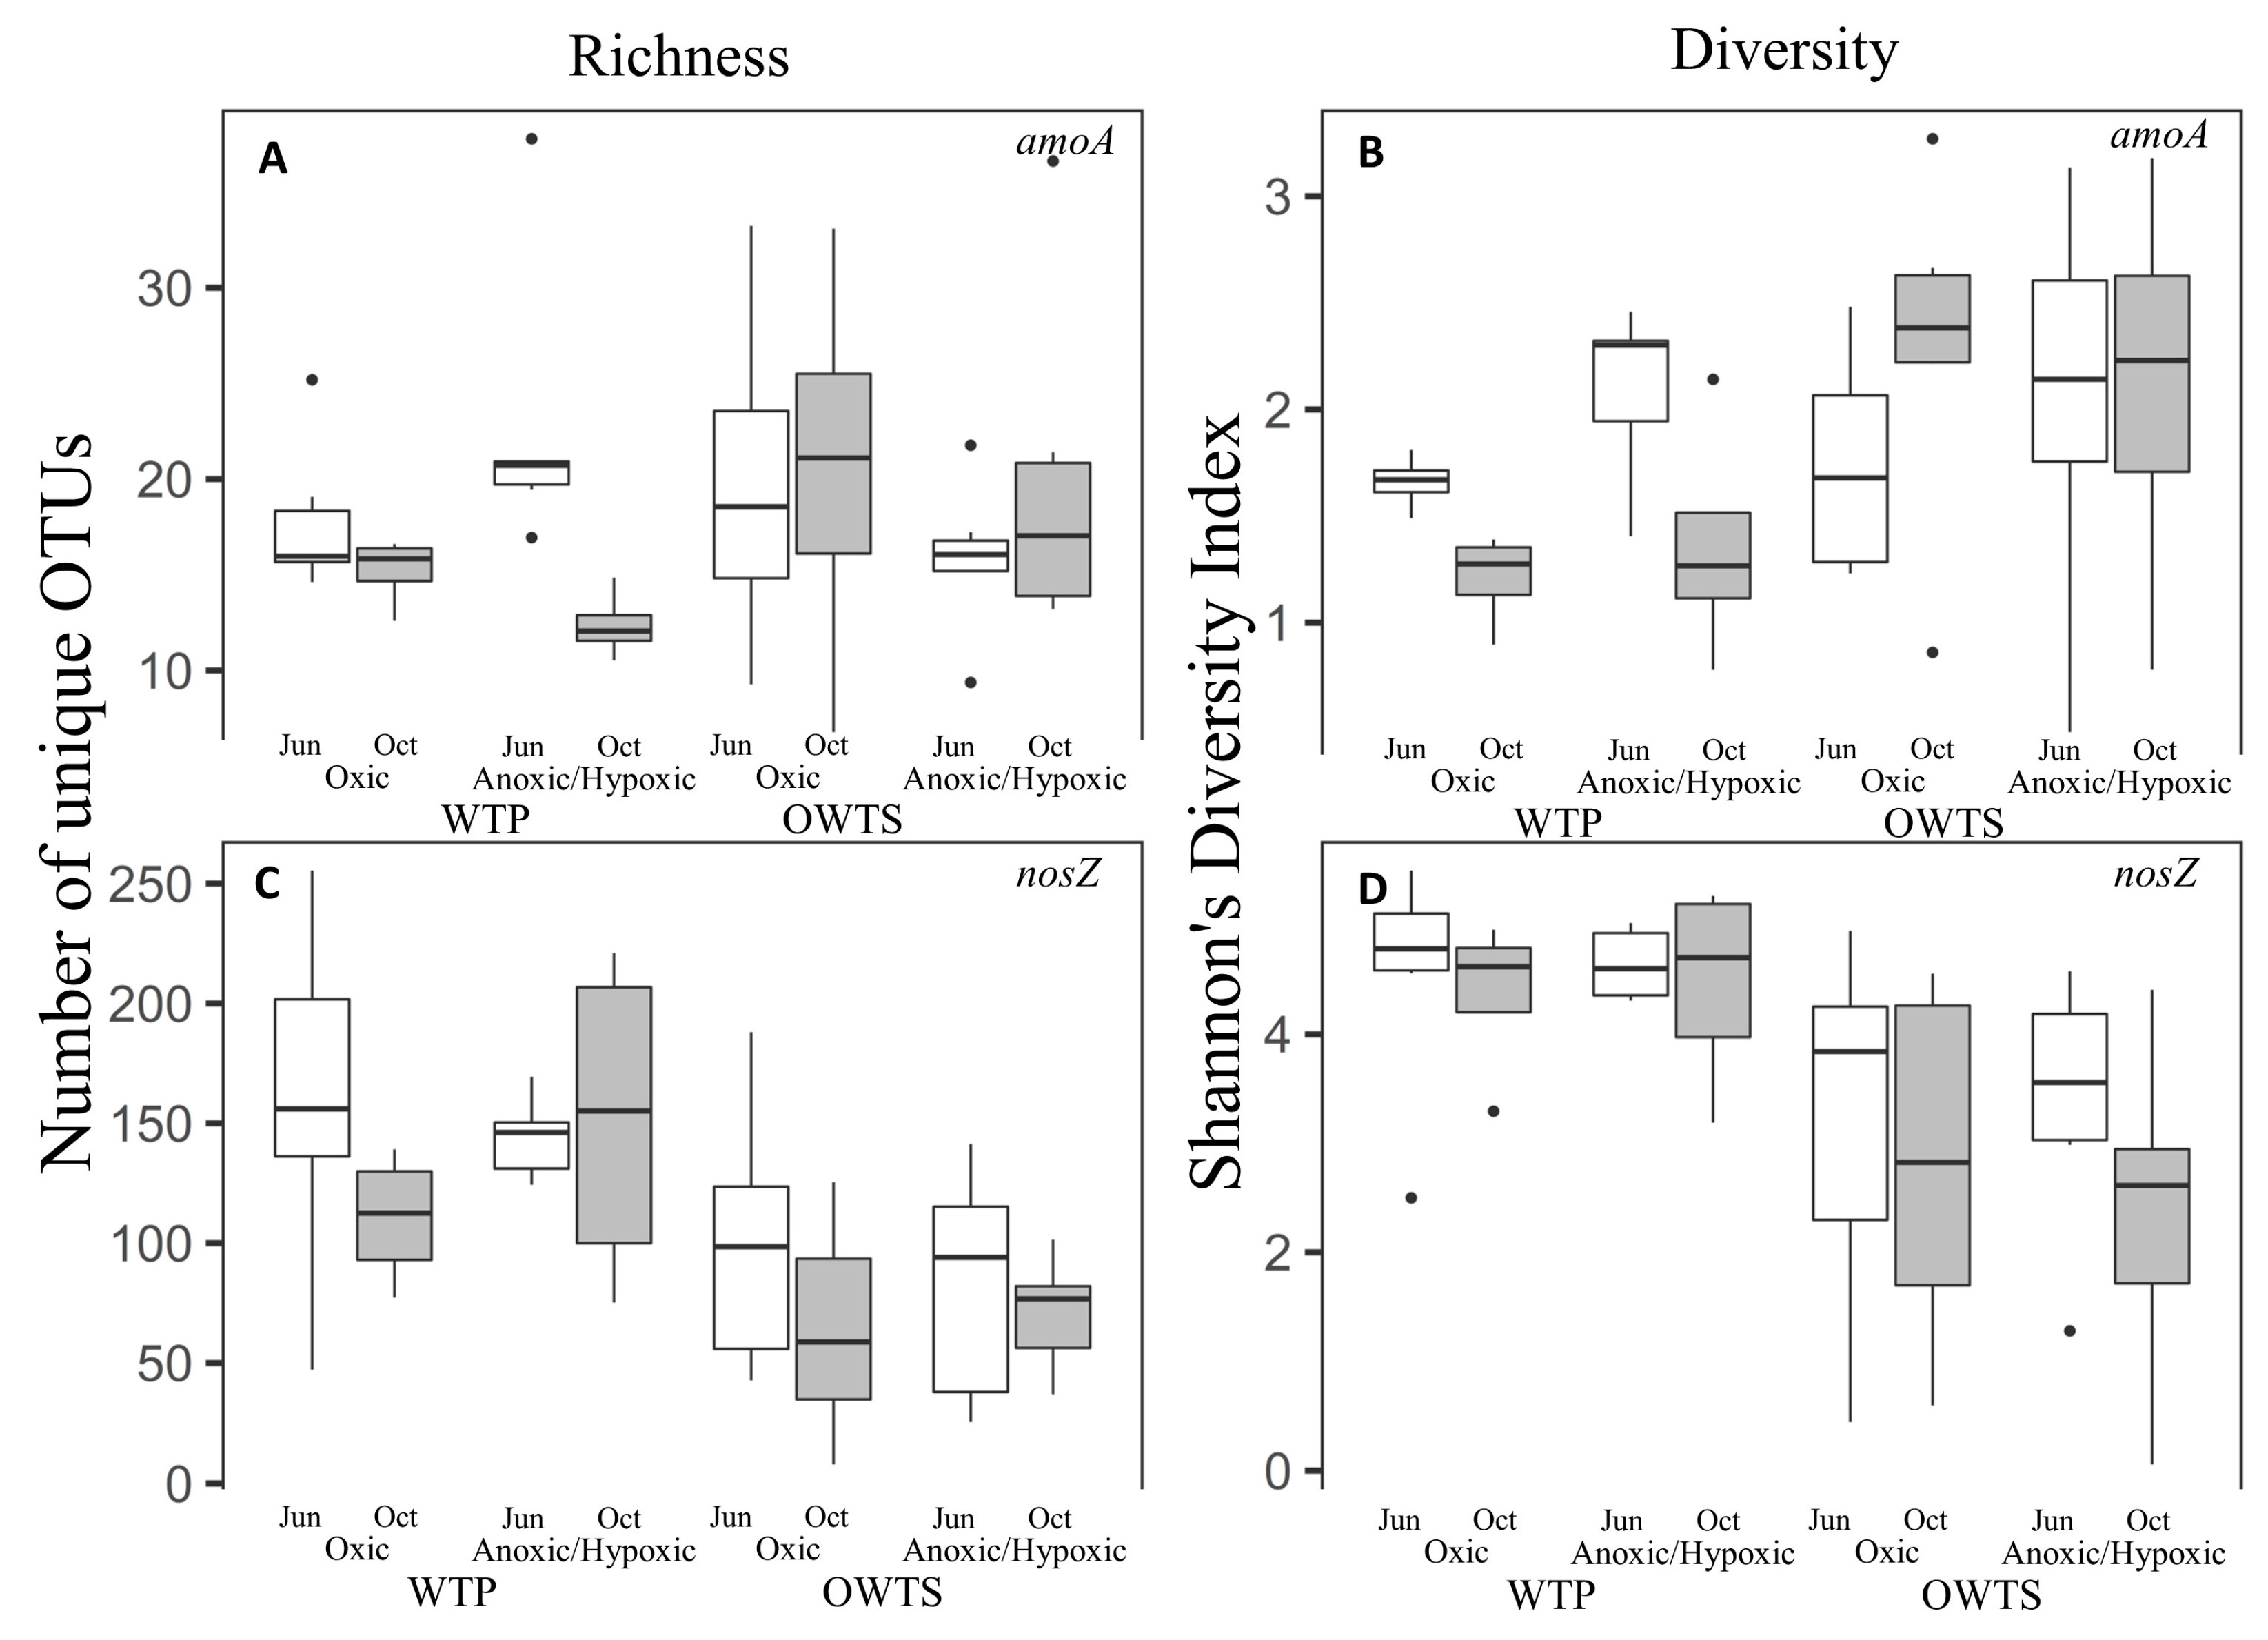
Figure 1. amoA Species richness (A) and Shannon’s diversity index (B), and nosZ species richness (C) and Shannon’s diversity index (D) in the oxic and anoxic compartments of a wastewater treatment plant (WTP) and of onsite wastewater treatment systems (OWTS)—both with biological N removal—in June (white box) and October 2016 (grey box). amoA: n = 5–7 for WTP and 5–8 for OWTS; nosZ: n = 5–7 for WTP and 5–9 for OWTS.
Water 12 01688 g001
Figure 2. Principal coordinate analysis based on Bray–Curtis dissimilarity distances for (A) amoA and (B) nosZ communities in a wastewater treatment plant (WTP) and in onsite wastewater treatment systems (OWTS), both with biological nitrogen removal (BNR). Labels indicate whether sample was from oxic (AER) or hypoxic/anoxic (AN) zone and system or tank number. For WTP: AER1 = activated sludge; AER2 = re−aeration tank; AN1 = pre−anoxic tank; AN2 = post−anoxic tank. For OWTS: AER3 to AER13 = oxic zone; AN3 to AN13 = hypoxic/anoxic zone.
Water 12 01688 g002
Figure 3. Relative abundance of amoA in a biological nitrogen removal (BNR) wastewater treatment plant (WTP) and in advanced N-removal onsite wastewater treatment systems (OWTS). Labels indicate zone (AER = oxic; AN = hypoxic/anoxic), system number, month sampled, and replicate letter (A, B, C; WTP only). WTP = systems 01 and 02; OWTS = systems 03 to 13.
Water 12 01688 g003
Figure 4. Relative abundance of the 50 most abundant nosZ taxa in a biological nitrogen removal (BNR) wastewater treatment plant (WTP) and in advanced N-removal onsite wastewater treatment systems (OWTS). Labels indicate component (AER = oxic; AN = anoxic), system number, month sampled, and replicate letter (A, B, C; WTP only). WTP = systems 01 and 02; OWTS = systems 03 to 13.
Water 12 01688 g004
Table 1. Species present in at least 50% of samples. Genus, species, and strain of closest culture specimen based on sequencing of nosZ and amoA in onsite wastewater treatment systems (OWTS) and a wastewater treatment plant (WTP) with biological nitrogen removal (BNR). The total number of samples analyzed for amoA was 25 for OWTS and 20 for WTP. The total number of samples analyzed for nosZ was 36 for OWTS and 18 for WTP. Data from June and October 2016 samples were combined for this analysis.
GeneGenus, Species and Strain of Closest Cultured SpecimenId. Match (%)System Type
CombinedOWTSWTP
# Samples with GeneRelative Abundance (%) Mean (SD)# Samples with GeneRelative Abundance (%) Mean (SD)# Samples with GeneRelative Abundance (%) Mean (SD)
amoANitrosomonas oligotropha Nm75974530.2 (24.4)2541.1 (27.3)2016.5 (8.7)
Nitrosomonas sp. Is79A394437.8 (5.7)238.3 (6.9)207.2 (4.2)
Nitrosomonas sp. JL2186260.4 (0.5)200.5 (0.5)60.1 (0.1)
Nitrosomonas sp. JL2197240.9 (1.0)151.1 (1.0)90.5 (0.6)
Nitrosomonas sp. Nm5985360.5 (0.9)160.8 (1.1)200.3 (0.3)
Nitrosomonas sp. Nm5992291.7 (1.2)90.7 (0.6)202.1 (1.2)
Nitrosomonas sp. Nm5988290.9 (0.7)90.3 (0.3)201.1 (0.6)
Nitrosomonas sp. PY190270.4 (0.5)110.6 (0.5)160.2 (0.2)
Nitrosomonas sp. Nm8488281.0 (0.8)80.8 (0.6)201.1 (0.8)
Nitrosospira sp. L11591310.7 (0.9)201.0 (1.0)110.1 (0.1)
Nitrosospira sp. Wyke2963913.3 (18.4)2420.9 (20.4)151.2 (1.2)
Nitrosovibrio sp. RY3C99260.5 (0.8)190.6 (0.9)70.1 (0.1)
Unclassified sp. (denovo 1096)-4438.0 (30.2)2415.7 (20.2)2064.7 (14.6)
nosZAeromonas media WS994012.7 (14.1)2212.7 (18.2)1812.7 (6.0)
Oligotropha carboxidovorans strain C1S131/132.299291.7 (1.3)124.1.5 (1.5)171.8 (1.1)
Pseudomonas sp. CC6-YY-74994723.7 (30.7)3036.0 (32.5)172.0 (21.6)
Thauera phenylacetica strain TN990295.5169.4 (17.6)130.8 (0.5)
Thauera phenylacetica strain TN992375.0 (9.2)194.6 (12.5)185.4 (2.7)
Unclassified Alphaproteobacteria89293.2 (3.0)144.2 (3.8)152.2 (1.2)
Unclassified Alphaproteobacteria85271.0 (0.7)111.2 (0.8)160.9 (0.5)
Unclassified Alphaproteobacteria79262.5 (1.5)82.3 (2.1)182.7 (1.1)
Unclassified Betaproteobacteria81262.5 (3.3)94.4 (5.0)171.5 (1.0)
Unclassified Betaproteobacteria83262.4 (1.7)91.0 (1.2)173.2 (1.5)
Unclassified Alphaproteobacteria78258.2 (5.6)75.8 (8.8)189.1 (3.1)
Unclassified Betaproteobacteria85253.5 (4.4)90.6 (0.4)165.2 (4.7)