1. Introduction
The main goal of sewerage design is to efficiently drain and remove wastewater based on economic factors. To prevent flooding or backflow, sewerage is designed allowing margin for the flow rate specified in each guideline, and most of the flows are open-channel flows. Open-channel flow can be analyzed using Manning’s equation, and one of the main factors determining the flow velocity is the water level. In addition to demonstrating low flow velocities, extremely low water levels tend to be deposited at the bottom of sewer pipes. In contrast, an extremely high water level poses the risk of flooding or backflow. Therefore, to determine the optimum water level of wastewater, the amount of wastewater must be accurately determined.
A flow meter equipped with a sensor is typically used to investigate the flow rate of wastewater. A submerged area velocity flow meter uses a steel plate for water-level detection around the sewer pipe; a sensor is submerged in water at the bottom of the pipe to measure the flow velocity and water level using ultrasonic waves or pressure. The operation of the flow meter is smooth in clear water, but in sewer pipes, impurities and sediments are stuck on the surface of the sensor at times, making it impossible to obtain measurements. In addition, the sensor must be sufficiently immersed, requiring an effective depth of approximately 30 mm; this indicates the decrease in the accuracy of the measurements at low depths. Although non-contact water-level meters (involving the use of ultrasonic waves or radar) can be installed in the upper part of sewers to perform water-level measurements, it is inconvenient for a person to enter the sewer and perform the installation. The long-term use of sensors in sewer pipes results in their corrosion due to hydrogen sulfide, microorganisms, and/or rodents. Given the limited number of centers available for servicing these sensors, consumers, in general, difficulties arise with regard to sensor maintenance in terms of cost, time, and techniques.
These measurement devices can be replaced by cameras backed by artificial intelligence (AI) algorithms. Compared to sensors, the cameras have various price ranges and types, are easily accessible, require simple aftersales service, and are easy to maintain because they do not make contact with wastewater. Developing and using appropriate measurement software can provide significant economic advantages over sensors.
AI technology is rapidly developing, and its application scope is expanding; it can also be used for maintenance and measurement of wastewater levels in sewer pipes. AI is a program that recognizes and performs a logical thinking process similar to a human. The way a program learns information from a digital image is called deep learning; this is similar to humans obtaining information by viewing the image. Thus, it is possible to determine the desired information from a new digital image based on the learned information.
A digital color image is composed of three layers of numbers that represent RGB. Advancements in camera technology, image capacity, and size depend on the quality of the image, and the size of one image may exceed 10 Mb. Because a digital image is composed of many numbers, an analysis of a few images was attempted in the past, owing to a large amount of computation being required. However, it is now possible to analyze hundreds of thousands of images, owing to the development of various mathematical techniques, deep learning codes, and graphic processing units that have reduced the amount of computation required for image analysis.
Several researchers [
1,
2,
3,
4] have conducted studies on sewerage using the above computational methods to diagnose pipe conditions; they evaluated pipe defects by analyzing the images of the sewer pipes. Kumar et al. [
5] detected and classified pipe defects from images. With no research conducted to detect wastewater or the water surface in pipes, Eppel and Kachman [
6] conducted a study to measure the liquid capacity by recognizing the boundary line of the liquid in a transparent container using the computer vision method. However, it is difficult to apply this methodology for measuring the water level of wastewater; this is because the wastewater level is influenced by many factors such as impurities, contamination in sewer pipes, and fluctuations in water depth. As the method requires taking images of a transparent vessel accurately, the liquid needs to be clear, and the vessel has to be clean.
This study measured the amount of wastewater using deep learning to utilize the advantages of cameras to measure the wastewater level. To validate this method, the results were obtained using the following image analysis methods and compared: direct analysis via visual inspection by a researcher, image processing, and image analysis using deep learning.
2. Methodology
Manning’s equation can determine flow velocity by using Manning’s roughness coefficient, the hydraulic radius, and the slope as in equation (1). Manning’s roughness coefficient, the diameter, and slope can be obtained through a preliminary investigation of the sewer pipe. The hydraulic radius is the rate of the cross-sectional area of flow and the wetted perimeter; because they can be calculated from the water level, if the water level is known, the values of the cross-sectional area of flow and flow velocity can be obtained so that the flow rate can be calculated. Accordingly, we developed a method to estimate water level.
where v is the flow rate (m/s),
n is the Manning’s roughness coefficient,
Rh is the hydraulic radius (m), and
S is the slope.
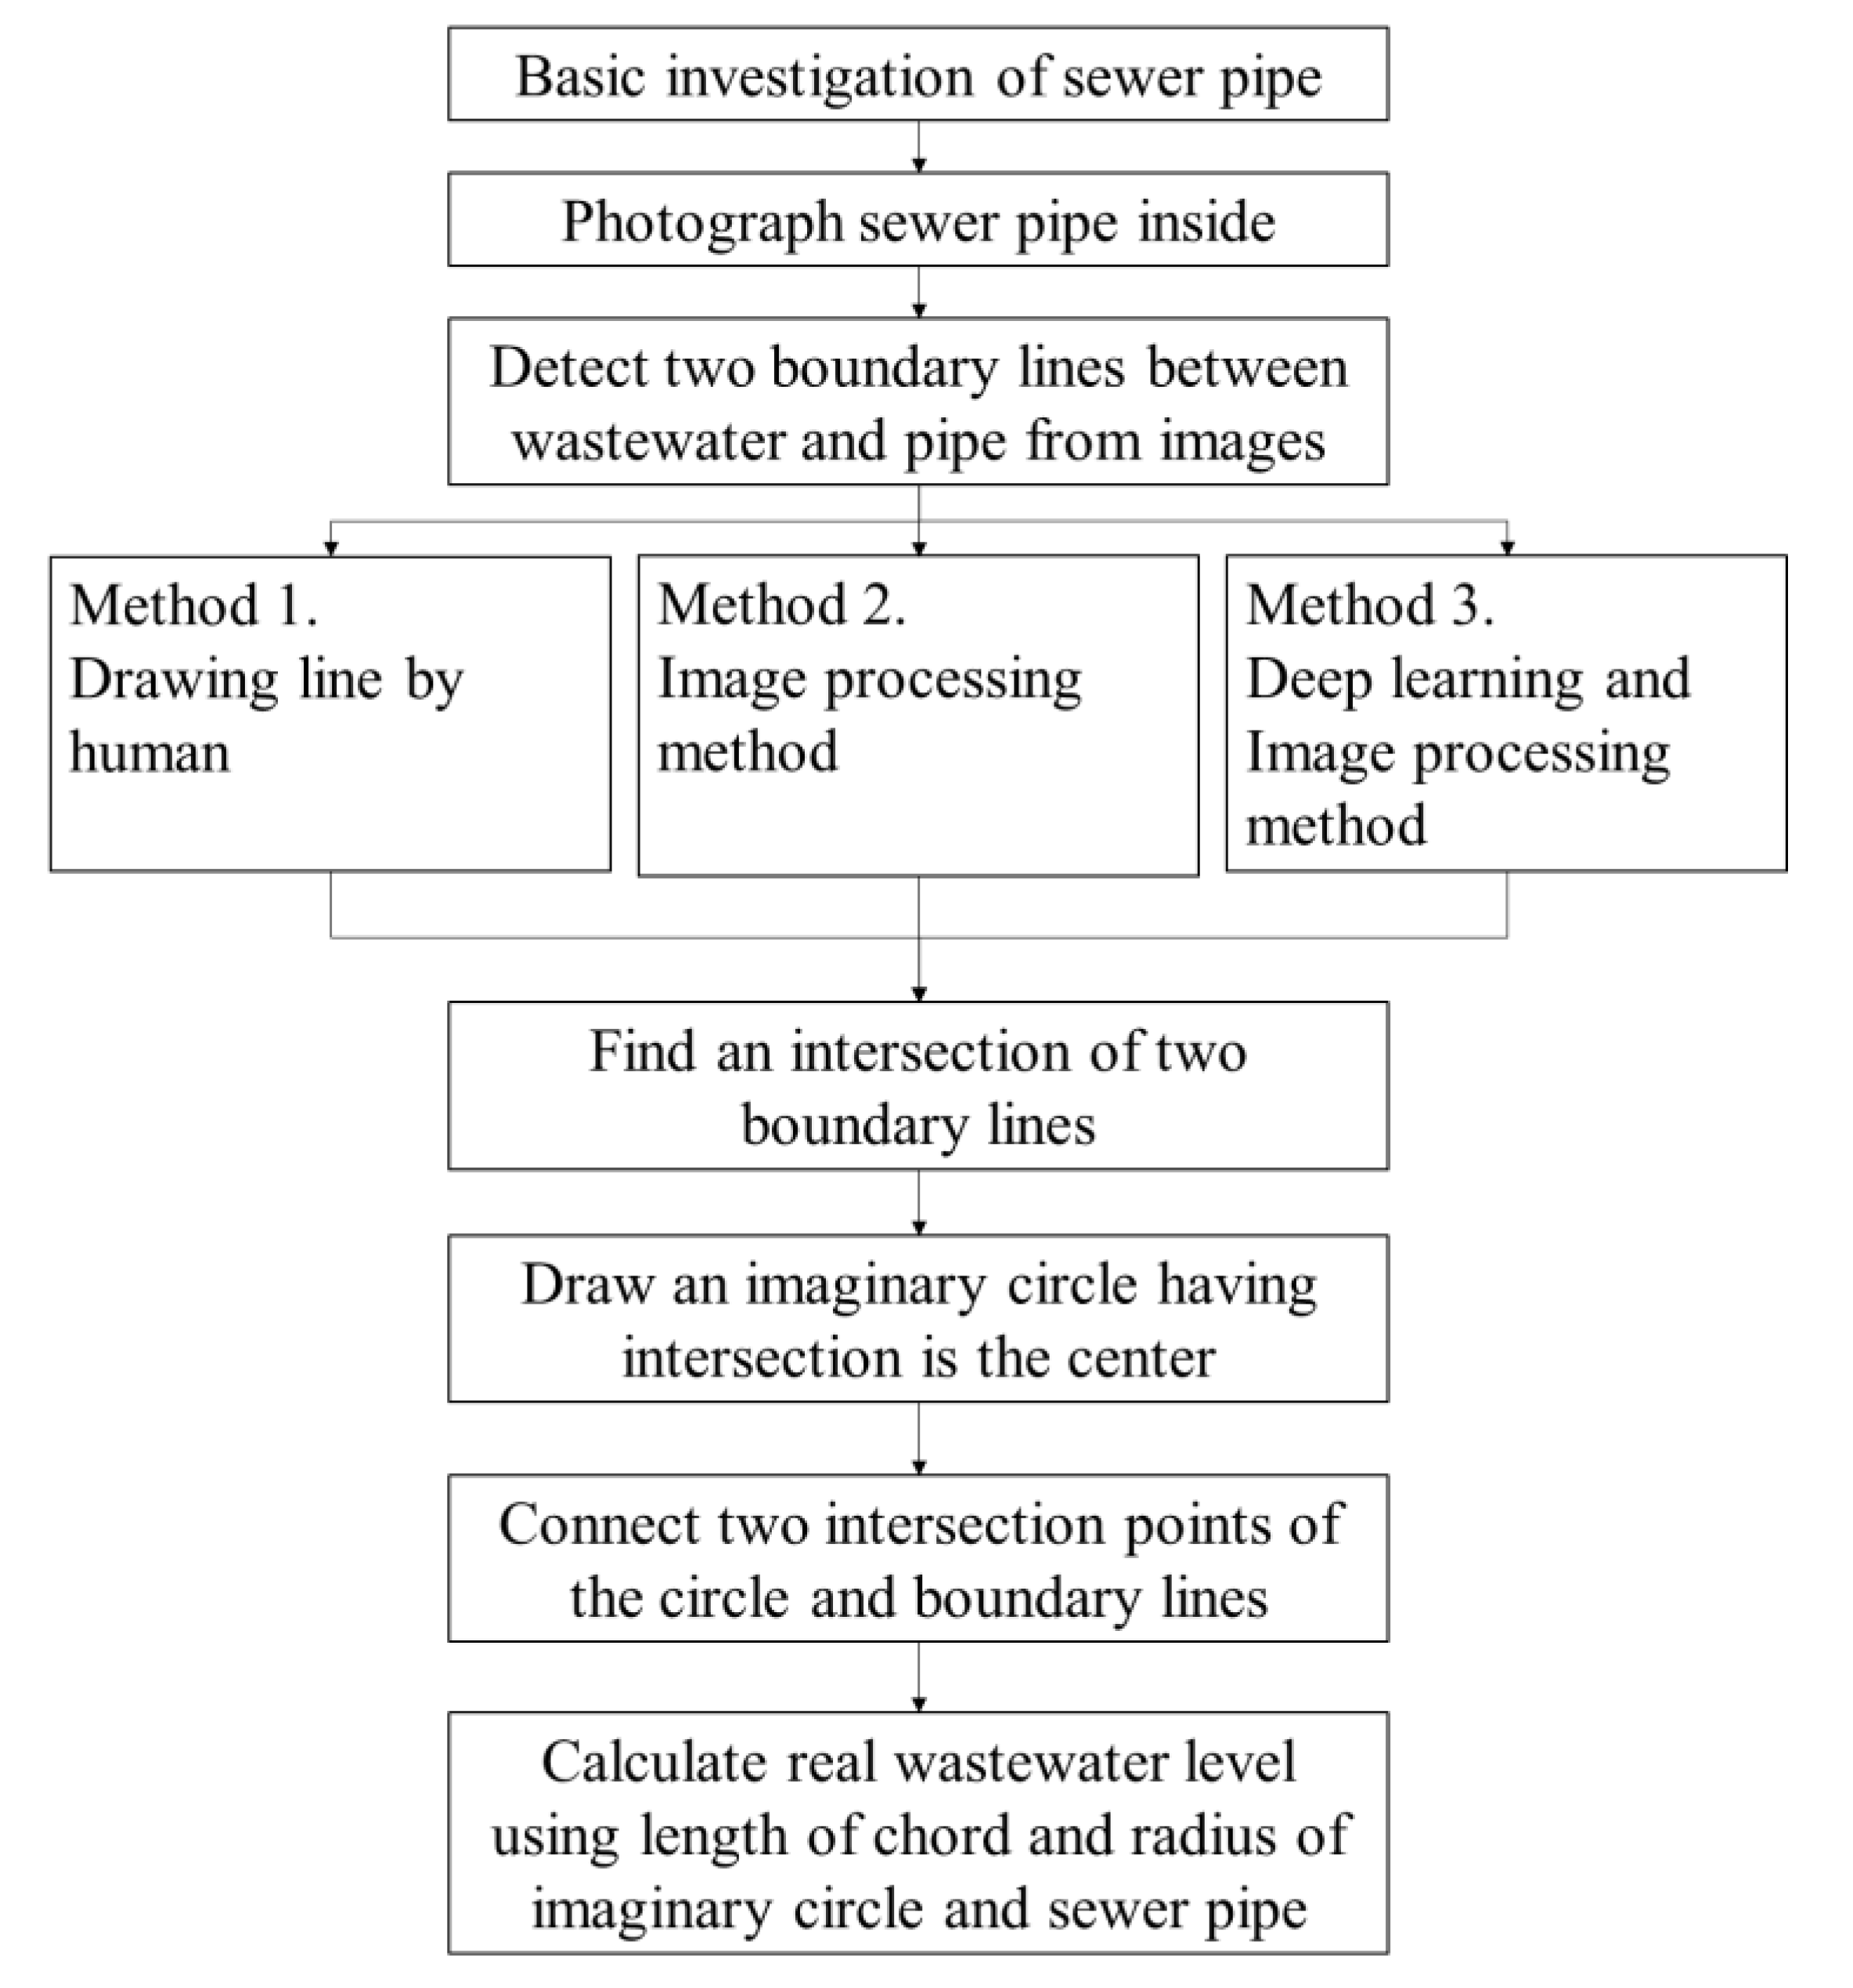
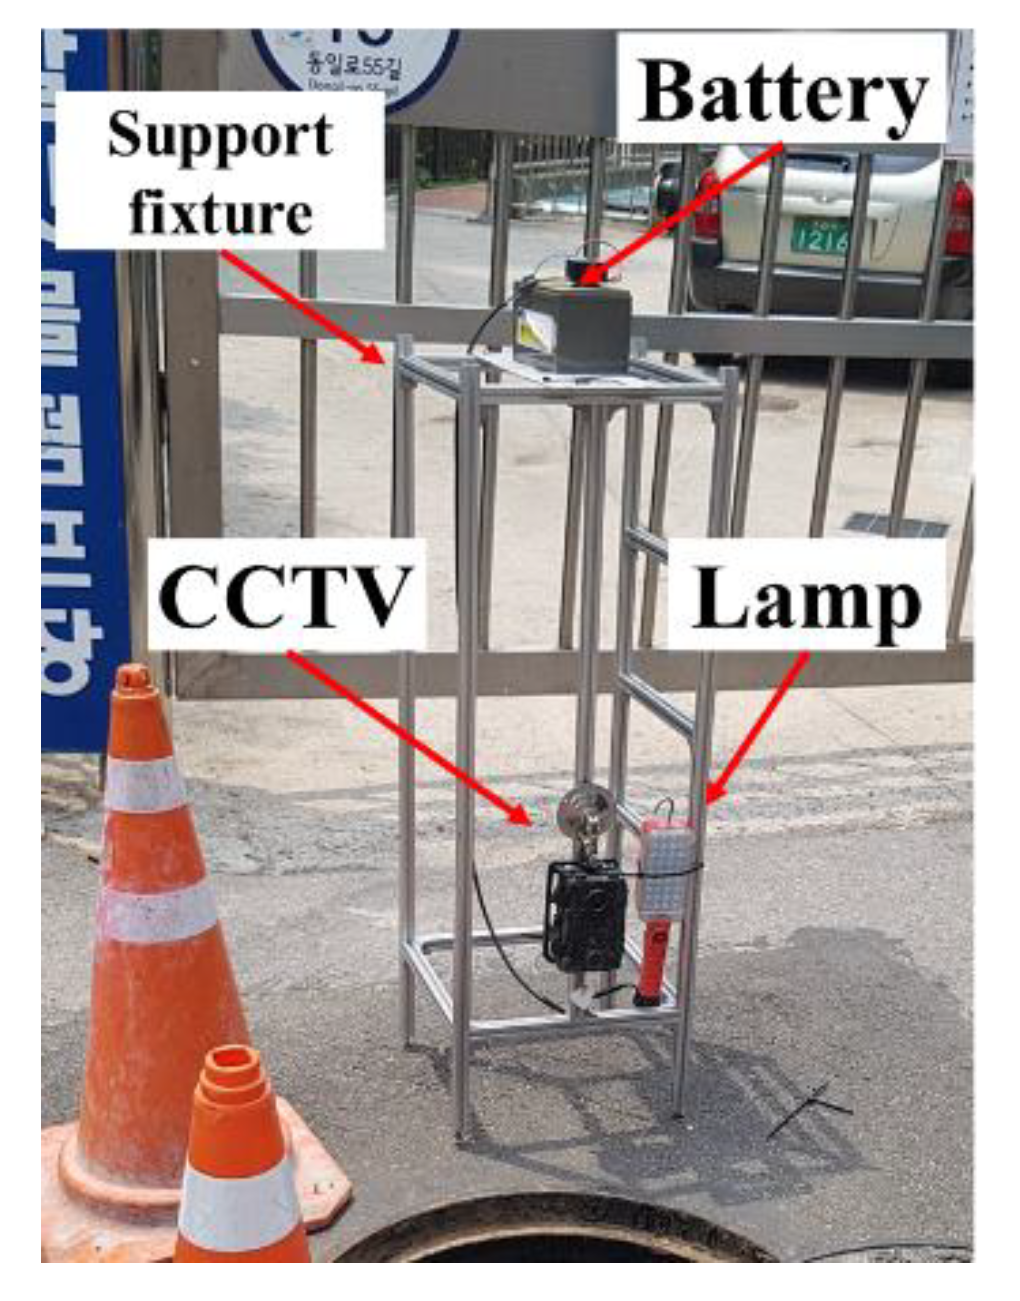
Figure 1 presents the procedure followed to determine the water level. After preliminary investigations about slope, diameter, and the roughness of the sewer pipe, the camera was positioned in the center of the manhole, and images of the inside the sewer pipe were captured. The vanishing point of the sewer pipe placed in the center of the camera should be considered during analysis. Otherwise, a small error occurs, owing to the shooting angle. After shooting, the digital images were collected by memory cards. For this study, a photographic instrument set with a CCTV camera, lamp, battery, and support fixture (as in
Figure 2) was installed in the manhole to capture over 1440 RGB true-color images of size 2592 × 1944 by taking images of the inside of the sewer pipe for 24 h once every minute. Prior to attempting equipment installation inside a manhole, the operator must first determine the concentration of toxic gases, such as carbon dioxide and hydrogen sulfide, present therein. Additionally, the operator must use relevant safety equipment and minimize the risk of battery sparking and explosions to the greatest extent possible.
The boundary line between the wastewater and pipe was detected from the digital images. The main purpose of this study was to detect the boundary line of wastewater and compare the results obtained by applying the abovementioned three methods. The first method involves the human examination of all images with the naked eye to detect boundary lines. However, it is difficult for a human to adjust all images captured every minute manually. Thus, this study analyzed images only for the high and low points of the water level when the flow rate changed to ensure efficiency and analyzed 167 out of 1440 images.
Secondly, the boundary line of the wastewater was detected through image processing. This method adjusts the color, brightness, and contrast of an image to extract specific information from the image and perform deletions wherever necessary. The image processing and computer vision toolbox features of MATLAB were used in this study. For ease of interpretation, the analyzed image was converted to grayscale, and the portion of the image containing wastewater was cropped. As line detection is easier with a straight vertical line than a diagonal line, the image was transformed so that the boundary line of wastewater became vertical. Subsequently, the regions corresponding to the left and right boundary lines were divided with contrast correction and filter application so that the boundary lines of all images were clearly visible. After removing the noise, the boundary line was converted to a binary image of one and zero for other parts and then transformed again according to the coordinates of the original image to obtain boundary line data.
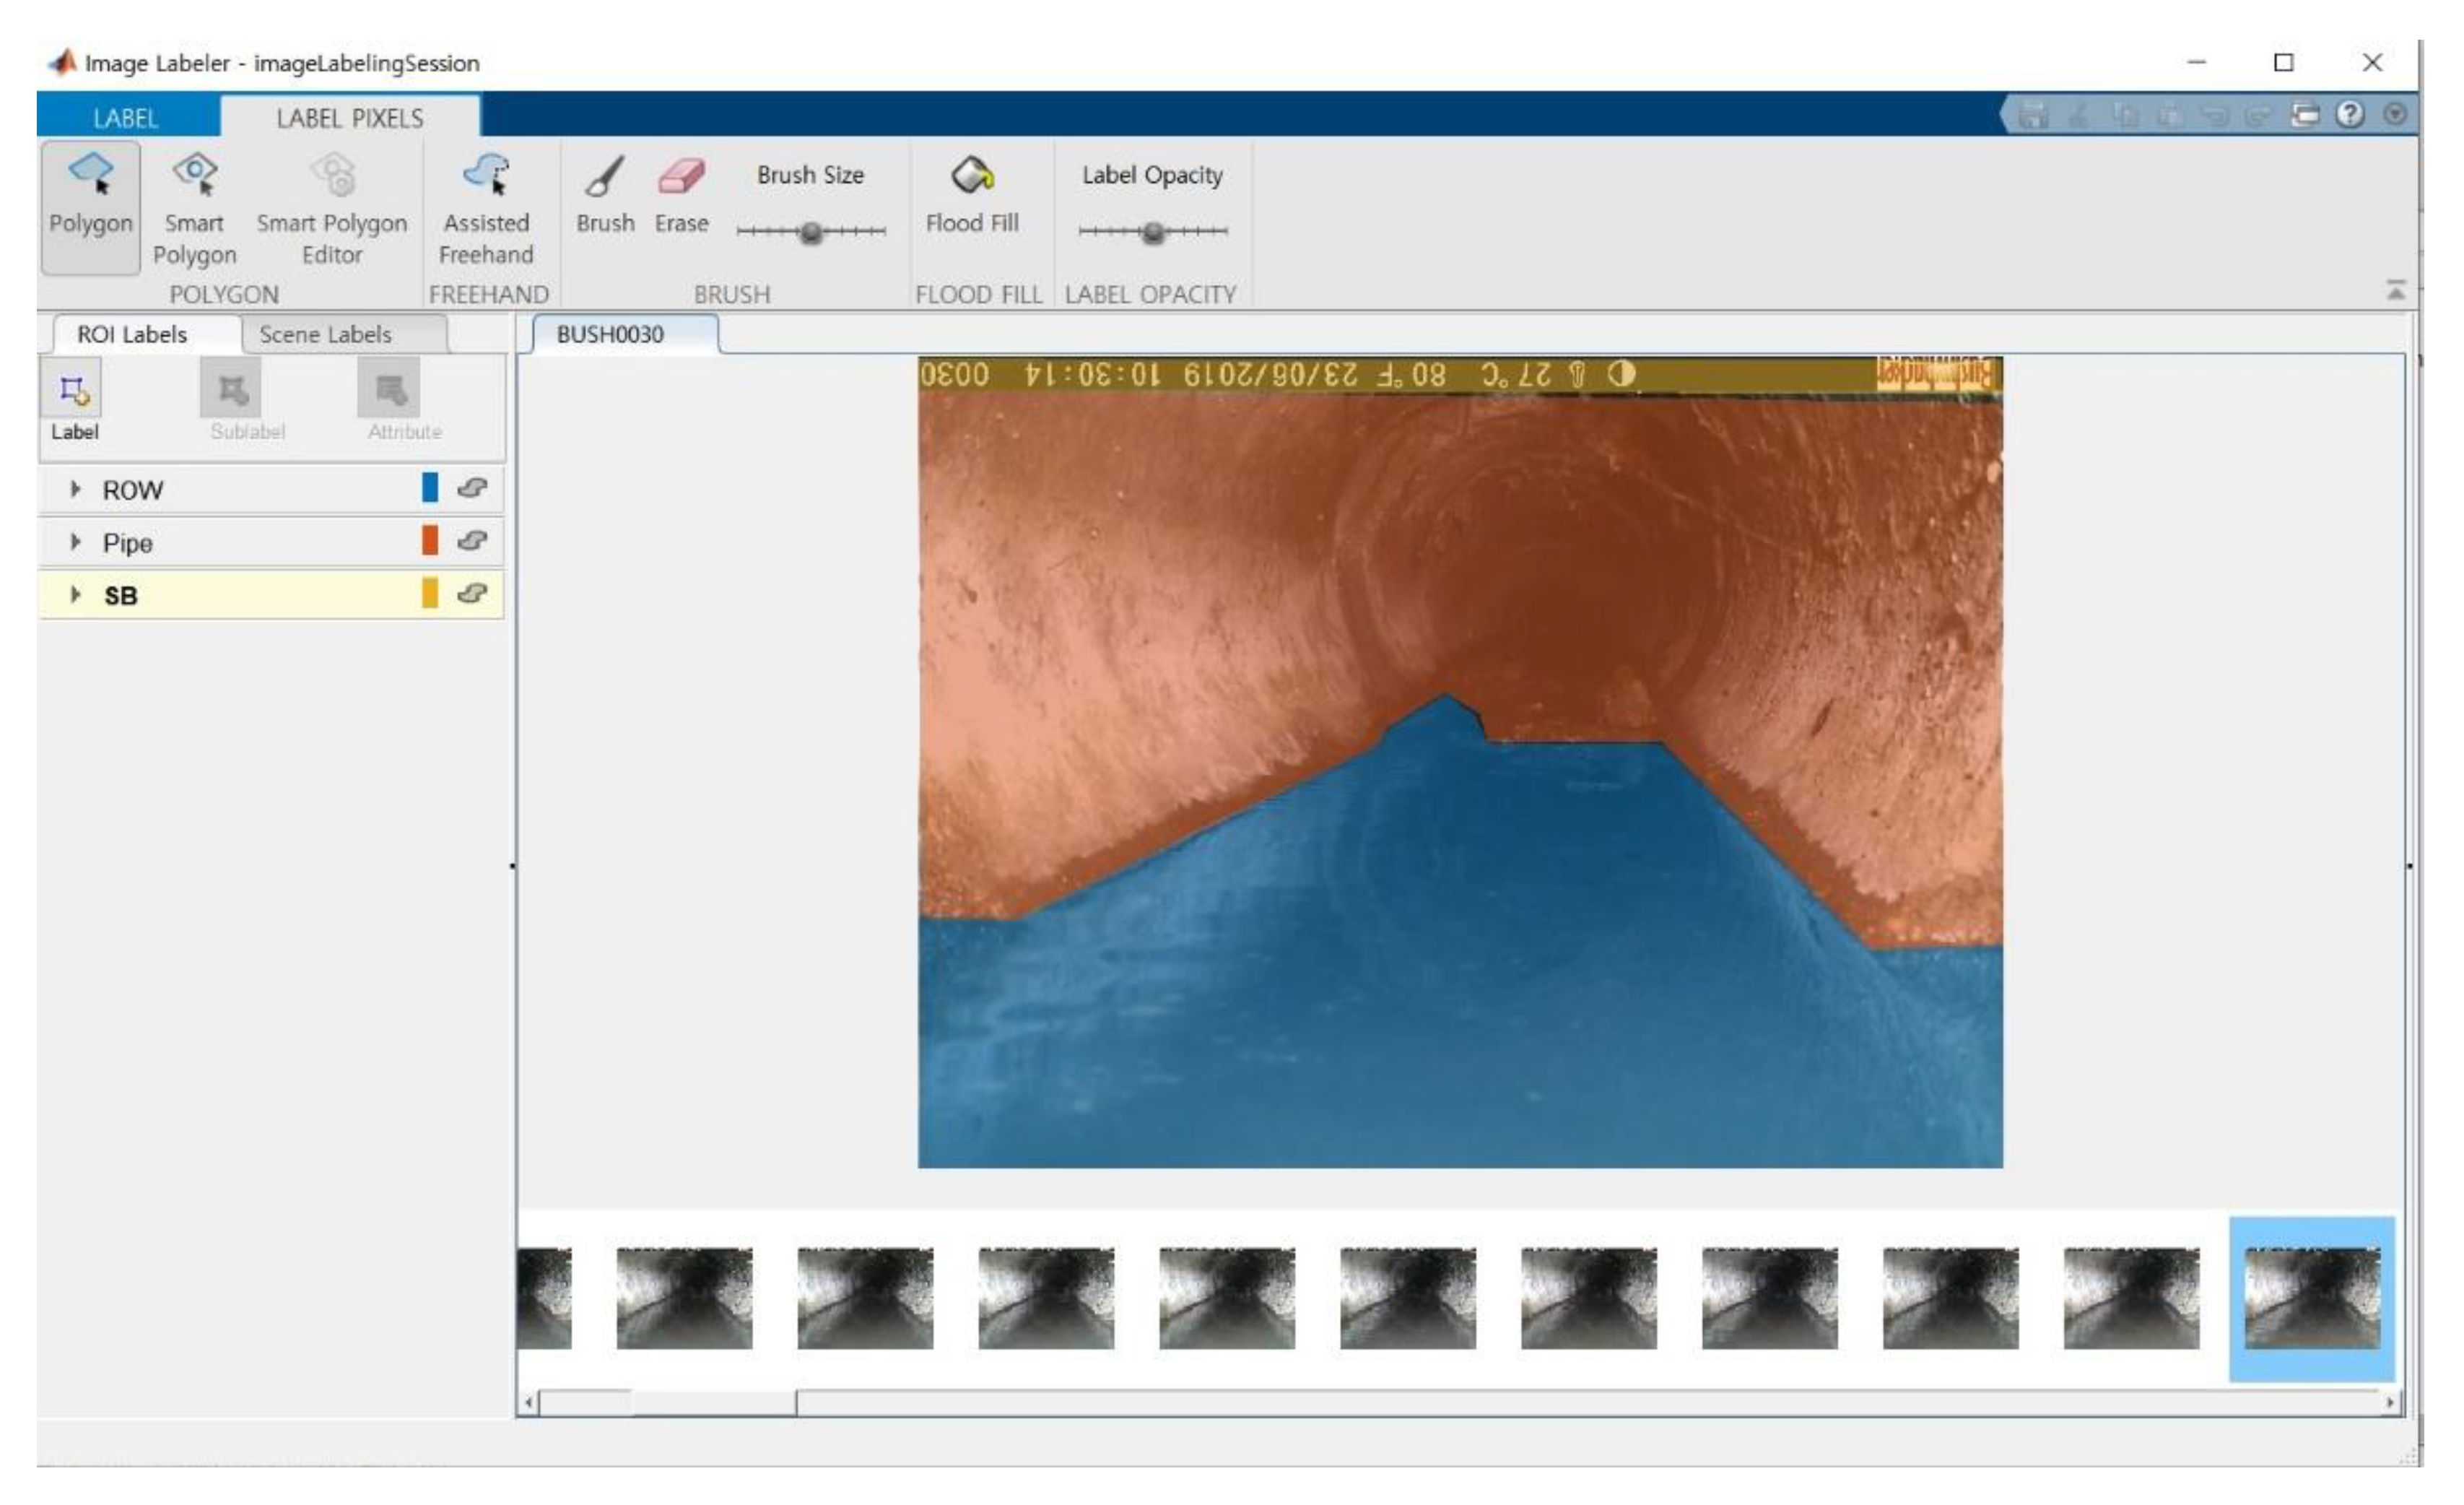
Thirdly, after learning the area of the wastewater and pipe through deep learning, the boundary line was detected using image processing. The semantic segmentation of images was performed using the image processing toolbox in MATLAB and computer vision toolbox. The images were divided into three-pixel labels: wastewater, pipe, and status bar, as shown in
Figure 3. Eighty images were used for training, and the images were divided into data sets with 60% for training, 20% for verification, and 20% for testing. A new network for semantic segmentation was created using DeepLab v3 + based on a pre-trained ResNet-18 network for fitting the image size and label. ResNet-18 is a convolutional neural network (CNN) for classifying images [
7], and DeepLab v3 + is a CNN designed for semantic segmentation [
8]. The training was repeated for epochs of 30 and 720 times prior to termination at an attainment of 98% accuracy. Geforce RTX 2080 Super was used as the graphics-processing unit (GPU). Using the developed DeepLab v3 + network, the semantic segmentation of images was performed, and three-pixel labels were assigned to each image. Among them, only the pixels of wastewater were extracted, and noise (other than the boundary line) was removed through image processing. The boundary line was obtained by converting the original images into binary images, with one representing the boundary line and zero representing the other areas.
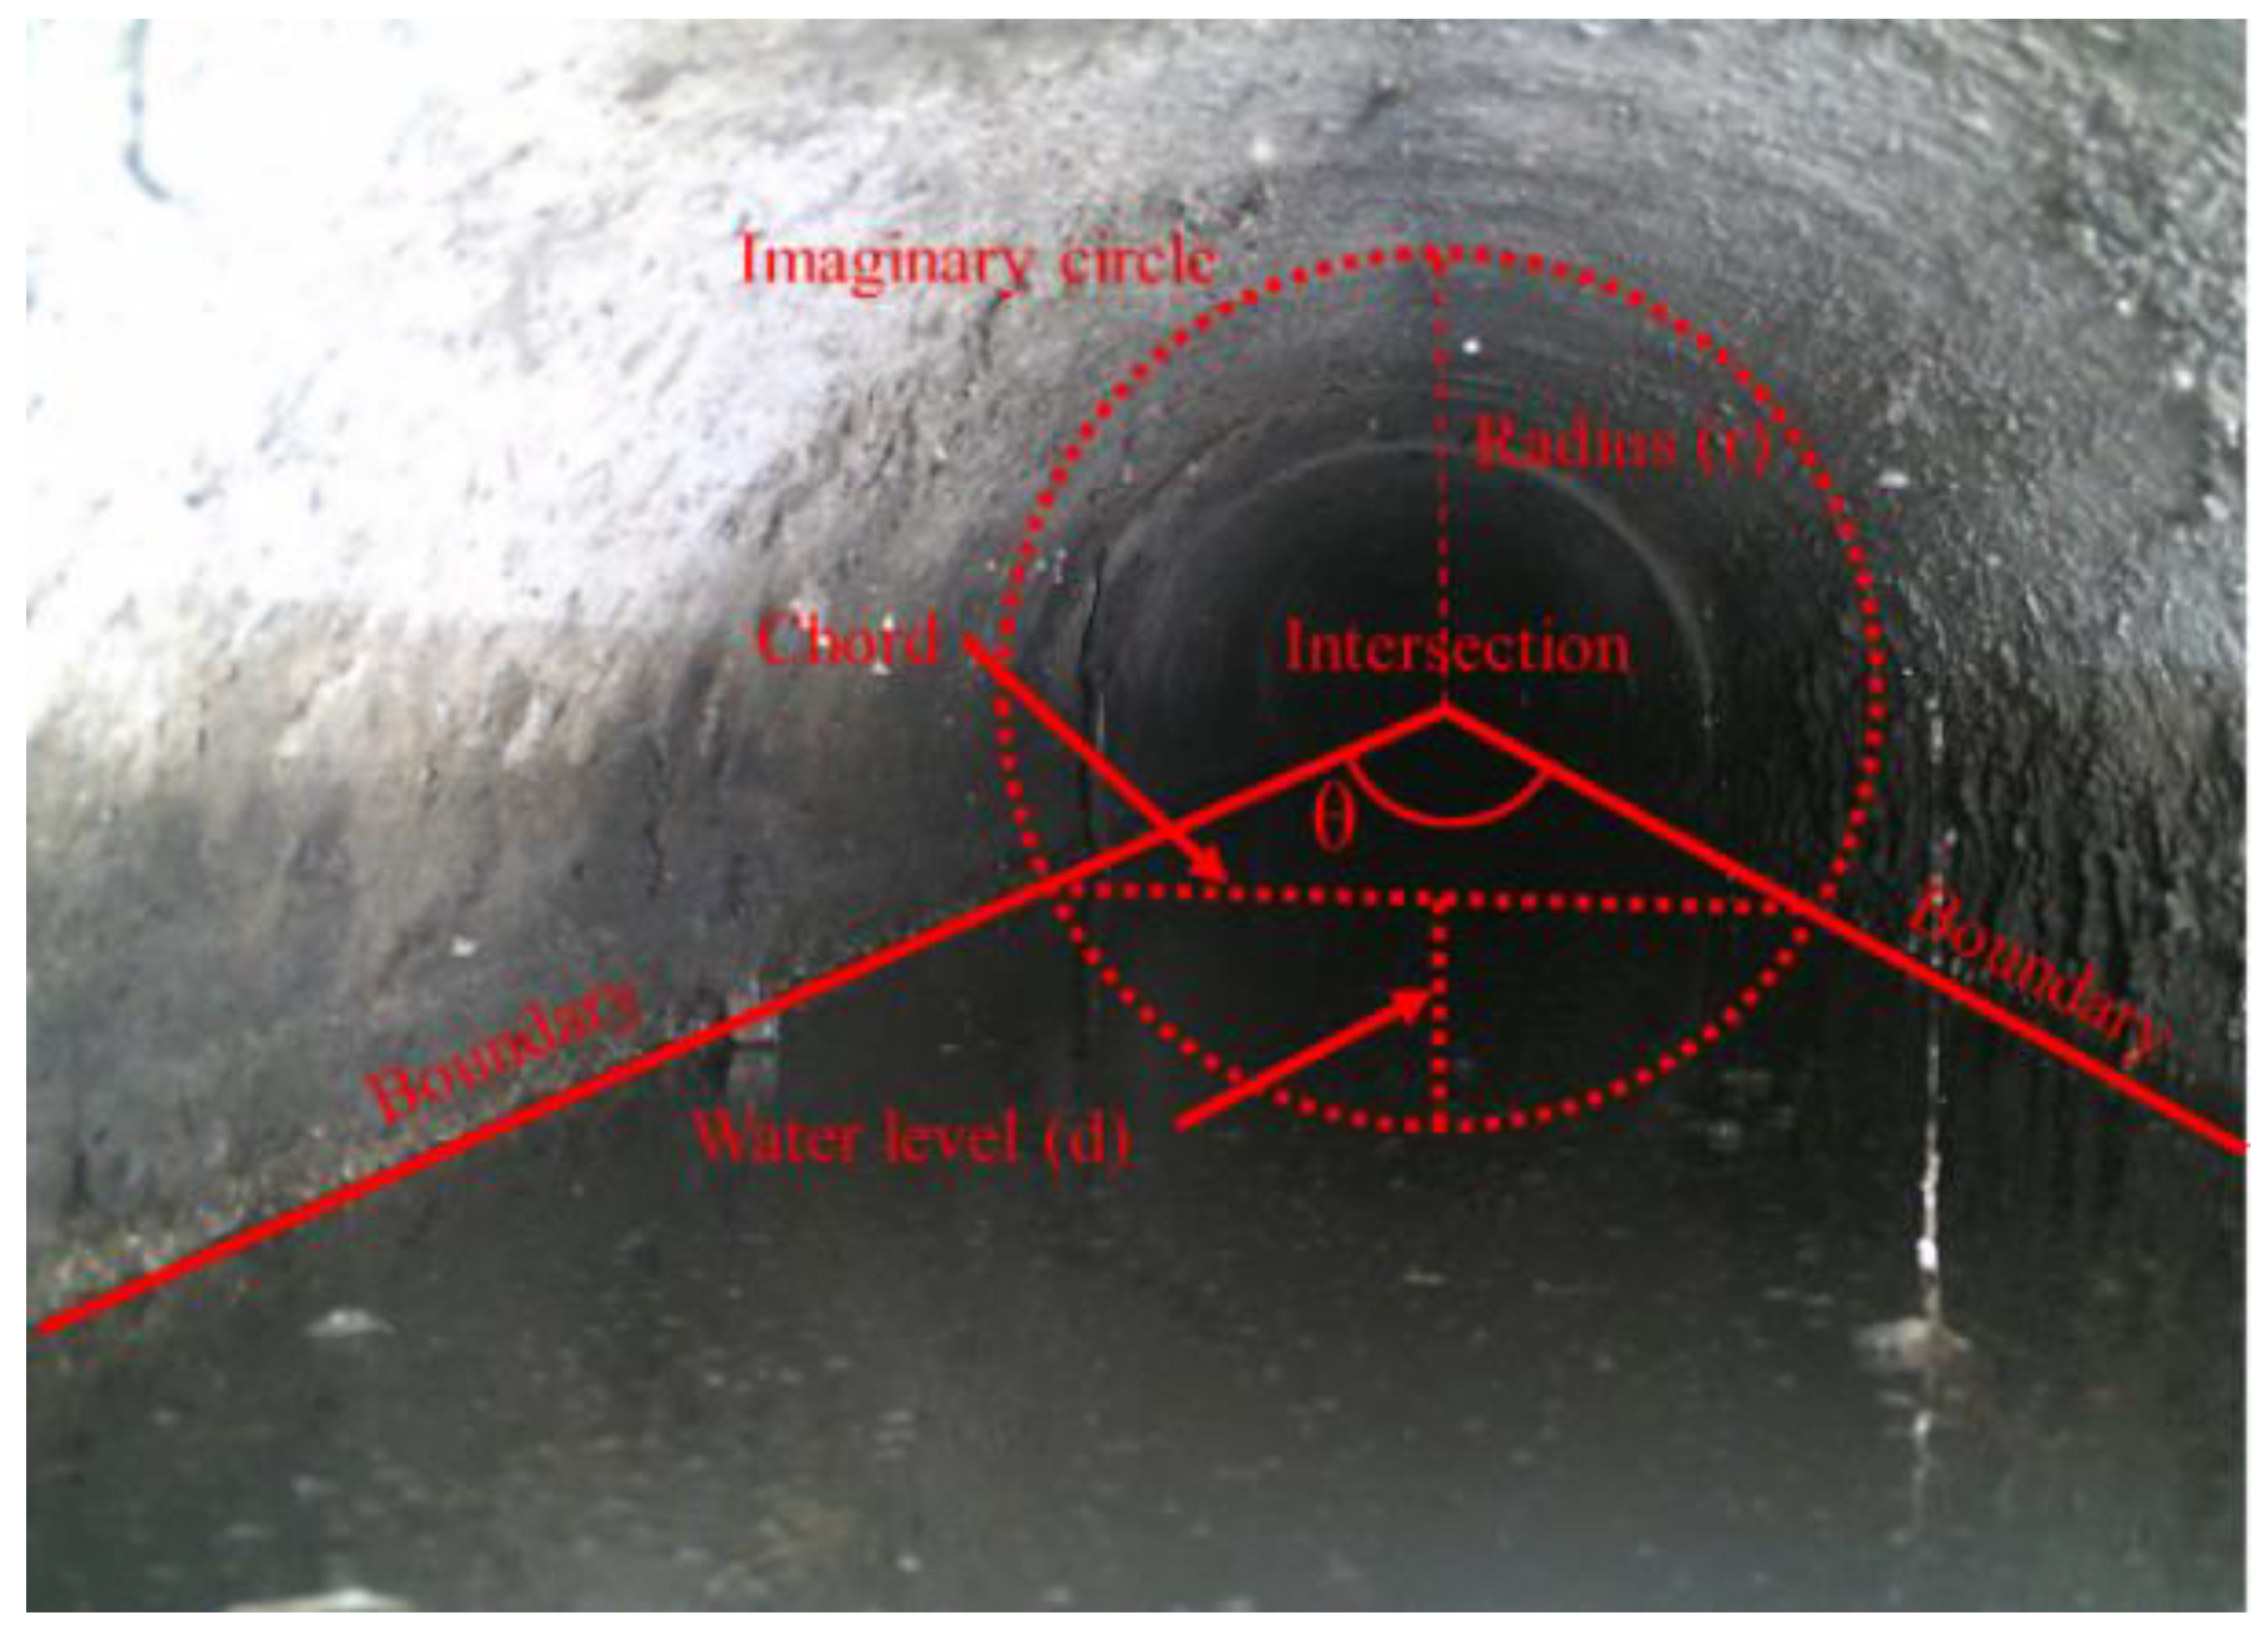
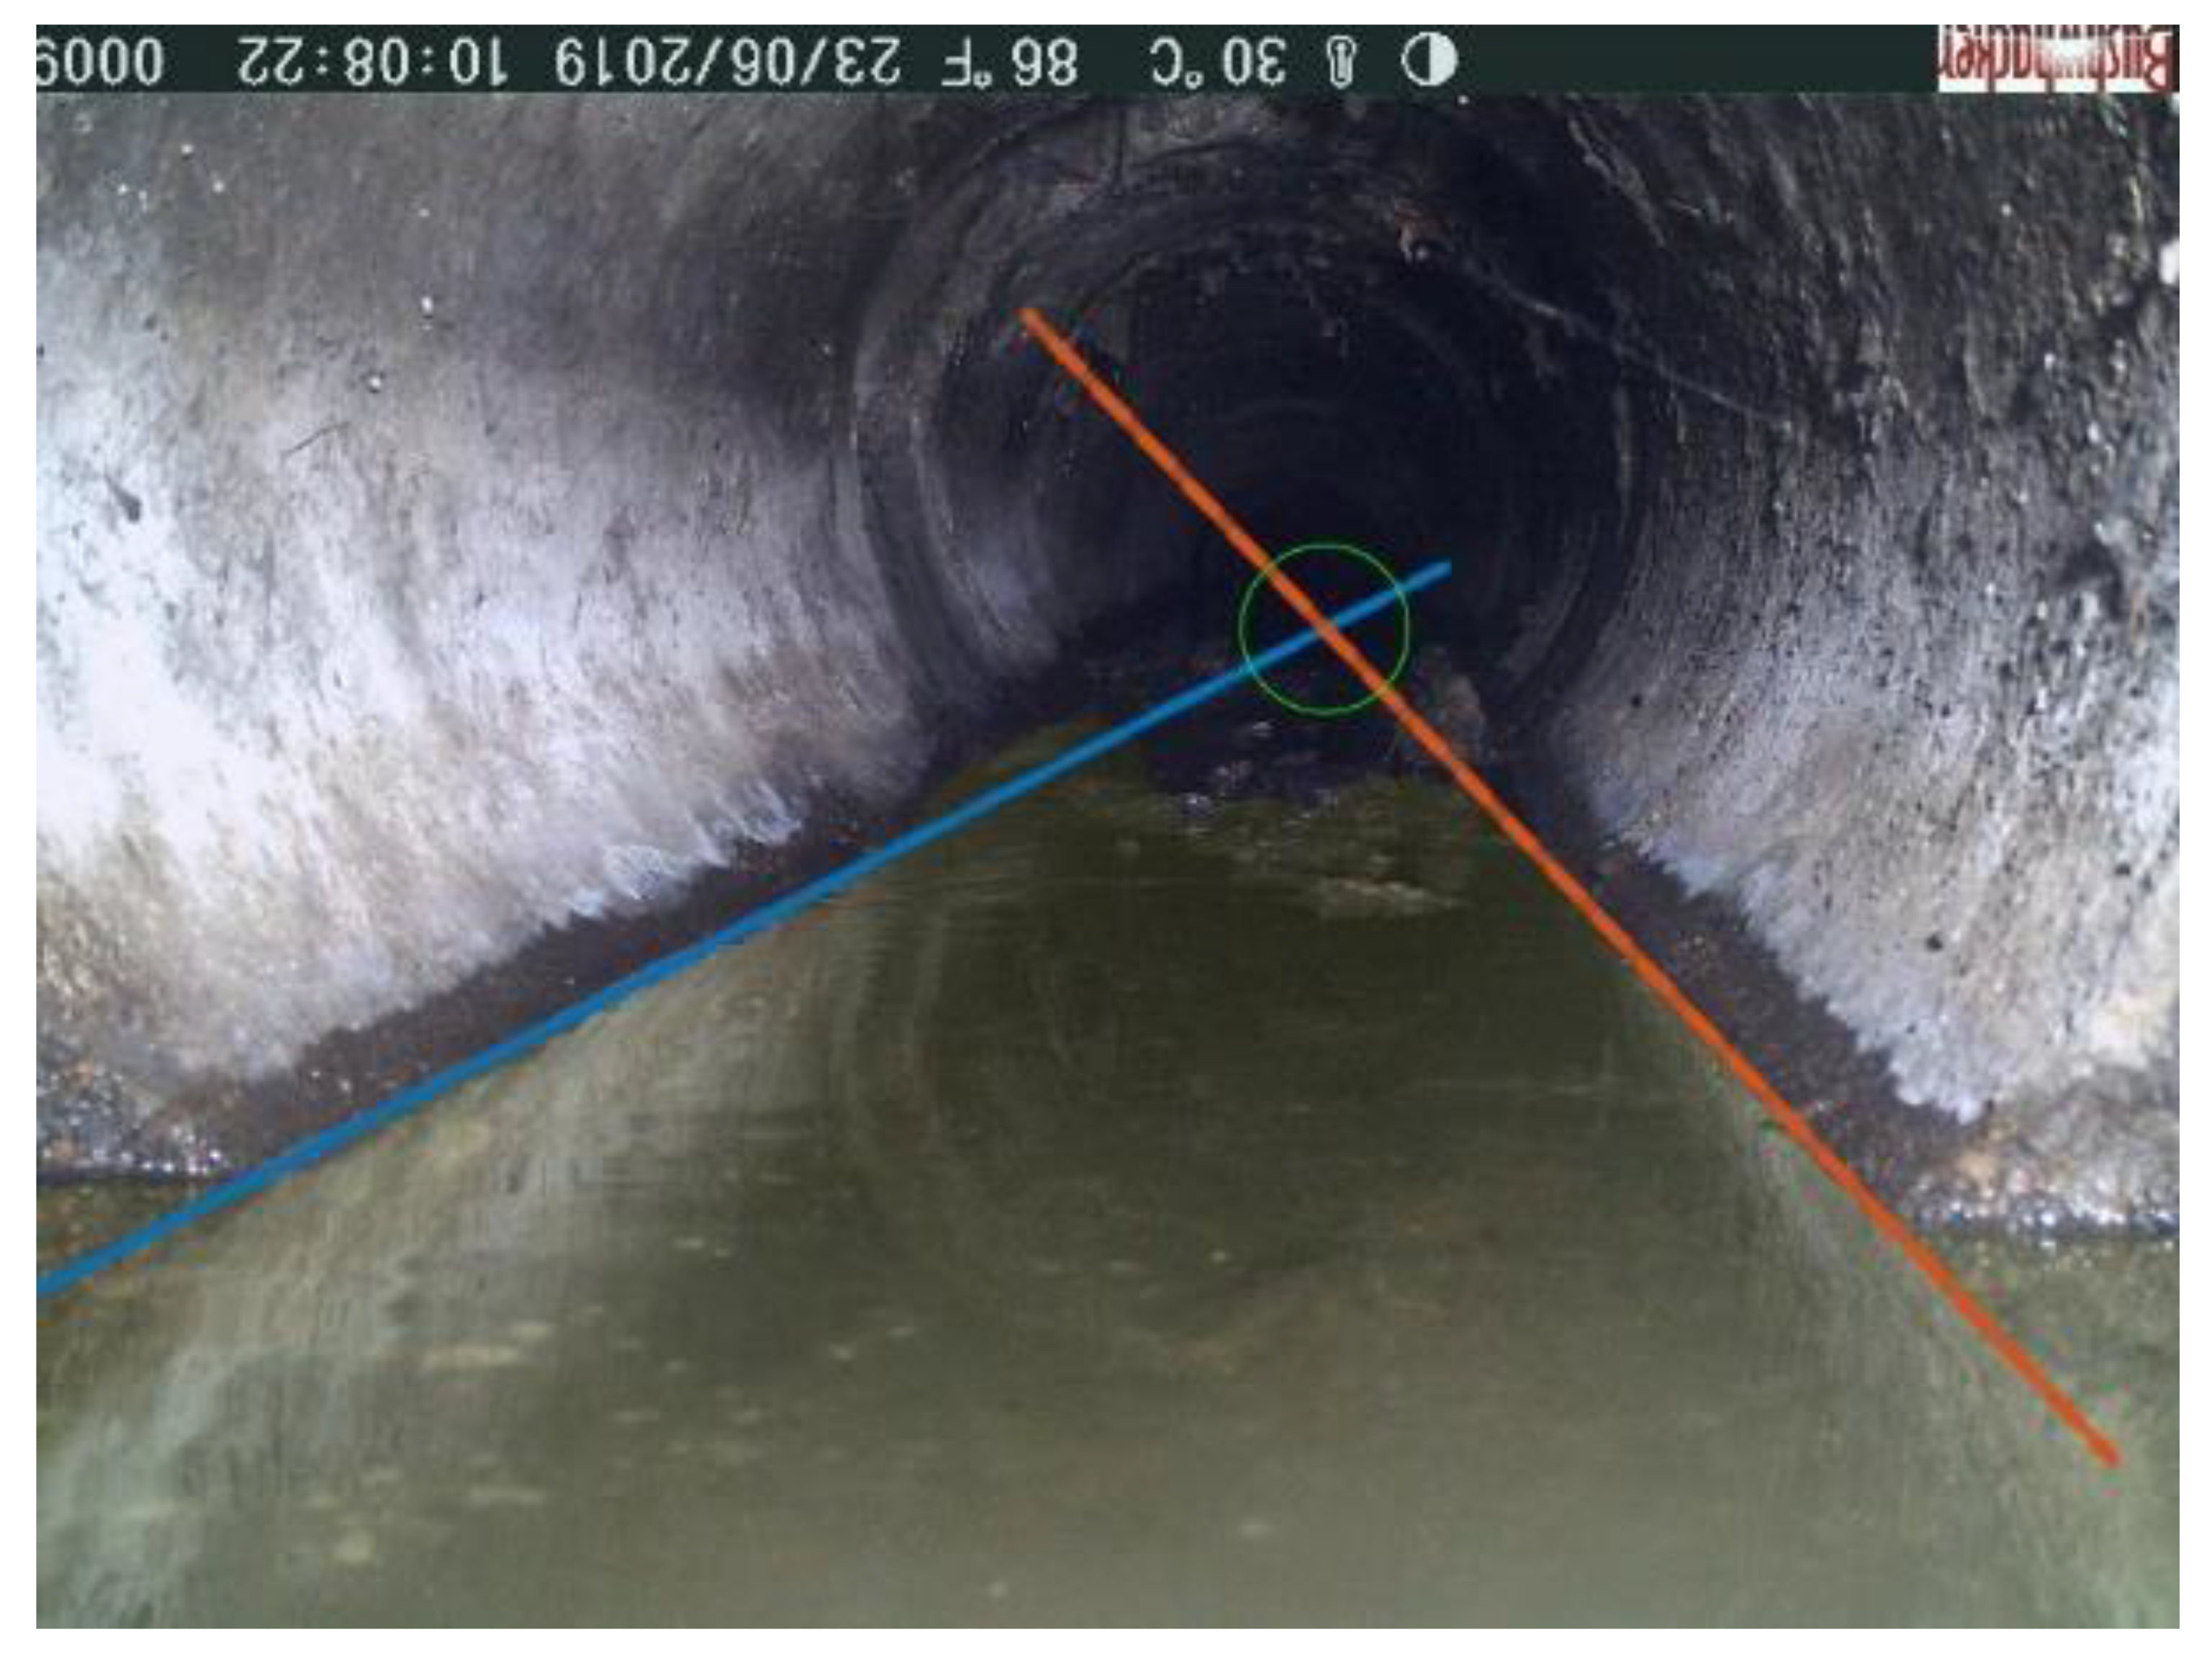
When the boundary line was detected, it was drawn on the image, as shown in
Figure 4, and the intersection point was thus identified. We drew an imaginary circle with a radius (r) with the intersection as the center. The chord of the circle was obtained from the coordinates of the two points where the imaginary circle and the boundary line met. After obtaining the water level (d) from an arbitrary circle, the actual wastewater level was obtained using the proportional relationship between the arbitrary circle and the sewer pipe.
3. Results and Discussion
From the images showing the inside of the sewer pipe, the boundary lines of the wastewater and pipe were detected, as shown in
Figure 5. The small random circle is an imaginary circle used to obtain the water level through the chord. The water levels calculated using the three boundary line detection methods are shown in
Figure 6,
Figure 7 and
Figure 8, respectively, and summarized in
Table 1.
As observed in
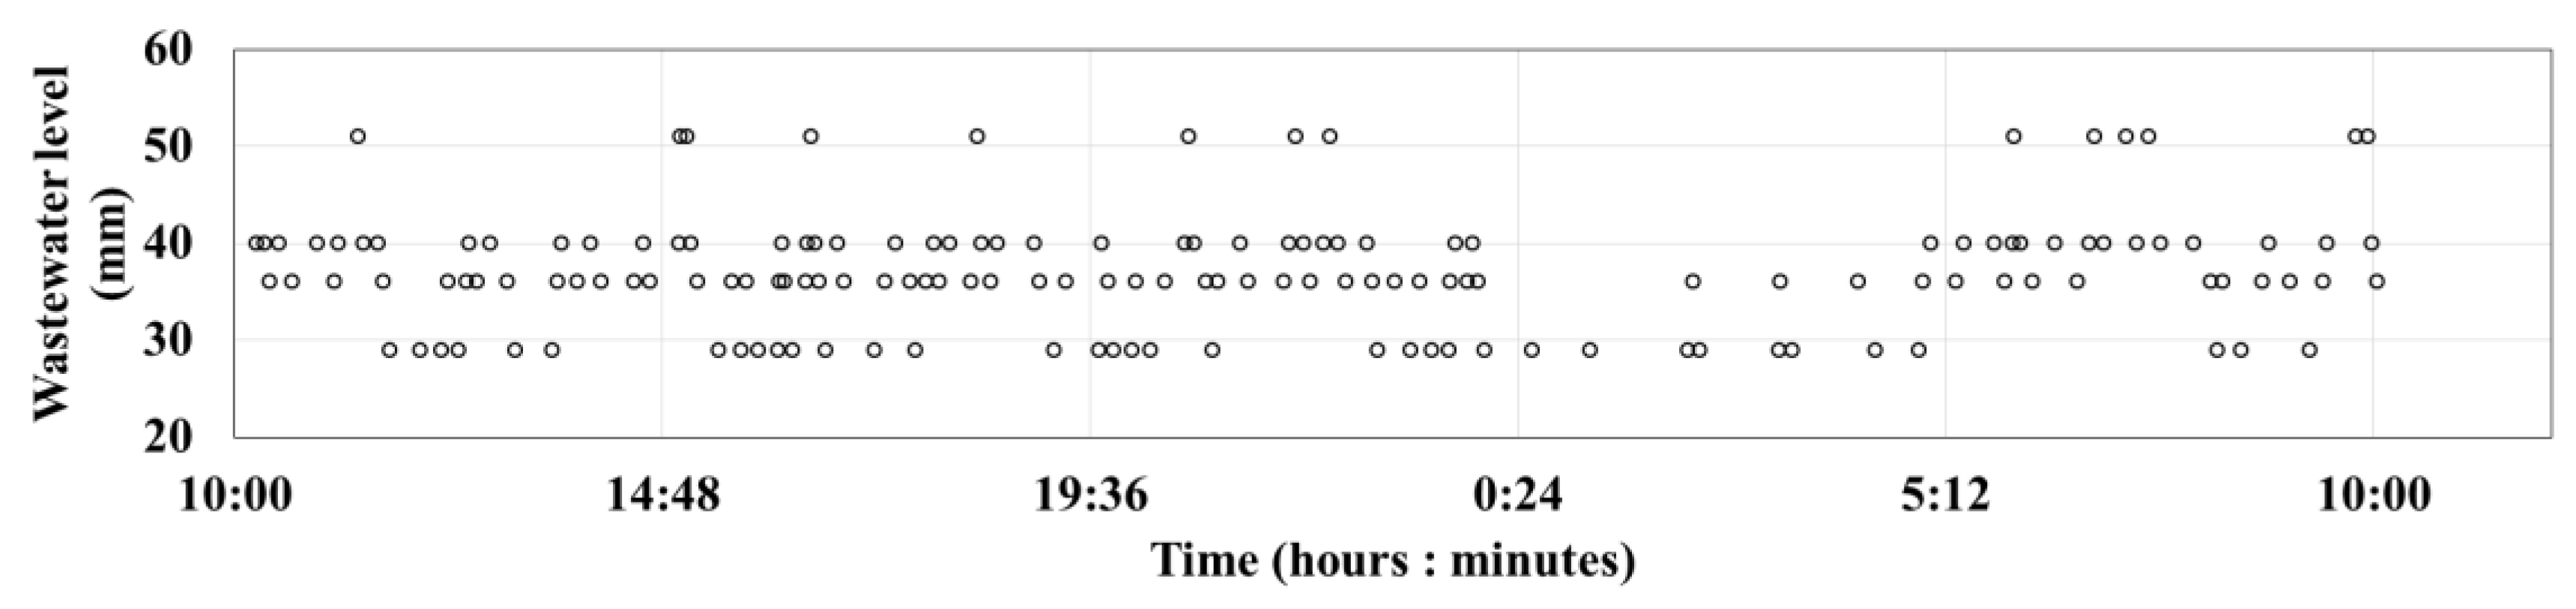
Table 1, the recognition rate of method 1, according to Equation (2) is 12%; however, this method involves direct detection by humans and has the highest accuracy. The maximum value of the wastewater water level calculated using method 1 is 51 mm, and the minimum value is 29 mm. In
Figure 6, when viewed in 2-h increments, the largest number of maximum values can be seen between 06:00 and 08:00, and the second highest number of maximum values is distributed between 20:00 and 22:00. Between 22:00 and 06:00 the next day, the amount of water observed was very low, and in most cases, only the minimum water level was maintained.
where γ is the recognition rate (%),
α is the total number of images,
β is the number of images in which the boundary line was detected.
Human observation and recording of the boundary line show very high accuracy in terms of the maximum and minimum values of the instantaneous flow rate. Because the momentary value is recorded from the image, the value that can be measured is the instantaneous flow rate for a short time. To obtain the hourly flow rate, it is necessary to calculate the sum of the flow rates calculated from several images recorded in seconds or minutes. However, this method has very low efficiency in terms of usage because it processes several images. Therefore, it is not suitable for 24-hour and long-term general observations of wastewater levels.
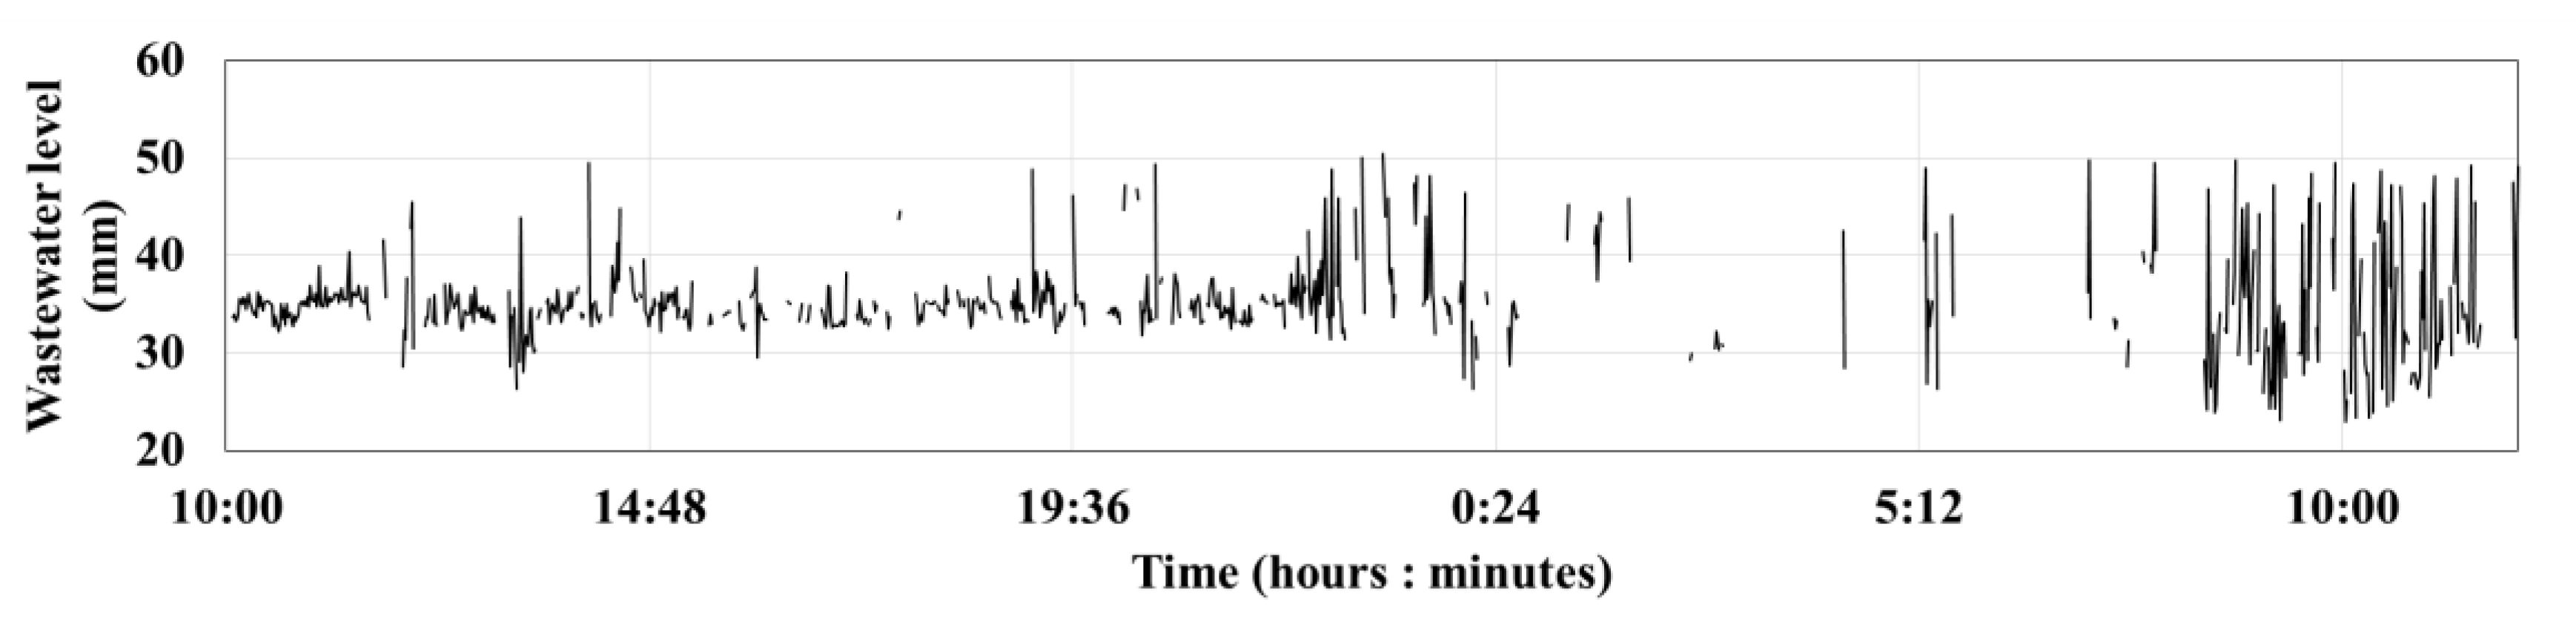
As shown in
Table 1, the boundary line recognition rate is 53% when using method 2; the maximum value of the wastewater water level is 50.6 mm, and the minimum value is 0.58 mm.
Figure 7 depicts several high values distributed during morning (06:00–11:00) and evening (19:00–22:00) hours; additionally, the boundary line is well-detected. Measurement was not possible at dawn (24:00–08:00) with low flow rates because detecting the boundary line was difficult.
Although there are patterns indicating more water usage in the morning and evening than during the day, it is impossible to measure the water level at dawn; therefore, this method is inappropriate for 24-h observations. The simultaneous recognition rate of the wastewater boundary line recognized using methods 1 and 2 by Equation (3) was 60%, and the mean value of the errors that occurred when using method 1 (difference in wastewater levels between methods 1 and 2) was −1.59 mm.
where γ’ is the simultaneous recognition rate with method 1 (%),
δ is the number of images which boundary line was detected by method 1,
ε is the number of images which boundary line was detected by method 1 and another method.
The image processing method adjusts the color, brightness, and contrast of an image to exhibit clearly the specific target area and deleting portions wherever necessary. This technique can highlight boundary lines between objects in an image is called edge detection. Edge detection techniques have been continuously developed, such as method [
9] using Gaussian filter, Sobel [
10], and the method in [
11] using generalized type-2 fuzzy logic.
The image processing method can be used on a general personal computer and laptop, and it is possible to analyze several images continuously. However, coding is not flexible. Because each image captures constantly changing light and objects, all images are not identical. If the analysis is tailored to one image, the conditions are often not applicable to other images. As shown in
Figure 7, boundary lines are often not detected, especially when the water level is low. When the water level was lowered, sediments exposed outside of the wastewater hindered the detection of the boundary lines. As observed in
Table 1, although the error is small, there is a disadvantage that the rate of recognizing the wastewater boundary line is low. This method is applicable when processing a large number of images, but is more suitable for processing a small number of images.
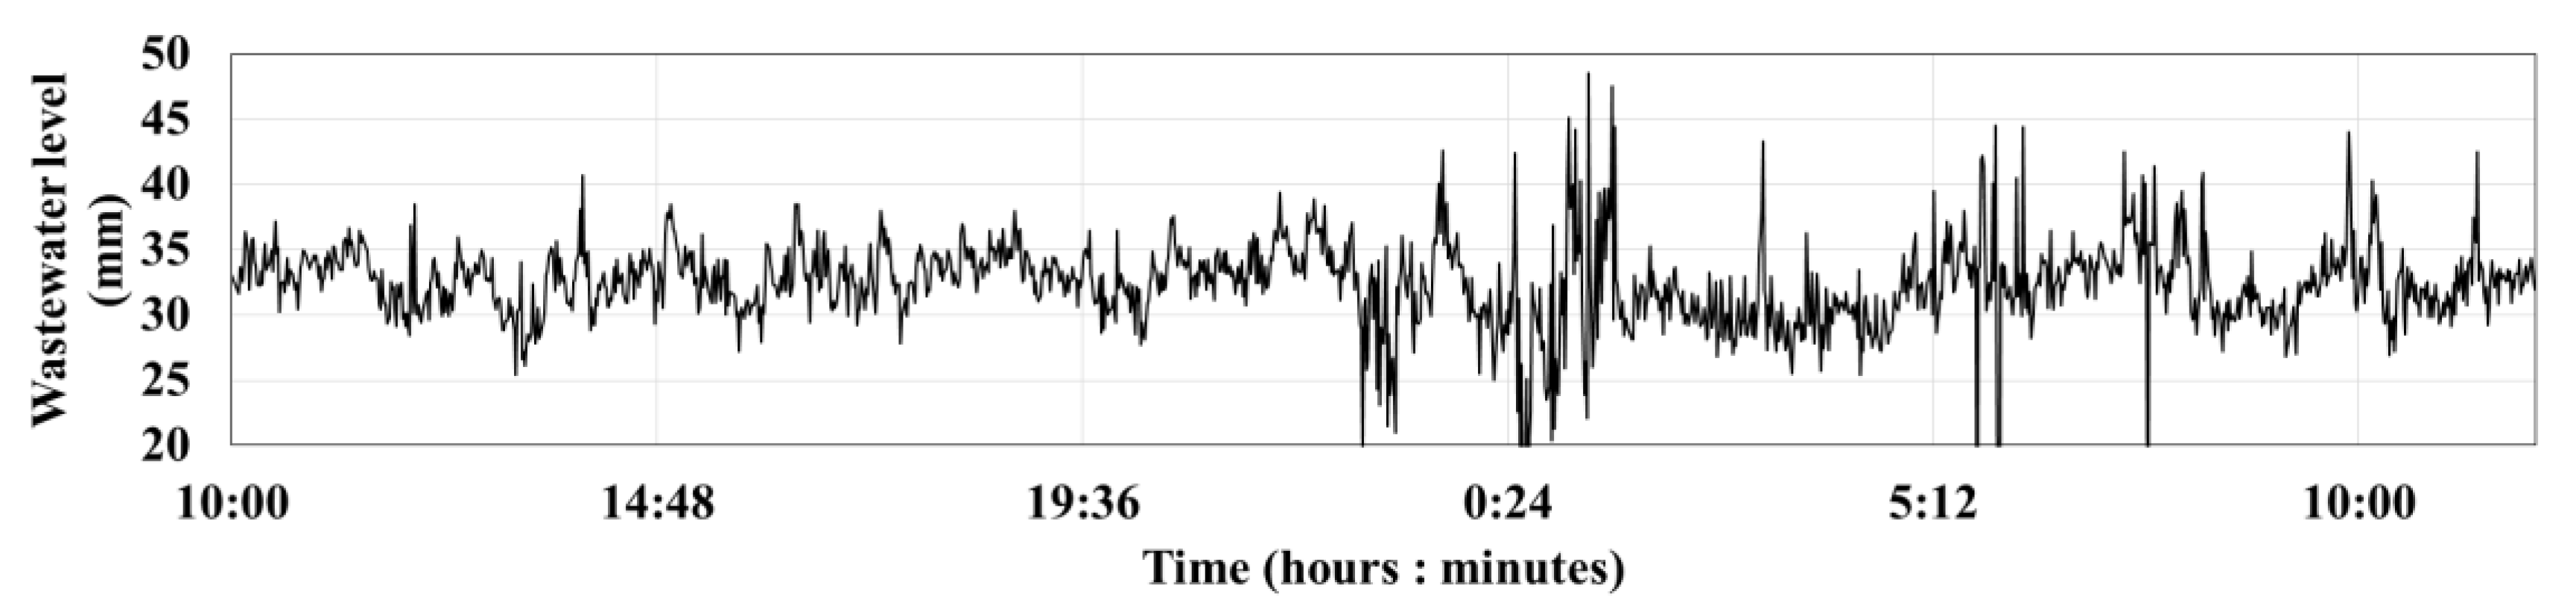
According to
Table 1, the maximum wastewater level identified using method 3 is 48 mm, and the minimum value is 5.85 mm. As shown in
Figure 8, a constant pattern can be observed until 22:00, but the error becomes severe as the amount of wastewater decreases at dawn. Although it is clear that the amount of wastewater decreases at dawn, it is difficult to determine the time at which the flow quantity of wastewater increases. The simultaneous recognition rate of the wastewater boundary line by equation (2) is 100%, and the rate of the wastewater boundary line recognized using method 1 to that recognized using method 3 (simultaneous recognition rate) is also 100%, and the mean error between these methods (the difference between wastewater level determined using methods 1 and 3) is −4.20 mm.
The advantages of semantic segmentation using deep learning are high recognition rate and easy applicability for big data. Although only 80 images were used in this study, the boundary line recognition rate of this method was 100%. The accuracy can be increased by increasing the number of images used for training. Because semantic segmentation assigns an image to pixels, the corresponding object is displayed as a simple label. As this study divided the images into three-pixel labels, the images can be displayed as 1, 2, or 3. These simple, categorized images can be easily used for detecting the boundary line through a simple image processing method. Semantic segmentation has been mainly developed for the large-scale detection that identifies buildings, water, plants, etc. [
12,
13], but method 3 showed that semantic segmentation is possibly used for small-scale measurements.
With the abovementioned advantages aside, the proposed study does suffer from some limitations. Firstly, the method to photograph the inside of a sewer is effective for measuring wastewater in a combined sewer system under dry weather exclusively. This is because the camera remains submerged when the sewer water level exceeds 50% of the pipe diameter. Secondly, flow rate calculations performed using Manning’s equation may incur errors owing to the equation being more suitable for use under steady flow conditions. The authors believe that employing such methods as particle image velocimetry (PIV) or large-scale particle image velocimetry (LSPIV) [
14,
15] for determining surface velocity fields by tracking natural and/or artificial particles in water may improve the proposed method via the added capability of performing field-based measurements.
4. Conclusions
Sewerage systems are under environmentally unfavorable conditions with frequent fluctuations in the wastewater level; therefore, it is difficult to measure water levels using sensors and perform maintenance activities. As a camera is an easily accessible product, it is advantageous because it is economical and easy to maintain. Deep learning and image processing methods can recognize objects or boundaries using images, so detection is possible without having to use a sensor. In this study, despite using only 80 images to train the deep learning network, we achieved 100% recognition of the wastewater boundary line, and the error was not very high compared to the visually determined levels. However, the main disadvantage is that deep learning is significantly affected by the hardware components. Moreover, the graphics card used in this study is not a professional-grade high-performance GPU, thus causing limitations in training. To train more images for learning, parallel processing is required using multiple professional-grade GPUs. Therefore, measurement methods for determining wastewater water levels using deep learning and image processing could sufficiently replace conventional sensor-based measurement systems if the training can be enhanced using a high-performance GPU. From a hydraulic viewpoint, the support for performing surface flow velocity measurements—using image-processing techniques, such as PIV or LSPIV—can make the proposed method more comprehensive, owing to the inclusion of field-based measurements.


