A Regional Difference Analysis of Microplastic Pollution in Global Freshwater Bodies Based on a Regression Model

Abstract
:
1. Introduction
2. Methods
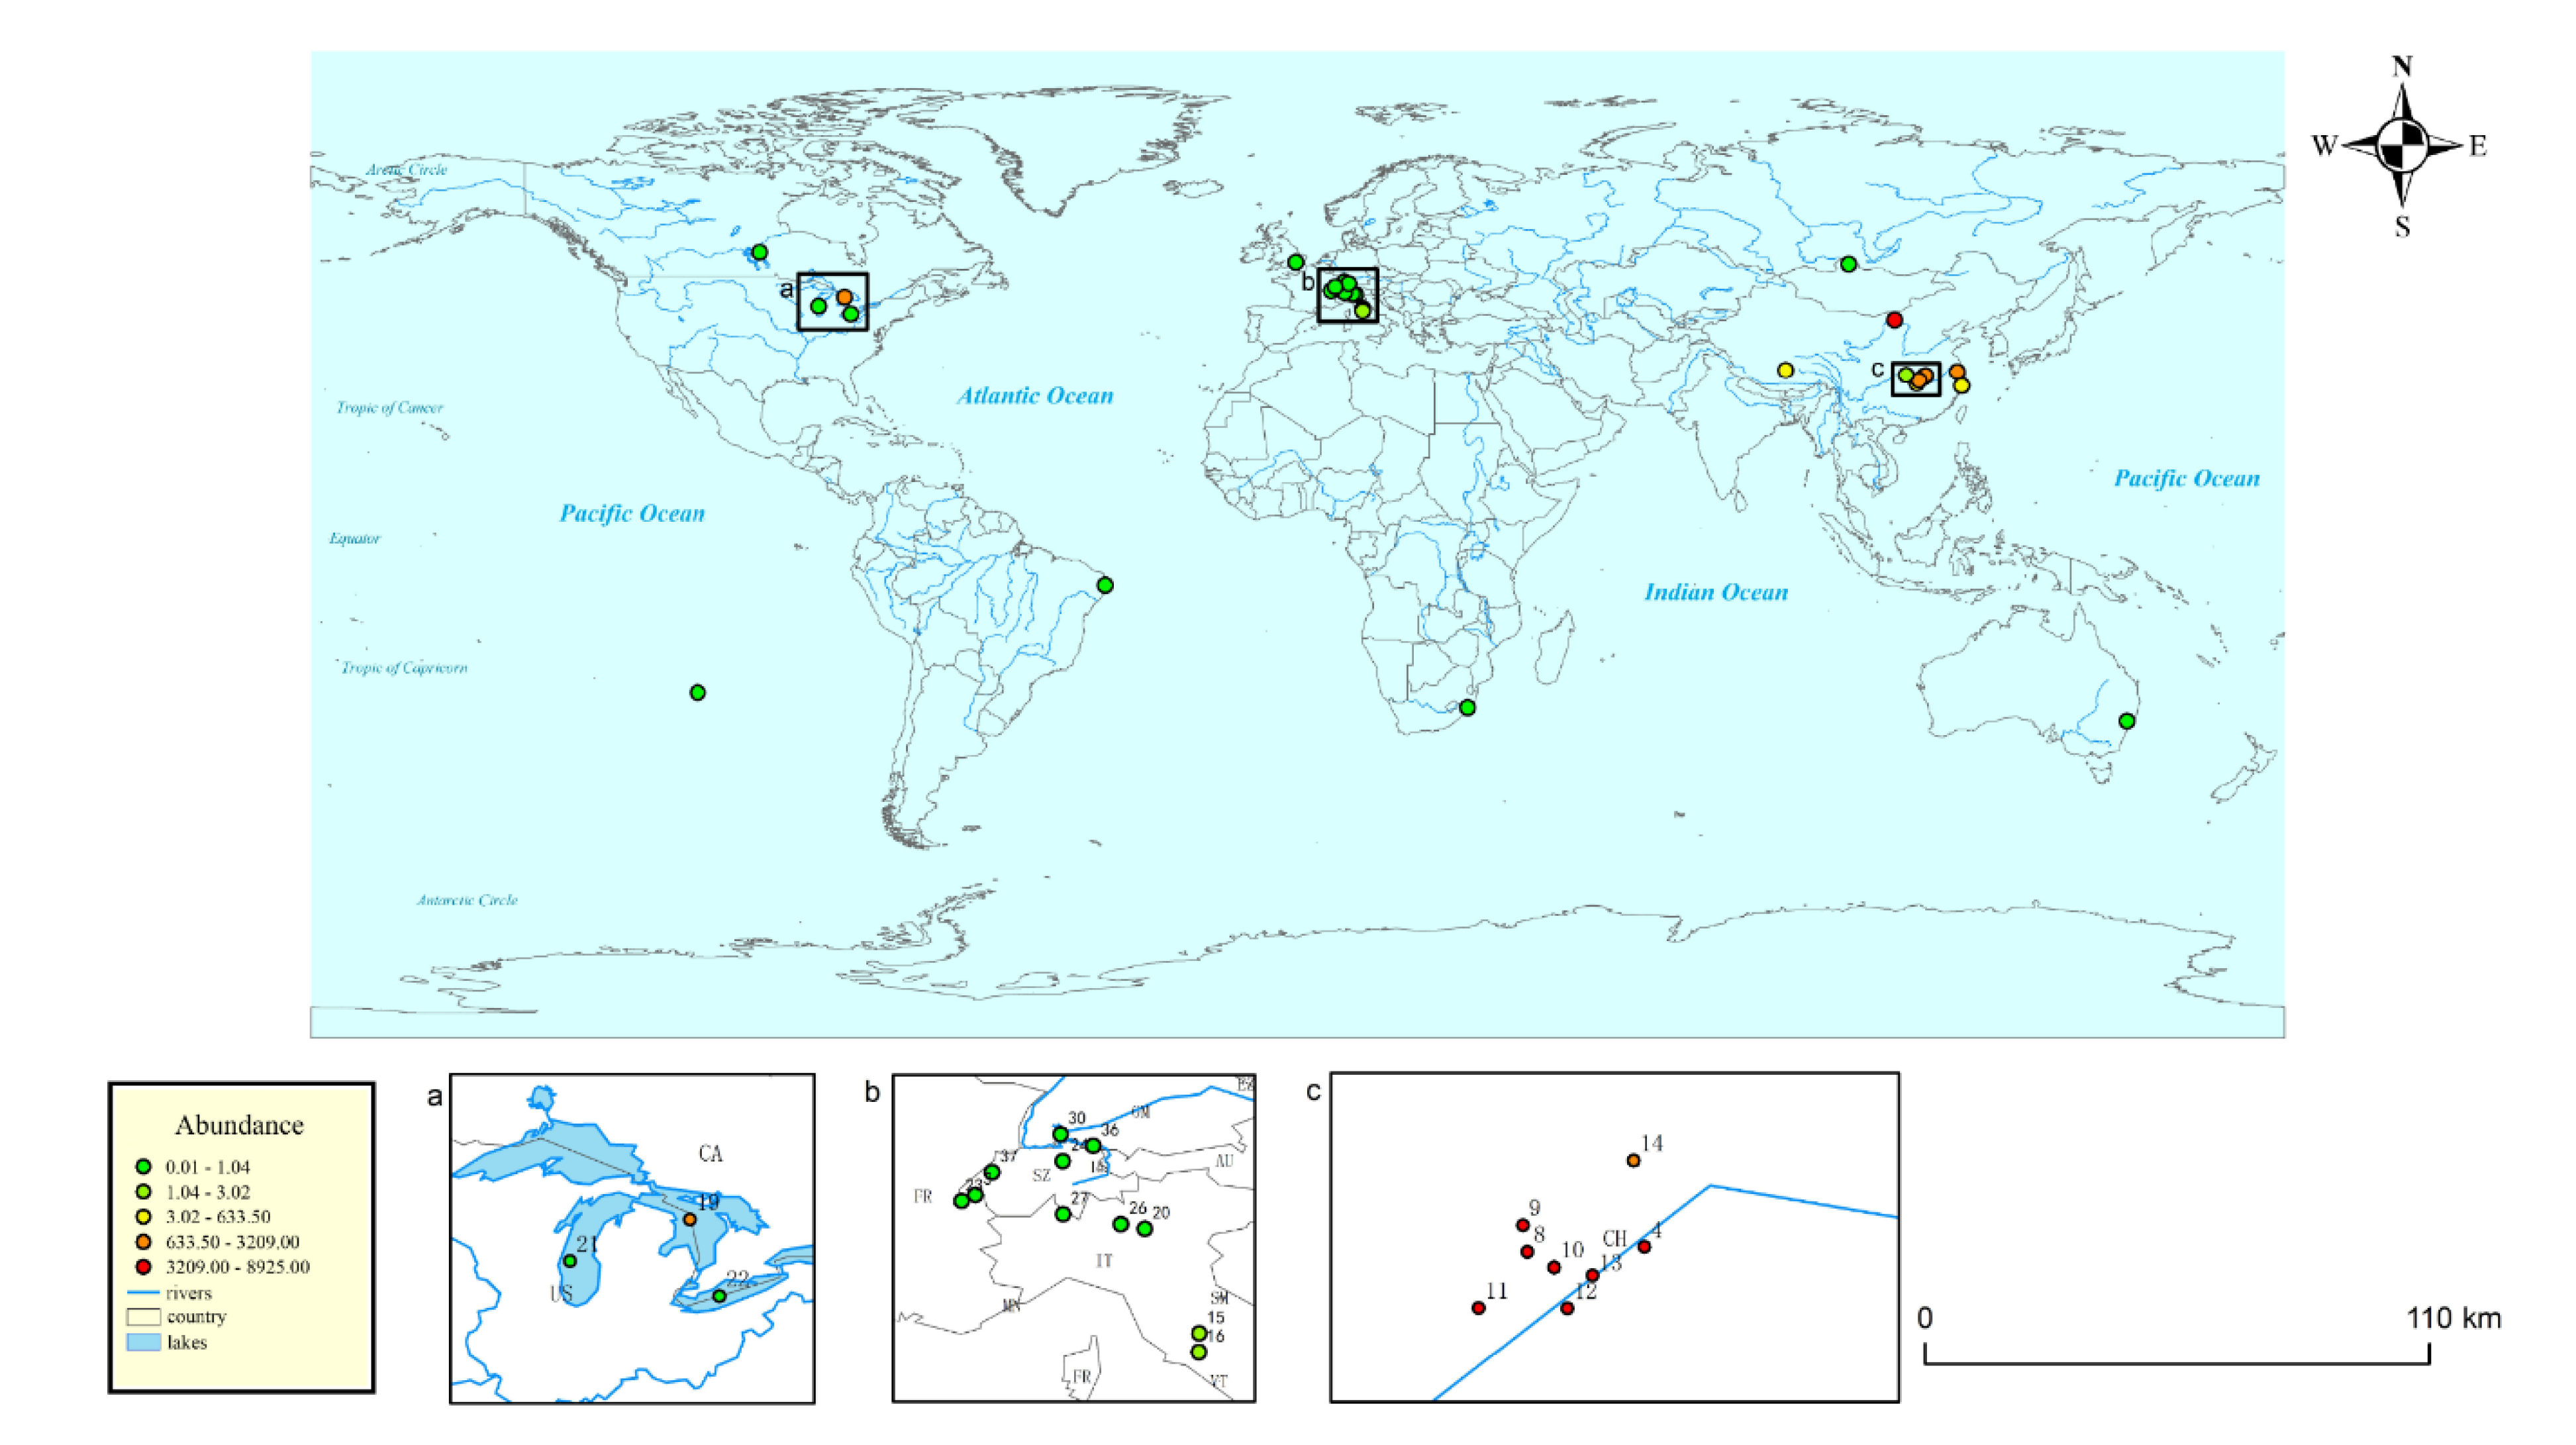
2.1. Data Sources
2.2. Units of Measurement
2.3. Research Methods
3. Results and Discussion
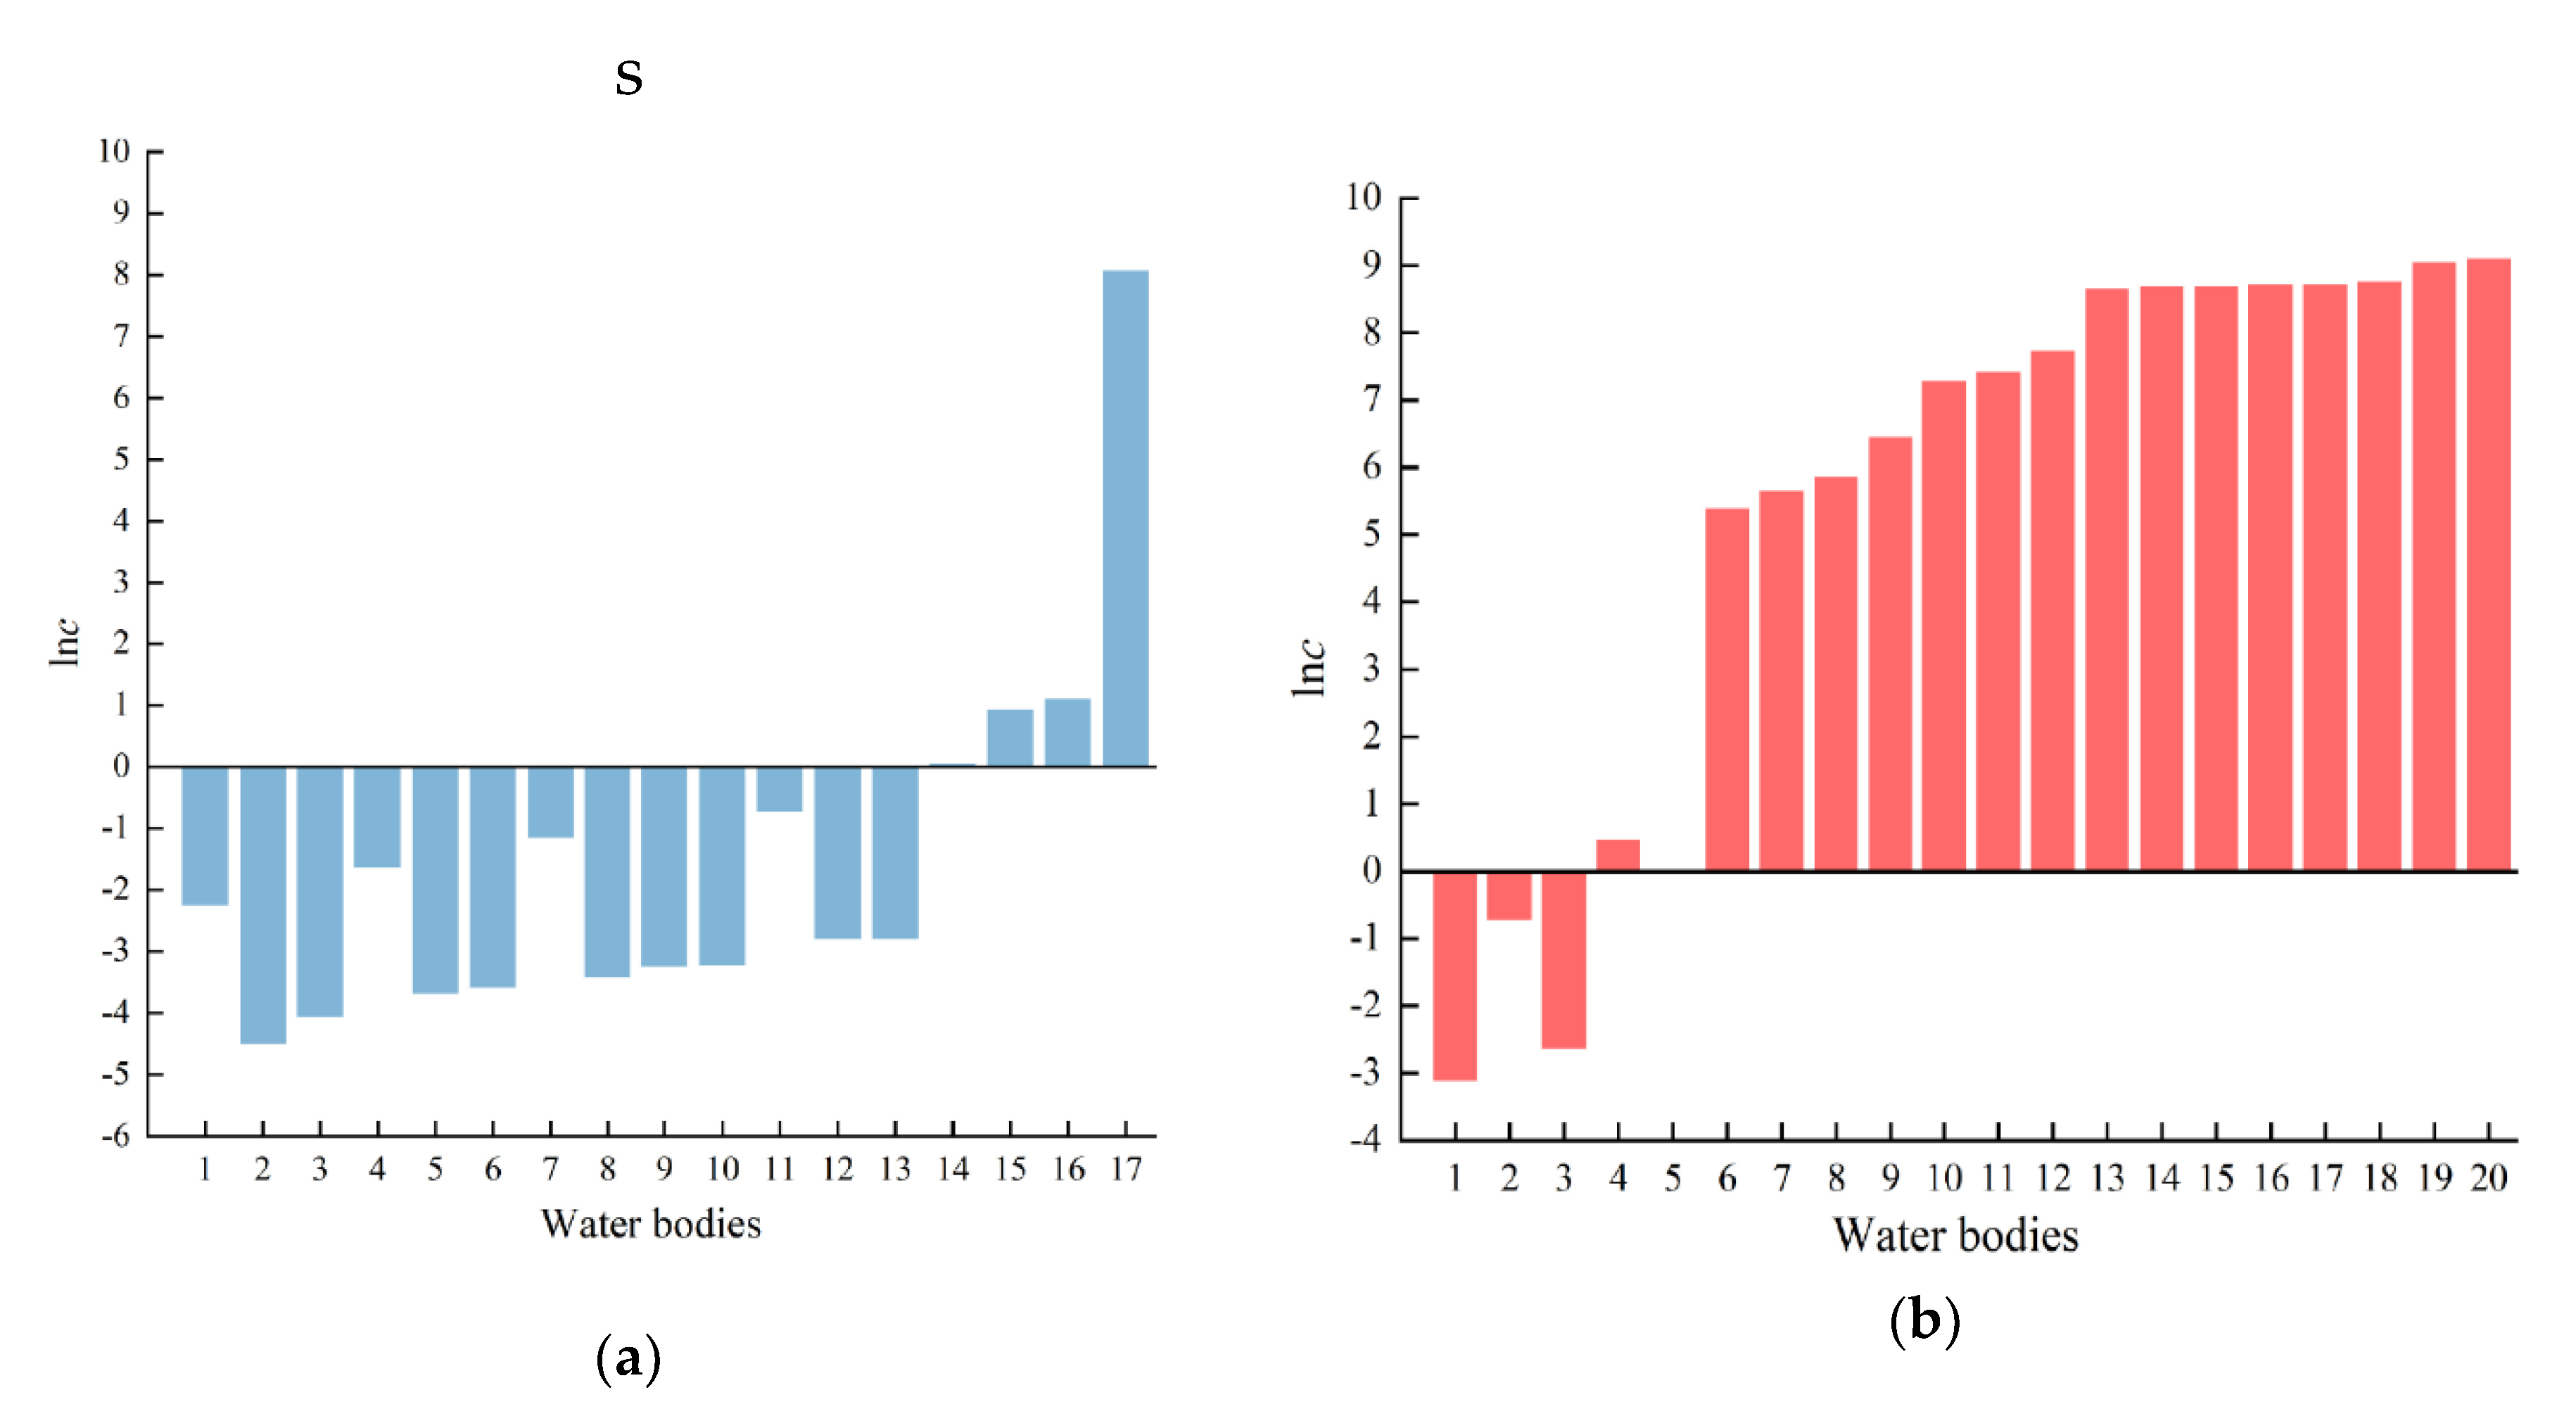
3.1. Difference Analysis of Microplastic Pollution in Global Freshwater Bodies
3.1.1. Difference Analysis of Microplastic Pollution in Developed Countries and Developing Countries
3.1.2. Difference Analysis of Microplastic Pollution in Urban and Rural Freshwater Bodies
3.2. Research on the Influencing Factors of Global Microplastic Pollution Distribution
3.2.1. Natural Factors: Water Depth and Water Area
3.2.2. Social Factors: Population, Population Density, GDP per Capita, Urbanization Level, and Secondary Industry Contribution Rate
4. Conclusions
- The degree of microplastic pollution in the freshwater bodies of the six continents in the world were ranked as follows: Asia > North America > Africa > Oceania > South America > Europe. China was the most seriously polluted and Switzerland was the least polluted. The pollution levels in developed countries were significantly lower than those in developing countries.
- The average density of microplastics in the water environments of developed countries was lower than that of developing countries. Therefore, microplastics in the water environment of developed countries did not easily sink, and were mostly stored in waterbodies. In developing countries, microplastics were mostly found in sediments. The geographical location and the size of the waterbodies had no significant influence on the distribution of microplastic pollution, so they were not the primary factors affecting the distribution of microplastic pollution.
- The regional differences in the distribution of microplastic pollution may depend on factors such as the population, GDP per capita, national economic production level, the receiving waterbody of sewage, and the city pollution treatment technology. Among them, the population and the GDP per capita were directly proportional to the concentration of microplastics. When the waterbody was used as the receiving waterbody of sewage, it depended on the maturity of the urban sewage treatment technology.
Author Contributions
Funding
Acknowledgments
Conflicts of Interest
References
- Jia, E. A world without humans. Disaster Reduct. China 2010, 32, 52–53. [Google Scholar]
- Zhang, K.; Shi, H.; Peng, J.; Wang, Y.; Xiong, X.; Wu, C.; Lam, P.K.S. Microplastic pollution in China’s inland water systems: A review of findings, methods, characteristics, effects, and management. ScTEn 2018, 630, 1641–1653. [Google Scholar] [CrossRef] [PubMed]
- Thompson, R.C.; Olsen, Y.; Mitchell, R.P.; Davis, A.; Rowland, S.J.; John, A.W.G.; McGonigle, D.; Russell, A.E. Lost at sea: Where is all the plastic? Science 2004, 304, 838. [Google Scholar] [CrossRef]
- Zhang, N.; Chen, L. Research progress on additives in micro-plastics and the biological risk. Appl. Chem. Ind. 2019, 1–4. [Google Scholar] [CrossRef]
- Zhao, C.; Li, X.; Zhang, H.; Chen, L.; Ji, Y.; Li, Z.; Ding, G.; Dong, B.; Dai, X. Effect of chemical pretreatment on adsorption of microplastics to Pb. Acta Sci. Circumstantiae 2019, 39, 3387–3394. [Google Scholar] [CrossRef]
- Xu, P.; Guo, J.; Ma, D.; Ge, W.; Zhou, Z.; Chai, C. Sorption of polybrominated diphenyl ethers by virgin and aged microplastics. Environ. Sci. 2020, 41, 1329–1337. [Google Scholar] [CrossRef]
- Zhang, K.; Sun, H. Adsorption of organic pollutants on (degradable) microplastics and the influences on their bioavailability. Environ. Chem. 2018, 37, 375–382. [Google Scholar] [CrossRef]
- Bo, J.; Chen, M.; Fang, C.; Zheng, R.; Wang, S.; Hong, F.; Zhang, Y. Advance in the study on ecotoxicological effects of microplastics on marine organisms. J. Appl. Oceanogr. 2018, 37, 594–600. [Google Scholar] [CrossRef]
- Heidbreder, L.M.; Bablok, I.; Drews, S.; Menzel, C. Tackling the plastic problem: A review on perceptions, behaviors, and interventions. ScTEn 2019, 668, 1077–1093. [Google Scholar] [CrossRef]
- Watkins, L.; Sullivan, P.J.; Walter, M.T. A case study investigating temporal factors that influence microplastic concentration in streams under different treatment regimes. Environ. Sci. Pollut. Res. 2019, 26, 21797–21807. [Google Scholar] [CrossRef]
- Watkins, L.; McGrattan, S.; Sullivan, P.J.; Walter, M.T. The effect of dams on river transport of microplastic pollution. ScTEn 2019, 664, 834–840. [Google Scholar] [CrossRef]
- Anderson, P.J.; Warrack, S.; Langen, V.; Challis, J.K.; Hanson, M.L.; Rennie, M.D. Microplastic contamination in Lake Winnipeg, Canada. Environ. Pollut. 2017, 225, 223–231. [Google Scholar] [CrossRef] [PubMed]
- Lechner, A.; Keckeis, H.; Lumesberger-Loisl, F.; Zens, B.; Krusch, R.; Tritthart, M.; Glas, M.; Schludermann, E. The Danube so colourful: A potpourri of plastic litter outnumbers fish larvae in Europe’s second largest river. Environ. Pollut. 2014, 188, 177–181. [Google Scholar] [CrossRef] [PubMed] [Green Version]
- Faure, F.; Demars, C.; Wieser, O.; Kunz, M.; De Alencastro, L.F. Plastic pollution in Swiss surface waters: Nature and concentrations, interaction with pollutants. Environ. Chem. 2015, 12, 582–591. [Google Scholar] [CrossRef]
- Alencastro, D. Pollution due to plastics and microplastics in Lake Geneva and in the Mediterranean Sea. Arch. Sci. 2012, 65, 157–164. [Google Scholar]
- Mason, S.A.; Kammin, L.; Eriksen, M.; Aleid, G.; Wilson, S.; Box, C.; Williamson, N.; Riley, A. Pelagic plastic pollution within the surface waters of Lake Michigan, USA. J. Great Lakes Res. 2016, 42, 753–759. [Google Scholar] [CrossRef]
- Sadri, S.S.; Thompson, R.C. On the quantity and composition of floating plastic debris entering and leaving the Tamar Estuary, Southwest England. Mar. Pollut. Bull. 2014, 81, 55–60. [Google Scholar] [CrossRef]
- Sighicelli, M.; Pietrelli, L.; Lecce, F.; Iannilli, V.; Falconieri, M.; Coscia, L.; Di Vito, S.; Nuglio, S.; Zampetti, G. Microplastic pollution in the surface waters of Italian Subalpine Lakes. Environ. Pollut. 2018, 236, 645–651. [Google Scholar] [CrossRef] [PubMed]
- Free, C.M.; Jensen, O.P.; Mason, S.A.; Eriksen, M.; Williamson, N.J.; Boldgiv, B. High-levels of microplastic pollution in a large, remote, mountain lake. Mar. Pollut. Bull. 2014, 85, 156–163. [Google Scholar] [CrossRef] [PubMed]
- Wang, W. A study on Microplastics Pollution in Lakes of Central China and the Sorptive Behavior of Phenanthrene and Pyrene onto Microplastics. Ph.D. Thesis, University of Chinese Academy of Sciences, Beijing, China, 2018. [Google Scholar]
- Eriksen, M.; Mason, S.; Wilson, S.; Box, C.; Zellers, A.; Edwards, W.; Farley, H.; Amato, S. Microplastic pollution in the surface waters of the Laurentian Great Lakes. Mar. Pollut. Bull. 2013, 77, 177–182. [Google Scholar] [CrossRef]
- Zbyszewski, M.; Corcoran, P.L. Distribution and degradation of fresh water plastic particles along the beaches of Lake Huron, Canada. Water Air Soil Pollut. 2011, 220, 365–372. [Google Scholar] [CrossRef]
- Lima, A.R.A.; Costa, M.F.; Barletta, M. Distribution patterns of microplastics within the plankton of a tropical estuary. Environ. Res. 2014, 132, 146–155. [Google Scholar] [CrossRef] [PubMed]
- Naidoo, T.; Glassom, D.; Smit, A.J. Plastic pollution in five urban estuaries of KwaZulu-Natal, South Africa. Mar. Pollut. Bull. 2015, 101, 473–480. [Google Scholar] [CrossRef] [PubMed]
- Xu, B.; Huang, Y.; Zheng, Q. Research on micro plastics in fresh water bodies in Taizhou city. Exp. Teach. Appar. 2017, 34, 71–73. [Google Scholar] [CrossRef]
- Su, L.; Xue, Y.; Li, L.; Yang, D.; Kolandhasamy, P.; Li, D.; Shi, H. Microplastics in Taihu Lake, China. Environ. Pollut. 2016, 216, 711–719. [Google Scholar] [CrossRef]
- Feng, Z.; Zhong, W.; Luo, X.; Hu, S.; Zhou, Z.; Yu, G. Evaluation on eutrophication of water body in a new wharf of Dongting Lake area and study on pollution characteristics of micro plastics. Environ. Prot. Circ. Econ. 2019, 39, 46–49. [Google Scholar] [CrossRef]
- Zhang, K.; Gong, W.; Lv, J.; Xiong, X.; Wu, C. Accumulation of floating microplastics behind the Three Gorges Dam. Environ. Pollut. 2015, 204, 117–123. [Google Scholar] [CrossRef] [PubMed]
- Hidalgo-Ruz, V.; Thiel, M. Distribution and abundance of small plastic debris on beaches in the SE Pacific (Chile): A study supported by a citizen science project. Mar. Environ. Res. 2013, 87–88, 12–18. [Google Scholar] [CrossRef]
- Li, C.; Busquets, R.; Campos, L.C. Assessment of microplastics in freshwater systems: A review. ScTEn 2020, 707, 135578. [Google Scholar] [CrossRef]
- Zhang, K.; Su, J.; Xiong, X.; Wu, X.; Wu, C.; Liu, J. Microplastic pollution of lakeshore sediments from remote lakes in Tibet plateau, China. Environ. Pollut. 2016, 219, 450–455. [Google Scholar] [CrossRef]
- Wang, Z.; Qin, Y.; Li, W.; Yang, W.; Meng, Q.; Yang, J. Microplastic contamination in freshwater: First observation in Lake Ulansuhai, Yellow River Basin, China. Environ. Chem. Lett. 2019, 17, 1821–1830. [Google Scholar] [CrossRef]
- Meng, L.; Yang, Z.; Li, H.; Xue, R. Analysis on the regional differences of water pollution emission intensity in China based on the Theil index. Environ. Pollut. Control 2018, 40, 241–246. [Google Scholar] [CrossRef]
- Yan, Y.; Wang, X.; Zhou, J. The seasonal differences of PM2.5 pollution characteristics and source regions between winter and spring in Fuzhou urban areas. Acta Sci. Circumstantiae 2019, 39, 1049–1056. [Google Scholar] [CrossRef]
- Wang, N.; Xu, C. Analysis of factors affecting carbon emissions in Qingdao based on STIRPAT model. J. Qingdao Univ. (Nat. Sci. Ed.) 2016, 29, 90–94. [Google Scholar] [CrossRef]
- Steinmetz, Z.; Wollmann, C.; Schaefer, M.; Buchmann, C.; David, J.; Tröger, J.; Muñoz, K.; Frör, O.; Schaumann, G.E. Plastic mulching in agriculture. Trading short-term agronomic benefits for long-term soil degradation? ScTEn 2016, 550, 690–705. [Google Scholar] [CrossRef]
- Xu, Y.; Fang, S.; Ma, X.; Zhu, Q. Prevention and control strategy for the pollution of agricultural plastic film. Eng. Sci. 2018, 20, 96–102. [Google Scholar] [CrossRef]
- Bai, X.; Hu, W. Effect of water depth on concentration of TN, TP and Chla in Taihu Lake, China. Adv. Water Sci. 2006, 17, 727–732. [Google Scholar] [CrossRef]
- Wang, M. Research on prediction of GDP per capita in China based on semi-parametric time series model. Mark. Res. 2018, 476, 23–25. [Google Scholar] [CrossRef]


| Serial Number | Name of Waterbody | Type of Waterbody | Continent | Country | Type of Country | Type of Geography | Overall Average Abundance (n/m3) |
|---|---|---|---|---|---|---|---|
| 1 | Lake Winnipeg | Lake | North America | Canada | Developed country | Urban type | 0.19 [12] |
| 2 | Danube River | River | Europe | Germany | Developed country | Urban type | 0.317 [13] |
| 3 | Lake Zurich | Lake | Europe | Switzerland | Developed country | Urban type | 0.011 [14] |
| 4 | Lake Geneva | Lake | Europe | Switzerland | Developed country | Urban type | 0.048 [15] |
| 5 | Lake Michigan | Lake | North America | America | Developed country | Urban type | 0.017 [16] |
| 6 | Tamar River | River | Europe | Britain | Developed country | Urban type | 0.028 [17] |
| 7 | Lake Petit | Lake | Europe | Switzerland | Developed country | Urban type | 0.033 [18] |
| 8 | Lake Maggiore | Lake | Europe | Italy | Developed country | Urban type | 0.039 [19] |
| 9 | Lake Iseo | Lake | Europe | Italy | Developed country | Urban type | 0.040 [18] |
| 10 | Lake Constance | Lake | Europe | Switzerland | Developed country | Urban type | 0.061 [19] |
| 11 | Lake Neuchatel | Lake | Europe | Switzerland | Developed country | Urban type | 0.061 [19] |
| 12 | Lake Bolsena | Lake | Europe | Italy | Developed country | Urban type | 2.51 [20] |
| 13 | Lake Chusi | Lake | Europe | Italy | Developed country | Urban type | 3.02 [20] |
| 14 | Lake Erie | Lake | North America | America | Developed country | Urban type | 0.106 [21] |
| 15 | Lake Huron | Lake | North America | America | Developed country | Urban type | 3209 [22] |
| 16 | Lake Garda | Lake | Europe | Italy | Developed country | Rural type | 0.025 [22] |
| 17 | Lake St. Clair | Lake | Oceania | Australia | Developed country | Rural type | 1.048 [13] |
| 18 | Goiana River | River | South America | Brazil | Developed country | Urban type | 0.190 [22] |
| 19 | KwaZulu-Natal River | River | Africa | South Africa | Developing country | Urban type | 0.487 [23] |
| 20 | Lake Hovsgol | Lake | Asia | Mongolia | Developing country | Urban type | 0.044 [14] |
| 21 | East Lake (Zhejiang) | Lake | Asia | China | Developing country | Urban type | 220 [24] |
| 22 | Ling Lake | Lake | Asia | China | Developing country | Urban type | 350 [24] |
| 23 | Dongting Lake | Lake | Asia | China | Developing country | Urban type | 633.5 [25] |
| 24 | Tai Lake | Lake | Asia | China | Developing country | Urban type | 1460 [26] |
| 25 | Wu Lake | Lake | Asia | China | Developing country | Urban type | 1660 [20] |
| 26 | Hong Lake | Lake | Asia | China | Developing country | Urban type | 2282.5 [20] |
| 27 | South Lake | Lake | Asia | China | Developing country | Urban type | 5745 [20] |
| 28 | East Lake (Hubei) | Lake | Asia | China | Developing country | Urban type | 5914 [20] |
| 29 | South Prince Edward Lake | Lake | Asia | China | Developing country | Urban type | 6162.5 [20] |
| 30 | Tazi Lake | Lake | Asia | China | Developing country | Urban type | 6175 [20] |
| 31 | Sha Lake | Lake | Asia | China | Developing country | Urban type | 6390 [20] |
| 32 | Huanzi Lake | Lake | Asia | China | Developing country | Urban type | 8550 [20] |
| 33 | North Lake | Lake | Asia | China | Developing country | Urban type | 8925 [20] |
| 34 | Three Gorges Reservoir | Reservoir | Asia | China | Developing country | Rural type | 1.600 [27] |
| 35 | Easter Island | Lake | South America | Chile | Developing country | Rural type | 0.072 [28,39] |
| 36 | Siling Co Basin | Lake | Asia | China | Developing country | Rural type | 285 [30,31] |
| 37 | Lake Ulangsuhai | Lake | Asia | China | Developing country | Rural type | 5940 [32] |
| Measure | Original Unit | Conversion Formula | Note |
|---|---|---|---|
| Unit volume | items/L | 1 items/L = 103 n/m3 | Items, ind, and pieces are equal to abundance units n. |
| ind/m3 | 1 ind/m3 = 1 n/m3 | ||
| ind/L | 1 ind/L = 103 n/m3 | ||
| pieces/m3 | 1 pieces/m3 = 1 n/m3 | ||
| Unit water area | items/m2 | 1 items/m2 = 1 n/m3 | Suppose the water depth per unit area is 1 m,1 km2 = 106 m2 |
| items/km2 | 1 items/km2 = 10−6 n/m3 | ||
| ind/km2 | 1 ind/km2 = 10−6 n/m3 | ||
| ind/m2 | 1 ind/m2 = 1 n/m3 | ||
| particles/m2 | 1 particles/m2 = 1 n/m3 | ||
| particles/km2 | 1 particles/km2 = 10−6 n/m3 | ||
| pieces/m2 | 1 pieces/m2 = 1 n/m3 |
| Type of Country | Number of Samples | Settlement Ratio (%) | Main Composition | Main Ingredient Content (%) | ||
|---|---|---|---|---|---|---|
| PP | PE | PET | ||||
| Developed country | 4 | 90.72 | PP, PE | 17.2–19 | 19–48 | - |
| Developing country | 12 | 99.24 | PP, PE, PET | 0–29.54 | 19–63.7 | 14–40.91 |
| PP | PE | PS | PET | PEst | PVC | PA | EPS | PU | Cellophane | ABS | |
|---|---|---|---|---|---|---|---|---|---|---|---|
| Pearson correlation | 0.333 | −0.340 | −0.112 | 0.661 ** | −0.295 | −0.625 ** | 0.596 ** | −0.522 * | −0.522 * | −0.295 | −0.522 * |
| Sig | 0.207 | 0.198 | 0.681 | 0.005 | 0.267 | 0.010 | 0.015 | 0.038 | 0.038 | 0.267 | 0.038 |
| Type of Waterbody | Type of Country | Number of Samples | Average Distance from City Center (km) | Average Abundance Range of Microplastics (n/m3) |
|---|---|---|---|---|
| Urban type | Developed country | 15 | 76.21 | 0.011–3209 |
| Developing country | 16 | 31.37 | 0.044–8925 | |
| Rural type | Developed country | 2 | 79.85 | 0.025–1.05 |
| Developing country | 4 | 92.98 | 0.072–5940 |
| Continent | Number of Samples | Average Water Depth (m) | Water Area (m2) |
|---|---|---|---|
| Europe | 9 | 115.57 | 306.6 |
| Asia | 15 | 18 | 731.5 |
| North America | 4 | 43.75 | 7238.3 |
| Model | Unstandardized Coefficient | Standardized Coefficient | t | Significance | |
|---|---|---|---|---|---|
| B | Standard Error | Beta | |||
| Constant | 3069.931 | 653.170 | 4.700 | 0.000 | |
| Average water depth (m) | −24.252 | 8.454 | −0.531 | −2.869 | 0.009 |
| Water area (m2) | −0.106 | 0.564 | 0.579 | ||
| Developing Country | Developed Country | |
|---|---|---|
| Number of waterbodies | 20 | 17 |
| Number of countries involved | 5 | 7 |
| Average population (ten thousand people) | 33,279.66 | 8552.86 |
| Average population density (n/km2) | 47.82 | 156.42 |
| GDP per capita (ten thousand yuan) | 60.10 | 356.72 |
| Average secondary industry contribution rate (%) | 22.67 | 19.67 |
| Average urbanization rate (%) | 63.90 | 80.72 |
| Model | Unstandardized Coefficient | Standardized Coefficient | t | Distinctiveness | |
|---|---|---|---|---|---|
| B | Standard Error | Beta | |||
| onstant | 310.453 | 611.812 | 0.507 | 0.647 | |
| Population (ten thousand people) | 0.029 | 0.002 | 0.983 | 15.493 | 0.001 |
| GDP per capita (ten thousand yuan) | 1.403 | 0.516 | 0.160 | 2.718 | 0.033 |
| Secondary industry contribution rate (%) | −0.076 | 4.095 | −0.001 | -0.019 | 0.986 |
| Urbanization rate (%) | −10.279 | 7.700 | −0.110 | −1.335 | 0.274 |
| Population density (n/km2) | −0.303 | 0.683 | −0.026 | −0.443 | 0.688 |
| Dependent variable: average abundance of microplastics in waterbodies (n/m3). | |||||
© 2020 by the authors. Licensee MDPI, Basel, Switzerland. This article is an open access article distributed under the terms and conditions of the Creative Commons Attribution (CC BY) license (http://creativecommons.org/licenses/by/4.0/).
Share and Cite
Chen, H.; Qin, Y.; Huang, H.; Xu, W. A Regional Difference Analysis of Microplastic Pollution in Global Freshwater Bodies Based on a Regression Model. Water 2020, 12, 1889. https://doi.org/10.3390/w12071889
Chen H, Qin Y, Huang H, Xu W. A Regional Difference Analysis of Microplastic Pollution in Global Freshwater Bodies Based on a Regression Model. Water. 2020; 12(7):1889. https://doi.org/10.3390/w12071889
Chicago/Turabian StyleChen, Hanwen, Yinghuan Qin, Hao Huang, and Weiyi Xu. 2020. "A Regional Difference Analysis of Microplastic Pollution in Global Freshwater Bodies Based on a Regression Model" Water 12, no. 7: 1889. https://doi.org/10.3390/w12071889
APA StyleChen, H., Qin, Y., Huang, H., & Xu, W. (2020). A Regional Difference Analysis of Microplastic Pollution in Global Freshwater Bodies Based on a Regression Model. Water, 12(7), 1889. https://doi.org/10.3390/w12071889