Abstract
With the increase of drought and flood frequency, the drought-flood abrupt alternation events occur frequently. Due to the coexistence and rapid transformation of drought and flood, the drought-flood abrupt alternation events is often more harmful and threatening than the single drought or flood event to the security of the society. This study is to synthetically evaluate the evolving characteristics of drought, flood, and drought-flood abrupt alternation events under climate change, which are identified by using the Standard Weighted Average Precipitation (SWAP) index. The variability of drought, flood, and drought-flood abrupt alternation events in the future is predicted by using GCM projections, whose outputs are corrected by using a daily bias correction method. The results show that: (1) The SWAP index has the capability to judge reliably the onset, duration, and intensity over the study areas, and can be used to monitor drought-flood abrupt alternation events efficiently; (2) In the reference period (1961–2005), for the drought-flood abrupt alternation events, the frequency has a downward trend in the upper reaches and an upward trend in the lower reaches, and the spatial distribution of intensity shows a contrary law to that of frequency; (3) The frequency and intensity of drought-flood abrupt alternation events show an upward trend in the whole basin in the future period (2021–2095), under the RCP4.5 and RCP8.5 scenarios. These results indicate that drought-flood abrupt alternation events can be more frequent, and the intensity will significantly increase in the 21st century, which may likely pose a serious impact on this basin.
1. Introduction
Drought and floods are global problems and the world’s most damaging and pressing natural hazards [1,2], causing billions of dollars in global damage and collectively affecting more people than any other climate-related disaster. Meteorological drought and flood are a reflection of extreme rainfall events, the characteristics of which are difficult to objectively quantify in terms of frequency, intensity, duration, and spatial extent. Many evaluation methods for meteorological drought and flood have their limitations, and how to find good applicability from many methods is often affected by factors such as river basin meteorological factors, climate change, and human activities. For this reason, an effective drought assessment method is important for drought analysis and monitoring.
Recently, some studies indicated that extreme drought and flood would further increase in the 21st century because of global climate change and the intensification of anthropogenic activities [3,4,5]. Vivek et al. [6] pointed out that the areal extent of drought which was expected to increase further for most parts of India under future climate change. Dai [7] suggested that severe and widespread agricultural drought would continue for the next several decades because of global climate change. Leng et al. [8] showed that the degree, duration, and frequency of the drought in Southern China could increase in the future. Bessah et al. [1] claimed that the drought frequency had an upward trend in humid regions, and the flood frequency varied between regions. Zhao et al. [9] showed the frequency changes for the 100-year meteorological drought could be quite severe, with up to a 20-fold increase observed over some watersheds. Affected by global climate change and human activities, in recent years, with the increase of the frequency of regional drought and flood events and extreme precipitation [10], the possibility of short-term drought-flood abrupt alternation events is more frequent. In the region where drought occurs, the occurrence of extreme precipitation may make the region change from drought to flood rapidly. This phenomenon of changing from drought to flood in a short time is called “drought-flood abrupt alternation events”, which often causes more damage than the single drought or flood event [11]. In view of the hazard severity caused by the drought-flood abrupt alternation events, many scholars carried out research on the anomalies of drought and flood events [12,13,14]. For example, Zong et al. [15] employed the extended empirical orthogonal function to analyze the drought-flood abrupt alternation events in the Yangtze River Basin in 2011. Wu et al. [16] defined the drought-flood coexistence index according to the summer precipitation and rainless days and quantitatively screened the seasonal scale drought-flood abrupt alternation events. The main concerns in these studies were the seasonal and inter-annual drought and flood anomalies, while very few studies paid sufficient attention to the intra-seasonal evolution. Most of the events are screened on the monthly or seasonal scale, where it is easy to cause drought and flood neutralization and result in the inaccurate screening of drought-flood abrupt alternation events, while there is fewer research analyzing drought-flood abrupt alternation events on the daily scale [17]. Besides, most of the studies focus on the historical drought-flood abrupt alternation events, but there is a lack of research on the prediction of the future drought-flood abrupt alternation events. Therefore, it is of great practical significance to study the evolution of extreme drought and flood in the context of climate change and understand the possible changes of intra-seasonal drought and flood characteristics for climate change adaptation and mitigation planning.
To detect meteorological drought as well as flood, various indexes are proposed, such as the Palmer Drought Index (PDSI) [18] and the Standardized Precipitation Index (SPI) [19], which have been widely used all over the world [20,21]. PDSI, which is based on the anomalies of the supply and demand components in the water balance equation, has a complex structure with an exceptionally long memory [22,23]. SPI is spatially consistent and uses precipitation data as a single factor, which has simple and straightforward advantages [24,25]. While PDSI and SPI cannot be applied to diagnose drought processes with a shorter temporal scale (daily or weekly). To capture the characteristics of the drought at daily or weekly scale, the Standard Weighted Average Precipitation (SWAP) [26] was proposed to use precipitation as a single factor and considers the demands of the water balance, which could be used to identify detailed information concerning drought onset, duration, end time, and monitor drought as well as flood at daily, weekly, monthly, and any longer scales. Lu [27] showed that SWAP could reproduce the seasonal shift of the 2011 drought across the country well and monitor the day-to-day variation of the spring drought around the Yangtze River basin. Furthermore, Lu [28] applied SWAP to investigate the regional atmospheric anomalies responsible for the 2009–2010 severe drought in China. By summarizing previous research on the drought index, it can be found that most indexes are designed to monitor the drought and flood situations at long temporal scales (e.g., monthly, seasonally, or yearly), while there are seldom indexes to be applied at short temporal scales (e.g., daily or weekly), while it is very important to monitor the dry and wet conditions on a short time scale, which can help improve the timely capture of drought and flood conditions.
The main purpose of this paper is to analyze the evolving characteristics of drought, flood, and drought-flood abrupt alternation events at daily scale by using a daily index under climate change. To achieve the goal, this study discusses the applicability of the SWAP index, quantifies the uncertainty of GCMs-simulated daily precipitation, and understands the performance skills of global circulation models (GCMs). Besides, the spatio-temporal variations of drought, flood, drought-flood abrupt alternation events are analyzed in the historical period and the future by incorporating bias-corrected GCM projections. The outline of this paper is as follows. After describing the study area and dataset in Section 2, the methodology is in Section 3, the results and discussions are analyzed in Section 4, and finally, the main conclusions are given in Section 5.
2. Study Area and Data
2.1. Study Area: The Hanjiang Basin
The Hanjiang Basin is the biggest tributary of the Yangtze River (Figure 1) and originates from the Southern Qinling Mountain, which is located between 106°15′~114°20′ E and 30°10′~34°20′ N, with a mainstream length of 1577 km and a drainage area of 159,000 km2. Its annual mean temperature is about 15 °C~17 °C, its annual precipitation is 873 mm [29], and its annual mean discharge is 1150 m3/s [30].
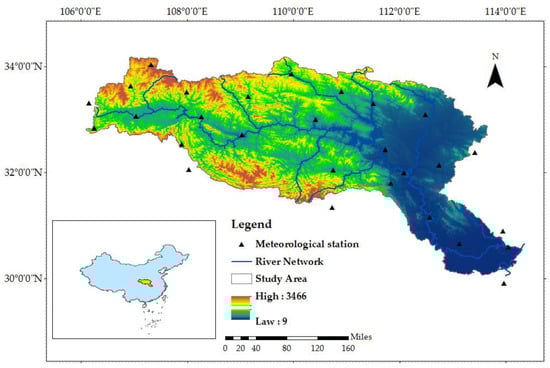
Figure 1.
The location of the meteorological stations and the digital elevation model (DEM) in the Hanjiang Basin.
The Hanjiang Basin belongs to the subtropical monsoon region and is prone to drought and flood, as well as the coexistence of drought and flood, so the impact of hazards in the region may multiply, and the social and economic losses may increase. Furthermore, 75% of its total precipitation occurs during the period from June to October, and during this period, the prolonged rainfall in autumn and the rainstorms in early summer often causes major floods [31]. Thus, it is meaningful to evaluate the spatio-temporal evolution characteristics of the drought, flood, drought-flood abrupt alternation events in this basin.
2.2. Data
This study employs both observed and GCMs-simulated daily precipitation data in the Hanjiang Basin. Observed meteorological data from 28 weather stations in the basin during the period of 1961–2017 are obtained from the China Meteorological Data Sharing Service System [32]. The precipitation data of the Coupled Model Intercomparison Project Phase 5 (CMIP5) database is used to predict the impact of climate change on the drought and flood in the reference period of 1961–2005 and the future period of 2021–2095. To adequately represent the uncertainty of the climate models, 10 GCMs have been chosen with sufficient data in this study (Table 1). Furthermore, in order to compare different Representative Concentration Pathways (RCPs), the medium-concentration (RCP4.5) and high-concentration carbon emission scenarios (RCP8.5) are selected to project the future change [33]. As compared to the single model, the multi-model ensembles increase the overall skill, reliability, and consistency of the model performance [34], while characterizing model uncertainty from the ensemble spread [35]. Hence, apart from the individual model performance, the performance is also evaluated in terms of multi-model ensemble members (e.g., the multi-model mean and standard deviation).

Table 1.
General information on CMIP5 models considered in the study.
3. Methodology
To investigate the evolution characteristics of drought and flood events under climate change, ten GCMs under RCP4.5 and 8.5 are first established. The climate scenarios are downscaled using the reference and future periods, which are shown in Figure 2.
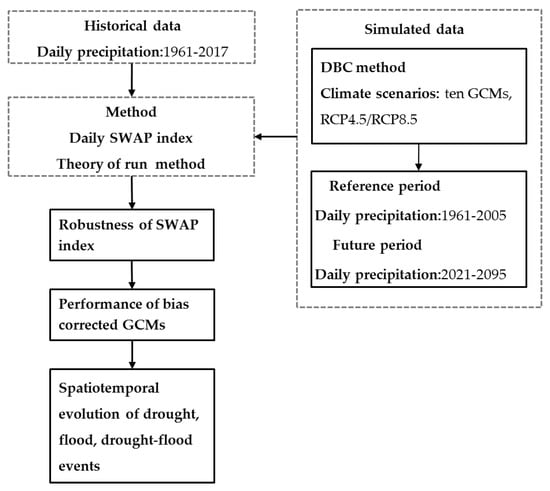
Figure 2.
Overview of the described methodology.
3.1. Standard Weighted Average Precipitation Index (SWAP)
In 2009, considering the accumulated rainfall, Lu proposed the weighted average of precipitation (WAP) index [26] and the SWAP index [27]. The SWAP index is obtained from the WAP index and applies the Gamma function for standardization. The theory of the WAP index is based on the following simple physical model, and the intensity of droughts and floods is mainly affected by precipitation. The principle of the physical model is that the flood extent is forced by precipitation, but dissipated by the demands of the water balance:
where f is the drought or flood intensity, which is positively correlated with rainfall P(t), while factors such as the runoff, evapotranspiration, and percolation are assumed to be −bf(t) (b > 0), which indicates the intensity of the attenuation.
The weighted average of precipitation (WAP) is defined as [26]:
The WAP in (2) can further be written as [26]:
where wn = (1 − a) × an (a value of 0.9, for the parameter a, is suggested for the general use of the WAP index), and N is calculated to be 44.
The WAP is calculated for each day. For a specific day, WAP is a weighted average of the precipitation of the day (P0) and all the earlier days (Pn). The weight decays with the number of the past days. Because of the decay effect, the N, the number of the earlier days whose precipitation data are needed to calculate the daily WAP, can be limited, depending on the value of the parameter a and the precision that is necessary.
The WAP values are arranged for the corresponding time series. According to the WAP value of the same day for several years, the SWAP value is obtained by constructing and standardizing the Gamma distribution function. The numerical equation is as follows:
where β > 0 and γ > 0. The SWAP index is a meteorological drought and flood index, with a single factor of precipitation. The temporal scales of the SWAP are flexible and can analyze the dry and wet conditions of a region at daily, weekly, monthly, and any longer scales. Table 2 gives the nine drought and flood grades, according to the SWAP values.
Table 2.
Drought and flood classification standard [36].
3.2. Daily Bias Correction
The global climate model outputs cannot match the scales of the response model inputs, and the spatial resolution (100~300 km) is too coarse to reveal the local characteristics of climatic elements in small-scale regions [37]. In this case, a downscaling technique must be used, which includes dynamical downscaling, statistical downscaling, and statistical-dynamical downscaling.
This study uses one of the statistical downscaling methods, the Daily Bias Correction (DBC) method, based on quantile correction [38]. The DBC method is an advanced bias correction method, which combines the Daily translation method (DT) [39] and Local intensity scaling method (LOCI) [40] to take into account the different changes in the frequency distributions of precipitation, then corrects the frequency of the precipitation occurrence. Additionally, this method assumes that climate model biases are stationary in the reference and future periods [41].
It is worth mentioning that bias correction can fulfill the first aim for present climate conditions—simply by calibration to high-resolution observations. The statistical model is calibrated on a subset of data spanning the calibration period and then used to predict the remaining data from the validation period. Pairwise correspondence between predictors and predictands is generally missing in a climate modeling context, an evaluation can only compare modeled and observed long-term distributions. Therefore, most evaluation studies of bias correction evaluate marginal aspects only typically calibrated to match observations.
3.3. Event Identification and Characteristics Analysis
3.3.1. The Process of Event Identification
Drought is usually considered to be a shortage of expected precipitation over a period of time. A flood is caused by excessive long-term precipitation. A drought-flood abrupt alternation events refers to the occurrence of drought, followed by a flood, in a period of time, which reflects the coexistence of extreme events of drought and flood in a short period of time. The drought and flood properties are derived using threshold methods, which are based on the statistical run theory for analyzing sequential time series. The theory of run method is originally proposed by Herbst [42], and it is an available method for investigating time series. Yevjevich [43] identified and described droughts using the theory of run method. Zhang et al. [44] employed the theory of run method and the comprehensive drought index to analyze droughts. He et al. [45] used a multi-threshold run theory approach to evaluate the monthly percentage of precipitation anomaly index (Pa), analyzed meteorological droughts in China. Overall, this method has been widely used in practice to evaluate the evolution of drought and flood. Therefore, this research uses the theory of run method and the SWAP index to analyze the characteristics of drought and flood events.
Using the theory of run method to identify drought events, given an interception level k (k is drought level corresponding to SWAP), a discrete series Xt (t = 1, 2, …, n) with time variation is intercepted. When the random variable is continuously more than the intercept level in one or more times, there is a positive run, otherwise which is a negative run. Taking drought events as an example, the length of the negative run is drought duration, and drought intensity is the area enclosed the drought duration and the interception level. The following guidelines are used to identify the process of drought and flood events:
- (1)
- Drought initiation: the interception level of the drought occurrence is −1 (lower limit of a slight drought). When the SWAP value is less than −1 for 10 consecutive days, from a special day, it is defined as a drought event.
- (2)
- Drought end: the interception level of the drought end is 0.5 (upper limit of a near-normal drought). When the SWAP value is more than 0.5 for 7 consecutive days, it is defined as the end of this drought event.
- (3)
- Drought duration: the period of time between the start date and the end date of the drought event.
Similarly, the beginning and ending interception levels of flood events are 1 (upper limit of a slight flood) and −0.5 (lower limit of a near-normal flood), respectively. The flooding process is similar to the drought process and is not to be described again.
When the SWAP index is used to identify drought and flood events, the drought-flood abrupt alternation events can be diagnosed according to time intervals. If there successively occurs a drought event and a flood event, and the interval between the end of the drought and the start of the flood is less than five days, it is defined as a meteorological drought-flood abrupt alternation event. Moreover, the beginning time of the drought-flood abrupt alternation events is the occurrence time of this drought event, and the end time of the drought-flood abrupt alternation events is the end time of this flood event.
3.3.2. Data Analysis
The robustness of the SWAP index is first evaluated in terms of the spatio-temporal evolution of drought, flood, and drought-flood abrupt alternation events over the historical period (1961–2017) at different daily, monthly, and yearly scales. The performance of the DBC method is verified over the reference period (1961–2005) using six climate statistics as criteria, including the average of monthly precipitation, the 25th, 50th, 75th percentiles, and the minimum and maximum relative error.
For the evolving characteristics of drought, flood, and drought-flood abrupt alternation events, the frequency, and intensity of the spatiotemporal variations in the reference period (1961–2005) and future period (2021–2095) are estimated using two variables (the mean and standard deviation). In addition, the frequency is calculated (Equation (5)), while the intensity is calculated for drought-flood abrupt alternation events (Equation (6)):
Event frequency T:
where n is the number of events (droughts, floods, and drought-flood abrupt alternation events) in the time period, and N is the time period (units: years).
Event intensity K:
where is the cumulative value of SWAP after the sharp turning point, is the cumulative value of SWAP before the sharp turning point and D is the time interval between the occurrence and the end of drought-flood abrupt alternation events (the sharp turning point is a special day when the drought turns into a flood). Table 3 provides a classification of the intensity of drought-flood abrupt alternation events.
Table 3.
Classification of drought-flood intensity.
4. Results and Discussions
4.1. Robustness of the SWAP Index
To thoroughly validate the SWAP index, the robustness of the SWAP index is evaluated at different timescales (e.g., yearly, monthly, and daily) to show if it is capable of capturing current drought and flood conditions in the historical period (1961–2017). Figure 3 represents the inter-annual variations of the observed annual precipitation and yearly SWAP index from 1961 to 2017. It can be seen from Figure 3 that the M-K statistical test of precipitation and SWAP shows that Z value (α = 0.05) is 0.45 and −0.03 respectively, showing insignificant upward and downward trends. Liu et al. [46] also pointed out that Standardized Precipitation Indexes in the Hanjiang Basin had a downward trend. At the same time, the annual precipitation in the 1990s is lower than the annual average precipitation for some consecutive years; and in China Meteorological Disaster Canon [47], it is proved that drought events occur frequently in this period. On the other hand, the plot shows that the years of extreme drought and flood events are: 1966 (SWAP: −1.57, severe drought), 1997 (SWAP: −1.36, moderate drought), 2001 (SWAP: −1.14, moderate drought), 1983 (SWAP: 1.77, severe flood), and 1964 (SWAP: 1.47, moderate flood). In China Meteorological Disaster Canon [47], it indicated that the most serious drought years were: 1966 (extreme drought), 1997 (severe drought), 2001 (severe drought), and 1995 (severe drought), and the wettest years were 1983 and 1964. These results are consistent with this study, which demonstrates the reliability of SWAP as a new index in diagnosing drought and flood events.
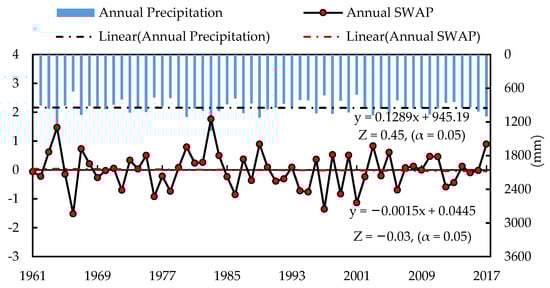
Figure 3.
Interannual variations of the observed annual precipitation and annual SWAP indices in the Hanjiang Basin from 1961 to 2017.
According to previous research, severe drought sweeps the whole Yangtze River basin, which suffered its worst drought in 50 years during spring [27]. As a tributary, the Hanjiang Basin has also been seriously impacted. Therefore, the spatial variation trends of the monthly SWAP index in 2011 are discussed (Figure 4), which is interpolated by using the Inverse Distance Weighting (IDW) method [48].
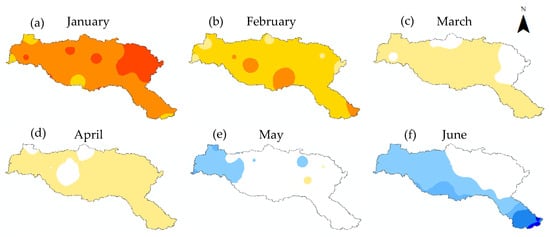
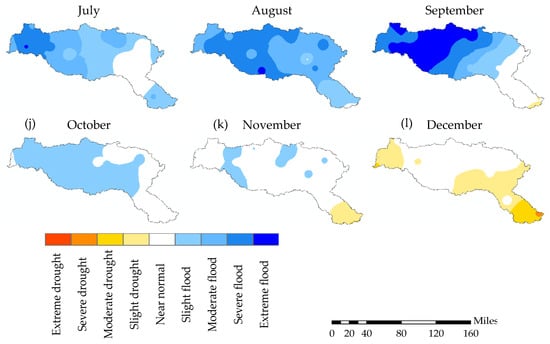
Figure 4.
Spatio-temporal evolution of monthly SWAP for all 12 months of 2011. (a)—(l) represents the monthly SWAP in different months, respectively.
From Figure 4, it can be seen that a severe drought is maintained in January. The drought moves from southwards to the middle and lower reaches of the basin in February. In March and April, the drought in the basin continued, and a slight drought occurred in most areas. Then, the drought around the basin starts to disappear, and a slight flood occurs in the upper reaches in May. In June and July, the drought disappears throughout the basin because of the heavy summer rains, and the flood moves from southwards to the lower reaches. In August, the flood covers the entire basin, which becomes severe over the upper and middle reaches. A strong flood continues in the region in September. The flood starts to disappear in the lower reaches in October, and it almost completely disappears in November and December.
Comparing the geographical regions and intensities of the drought and flood events, the spatial maps show obvious variation. The monthly shift of the major drought and flood areas across the basin, revealed in Figure 4, is fairly consistent with the report [47]. This proves that SWAP can provide details on drought and flood. For instance, SWAP can monitor information concerning when a drought emerges over the region, how long it stays there, and when the drought disappears over the basin. It has the capacity to reliably analyze the onset, duration, and end time of drought over each specific area.
Figure 5. shows the temporal evolution of a typical drought-flood abrupt alternation events using the daily SWAP. From Figure 5, it can be seen that the change of daily SWAP is closely related to rainfall. Moreover, the minimum and maximum values of SWAP are close to −3 and 3, respectively, which are corresponding to extreme drought and flood events. The time of the abrupt alternation from drought to flood is short and the intensity is high. The change process of SWAP reflects the information of onset, duration, end, and intensity, as well as the time node, from drought to flood. The results indicate that the daily SWAP can accurately diagnose drought-flood abrupt alternation events.
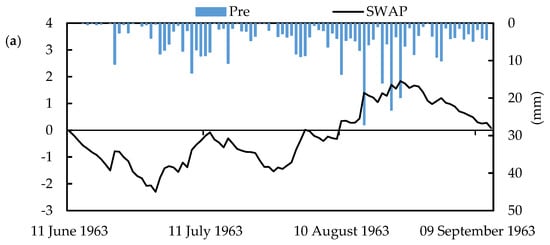
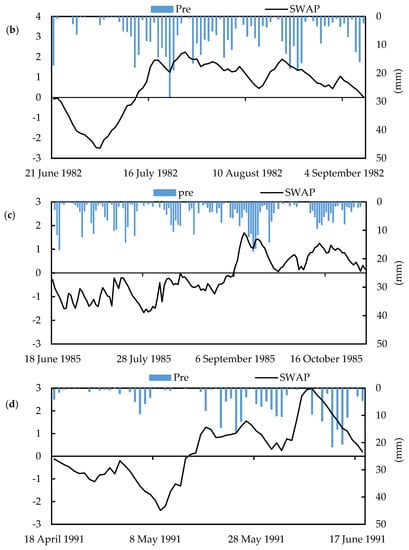
Figure 5.
Temporal evolution of typical drought-flood events using the daily SWAP in the Hanjiang Basin. (a), (b), (c), (d) represents the typical drought-flood events in different years, respectively.
With the impact of climate change and human activities, the corresponding large spatial change and interannual variability of precision variables significantly from year to year. The information of onset, duration, and intensity of drought and flood is valuable for the decision-maker and management department and requires a reliable tool to monitor and detect faults at a daily rate to a weekly scale, while PDSI and SPI cannot be applied to effectively diagnose drought processes with a shorter temporal scale, such as a daily or weekly scale. The PDSI, though designed in a complex form to include more related factors, is found to have limitations [22,23] and cannot provide timely identification of drought onset [49]. The SPI only uses the statistics of simple average, and there is no physics involved in the construction of the index. SPI is not appropriate for monitoring droughts at short temporal scales, such as daily to weekly. It always needs a timescale and can only tell the averaged drought situation throughout the longer temporal scale. While the SWAP considers the decay effect of the earlier precipitation, the SWAP can distinguish the daily flood and drought situation. With the output of the daily SWAP, the flood and drought situation of a week, month, and any longer period can be evaluated through simply averaging the SWAP over the periods. Therefore, the merit of the SWAP over the SPI and PDSI is that it can monitor drought and flood events at different timescales, from daily to weekly, monthly, and other longer scales. In addition, the start, duration, breaks, and strength of flood and drought can be determined. For example, the daily SWAP is used to analyze the drought-flood abrupt alternation events in this study, the information of onset, duration, end, and intensity, as well as the time node, can be effectively captured. Furthermore, the monthly SWAP is also applied to analyze the drought and flood situation of the basin in 2011, which can monitor the starting time, the duration, and the ending time of a drought event over the basin. Lu [26] also showed that the SWAP could well reproduce the seasonal shift of the 2011 drought across the country, and monitor the day-to-day variation of the spring drought around the Yangtze River basin.
4.2. Performance of GCMs in Simulating Regional Precipitation
The performance of the DBC method is numerically assessed by comparing the ten simulated GCMs’ and shown in Figure 6. From the figures, 70% of the simulated GCM outputs overestimate the monthly precipitation, but CSIRO-MK3-6-0, CanESM2, and MRI-CGCM3 underestimate the values from May to October. Furthermore, the biases in different months are different. After bias correction, the mean precipitation of the GCMs in each month is close to the observation, especially, the correction effect of GFDL-ESM2G and CSIRO-MK3-6-0 are not acceptable from June to August, as there is obvious underestimate between the corrected and the measured monthly mean precipitation. Figure 7 shows the relative error of the simulated and bias-corrected monthly mean precipitation for ten GCMs. In Figure 7, before correction, 80% of the GCMs’ relative error is higher than 20% (absolute value), and the fluctuation of the relative error for different GCMs is apparent. In particular, the relative error of MPI-ESM-LR, GFDL-ESM2G, CNRM-CM5, and CanESM2 is more obvious. However, after correction, the biases are considerably reduced to less than 5% (absolute value), and the bias is reduced obviously. The performance of Nor-ESM1-M, MPI-ESM-LR, CCSM4, BNU-ESM, and BCC-CSM1-1 are perfect, but the effect of MRI-CGCM3 performs comparatively poor. In general, the capacity of GCMs to describe regional climate patterns is improved after being corrected by DBC, and the corrected data can be used for subsequent research. The above results indicate that the DBC method has a good performance in relation to future climate change scenarios in extreme event studies.
Figure 6.
Observed, simulated (a); and bias-corrected (b) monthly mean precipitation for observation and individual GCMs during the reference period (1961–2005).
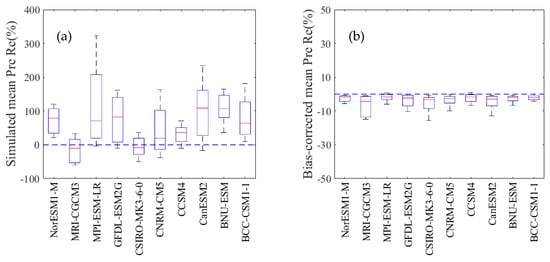
Figure 7.
Box plots of the relative error of simulated (a) and bias-corrected (b) monthly precipitation for individual GCMs during the reference period (1961–2005).
4.3. Spatio-Temporal Evolution of Drought and Flood Events
4.3.1. The Evolution of Drought and Flood Events in Different Periods
To analyze the evolution of drought, flood, and drought-flood abrupt alternation events during the historical and future periods, the daily precipitation is obtained from 28 meteorological stations. The daily SWAP index and the theory of run method are used to identify and evaluate the events.
Figure 8 provides the box plots of the drought and flood frequency in the reference period and future period under the RCP4.5 and RCP8.5 emission scenarios. The median frequency of the observed drought and flood are 0.33 and 0.31, respectively. In the reference period, the results of Nor-ESM1-M, MPI-ESM-LR, CSIRO-MK3-6-0, CCSM4, BNU-ESM, and BCC-CSM1-1 are most reliable. The individual GCMs overestimate the drought frequency for the observational dataset. Additionally, the extremums are adequately simulated by most GCMs (except MRI-CGCM3, and CanESM2), as indicated by the relatively short length of the whiskers. This suggests that GCMs may generate more frequent droughts, but fail to capture the intensity of droughts. Furthermore, all GCMs underestimate the flood frequency. In particular, the performance of MRI-CGCM3 and CanESM2 is unacceptable. The lack of agreement among different models in simulating drought and flood events is due to the different parameterizations involved in the modeling framework, and the persistence in the hydrological system is not adequately addressed by the models [50,51].
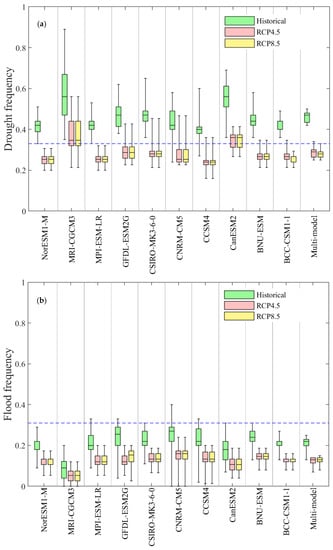
Figure 8.
Box plots of the frequency of drought (a) and flood (b) for the individual GCMs and the multi-model ensembles in the reference period (1961–2005) and future period under RCP4.5 and RCP8.5 scenarios (2021–2095). The blue dot line is the median frequency of the observed droughts and floods in the reference period (1961–2005).
In the future period, the chances of drought and flood among different GCMS under the RCP4.5 and RCP8.5 scenarios are similar. The drought frequency medians of multi-model under the RCP4.5 and RCP8.5 scenarios are 0.39 and 0.28, and the flood frequency medians under both scenarios are 0.13. This shows that the drought frequency is higher under RCP4.5, while the flood frequency under RCP4.5 and RCP8.5 is the same. Compared with the observation, the drought shows an upward trend, while the flood shows a downward trend. Similar results were also reported in IPCC [52] that droughts with a higher intensity and longer duration over larger areas would occur in the future. Garcia et al. [53] reported that the Jucar basin showed a general increase in the intensity and magnitude of both meteorological and hydrological droughts under climate change scenarios, due to the combined effects of rainfall reduction and evapotranspiration increase. Chen et al. [54] reported that with continued warming in the future, the probability of warm years was projected to greatly increase, and the occurrence probability of hot drought events would increase to nearly 100% by the year 2050, even though the annual precipitation was projected to increase across China in the future. These results indicate that drought may increase due to climate change, and the threat of drought may be obvious in the future, thus more attention should be paid.
4.3.2. Spatial Analysis of Drought and Flood Events
Figure 9 presents the spatial distribution of the frequency and standard deviation of the observed and multi-model ensembles of the mean drought and flood events in the reference period. The frequency of drought is between 0.24 and 0.44; the highest value appears in the upstream, and the lowest value appears in the downstream. The flood frequency ranges from 0.24 to 0.38; the lowest is in the upstream reaches and the highest is in the middle and lower reaches. Generally, the drought frequency has a downward trend from the northwest (upstream) to the southeast (downstream). The flood frequency shows a downward in the northwest (upstream) and an upward trend in the southeast (downstream).
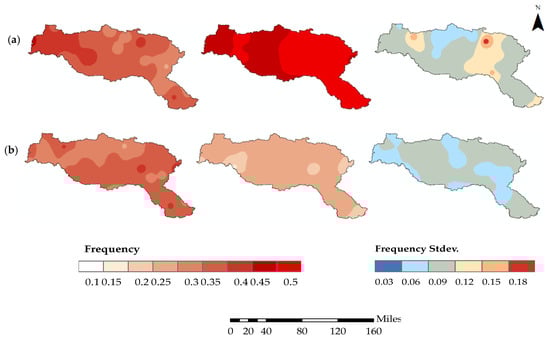
Figure 9.
Spatial distribution of the frequency of the observed (left column), the multi-model ensembles (middle column), and standard deviation (right column) for drought (a) and flood (b) in the reference period (1961–2005).
Compared with the observed frequency, it can be found that GCMs overestimate the spatial distribution of the drought frequency, and the maximum standard deviation occurs in the middle reaches. Furthermore, GCMs underestimate the spatial distribution of the flood frequency, but there is no obvious diversity in the spatial distribution of the standard deviation. The difference between the GCMs and observation primarily arises due to different initial conditions, structural dissimilarity, parameterization schemes, and the limited skills of the GCMs to simulate large-scale atmospheric patterns. The spatial distribution of the multi-model ensembles of the mean frequency in the future period is shown in Figure 10. For RCP4.5, the drought frequency in the northeast of middle reaches is maximum (0.4) and is 0.35 in most other regions; The flood frequency in the whole basin is close to 0.15. For RCP8.5, the drought and flood frequency of the whole basin are 0.35 and 0.15, respectively. Furthermore, there are obvious differences in the spatial distribution of event frequency between RCP4.5 and RCP8.5. The drought frequency of RCP4.5 has a wider area, while the flood frequency of RCP8.5 is closed to 0.2 in the upper reaches. Generally, compared with the reference period, the drought frequency of the whole basin shows an upward trend, and the flood frequency has a downward trend in the future period under the RCP4.5 and RCP8.5 scenarios. This proves that drought events will be more frequent in the 21st century.
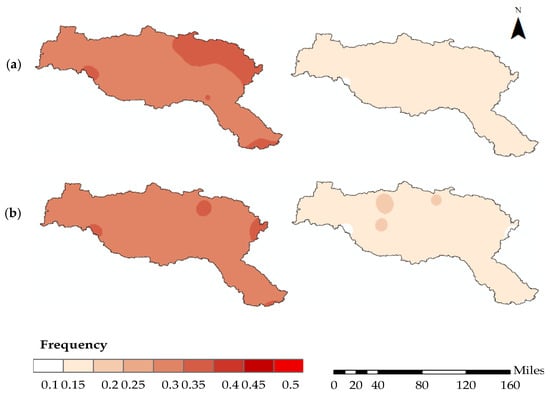
Figure 10.
Spatial distribution of the frequency of the multi-model ensembles for the drought (left column) and flood (right column) under scenarios RCP 4.5 (a) and RCP 8.5 (b) in the future period (2021–2095).
4.4. Spatio-Temporal Evolution of Drought-flood Abrupt Alternation Events
4.4.1. The Evolution of Drought-flood Abrupt Alternation Events in Different Periods
To demonstrate the reproducibility of GCMs, Figure 11 compares the changes in the frequency and intensity of bias-corrected drought-flood abrupt alternation events using the daily SWAP index. The median of the observed frequency and intensity are 0.36 and 1.68, respectively. Compared with the observation, the frequency medians of 80% of GCMs are close to the observed frequency, and 60% of GCMs are close to the observed intensity. In particular, the frequency and intensity of GFDL-ESM2G, CSIRO-MK3-6-0, CNRM-CM5, and BNU-ESM have high reliability; but the performance of MRI-CGCM3 and CanESM2 are poor responsibility. Overall, the corrected GCMs can reasonably assess the changes in the drought-flood abrupt alternation events.
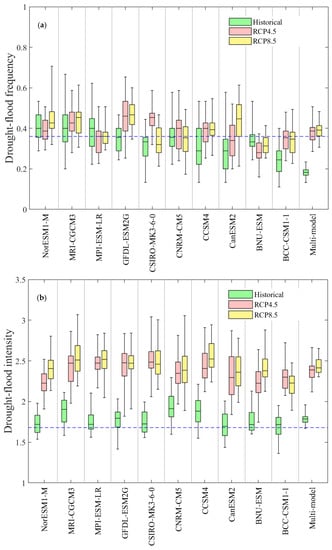
Figure 11.
Box plots of the frequency (a) and intensity (b) for the individual GCMs and multi-model ensembles in the reference period (1961–2005) and future period under RCP4.5 and RCP8.5 scenarios (2021–2095). The blue dot line is the median frequency and intensity of the observed drought-flood events in the reference period.
Moreover, under the RCP4.5 and RCP8.5 scenarios, the frequency median of drought-flood abrupt alternation events is from 0.24 to 0.52; the intensity median is from 2.12 to 2.82, which is moderate intensity. Since the median fluctuation reflects the diversity of GCMs, there is no obvious difference in intensity among the GCMs, but the frequency is quite different. Compared among NorESM1-M, CanESM2, BNU-ESM, the frequency and intensity of RCP8.5 are higher than those of RCP4.5; the results of RCP4.5 and RCP8.5 are consistent for the multi-models, and the whiskers of RCP8.5 are relatively short. It is worth mentioning that there is a temporal variation in the uncertainty of the GCMs, which is caused by the different hypotheses associated with climate scenarios. Moreover, the uncertainty of climate change impacts may vary among watersheds due to the different hydro-climatology characteristics and combinations between climate simulations and regional conditions [55,56].
Table 4 presents the frequency and intensity of the drought-flood abrupt alternation events. In Table 4, compared with the observation, 30% of GCMs underestimate the frequency and overestimate the intensity in the reference period. However, the observed mean of frequency and intensity are 0.36 and 1.70; and the frequency and intensity of the multi-model mean are 0.34 and 1.78, respectively, which are roughly close to the observed values. Furthermore, in RCP4.5, the mean frequency and intensity of the multi-models are 0.38 and 2.38; while in RCP8.5, they are 0.39 and 2.44, respectively. Moreover, the frequency and intensity in the future period, under the RCP4.5 and RCP8.5 scenarios both show an upward trend. This proves that drought-flood abrupt alternation events may have a higher frequency, and the intensity will strengthen in the future.
Table 4.
Frequency, intensity, and statistics (multi-model mean, standard deviation) of drought-flood events in the reference period (1961–2005) and future period under RCP4.5 and RCP8.5 scenarios (2021–2095).
4.4.2. Spatial Analysis of the Drought-flood Abrupt Alternation Events
Figure 12 presents the spatial distribution of the observed and the statistics of the multi-model ensembles for the drought-flood abrupt alternation events in the reference period. The frequency of drought-flood abrupt alternation events in the middle reaches is highest (0.45). In most areas, they have a slight intensity, and only in the northwest of the basin do they reach a moderate intensity. Generally, the frequency has a downward in the upstream and an upward trend in the downstream. The intensity shows an upward in the upper reaches and a downward trend in the lower reaches. Moreover, it can be found that there are some differences in frequency and intensity between multi-models and the observation in spatial distribution, which are mainly reflected by the standard deviation. The standard deviation of the frequency is between 0.06 and 0.15; the maximum values are mainly distributed in the middle reaches and downstream; the standard deviation of the intensity is between 0.12 and 0.24, and the maximum is mainly distributed in the upstream and the northwest of middle reaches. The reason for this spatial difference may be that there is a spatial variation in the uncertainty of GCMs, and different regions in the Hanjiang Basin have geographically different.
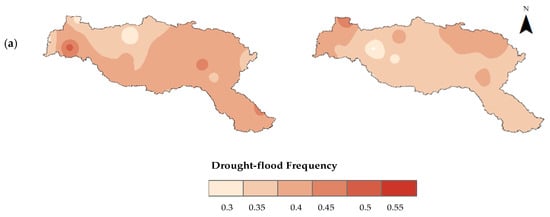
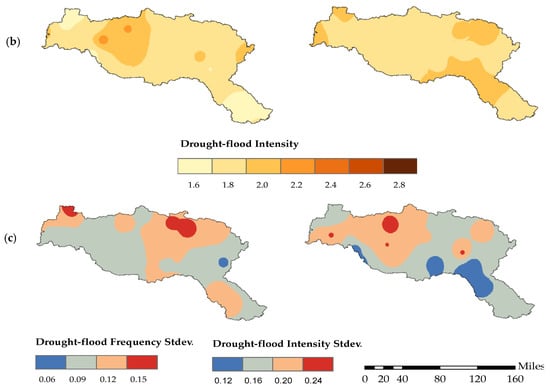
Figure 12.
Spatial distribution of the frequency (a); intensity (b); and standard deviation (c) of the observed (left column) and multi-model ensembles (right column) for drought-flood events in the reference period (1961–2005).
Figure 13 shows the spatial variation of the frequency and intensity of the multi-model ensembles for the drought-flood abrupt alternation events in the future period. For RCP4.5, the frequency is maximum in the upstream; in the lower reaches, it is minimum; and in most other regions, it is 0.4. The intensity of the whole basin is between 2.4 and 2.8, which is moderate intensity. For RCP8.5, the frequency of most regions is 0.4, and only in the northwest of the upstream close to 0.45. Moreover, compared with RCP4.5, the intensity is higher and covers a wider area, which is 2.6 in most regions and 2.4 in the upstream. In particular, there are some differences in the spatial distribution of frequency and intensity under two scenarios; for example, the frequency reaches 0.45 in some regions of the upper and middle reaches in RCP4.5; while the intensity of 2.8 in the middle and lower reaches covers wider areas in RCP8.5. Overall, compared with the reference period, the frequency and intensity of drought-flood abrupt alternation events in the future period, under the RCP4.5 and RCP8.5 scenarios, both show upward trends. This indicates that the drought-flood abrupt alternation events in the 21st century will be more frequent, and the intensity will be increased, which is likely to pose a major threat to the future development and requires significant preparation.
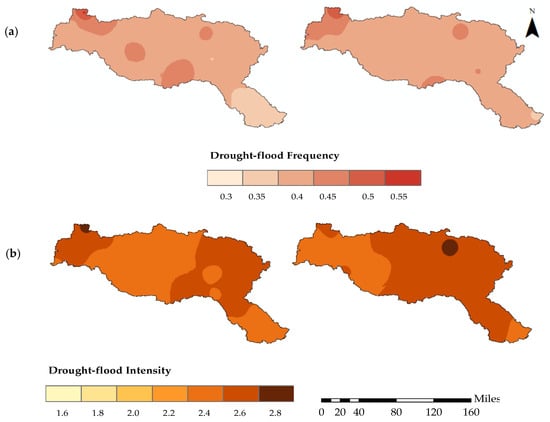
Figure 13.
Spatial distribution of the frequency (a) and intensity (b) of the RCP4.5 (left column) and RCP8.5 (right column) of the multi-model ensembles for drought-flood events in the future period (2021–2095).
5. Conclusions
This study investigates and estimates the spatio-temporal variation of meteorological drought, flood, and drought-flood abrupt alternation events under the climate change in the Hanjiang Basin. The frequency and intensity are analyzed to reveal the spatio-temporal variation of the meteorological events in the reference and future periods. The main conclusions are as follows:
- SWAP is an effective index for meteorological drought, flood, and drought-flood abrupt alternation events monitoring. It can reliably predict the information of onset, duration, and intensity, and can effectively capture the space–time structure of the events.
- The spatial distribution of the drought frequency has a downward trend in the whole basin, and the flood frequency has a downward trend in the upper reaches and an upward trend in the lower reaches in the reference period (1961–2005). Moreover, the drought frequency of the whole basin may increase in the future period (2021–2095), under the RCP4.5 and RCP8.5 scenarios, but the flood frequency may decrease.
- In the reference period, for the drought-flood abrupt alternation events, the frequency has a downward trend in the upper reaches and an upward trend in the lower reaches, and the spatial distribution of intensity is just opposite to that of frequency. In the future period, the frequency and intensity of the drought-flood abrupt alternation events both show an upward trend in the whole basin under the RCP4.5 and RCP8.5 scenarios.
- The results indicate that droughts will increase due to climate change. At the same time, drought-flood abrupt alternation events will have a higher frequency, and the intensity will be greatly increased in the 21st century, which is likely to pose a major threat to the security of water resources in the Hanjiang basin in the future.
There are some limitations to the approach used in the present study. As a possible improvement in future studies, more downscaling methods should be used to correct the uncertainty of climate models, including dynamic downscaling, statistical downscaling, and dynamic-statistical downscaling. More GCMs, emission scenarios, and drought indices may be used to gain greater insight into the characteristics of future drought, flood, and drought-flood abrupt alternation events in the study area.
Author Contributions
Conceptualization, H.C., Z.W. Data curation, Y.Z. and J.Y.; Formal analysis, Y.Z.; Funding acquisition, H.C.; Investigation, Y.Z., Z.W. and J.Y.; Methodology, Y.Z., H.C., and J.Y.; Supervision, H.C., Z.W.; Visualization, Y.Z.; Writing—original draft, Y.Z.; Writing—review & editing, H.C., Z.W. All authors have read and agreed to the published version of the manuscript.
Funding
The study was supported by the National Key Research and Development Program of China (NO.2017YFA0603702) and the National Natural Science Fund of China (NO.51539009).
Acknowledgments
The authors would like to thank the China Meteorological Data Sharing Service System (http://data.cma.cn) for providing the gauged precipitation and the contribution of the World Climate Research Program Working Group on Coupled Modelling for making available their respective climate model outputs.
Conflicts of Interest
The authors declare no conflicts of interest.
References
- Bessah, E.; Raji, A.O.; Taiwo, O.J.; Agodzo, S.K.; Ololade, O.O.; Strapasson, A. Hydrological responses to climate and land use changes: The paradox of regional and local climate effect in the Pra River Basin of Ghana. J. Hydrol. 2020, 27, 100654. [Google Scholar] [CrossRef]
- Sly, W.; Rodrigo, C.; Jhan, C.; Walter, C. Multi-decadal Hydrological Retrospective: Case study of Amazon floods and droughts. J. Hydrol. 2017, 549, 667–684. [Google Scholar]
- Madsen, H.; Lawrence, D.; Lang, M.; Martinkova, M.; Kjeldsen, T. Review of trend analysis and climate change projections of extreme precipitation and floods in Europe. J. Hydrol. 2014, 519, 3634–3650. [Google Scholar] [CrossRef]
- Stephane, H.; Marianne, F.; Edward, B. Disaster Risk, Climate Change, and Poverty: Assessing the Global Exposure of Poor People to Floods and Droughts. Environ. Dev. Econ. 2018, 23, 328–348. [Google Scholar]
- Yin, J.; Guo, S.L.; He, S. A copula-based analysis of projected climate changes to bivariate flood quantiles. J. Hydrol. 2018, 63, 23–42. [Google Scholar] [CrossRef]
- Vivek, G.; Manoj, K. Investigation of Multi-model Spatiotemporal Mesoscale Drought Projections over India under Climate Change Scenario. J. Hydrol. 2018, 567, 489–509. [Google Scholar]
- Dai, A. Increasing drought under global warming in observations and models. Nat. Clim. Chang. 2012, 3, 52–58. [Google Scholar] [CrossRef]
- Leng, G.; Tang, Q.; Rayburg, S. Climate change impacts on meteorological, agricultural and hydrological droughts in China. Glob. Planet. Chang. 2015, 126, 23–34. [Google Scholar] [CrossRef]
- Zhao, C.; Brissette, F.; Chen, J.; Martel, J. Frequency change of future extreme summer meteorological and hydrological droughts over North America. J. Hydrol. 2020, 584, 124316. [Google Scholar] [CrossRef]
- Rahmani, V.; Hutchinson, S.L.; Harrington, J.A.; Hutchinson, J. Analysis of frequency and magnitude of extreme rainfall events with potential impacts on flooding: A case study from the central United States. Int. J. Climatol. 2016, 36, 3578–3587. [Google Scholar] [CrossRef]
- Ma, Y.; Yang, Y.; Wang, C. How essential of the balance between large and small scale features to reproduce precipitation during a sudden sharp turn from drought to flood. Clim. Dyn. 2019, 52, 5013–5029. [Google Scholar] [CrossRef]
- Feng, G.; Yang, H.; Zhang, S.; Wang, K.; Sheng, B. A preliminary research on the reason of a sharp turn from drought to flood in the middle and lower reaches of the Yangtze River in late spring and early summer of 2011. Chin. J. Atmos. Sci. 2012, 36, 1009–1026. [Google Scholar]
- Tian, R.; Cao, C.; Peng, L.; Ma, G.; Bao, D.; Guo, J.; Peera, Y. The use of HJ-1A/B satellite data to detect changes in the size of wetlands in response in to a sudden turn from drought to flood in the middle and lower reaches of the Yangtze River system in China. Geomat. Nat. Hazards Risk 2016, 7, 287–307. [Google Scholar] [CrossRef]
- Shen, B.; Zhang, S.; Yang, H.; Wang, K.; Feng, G. Analysis of characteristics of a sharp turn from drought to flood in the middle and lower reaches of the Yangtze River in spring and summer in 2011. Acta Phys. Sin. 2012, 61, 6. [Google Scholar]
- Zong, H.F.; Cholaw, B.; Chen, L. A typical mode of seasonal circulation transition: A climatic view of the abrupt transition from drought to flood over the middle and lower reaches of the Yangtze River Valley in the late spring and early summer of 2011. Atmos. Ocean. Sci. Lett. 2012, 5, 349–354. [Google Scholar]
- Wu, Z.W.; Li, J.; He, J.; Jiang, Z. Occurrence of droughts and floods during the normal summer monsoons in the mid and lower reaches of the Yangtze River. Geophys. Res. Lett. 2006, 33, L05813. [Google Scholar] [CrossRef]
- Shan, L.J.; Zhang, L.; Song, J.; Zhang, Y.; She, D.; Xia, J. Characteristics of dry-wet abrupt alternation events in the middle and lower reaches of the Yangtze River Basin and the relationship with ENSO. J. Geogr. Sci. 2018, 28, 1039–1058. [Google Scholar] [CrossRef]
- Palmer, W.C. Meteorological Drought, Technique Report no. 45; U.S. Department of Commerce Weather Bureau Research: Washington, DC, USA, 1965. [Google Scholar]
- Mckee, T.B.; Doesken, N.J.; Kleist, J. The relationship of drought frequency and duration to time scales. In Proceedings of the 8th Conference on Applied Climatology, Anaheim, CA, USA, 17–22 January 1993; pp. 179–184. [Google Scholar]
- Wang, M.; Gu, Q.; Jia, X.; Ge, J. An assessment of the impact of Pacific Decadal Oscillation on autumn droughts in North China based on the Palmer drought severity index. Int. J. Climatol. 2019, 39, 5338–5350. [Google Scholar] [CrossRef]
- Wilson, K.; Zhang, J.; Tertsea, I.; Fanan, U.; Obas, J.; Jean, N.; Yao, F. Spatio-temporal analysis of drought and return periods over the East African region using Standardized Precipitation Index from 1920 to 2016. Agric. Water Manag. 2020, 237, 106195. [Google Scholar]
- Smith, D.I.; Hutchinson, M.F.; McArthur, R.J. Australian climate and agricultural drought: Payments and policy. Drought Netw. News 1993, 5, 11–12. [Google Scholar]
- Guttman, N.B. Comparing the Palmer Drought Index and the Standardized Precipitation Index. J. Am. Water Resour. Assoc. 1998, 34, 113–121. [Google Scholar] [CrossRef]
- Sahoo, R.N.; Dutta, D.; Khanna, M.; Kumar, N.; Bandyopadhyay, S.K. Drought assessment in the Dhar and Mewat Districts of India using meteorological, hydrological and remote-sensing derived indices. Nat. Hazards 2015, 77, 733–751. [Google Scholar] [CrossRef]
- Liu, X.; Zhu, X.; Pan, Y.; Bai, J.; Li, S. Performance of different drought indices for agriculture drought in the North China Plain. J. Arid Land 2018, 10, 507–516. [Google Scholar] [CrossRef]
- Lu, E. Determining the start, duration, and strength of flood and drought with daily precipitation: Rationale. Geophys. Res. Lett. 2009, 36. [Google Scholar] [CrossRef]
- Lu, E.; Cai, W.; Jiang, Z.; Zhang, Q.; Cunjie Zhang, C.; Higgins, R.W.; Halpert, M.S. The day-to-day monitoring of the 2011 severe drought in China. Clim. Dynam. 2014, 43, 1–9. [Google Scholar] [CrossRef]
- Lu, E.; Luo, Y.; Zhang, R.; Wu, Q.; Liu, L. Regional atmospheric anomalies responsible for the 2009-2010 severe drought in China. J. Geophys. Res. Atmos. 2011, 116. [Google Scholar] [CrossRef]
- Chen, H.; Xu, C.-Y.; Guo, S. Comparison and evaluation of multiple GCMs, statistical downscaling and hydrological models in the study of climate change impacts on runoff. J. Hydrol. 2012, 434, 36–45. [Google Scholar] [CrossRef]
- Wang, Y.; Wang, D.; Wu, J. Assessing the impact of Danjiangkou reservoir on ecohydrological conditions in Hanjiang river, China. Ecol. Eng. 2015, 81, 41–52. [Google Scholar] [CrossRef]
- Shen, M.; Chen, J.; Zhuan, M.; Chen, H.; Xu, C.Y.; Xiong, L. Estimating uncertainty and its temporal variation related to global climate models in quantifying climate change impacts on hydrology. J. Hydrol. 2017, 556, 10–24. [Google Scholar] [CrossRef]
- Wang, G.; Li, J.; Deng, L.; He, M. China meteorological data sharing service system: Design and development. J. Meteorol. Res. 2004, S1, 10–16. [Google Scholar]
- Taylor, K.E.; Stouffer, R.J.; Meehl, G.A. An Overview of CMIP5 and the Experiment Design. Bull. Am. Meteorol. Soc. 2012, 93, 485–498. [Google Scholar] [CrossRef]
- Yao, N.; Li, L.; Feng, P.; Feng, H.; Liu, D.; Liu, Y.; Jiang, K.; Hu, X.; Li, Y. Projections of drought characteristics in China based on a standardized precipitation and evapotranspiration index and multiple GCMs. Sci. Total Environ. 2020, 704, 135245. [Google Scholar] [CrossRef] [PubMed]
- Sanderson, B.M.; Knutti, R. On the interpretation of constrained climate model ensembles. Geophys. Res. Lett. 2012, 39, 16708. [Google Scholar] [CrossRef]
- National Standard of People’s Republic of China GB/T 20481-2006. In Classification of Meteorological Drought; China Standard Press: Beijing, China, 2006.
- Chen, J.; Brissette, F.P.; Leconte, R. Uncertainty of downscaling method in quantifying the impact of climate change on hydrology. J. Hydrol. 2011, 401, 190–202. [Google Scholar] [CrossRef]
- Chen, J.; Brissette, F.P.; Chaumont, D.; Braun, M. Performance and uncertainty evaluation of empirical downscaling methods in quantifying the climate change impacts on hydrology over two north American river basins. J. Hydrol. 2013, 479, 200–214. [Google Scholar] [CrossRef]
- Mpelasoka, F.S.; Chiew, F.H.S. Influence of rainfall scenario construction methods on runoff projections. J. Hydrometeorol. 2009, 10, 1168–1183. [Google Scholar] [CrossRef]
- Schmidli, J.; Frei, C.; Vidale, P.L. Downscaling from GCM precipitation: A benchmark for dynamical and statistical downscaling methods. Int. J. Climatol. 2006, 26, 679–689. [Google Scholar] [CrossRef]
- Maraun, D. Bias Correction, Quantile Mapping, and Downscaling: Revisiting the Inflation Issue. J. Clim. 2013, 26, 2137–2143. [Google Scholar] [CrossRef]
- Herbst, P.H.; Bredenkamp, D.B.; Barker, H. A technique for the evaluation of drought from rainfall data. J. Hydrol. 1966, 4, 264–272. [Google Scholar] [CrossRef]
- Yevjevich, V. An Objective Approach to Definitions and Investigations of Continental Hydrologic Droughts; Hydrologic Papers; Colorado State University Publisher: Fort Collins, CO, USA, 1967. [Google Scholar]
- Zhang, Q.; Gemmer, M.; Chen, J. Climate changes and flood/drought risk in the Yangtze Delta, China, during the past millennium. Quat. Int. 2008, 176, 62–69. [Google Scholar] [CrossRef]
- He, J.; Yang, X.; Li, Z.; Zhang, X.; Tang, Q. Spatiotemporal Variations of Meteorological Droughts in China during 1961–2014: An Investigation Based on Multi-Threshold Identification. Int. J. Disaster Risk Sci. 2016, 7, 63–76. [Google Scholar] [CrossRef]
- Liu, H.; Wu, J.; Xu, Y. Investigating the Effects of Precipitation on Drought in the Hanjiang River Basin Using SPI. J. Water Clim. Chang. 2019, 10, 977–992. [Google Scholar] [CrossRef]
- Editorial Committee of China Meteorological Disaster Canon. China Meteorological Disaster Canon: Hubei Volume; China Meteorological Press: Beijing, China, 2007; ISBN 9787502943158. [Google Scholar]
- Chen, F.; Liu, C. Estimation of the spatial rainfall distribution using inverse distance weighting (IDW) in the middle of Taiwan. Paddy Water Environ. 2012, 10, 209–222. [Google Scholar] [CrossRef]
- Hayes, M.J.; Svoboda, M.; Wilhite, D.A.; Vanyarkho, O. Monitoring the 1996 drought using the Standardized Precipitation Index. Bull. Am. Meteorol. Soc. 1999, 80, 429–438. [Google Scholar] [CrossRef]
- Mehr, D.; Sorman, K.; Afshar, H. Climate change impacts on meteorological drought using SPI and SPEI: Case study of Ankara, Turkey. Hydrol. Sci. J. 2020, 65, 254–268. [Google Scholar] [CrossRef]
- Tallaksen, L.M.; Stahl, K. Spatial and Temporal Patterns of Large-Scale Droughts in Europe: Model Dispersion and Performance. Geophys. Res. Lett. 2014, 41, 429–434. [Google Scholar] [CrossRef]
- IPCC. Climate Change 2007-The Physical Science Basis: Working Group I Contribution to the Fourth Assessment Report of the IPCC; Cambridge University Press: New York, NY, USA; Volume 4, p. 996. ISBN 9780521705967.
- Garcia, P.; Nicolas, A.; Velazquez, M. Combined use of relative drought indices to analyze climate change impact on meteorological and hydrological droughts in a Mediterranean basin. J. Hydrol. 2017, 554, 292–305. [Google Scholar] [CrossRef]
- Chen, H.; Sun, J. Anthropogenic warming has caused hot droughts more frequently in China. J. Hydrol. 2017, 544, 306–318. [Google Scholar] [CrossRef]
- Her, Y.; Yoo, S.; Cho, J.; Hwang, S.; Jeong, J.; Seong, C. Uncertainty in hydrological analysis of climate change: Multi-parameter vs. multi-GCM ensemble predictions. Sci. Rep. 2019, 9, 4974. [Google Scholar] [CrossRef]
- Chen, J. Overall uncertainty study of the hydrological impacts of climate change for a Canadian watershed. Water Resour. Res. 2011. [Google Scholar] [CrossRef]


© 2020 by the authors. Licensee MDPI, Basel, Switzerland. This article is an open access article distributed under the terms and conditions of the Creative Commons Attribution (CC BY) license (http://creativecommons.org/licenses/by/4.0/).