Consequences of Transport Low-Carbon Transitions and the Carbon, Land and Water Footprints of Different Fuel Options in The Netherlands
Abstract
:Highlights
- Replacing 5% of gasoline or diesel in transport with a biofuel barely reduces carbon footprints.
- Even minor biofuel use in transport causes enormous land and water footprints.
- The use of electricity in transport is more sustainable with wind or solar energy.
- It is likely that renewable electricity cannot fully supply transport so that hydrogen is needed.
- The decarbonization of transport needs fuel choices that consider resources like land and water.
1. Introduction
2. System Analysis
2.1. The Dutch Transport System
2.2. Transport Fuels
2.3. Electricity for Transport
2.4. Hydrogen for Transport
2.5. Biofuels
2.6. Environmental Impacts of Transport Fuels
3. Methods and Data
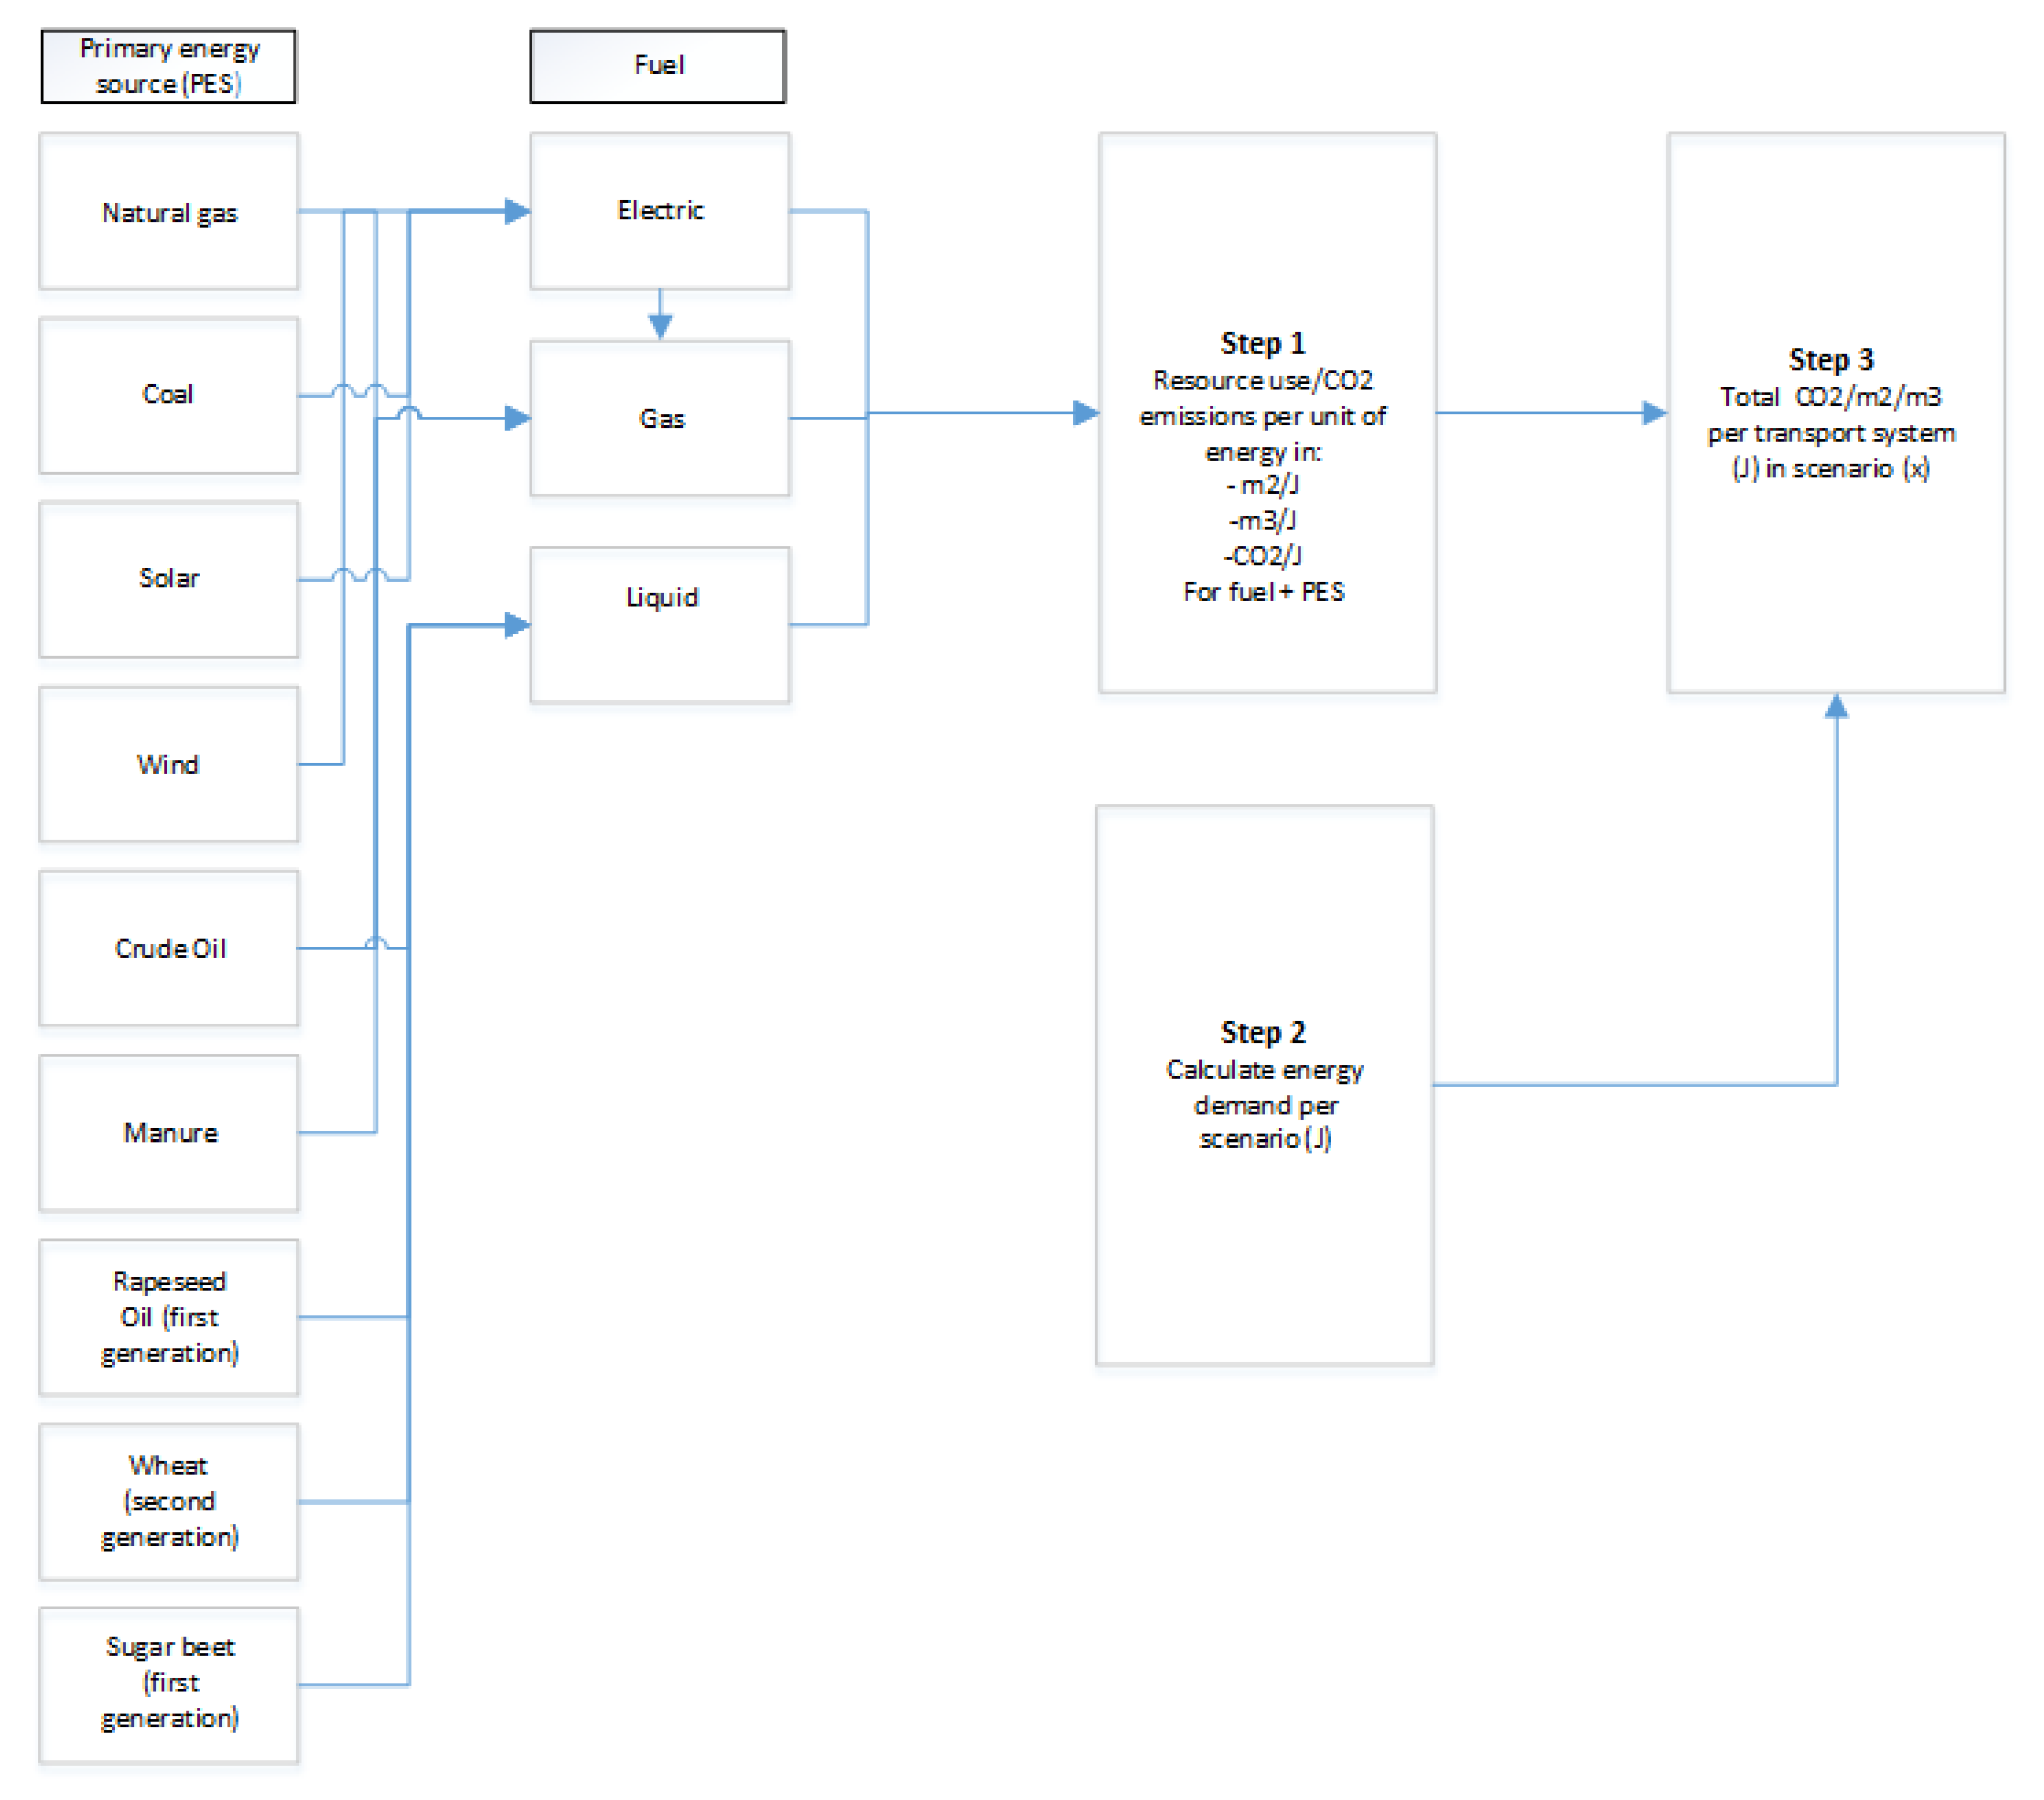
3.1. Step 1
3.2. Step 2
3.3. Step 3
4. Results
5. Discussion
6. Conclusions
Author Contributions
Funding
Conflicts of Interest
List of Abbreviations and Definitions
| BE1W | Bioethanol first generation Wheat |
| BE1SB | Bioethanol first generation sugar beet |
| BE2W | Bioethanol second generation wheat |
| BD1R | Biodiesel first generation rapeseed oil |
| BGM | Biogas manure |
| Bio-CNG | Bio-compressed natural gas |
| CF | Carbon footprint in CO2e |
| CO2e | CO2-equivalent weighted average of all GHG emissions |
| EM | Electricity mix |
| ENG | Electricity natural gas |
| EC | Electricity coal |
| EW | Electricity wind |
| ES | Electricity solar |
| EW+G | Electricity wind + gasoline |
| EM+G | Electricity mix + gasoline |
| EW+B | Electricity wind + bioethanol |
| EM+B | Electricity mix + bioethanol |
| Environmental impact parameter | The amount of CO2, water and land use per unit of energy |
| GHG | Greenhouse gas |
| GJ | Gigajoule (109 Joule) |
| H2EM | Hydrogen electricity mix |
| H2ENG | Hydrogen electricity natural gas |
| H2EC | Hydrogen electricity coal |
| H2EW | Hydrogen electricity wind |
| H2ES | Hydrogen electricity solar |
| H2GNG | Hydrogen gasification natural gas |
| H2GC | Hydrogen gasification coal |
| HFO | Heavy fuel oil |
| J | Joule |
| LPG | Liquefied petroleum gas |
| MDO | Marine diesel oil |
| MJ | Megajoule (106 joule) |
| Mt | Megaton (109 kg) |
| PES | Primary energy source—energy sources that can be used directly, as they appear in the natural environment |
| PJ | Petajoule ((1015 joule) |
| PV | Photovoltaics |
| REF | Reference |
| TTW | Tank-to-wheels emissions that occur during the combustion of a fuel in a vehicle |
| WTT | Well-to-tank emissions that occur in the production chain of a fuel |
| WTW | Well-to-wheels—TTW and WTT emissions combined |
| WF | Water footprint—the total annual volume of freshwater used to produce the goods and services related to consumption |
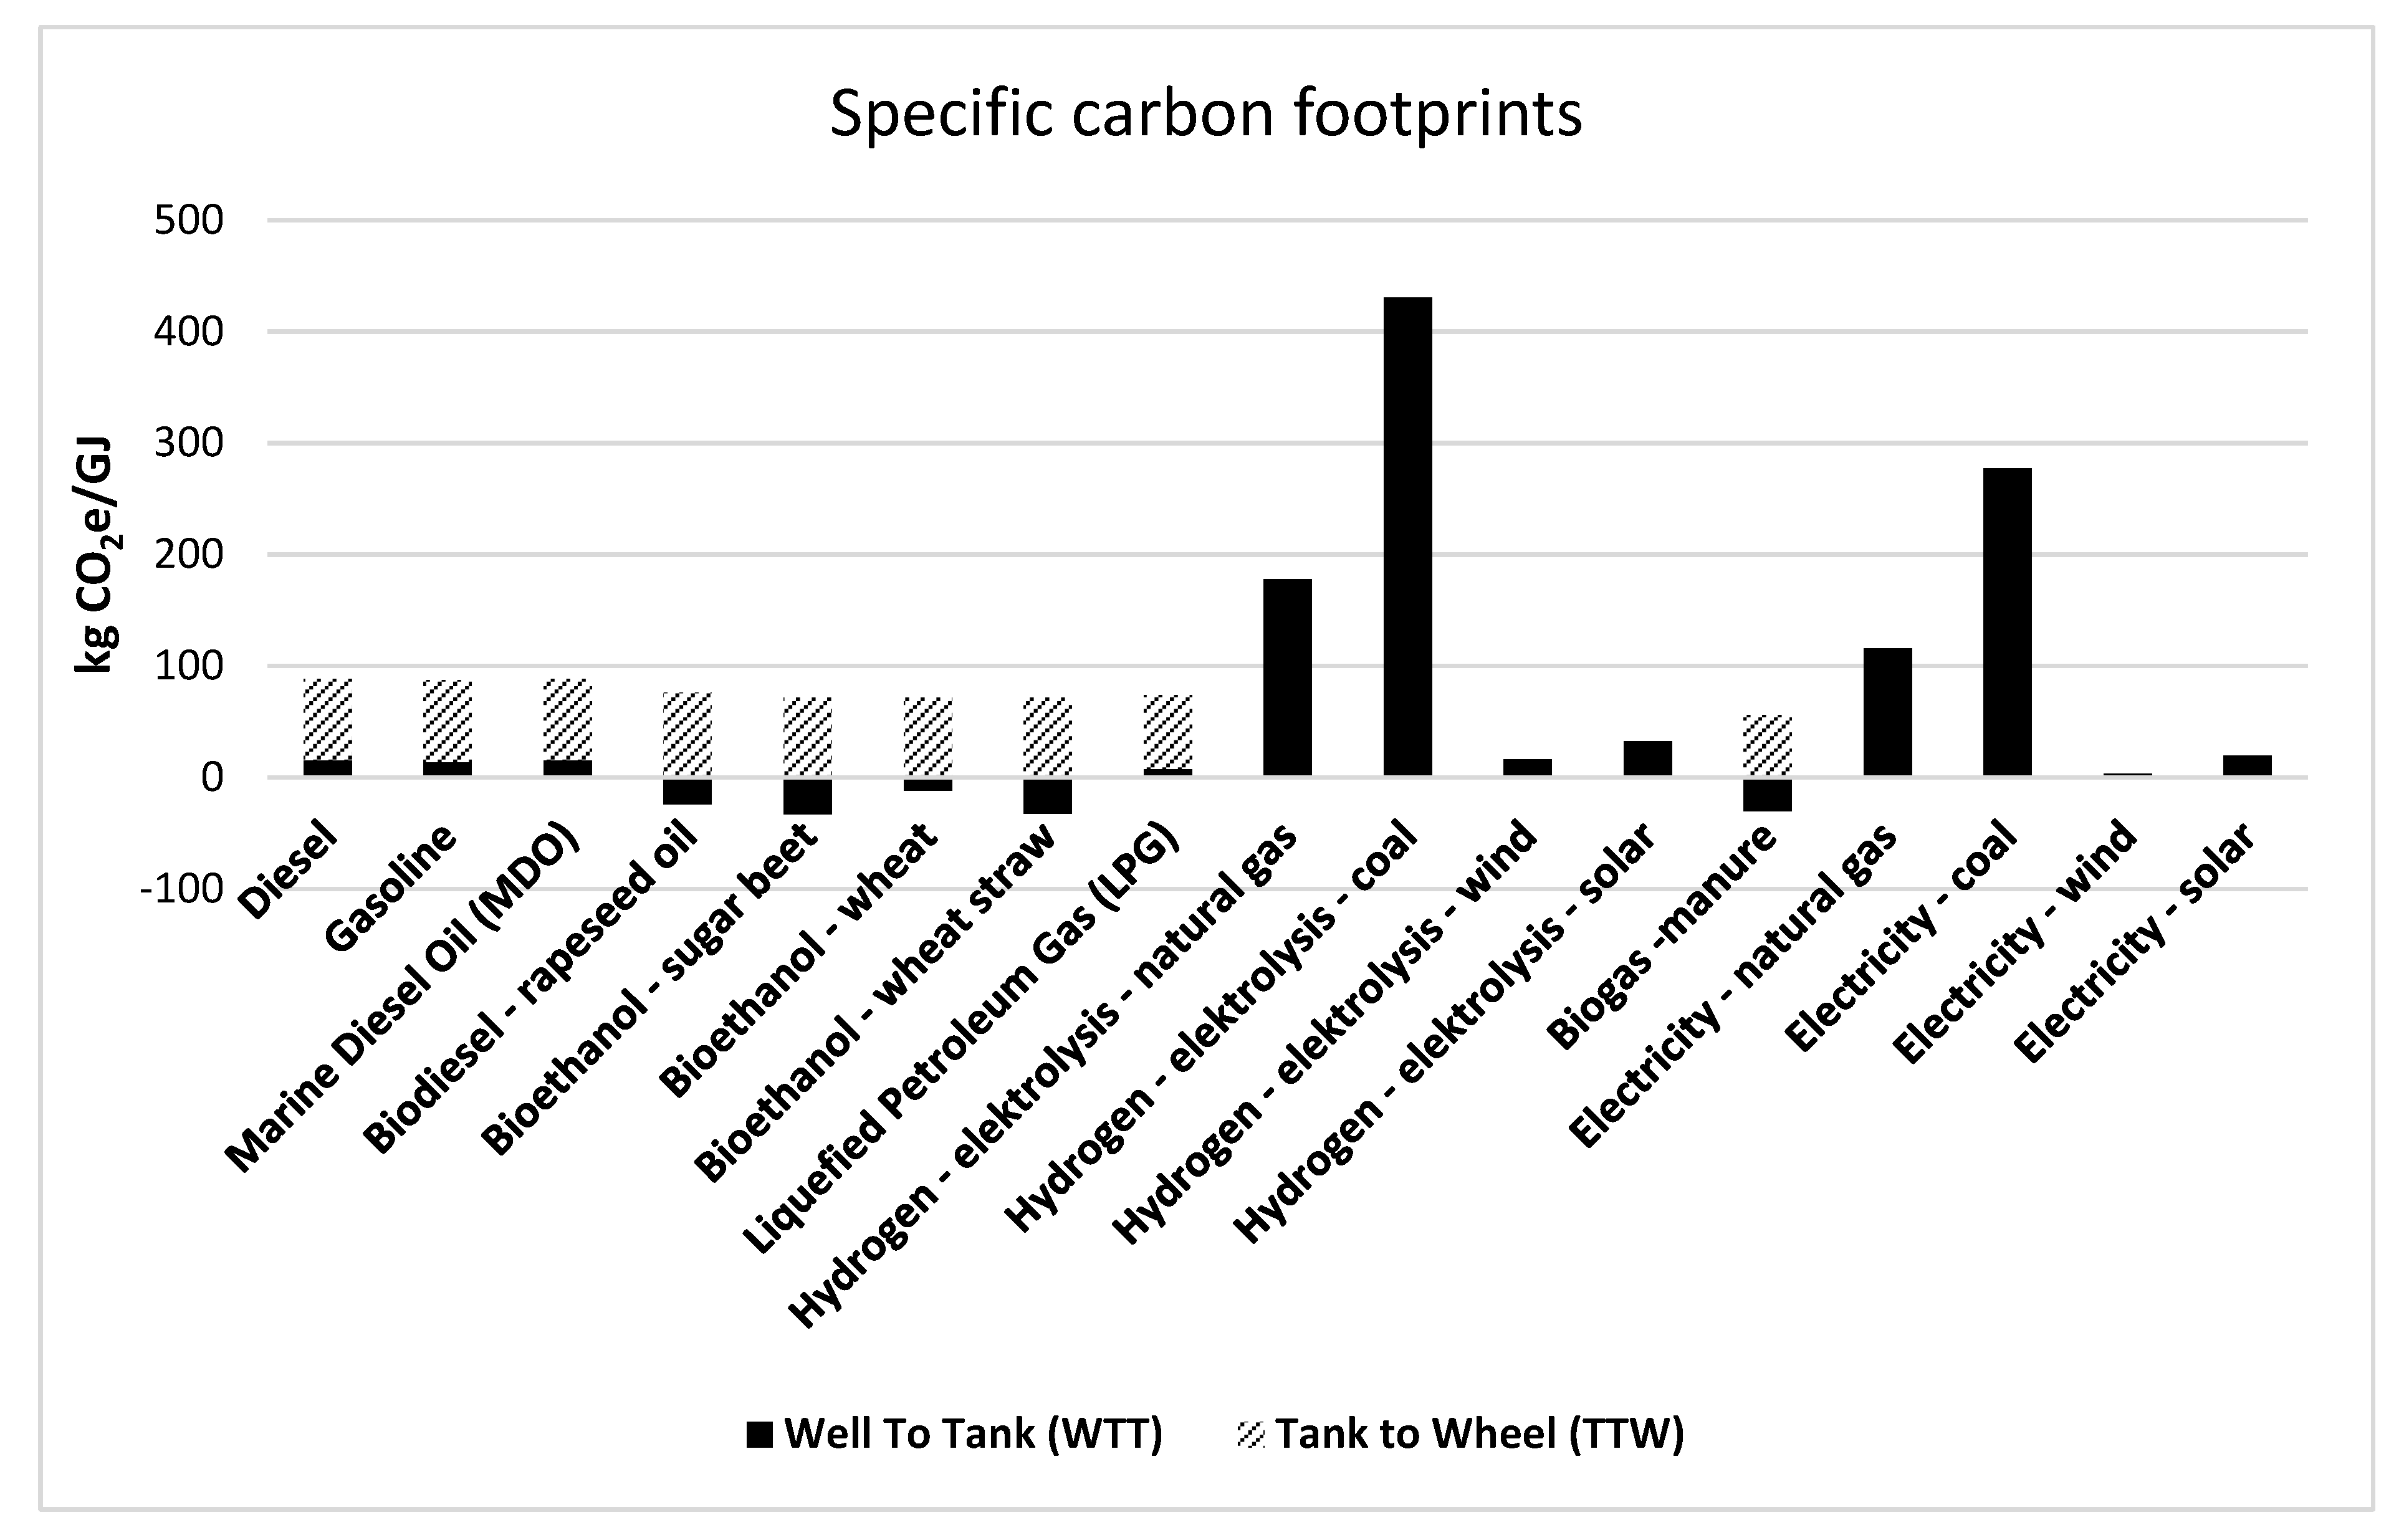
Appendix A. Specific Carbon Footprints for Transport Fuels
| Fuel Type | Reference | Fuel | Carbon Footprint (kg CO2e/GJ) | ||
|---|---|---|---|---|---|
| WTT | TTW | WTW | |||
| Liquid | [20,36] | Diesel | 15.4 | 73.2 | 88.6 |
| [20,36] | Gasoline | 13.8 | 73.4 | 87.2 | |
| [20,36] | Marine diesel oil (MDO) | 15.4 | 73.0 | 88.4 | |
| [20] | Biodiesel—rapeseed oil | −23.9 | 76.2 | 52.3 | |
| [20,36] | Bioethanol—sugar beet | −33.0 | 71.4 | 38.4 | |
| [20,36] | Bioethanol—wheat | −12.0 | 71.4 | 59.4 | |
| [20,36] | Bioethanol—wheat straw | −32.2 | 71.4 | 39.2 | |
| Gaseous | [20] | Liquefied petroleum gas (LPG) | 8.0 | 65.8 | 73.8 |
| [20] | Hydrogen electrolysis—natural gas | 177.6 | 0 | 177.6 | |
| [20] | Hydrogen electrolysis—coal | 430.8 | 0 | 430.8 | |
| [20] | Hydrogen electrolysis—wind | 16.3 | 0 | 16.3 | |
| [20] | Hydrogen electrolysis—solar | 32.4 | 0 | 32.4 | |
| [20,36] | Bio-compressed natural gas (CNG)—manure | −30.0 | 56.0 | 26.0 | |
| [20] | Electricity—natural gas | 115.8 | 0 | 115.8 | |
| [20] | Electricity—coal | 277.4 | 0 | 277.4 | |
| [20,36] | Electricity—wind | 3.3 | 0 | 3.3 | |
| [20,36] | Electricity—solar | 19.4 | 0 | 19.4 | |
Appendix B. Specific Land Footprints for Transport Fuels
| Type | References | Fuel | Land Footprint (m2/GJ Final Fuel) |
|---|---|---|---|
| Liquid | [50] | Diesel | 0.001 |
| [50] | Gasoline | 0.001 | |
| [50] | Marine diesel oil (MDO) | 0.001 | |
| [51] | Biodiesel—rapeseed oil | 125 | |
| [51] | Bioethanol—sugar beet | 95 | |
| [51] | Bioethanol—wheat | 83 | |
| [51] | Bioethanol—wheat straw | 21 | |
| Gaseous | [50] | Liquefied petroleum gas (LPG) | 0.011 |
| [this study] | Hydrogen electrolysis—electricity mix | 0.004 | |
| [this study] | Hydrogen electrolysis—natural gas | 0.003 | |
| [this study] | Hydrogen electrolysis—coal | 0.005 | |
| [this study] | Hydrogen electrolysis—wind | 0.099 | |
| [this study] | Hydrogen electrolysis—solar | 0.590 | |
| [this study] | Hydrogen thermal—coal | 0.005 | |
| [this study] | Hydrogen thermal—natural gas | 0.003 | |
| [53] | Bio-compressed natural gas (CNG)—manure * | 0.040 | |
| [52] | Electricity—natural gas | 0.002–0.005 | |
| [52] | Electricity—coal | 0.002–0.008 | |
| [52] | Electricity—wind | 0.286–0.897 | |
| [52] | Electricity—solar | 0.046–0.153 |
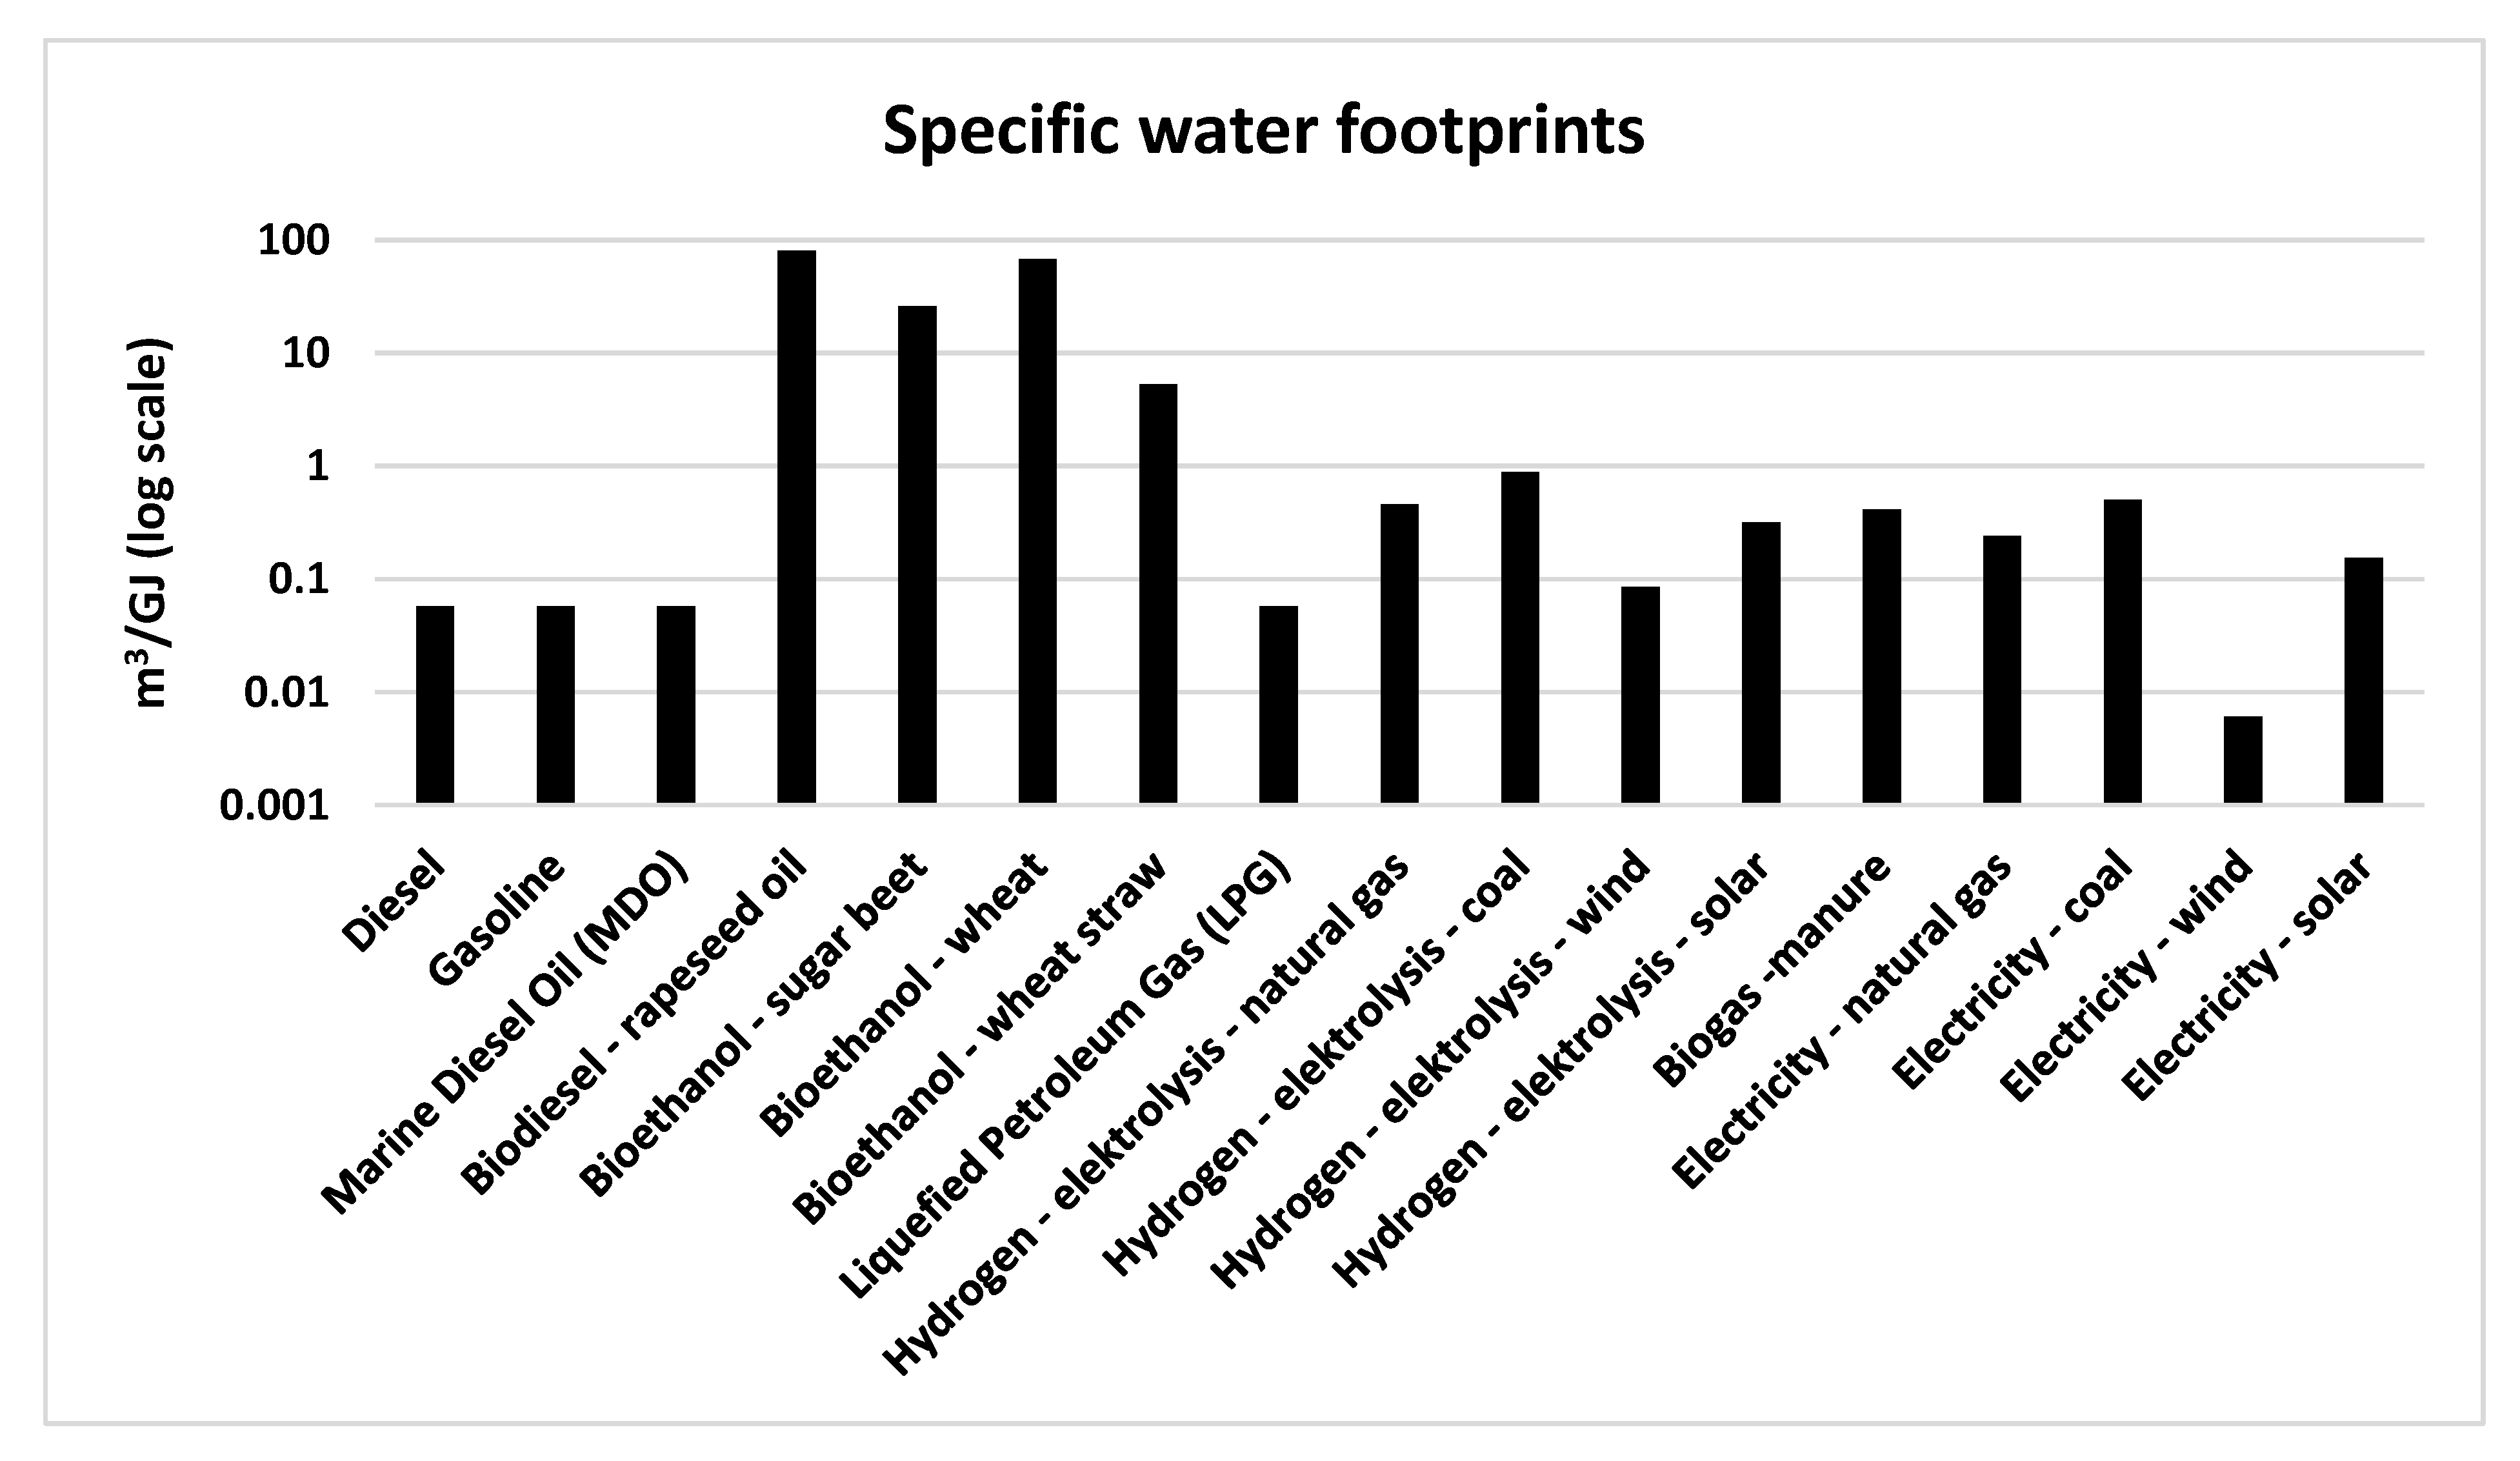
Appendix C. Specific Water Footprints for Fuels
| Type | References | Fuel | Water Footprint (m3/GJ Final Fuel) | ||
|---|---|---|---|---|---|
| Blue | green | grey | |||
| Liquid | [55] | Diesel | 0.06 | 0 | n.d * |
| [55] | Gasoline | 0.06 | 0 | n.d * | |
| [55] | Marine diesel oil (MDO) | 0.06 | 0 | n.d * | |
| [60] | Biodiesel—rapeseed oil | 0 | 75 | 5 | |
| [60] | Bioethanol—sugar beet | 0 | 21 | 5 | |
| [60] | Bioethanol—wheat | 0 | 50 | 18 | |
| [58] | Bioethanol—wheat straw | 0 | 4 | 1 | |
| Gaseous | [55] | Liquefied petroleum gas (LPG) | 0.06 | 0 | n.d * |
| [this study] | Hydrogen electrolysis—natural gas | 0.46 | 0 | n.d * | |
| [this study] | Hydrogen electrolysis—coal | 0.88 | 0 | n.d * | |
| [this study] | Hydrogen electrolysis—wind | 0.08 | 0 | n.d * | |
| [this study] | Hydrogen electrolysis—solar | 0.32 | 0 | n.d * | |
| ** | Bio-compressed natural gas (CNG)—manure | 0.41 | 0 | n.d * | |
| [17] | Electricity—natural gas | 0.24 | 0 | n.d * | |
| [17] | Electricity—coal | 0.50 | 0 | n.d * | |
| [17] | Electricity—wind | 0.01 | 0 | n.d * | |
| [17] | Electricity—solar | 0.15 | 0 | n.d * |
| Water Use Bio-CNG (Sources: BioEnergyFarm [53]) | ||
|---|---|---|
| Input Capacity Installation: 15,000 kg Water Input (15 m3). Output: 1000 m3 CNG Energy Content CNG: 37 MJ/m3 = 37,000 MJ | ||
| Calculation | 0.000405405 | m3/MJ |
| 0.405405405 | m3/GJ | |
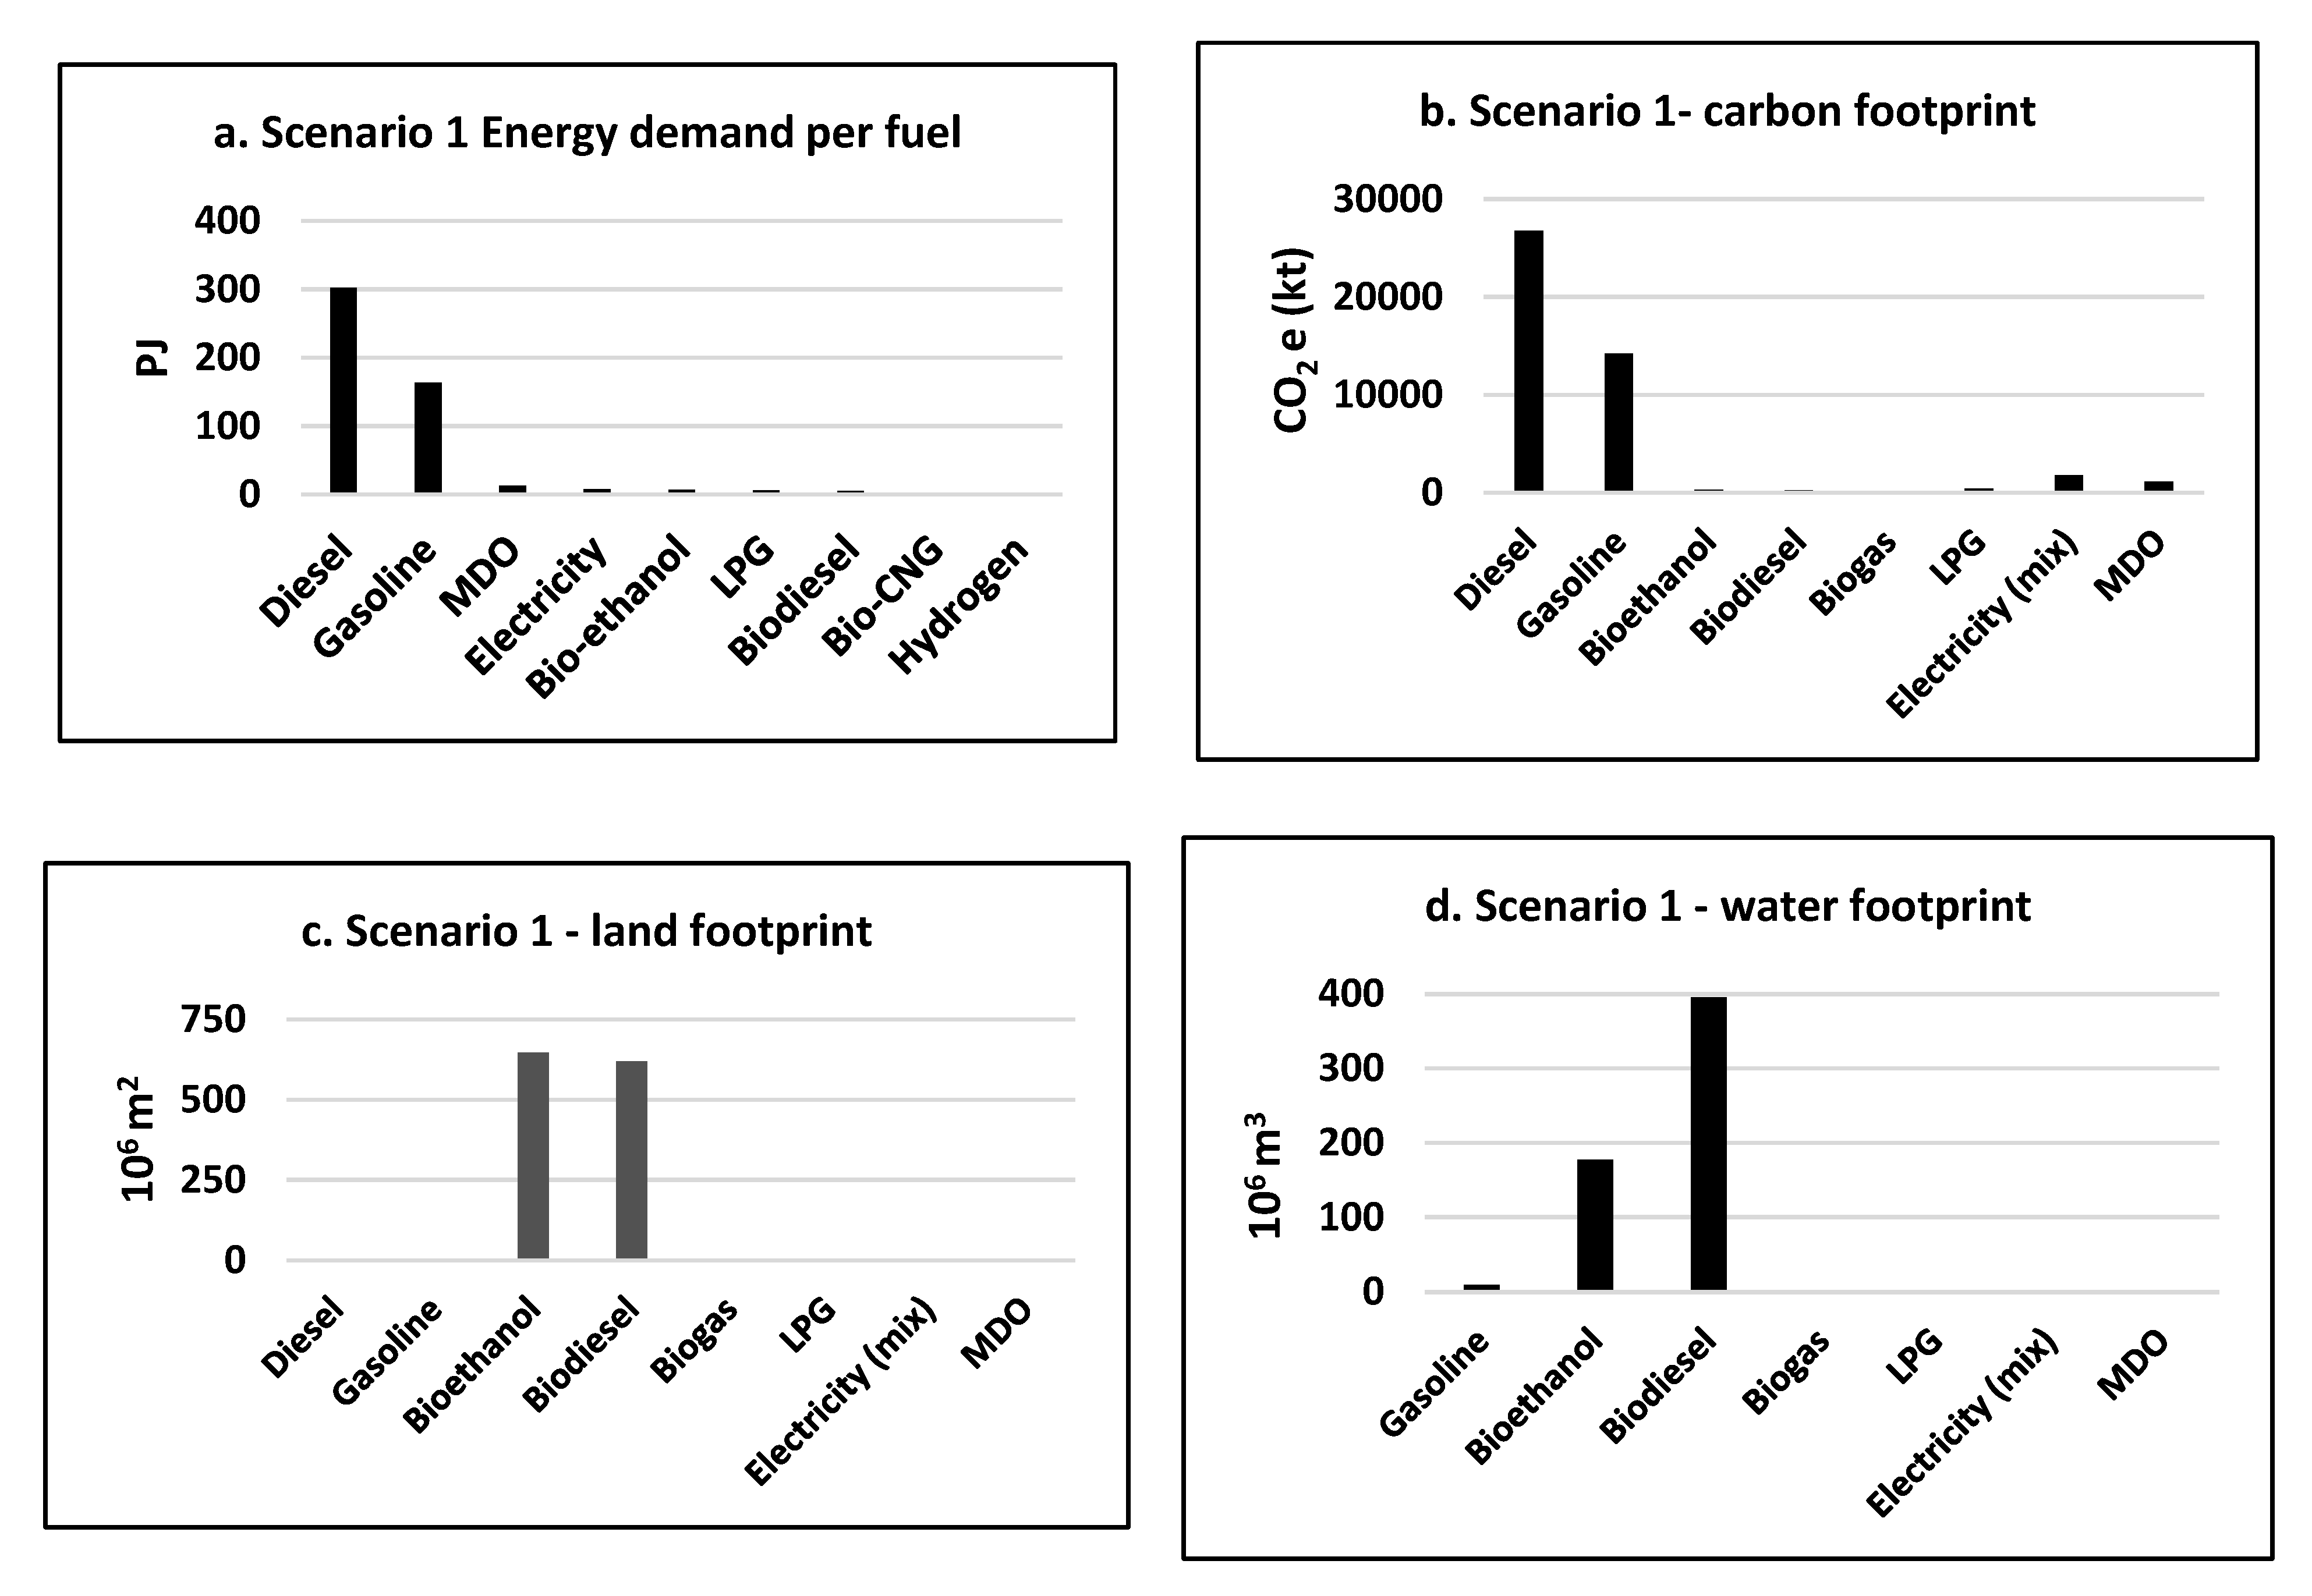
Appendix D. Scenarios 1–4
| Fuel | Energy Use (PJ) | Carbon Footprint (Mt) | Land Footprint (106 m2) | Water Footprint (106 m3) |
|---|---|---|---|---|
| Diesel | 302.2 | 26.775 | 0.33 | 17.38 |
| Gasoline | 163.0 | 14.214 | 0.18 | 9.37 |
| Bioethanol | 6.8 | 308 | 647.62 | 176.80 |
| Biodiesel | 5.0 | 259 | 618.83 | 395.92 |
| Bio-compressed natural gas (CNG) | 0.45 | 12 | 0.02 | 0.18 |
| Liquefied petroleum gas (LPG) | 6.0 | 443 | 0.01 | 0.35 |
| Electricity (mix) | 7.4 | 1.777 | 0.03 | 2.75 |
| Marine diesel oil (MDO) | 13 | 1.149 | 0.01 | 0.75 |
| Total | 503.8 | 44.936 | 1266.83 | 603.50 |
| Fuel | Carbon Footprint (Mt) | Land Footprint (106 m2) | Water Footprint (106 m3) |
|---|---|---|---|
| Electrolysis—natural gas | 77.078 | 1.4 | 197.8 |
| Electrolysis—coal | 186.967 | 2.2 | 381.1 |
| Electrolysis—wind | 7.074 | 43.2 | 36.8 |
| Electrolysis—solar | 14.061 | 256.8 | 138.4 |
| Fuel | Carbon Footprint (Mt) | Land Footprint (106 m2) | Water Footprint (106 m3) |
|---|---|---|---|
| Electricity—natural gas | 19.705 | 0.5 | 37.0 |
| Electricity—coal | 43.622 | 0.8 | 76.3 |
| Electricity—wind | 3.055 | 14.7 | 2.6 |
| Electricity—solar | 5.438 | 87.6 | 24.3 |
| Fuel | Carbon Footprint (Mt) | Land Footprint (106 m2) | Water Footprint (106 m3) |
|---|---|---|---|
| Bioethanol—first generation wheat | 29.462 | 40,935 | 33,728 |
| Bioethanol—first generation sugar beet | 19.046 | 47,238 | 12,896 |
| Bioethanol—second generation wheat straw | 19.443 | 10,417 | 2622 |
| Biodiesel—first generation rapeseed oil | 25.941 | 62,000 | 39,680 |
References
- Collins, L.; Andrew, I.; Freimuth, E.; Zhang, S. A race we can win. One Earth 2019, 1, 1–2. [Google Scholar] [CrossRef]
- Sarkis, J. Sustainable transitions: Technology, resources, and society. One Earth 2019, 1, 48–50. [Google Scholar] [CrossRef] [Green Version]
- International Energy Agency (IEA). Tracking Clean Energy Progress 2017. Available online: https://www.iea.org/publications/freepublications/publication/TrackingCleanEnergyProgress2017.pdf (accessed on 16 January 2019).
- Paris Process on Mobility and Climate (PPMC). A Global Macro Road Map Outlining an Actionalble Vision towards Decarbonized, Resilient Transport. Available online: http://www.ppmc-transport.org/wp-content/uploads/2016/04/GMR2017.pdf (accessed on 16 January 2019).
- Chapman, L. Transport and climate change: A review. J. Transp. Geogr. 2007, 15, 354–367. [Google Scholar] [CrossRef]
- Edelenbosch, O.Y.; McCollum, D.L.; Van Vuuren, D.P.; Betram, C.; Carrara, S.; Daly, H.; Fujimori, S.; Kitous, A.; Kyle, P.; Broin, E.Ó.; et al. Decomposing passenger transport futures: Comparing results of global integrated assessment models. Transp. Res. Part D 2017, 55, 281–293. [Google Scholar] [CrossRef] [Green Version]
- Dutch Parliament (Tweede Kamer der Staten Generaal). Kamerstuk 34717 nr. 3. Available online: https://zoek.officielebekendmakingen.nl/kst-34717-3.html (accessed on 16 January 2019).
- Nederland Elektrisch. Available online: https://nederlandelektrisch.nl/Formule-E-Team (accessed on 16 January 2019).
- Hao, H.; Geng, Y.; Tate, J.E.; Liu, F.; Sun, X.; Mu, Z.; Xun, D.; Liu, Z.; Zhao, F. Securing platinum-group metals for transport low-carbon transition. One Earth 2019, 1, 117–125. [Google Scholar] [CrossRef] [Green Version]
- Senate and House of Representatives of Energy Policy of the United States of America. Energy Policy Act of 1992. Available online: https://www.govinfo.gov/content/pkg/STATUTE-106/pdf/STATUTE-106-Pg2776.pdf (accessed on 27 June 2020).
- Hill, J.; Nelson, E.; Tilman, D.; Polasky, S.; Tiffany, D. Environmental, economic, and energetic costs and benefits of biodiesel and ethanol biofuels. Proc. Natl. Acad. Sci. USA 2006, 103, 11206–11210. [Google Scholar] [CrossRef] [Green Version]
- Gerbens-Leenes, P.W.; Xu, L.; De Vries, G.J.; Hoekstra, A.Y. The blue water footprint and land use of biofuels from algae. Water Resour. Res. 2014, 50, 8549–8563. [Google Scholar] [CrossRef]
- Darda, S.; Papalas, T.; Zabaniotou, A. Biofuels journey in Europe: Currently the way to low carbon economy sustainability is still a challenge. J. Clean. Prod. 2019, 208, 575–588. [Google Scholar] [CrossRef]
- Berger, M.; Pfister, S.; Bach, V.; Finkbeiner, M. Saving the planet’s climate or water resources? The trade-off between carbon and water footprints of European biofuels. Sustainability 2015, 7, 6665–6683. [Google Scholar] [CrossRef] [Green Version]
- Gerbens-Leenes, P.W. Green, Blue and Grey Bioenergy Water Footprints, a Comparison of Feedstocks for Bioenergy Supply in 2040. Environ. Process. 2018, 5. [Google Scholar] [CrossRef] [Green Version]
- del G. Rodriguez, R.; Scanlon, B.R.; King, C.W.; Scarpare, F.V.; Xavier, A.C.; Pruski, F.F. Biofuel-water-land nexus in the last agricultural frontier region of the Brazilian Cerrado. Appl. Energy 2018, 231, 1330–1345. [Google Scholar] [CrossRef]
- Mekonnen, M.M.; Gerbens-Leenes, W.; Hoekstra, A.Y. The consumptive water footprint of electricity and heat: A global assessment. Environ. Sci. Water Res. Technol. 2015, 1, 285–297. [Google Scholar] [CrossRef]
- Joint Research Centre (JRC). Well to Tank Report Version 4.a–JEC Well-To-Wheels Analysis of Future Automotive Fuels and Powertrains in the European Context. 2014. Available online: https://publications.jrc.ec.europa.eu/repository/bitstream/JRC85326/wtt_report_v4a_april2014_pubsy.pdf (accessed on 24 July 2018).
- Joint Research Centre (JRC). Well-To-Tank Appendix 1–Version 4.a–Conversion Factors and Fuel Properties. 2014. Available online: https://ec.europa.eu/jrc/sites/jrcsh/files/wtt_appendix_1_v4a.pdf (accessed on 24 July 2018).
- Joint Research Centre (JRC). Well-To-Tank Appendix 2–Version 4.a–Summary of Energy and GHG Balance of Individual Pathways. 2014. Available online: https://ec.europa.eu/jrc/sites/jrcsh/files/wtt_appendix_2_v4a.pdf (accessed on 24 July 2018).
- Joint Research Centre (JRC). Well-To-Tank Appendix 4–Version 4.a–Description, Results and Input Data Per Pathway. 2014. Available online: https://iet.jrc.ec.europa.eu/about-jec/downloads (accessed on 24 July 2018).
- Stephan, A.; Crawford, R.H. Total water requirements of passenger transport modes. Transp. Res. Part D 2016, 49, 94–109. [Google Scholar] [CrossRef]
- Bigerna, S.; Micheli, S. Attidudes toward electric vehicles: The case of Perugia using a fuzzy set analysis. Sustainability 2018, 10, 3999. [Google Scholar] [CrossRef] [Green Version]
- Onn, C.C.; Mohd, N.S.; Yuen, C.W.; Loo, S.C.; Koting, S.; Rashid, A.F.A.; Karim, M.R.; Yusoff, S. Greenhouse gas emissions associated with electric vehicle charging: The impact of electricity generation mix in a developing country. Transp. Res. Part D 2018, 64, 15–22. [Google Scholar] [CrossRef]
- Ou, X.; Zhang, X.; Chang, S. Scenario analysis on alternative fuel/vehicle for China’s future road transport: Life-cycle energy demand and GHG emissions. Energy Policy 2010, 38, 3943–3956. [Google Scholar] [CrossRef]
- Shen, W.; Han, W.; Chock, D.; Chai, Q.; Zhang, A. Well-to-wheels life-cycle analysis of alternative fuels and vehicle technologies in China. Energy Policy 2012, 49, 296–3307. [Google Scholar] [CrossRef]
- Bakker, S.; Konings, R. The transition to zero-emission buses in public transport. The need for institutional innovation. Transp. Res. Part D 2018, 64, 204–215. [Google Scholar] [CrossRef]
- Balat, M. Potential importance of hydrogen as a future solution to environmental and transportation problems. Int. J. Hydrog. Energy 2008, 33, 4013–4029. [Google Scholar] [CrossRef]
- Transport en Mobiliteit 2016; Centraal Bureau voor de Statistiek (CBS): The Hague, The Netherlands, 2016.
- Vanham, D.; Leip, A.; Galli, A.; Kastner, T.; Bruckner, M.; Uwizye, A.; Van Dijk, K.; Ercin, E.; Dalin, C.; Brandão, M.; et al. Environmental footprint family to address local to planetary sustainability and deliver on the SDGs. Sci. Total Environ. 2019, 693, 133642. [Google Scholar] [CrossRef]
- Rodrigue, J. Transportation and energy. In The Geography of Transport Systems—The Spatial Organization of Transportation and Mobility, 4th ed.; Rodrigue, J., Comtois, C., Slack, B., Eds.; Routledge: New York, NY, USA, 2017; ISBN 978-1138669574. Available online: https://transportgeography.org/?page_id=5717 (accessed on 1 May 2018).
- Hanania, J.; Donev, J. Energy Education-Primary Energy. Available online: https://energyeducation.ca/encyclopedia/Primary_energy (accessed on 2 April 2018).
- Ambel, C.C. Roadmap to Climate-Friendly Land Freight and Buses in Europe–June 2017; Transport & Environment: Bruxelles, Belgium, 2017. [Google Scholar]
- Hill, N.; Hazeldine, T.; Pridmore, A.; Von Einem, J.; Wynn, D. Alternative Energy Carriers and Powertrains to Reduce GHG from Transport. Paper 2 produced as part of contract ENV.C.3/SER/2008/0053 between European Commission Directorate-General Environment and AEA Technology plc. Available online: https://www.eutransportghg2050.eu (accessed on 3 April 2018).
- Fares, R. Renewable Energy Intermittency Explained: Challenges, Solutions, and Opportunities. Scientific American–Plug In. Available online: https://blogs.scientificamerican.com/plugged-in/renewable-energy-intermittency-explained-challenges-solutions-and-opportunities/ (accessed on 3 April 2018).
- Turconi, R.; Boldrin, A.; Astrup, T. Life cycle assessment (LCA) of electricity generation technologies: Overview, comparability and limitations. Renew. Sustain. Energy Rev. 2013, 28, 555–565. [Google Scholar] [CrossRef] [Green Version]
- Pickard, W.F.; Abbott, D. Addressing the Intermittency Challenge: Massive Energy Storage in a Sustainable Future. Proc. IEEE 2012, 100, 317–321. [Google Scholar] [CrossRef]
- Van Wijk, A. Waterstofauto Wint van Elektrische Auto–in Aantallen, Binnen 10 Jaar. Available online: https://zerauto.nl/waterstofauto-wint-van-elektrische-auto/ (accessed on 5 April 2018).
- ANWB. Elektriciteit, Waterstof, Aardgas en Groengas, Biobrandstoffen en LPG. Available online: https://www.anwb.nl/auto/brandstof/waterstof-groengas-aardgas-alternatieve-brandstoffen (accessed on 19 March 2018).
- Rulli, M.C.; Bellomi, D.; Cazzoli, A.; De Carolis, G.; D’Odorico, P. The water-land-food nexus of first-generation biofuels. Sci. Rep. 2016, 6, 22521. [Google Scholar] [CrossRef] [PubMed] [Green Version]
- Al Seadi, T. Biogas Handbook. Available online: http://www.lemvigbiogas.com/BiogasHandbook.pdf (accessed on 28 February 2018).
- Michaelis, L. Global Warming Impacts of Transport. Sci. Total Environ. 1993, 134, 117–124. [Google Scholar] [CrossRef]
- Forster, P.; Ramaswamy, V.; Artaxo, P.; Berntsen, T.; Betts, R.; Fahey, D.W.; Haywood, J.; Lean, J.; Lowe, D.C.; Myhre, G.; et al. Changes in Atmospheric Constituents and in Radiative Forcing. In Climate Change 2007: The Physical Science Basis. Contribution of Working Group I to the Fourth Assessment Report of the Intergovernmental Panel on Climate Change; Solomon, S.D., Qin, M., Manning, Z., Chen, M., Marquis, K.B., Tignor, A.M., Miller, H.L., Eds.; Cambridge University Press: Cambridge, UK; New York, NY, USA, 2007. [Google Scholar]
- Holmatov, B.; Hoekstra, A.Y. The environmental footprint of transport by car using renewable energy. Earth Future 2020, 8, e2019EF001428. [Google Scholar] [CrossRef]
- Reinhard, S.; Verhagen, J.; Wolters, W.; Ruben, R. Water-Food-Energy Nexus–A Quick Scan; Wageningen Economic Research: Wageningen, The Netherlands, 2017; Available online: https://www.wur.nl/upload_mm/1/6/f/6bec946b-792c-469b-ba07-5eec5c04b563_2017-096%20Reinhard_def.pdf (accessed on 28 July 2018).
- Halstead, M.; Kober, T.; Van der Zwaan, B. Understanding the Energy-Water Nexus; Energy Center The Netherlands (ECN): Sint Maartensvlotbrug, The Netherlands, 2014; Available online: https://www.ecn.nl/docs/library/report/2014/e14046.pdf (accessed on 19 March 2018).
- Čuček, L.; Klemeš, J.J.; Varbanov, P.S.; Kravanja, Z. Significance of environmental footprints for evaluating sustainability and security of development. Clean Technol. Environ. Policy 2015, 17, 2125–2141. [Google Scholar] [CrossRef]
- Hoekstra, A.Y.; Chapagain, A.K.; Aldaya, M.M.; Mekonnen, M.M. The Water Footprint Assessment Manual: Setting the Global Standard; Earthscan: London, UK, 2011. [Google Scholar]
- Kastner, T.; Erb, K.H.; Haberl, H. Rapid growth in agricultural trade: Effects on global area efficiency and the role of management. Environ. Res. Lett. 2014, 9, 034015. [Google Scholar] [CrossRef]
- United Nations Convention to Combat Desertification (UNCCD). Global Land Outlook–First Edition. 2014. Available online: https://www.unccd.int/publications/global-land-outlook (accessed on 15 March 2018).
- Börjesson, P.; Tufvesson, L.M. Agricultural crop-based biofuels–resource efficiency and environmental performance including direct land use changes. J. Clean. Prod. 2011, 19, 108–120. [Google Scholar] [CrossRef]
- Kaza, N.; Curtis, M.P. The Land Use Energy Connection. J. Plan. Lit. 2014, 29, 355–369. [Google Scholar] [CrossRef]
- BioEnergyFarm. Biolectric–Het Nieuwe Paradigm van de Biogas Sector. Available online: http://www.bioenergyfarm.eu/wp-content/uploads/2015/09/Case_NL_Belgie.pdf (accessed on 15 March 2018).
- Mehmeti, A.; Angelis-Dimakis, A.; Arampatzis, G.; McPhail, S.J.; Ulgati, S. Life Cycle Assessment and Water Footprint of Hydrogen Production Methods: From Conventional to Emerging Technologies. Environments 2018, 5, 24. [Google Scholar] [CrossRef] [Green Version]
- Williams, E.D.; Simmons, J.E. Water in the Energy Industry. An Introduction. British Petroleum (BP). Available online: https://www.bp.com/energysustainabilitychallenge (accessed on 19 May 2018).
- Mekonnen, M.M.; Hoekstra, A.Y. The green, blue and grey water footprint of crops and derived crop products. Hydrol. Earth Syst. Sci. 2011, 15, 1577–1600. [Google Scholar] [CrossRef] [Green Version]
- Dutch Emissions Authority. Conclusies Onderzoek Douanegegevens l Versie 1 l 3 Augustus 2017. 2017. Available online: https://www.zoekofficielebekendmakingen.nl (accessed on 28 June 2020).
- Mathioudakis, V.; Gerbens-Leenes, P.W.; van der Meer, T.H.; Hoekstra, A.Y. The Water Footprint of second generation bioenergy: A comparison of biomass feedstocks and conversion techniques. J. Clean. Prod. 2017, 148, 571–582. [Google Scholar] [CrossRef]
- Wang, M.; Wang, Z.; Gong, X.; Guo, Z. The intensification technologies to water electrolysis for hydrogen production—A review. Renew. Sustain. Energy Rev. 2014, 29, 573–588. [Google Scholar] [CrossRef]
- Skone, T.J. Life Cycle Greenhouse Gas Inventory of Natural Gas Extraction, Delivery and Electricity Production. DOE/NETL-2011/1522; U.S. Department of Energy. Available online: http://www.canadiancleanpowercoalition.com/files/4713/2630/3388/LA7%20-%20NG-GHG-LCI.pdf (accessed on 19 April 2018).
- Bergerson, J.; Keith, D. Life cycle assessment of Oil Sands Technologies. Institute for Sustainable Energy, Environment and Economy, Calgary. Canada. Available online: https://www.researchgate.net/profile/Joule_Bergerson/publication/228820377_Life_cycle_assessment_of_oil_sands_technologies/links/00b7d522eb534c1d60000000.pdf (accessed on 21 April 2018).
- Statline–Centraal Bureau voor de Statistiek (CBS). Vloeibare Biotransportbrandstoffen; Aanbod, Verbruik en Bijmenging. 2018. Available online: http://statline.cbs.nl/Statweb/publication/?DM=SLNL&PA=71456ned&D1=a&D2=a&D3=12-14&VW=T (accessed on 18 January 2018).
- Statline. Binnenvaart; Goederenvervoer, Voervoerstroom, Soort Lading. 2018. Available online: http://statline.cbs.nl/StatWeb/publication/?VW=T&DM=SLnl&PA=83019NED&LA=nl (accessed on 26 March 2018).
- Statline. Spoorvervoer; Goederenvervoer over Nederlands Spoor, Aan–en Afvoer, Landen. 2018. Available online: http://statline.cbs.nl/StatWeb/publication/?VW=T&DM=SLNL&PA=82513NED&LA=NL (accessed on 26 March 2018).
- Statline. Verkeersprestaties Motorvoertuigen; Kilometers, Voertuigsoort, Grondgebied. 2018. Available online: http://statline.cbs.nl/StatWeb/publication/?VW=T&DM=SLNL&PA=80302ned&LA=NL (accessed on 26 March 2018).
- Statline. Biomassa; Verbruik en Energieproductie Uit Biomassa Per Techniek. Available online: http://statline.cbs.nl/StatWeb/publication/?VW=T&DM=SLNL&PA=82004NED&LA=NL (accessed on 26 March 2018).
- Rijkswaterstaat, Ministery of Infrastructure and Water Management. Klimaatmonitor. 2019. Available online: https://klimaatmonitor.databank.nl/dashboard/ (accessed on 27 March 2018).
- Wang, M. Estimation of Energy Efficiencies of U.S. Gasolineeum Refineries; Center for Transportation Research, Argonne National Laboratory: Lemont, IL, USA, 2008.
- Sadiq, M.A.R.; Ali, Y.K.; Zeiny, A. Effect of ethanol-gasoline blends on exhaust and noise emissions from 4-stroke engine. Eng. Technol. 2011, 29, 1438–1450. [Google Scholar]
- FAO. FAOSTAT, Food and Agriculture Data. 2020. Available online: http://www.fao.org/faostat/en/#home (accessed on 30 June 2020).
- Harjanne, A.; Korhonen, J.M. Abandoning the concept of renewable energy. Energy Policy 2019, 127, 330–340. [Google Scholar] [CrossRef] [Green Version]
- Centraal Bureau voor de Statistiek (CBS). Aandeel Hernieuwbare Energie naar 6.6%. 2018. Available online: https://www.cbs.nl/nl-nl/nieuws/2018/22/aandeel-hernieuwbare-energie-naar-6-6-procent (accessed on 15 April 2018).
- Netherlands Enterprise Agency. Statistics Electric Vehicles in The Netherlands. 2018. Available online: https://www.rvo.nl/onderwerpen/duurzaam-ondernemen/energie-en-milieu-innovaties/elektrisch-rijden/stand-van-zaken/cijfers (accessed on 15 April 2018).
- Rijkswaterstaat, Ministery of Infrastructure and Water Management. White Paper on Offshore Wind Energy. 2014. Available online: https://www.government.nl/documents/reports/2015/01/26/white-paper-on-offshore-wind-energy (accessed on 16 April 2018).
- Miller, S.A. Minimizing Land Use and Nitrogen Intensity of Bioenergy. Environ. Sci. Technol. 2010, 44, 3932–3939. [Google Scholar] [CrossRef]
- Gerbens-Leenes, P.W. Bioenergy water footprints, comparing first, second and third generation feedstocks for bioenergy supply in 2040. Eur. Water 2017, 59, 373–380. [Google Scholar]
- Mekonnen, M.M.; Hoekstra, A.Y. National water footprint accounts: The green, blue and grey water footprint of production and consumption. In Value of Water Research Report Series No. 50; UNESCO-IHE: Delft, The Netherlands, 2011. [Google Scholar]


| Scenario | Dominant Fuel | Primary Energy Sources (PESs) |
|---|---|---|
| Scenario 1 | Dutch transport fuel mix 2016 | Diesel, gasoline, (marine diesel oil (MDO), liquefied petroleum gas (LPG), bioethanol, biodiesel, biogas, electricity (mix of coal, gas, solar, wind) |
| Scenario 2 | Hydrogen | Electricity (natural gas, coal, wind, solar) |
| Scenario 3 | Electricity | Natural gas, coal, wind, solar |
| Scenario 4 | Biofuels | Bioethanol (sugar beet, wheat, wheat straw), biodiesel (rapeseed oil) |
© 2020 by the authors. Licensee MDPI, Basel, Switzerland. This article is an open access article distributed under the terms and conditions of the Creative Commons Attribution (CC BY) license (http://creativecommons.org/licenses/by/4.0/).
Share and Cite
Gerbens-Leenes, W.; Holtz, K. Consequences of Transport Low-Carbon Transitions and the Carbon, Land and Water Footprints of Different Fuel Options in The Netherlands. Water 2020, 12, 1968. https://doi.org/10.3390/w12071968
Gerbens-Leenes W, Holtz K. Consequences of Transport Low-Carbon Transitions and the Carbon, Land and Water Footprints of Different Fuel Options in The Netherlands. Water. 2020; 12(7):1968. https://doi.org/10.3390/w12071968
Chicago/Turabian StyleGerbens-Leenes, Winnie, and Karlieke Holtz. 2020. "Consequences of Transport Low-Carbon Transitions and the Carbon, Land and Water Footprints of Different Fuel Options in The Netherlands" Water 12, no. 7: 1968. https://doi.org/10.3390/w12071968
APA StyleGerbens-Leenes, W., & Holtz, K. (2020). Consequences of Transport Low-Carbon Transitions and the Carbon, Land and Water Footprints of Different Fuel Options in The Netherlands. Water, 12(7), 1968. https://doi.org/10.3390/w12071968


