Metal Mobilization As An Effect of Anthropogenic Contamination in Groundwater Aquifers in Tutuila, American Samoa

 , , ,
, , ,
Abstract
:1. Introduction
2. Materials and Methods
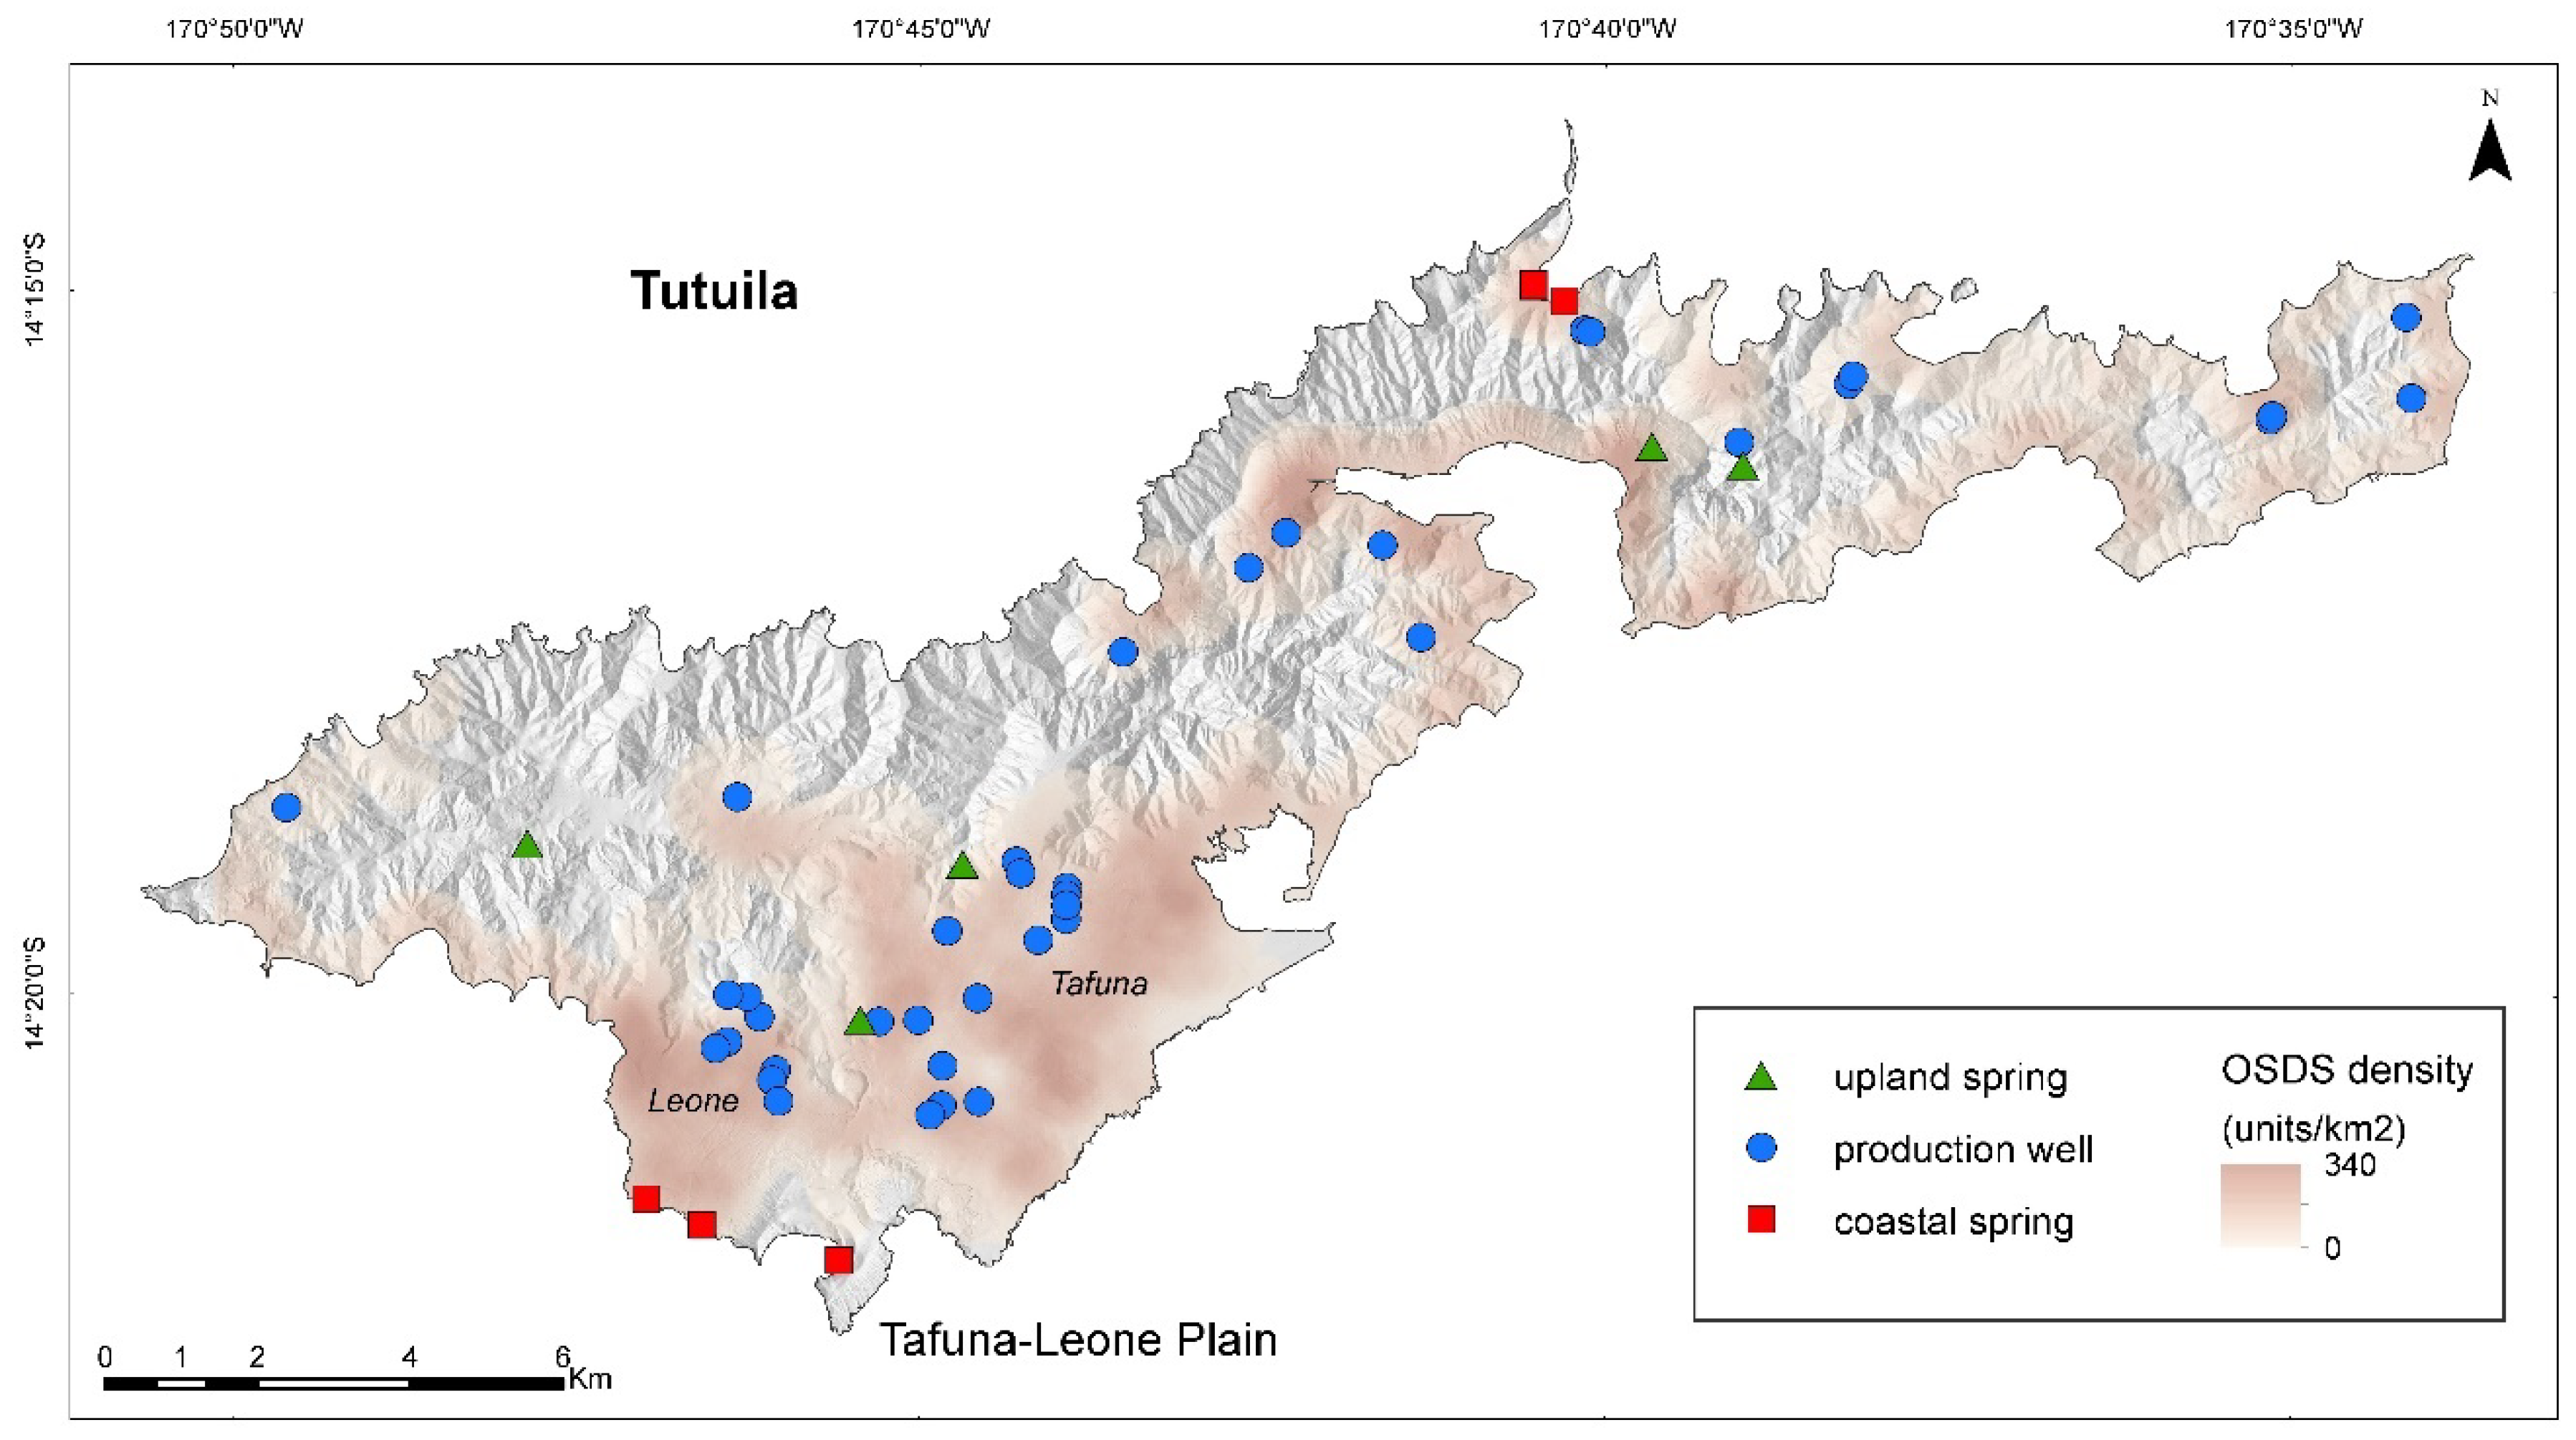
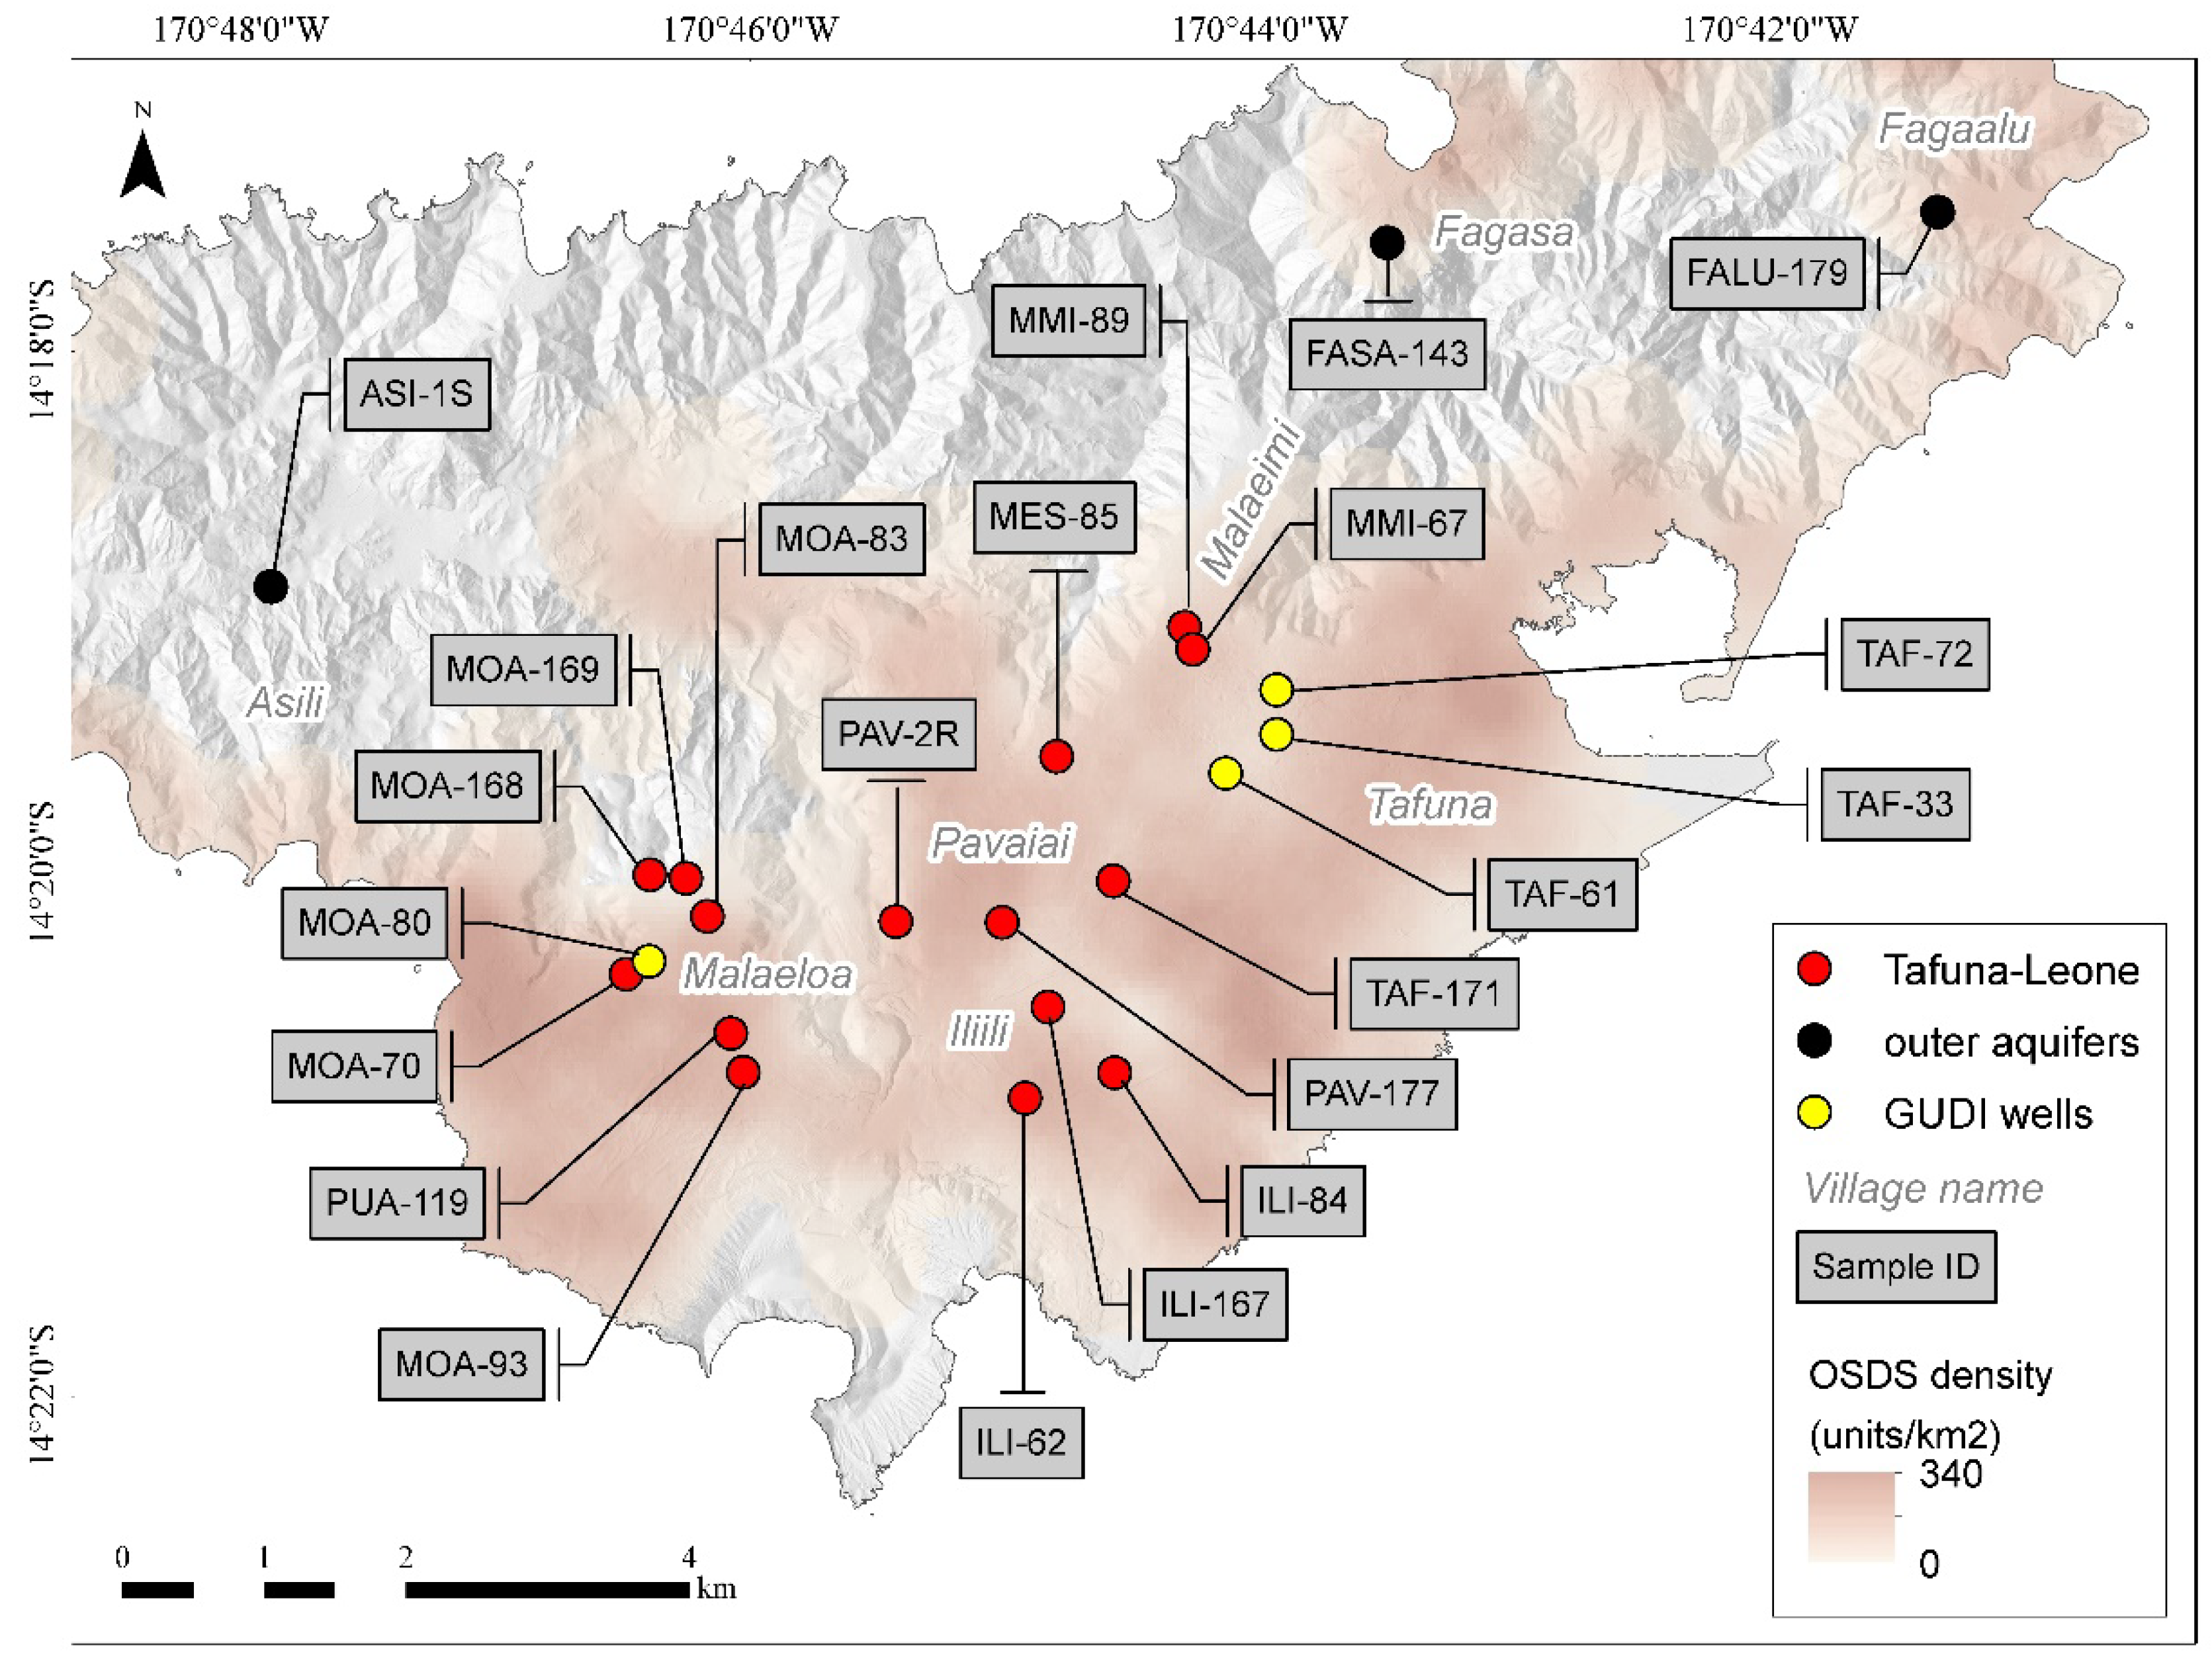
2.1. Site Location and Sampling
2.2. Chemical Analysis
2.3. Human Impact Levels and Statistical Analysis
3. Results
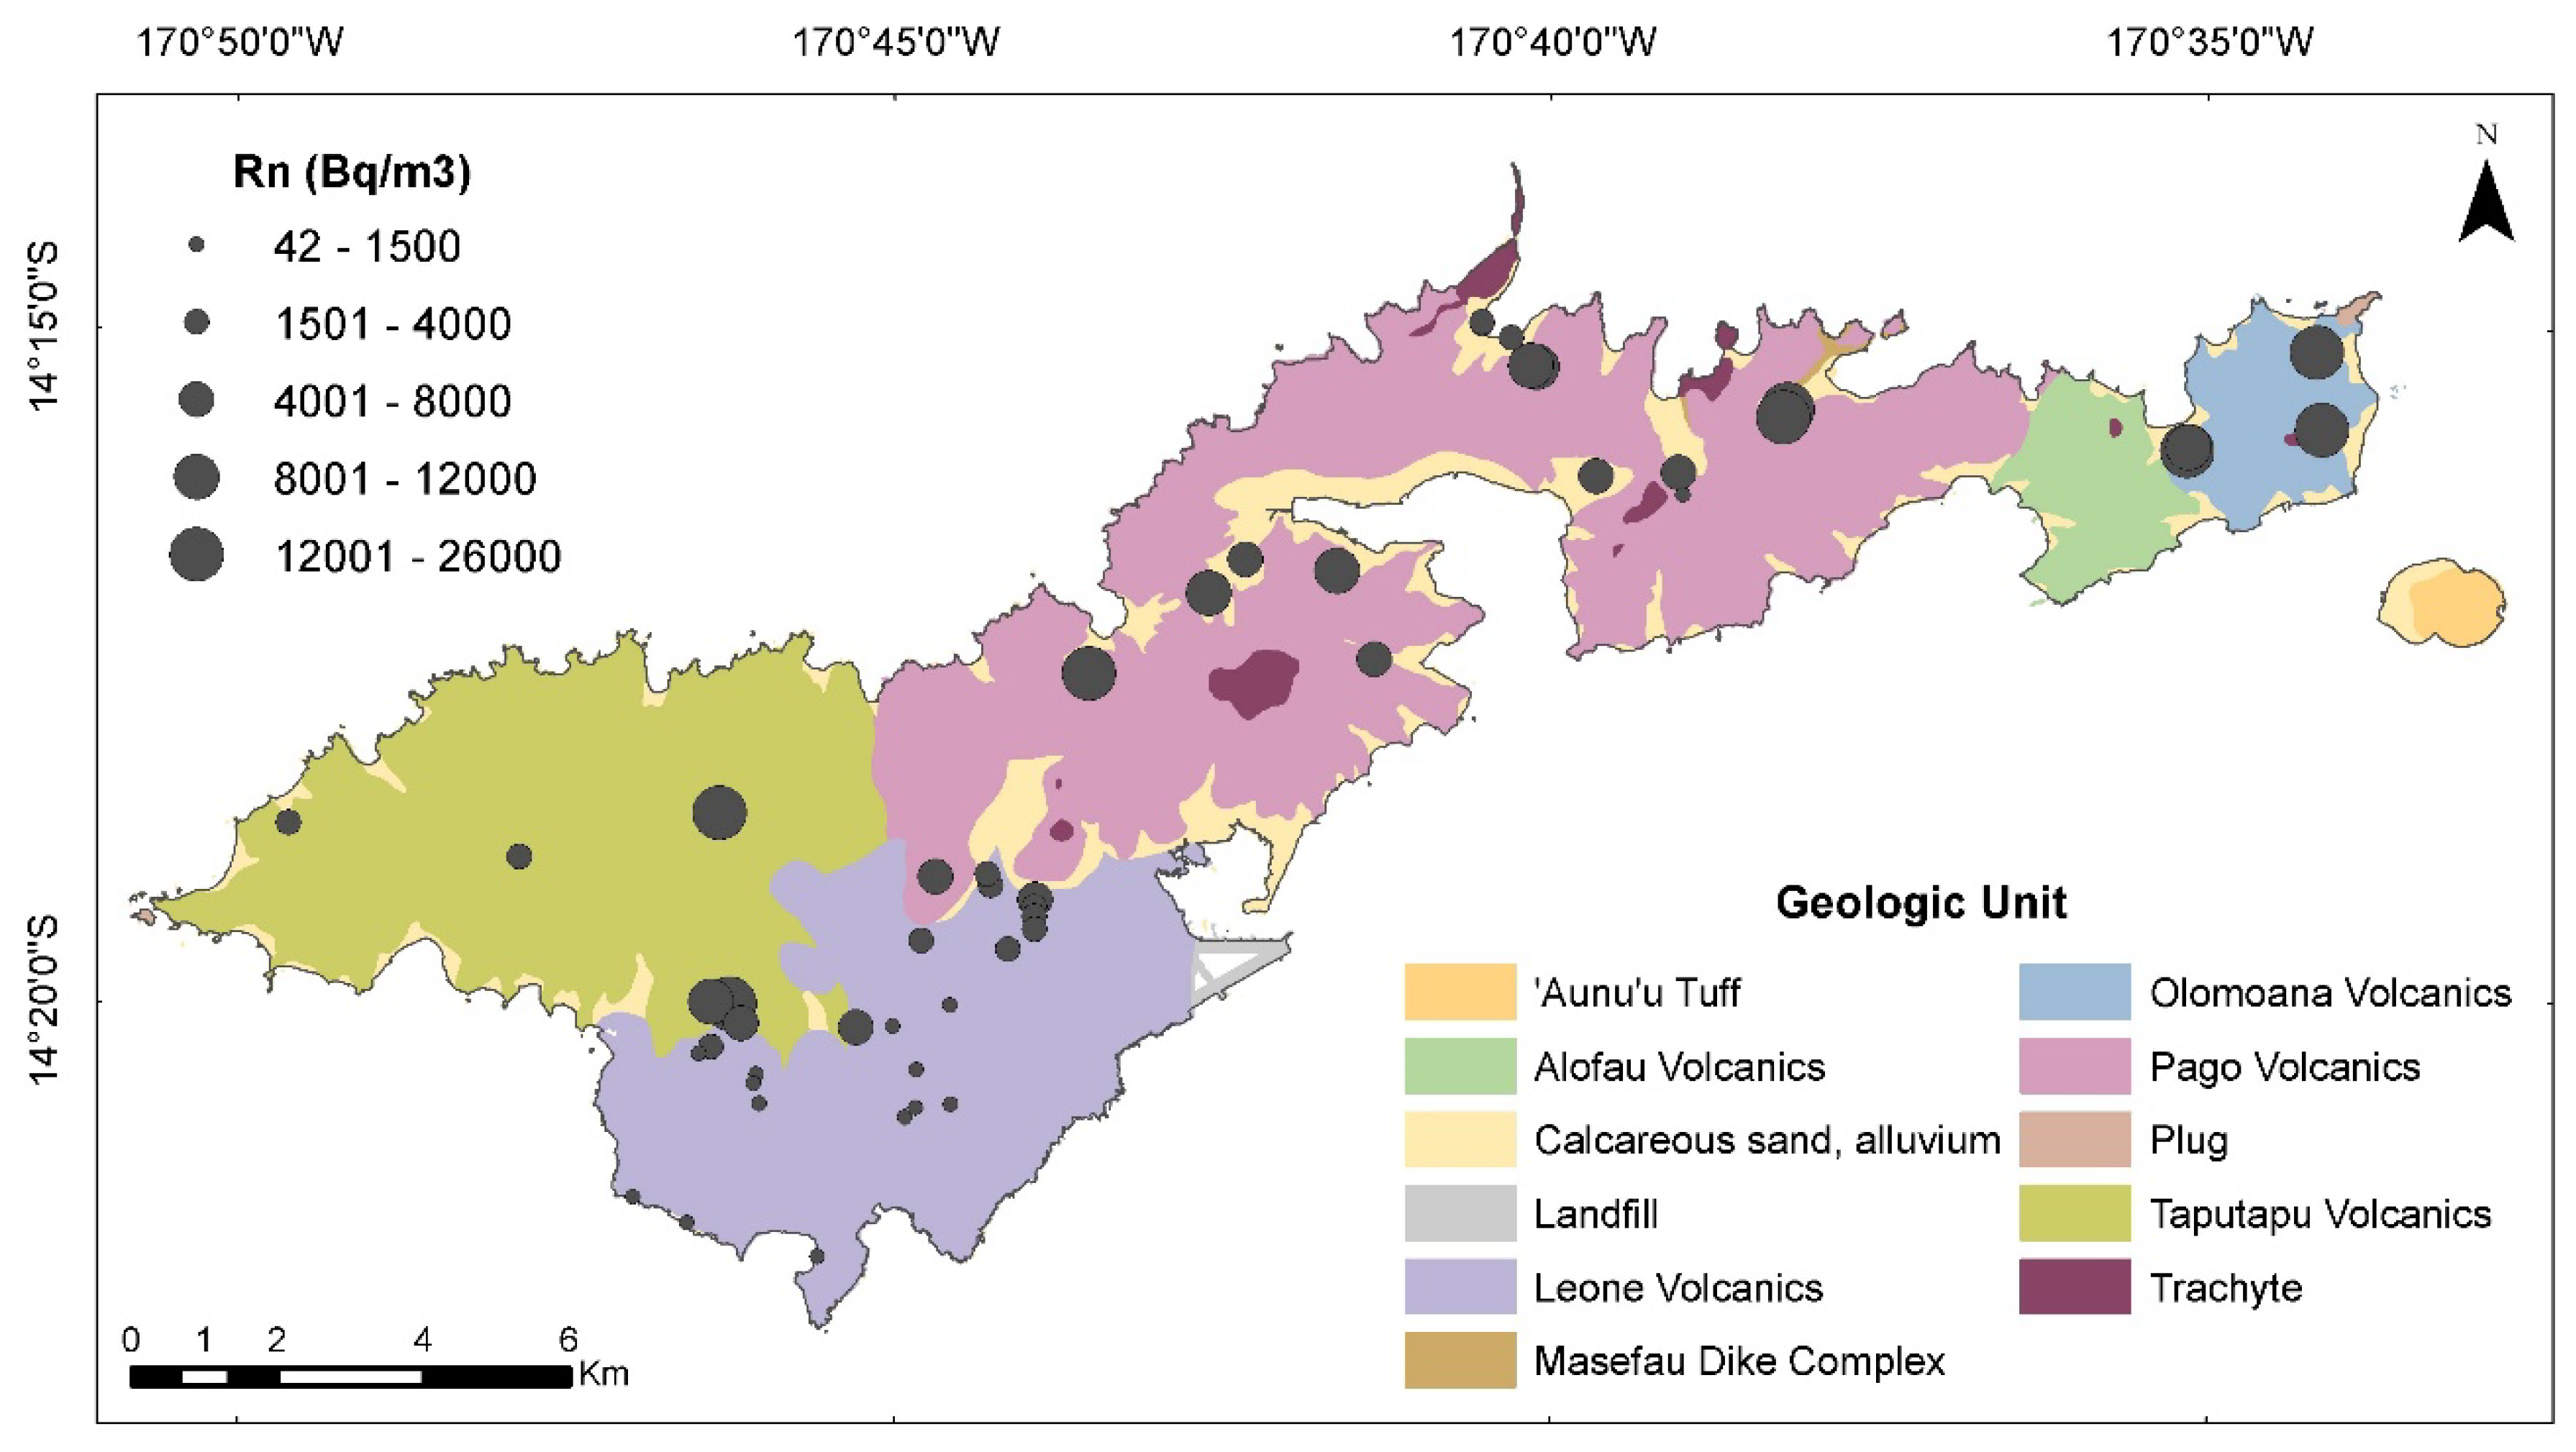
3.1. Radon
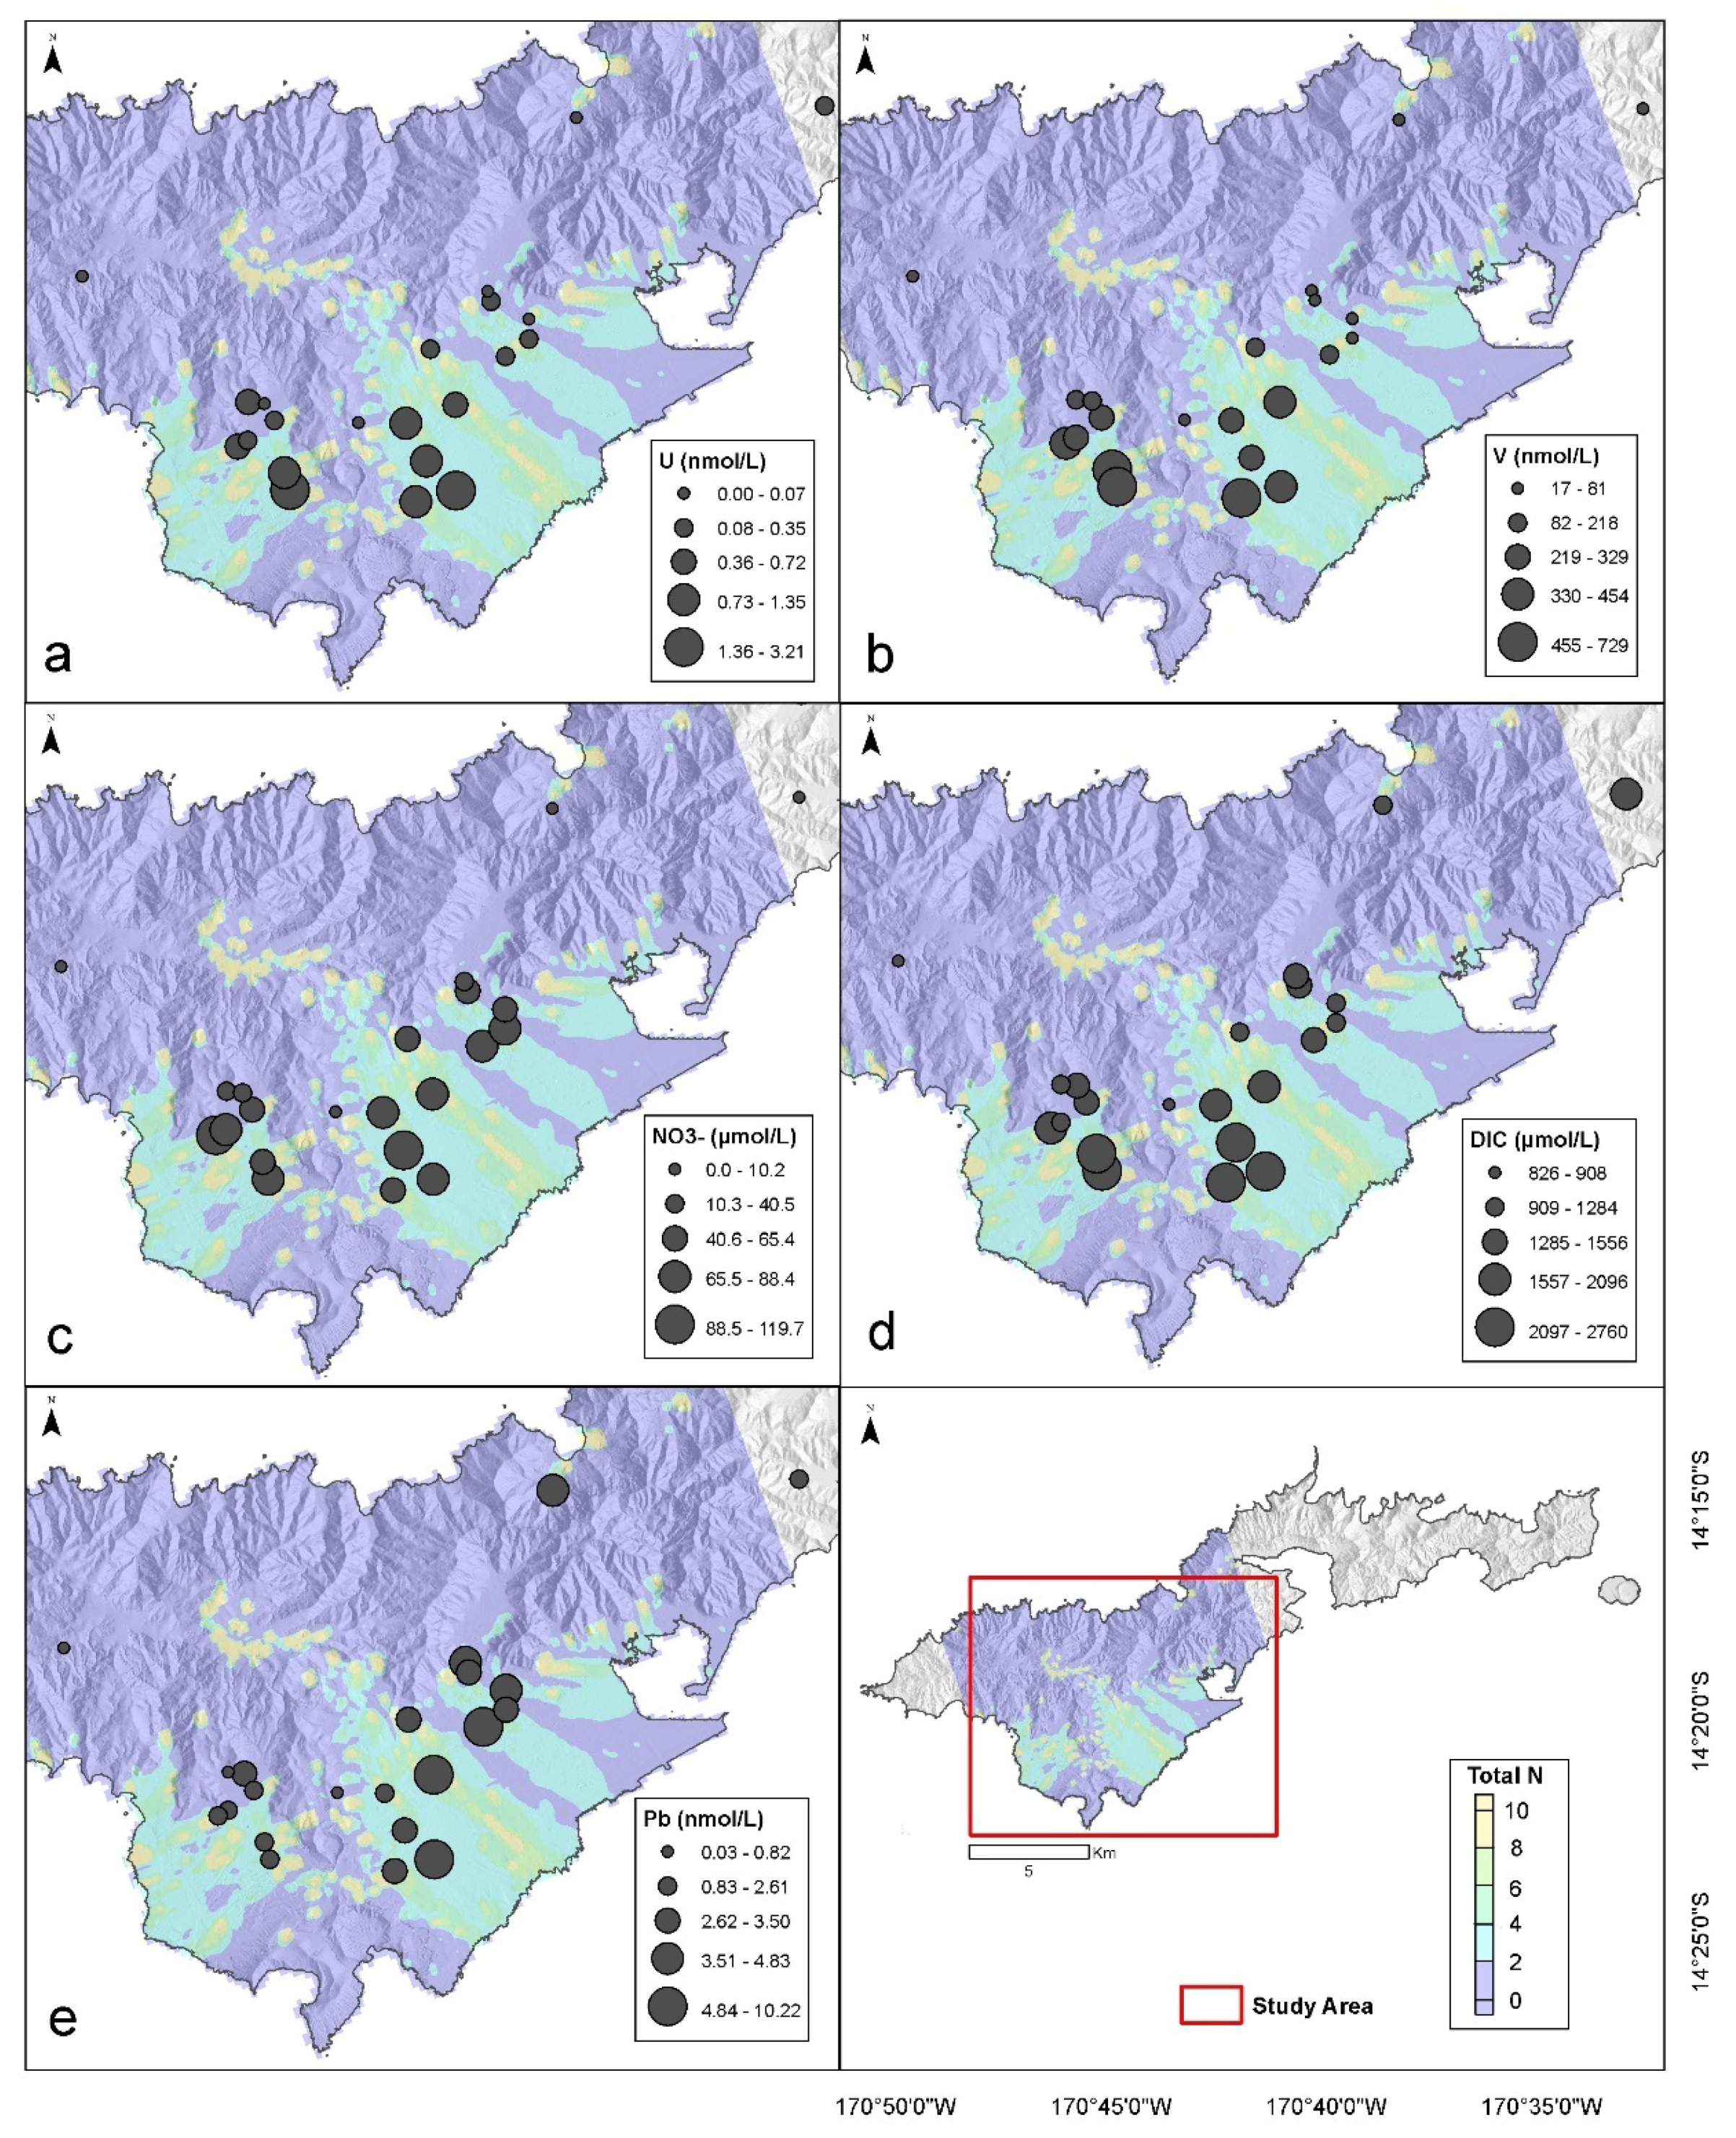
3.2. Uranium, Vanadium, and Nutrients
3.3. Dissolved Inorganic Carbon
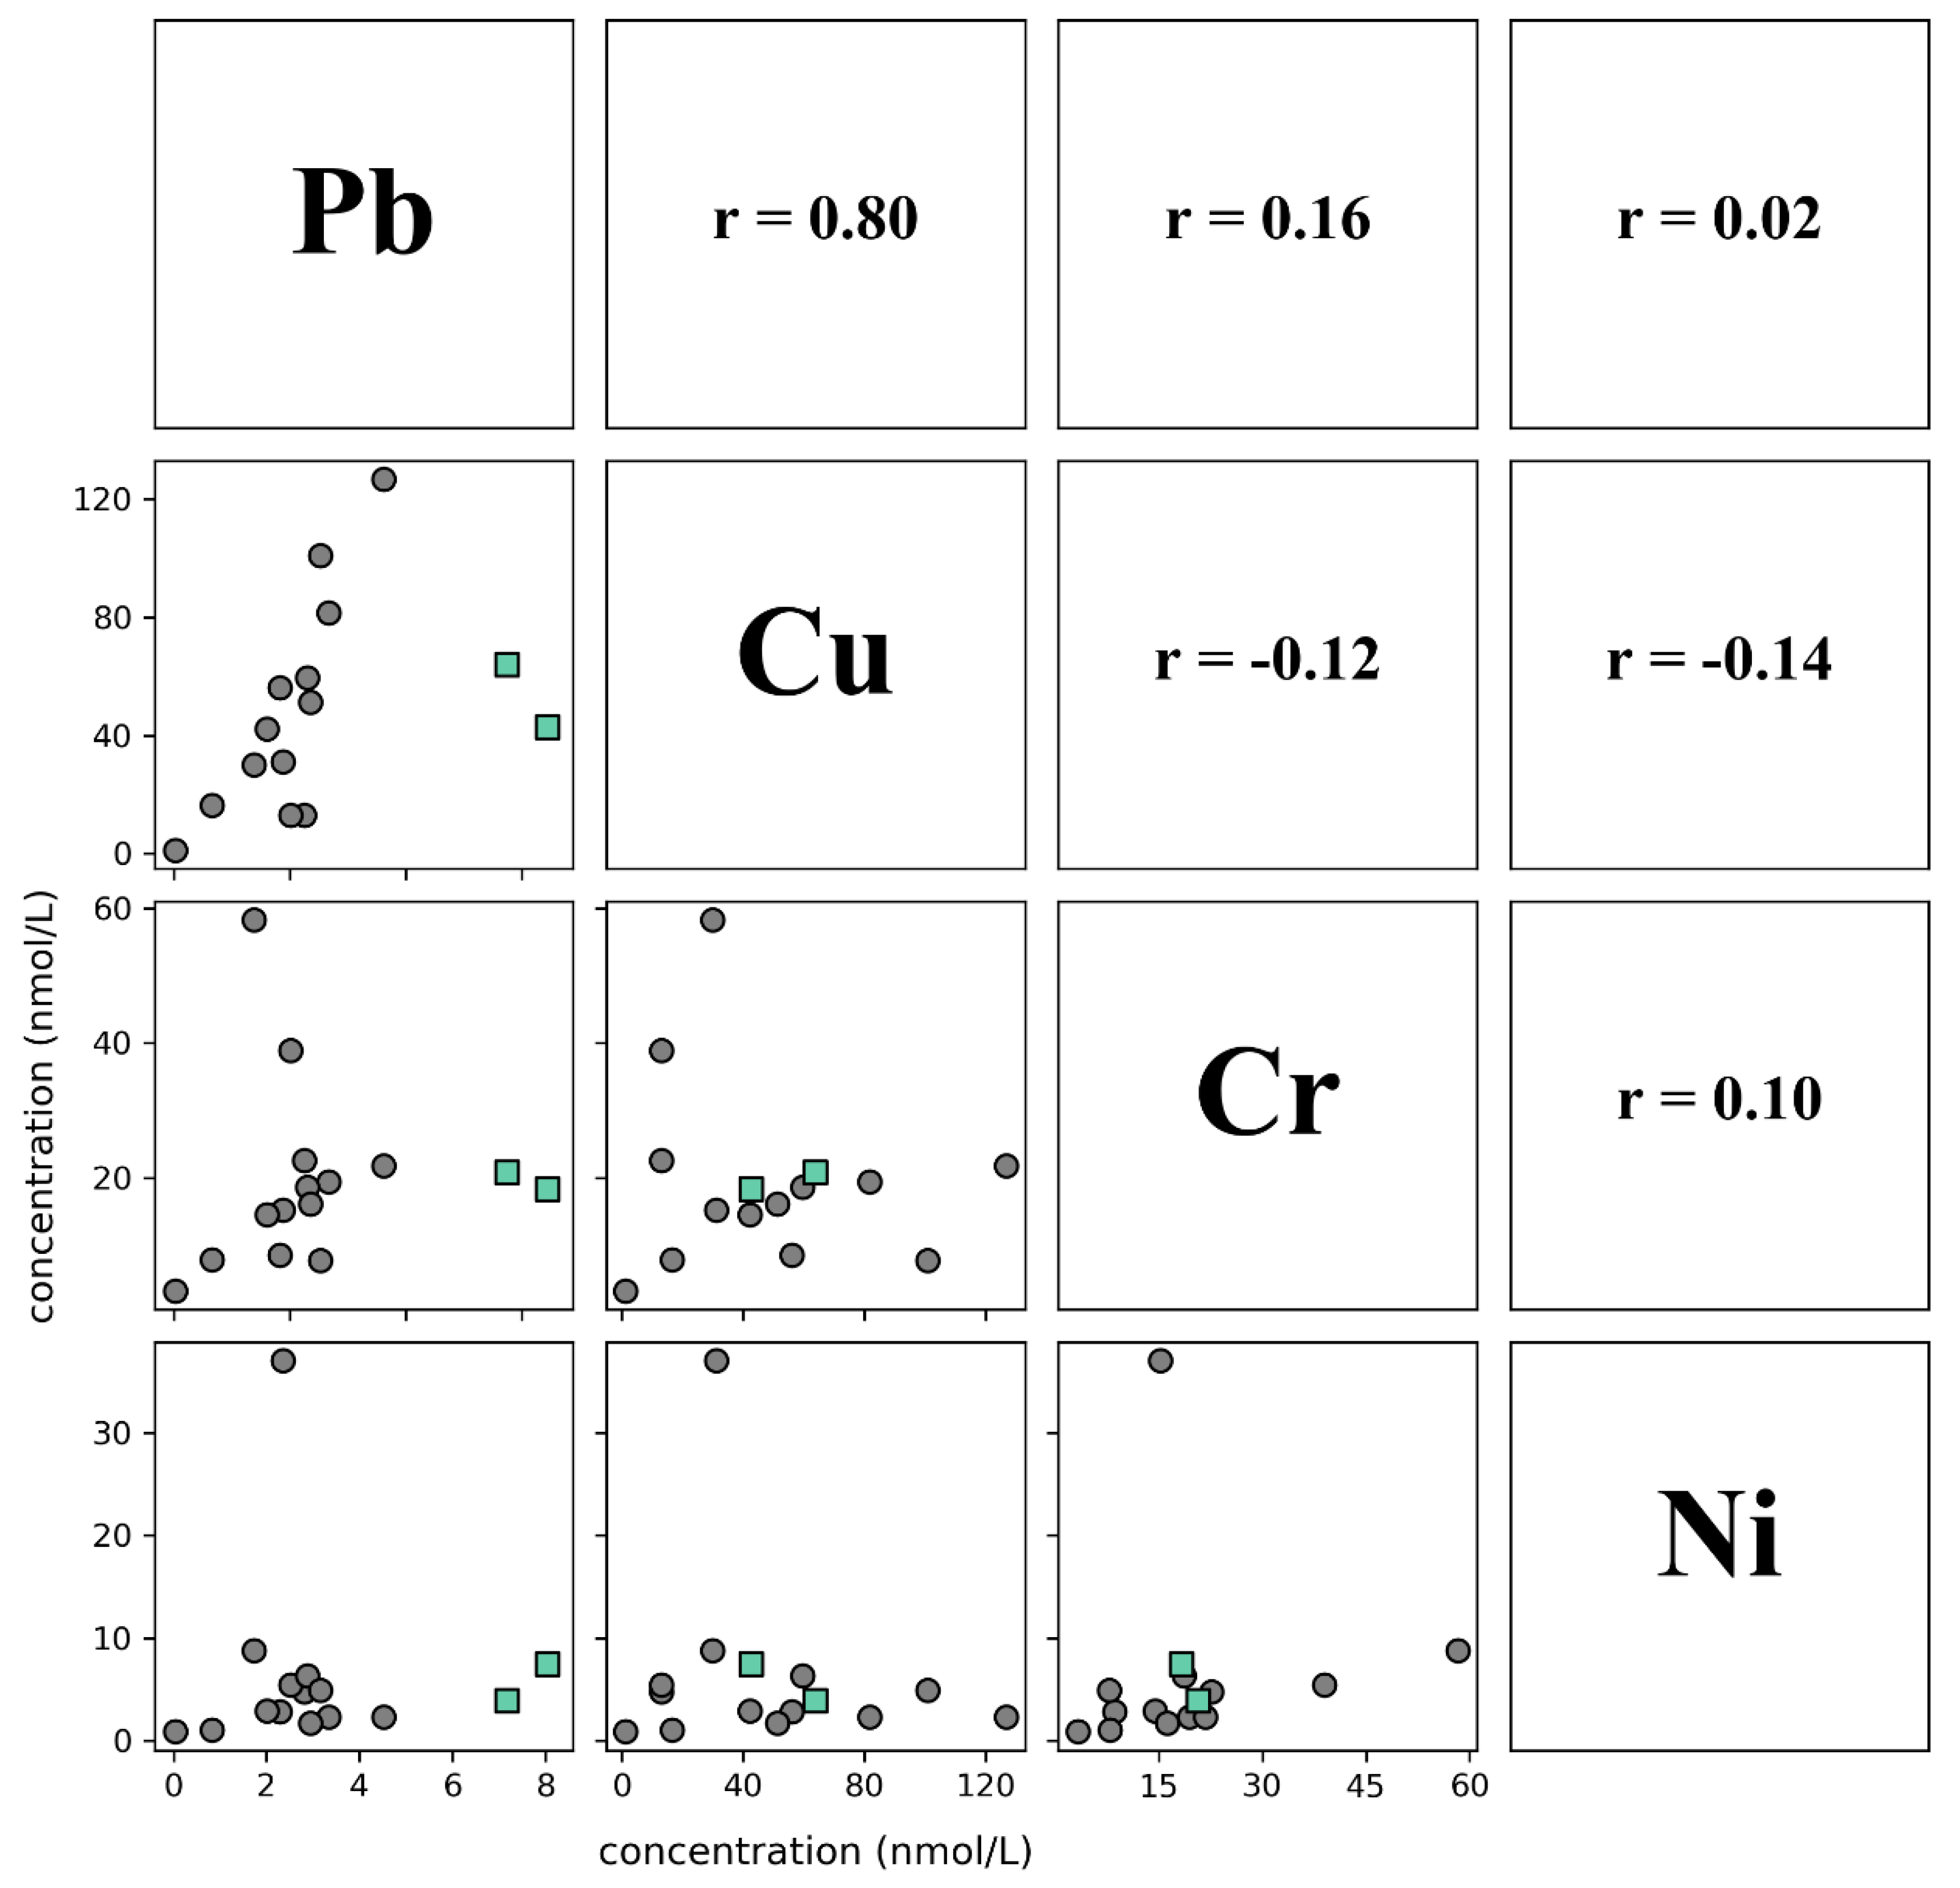
3.4. Lead, Copper, Chromium, Nickel
4. Discussion
4.1. Remobilization of U and V
4.2. Formation of Soluble Carbonate Complexes
4.3. Naturally Sourced Pb, Cu, Cr, Ni
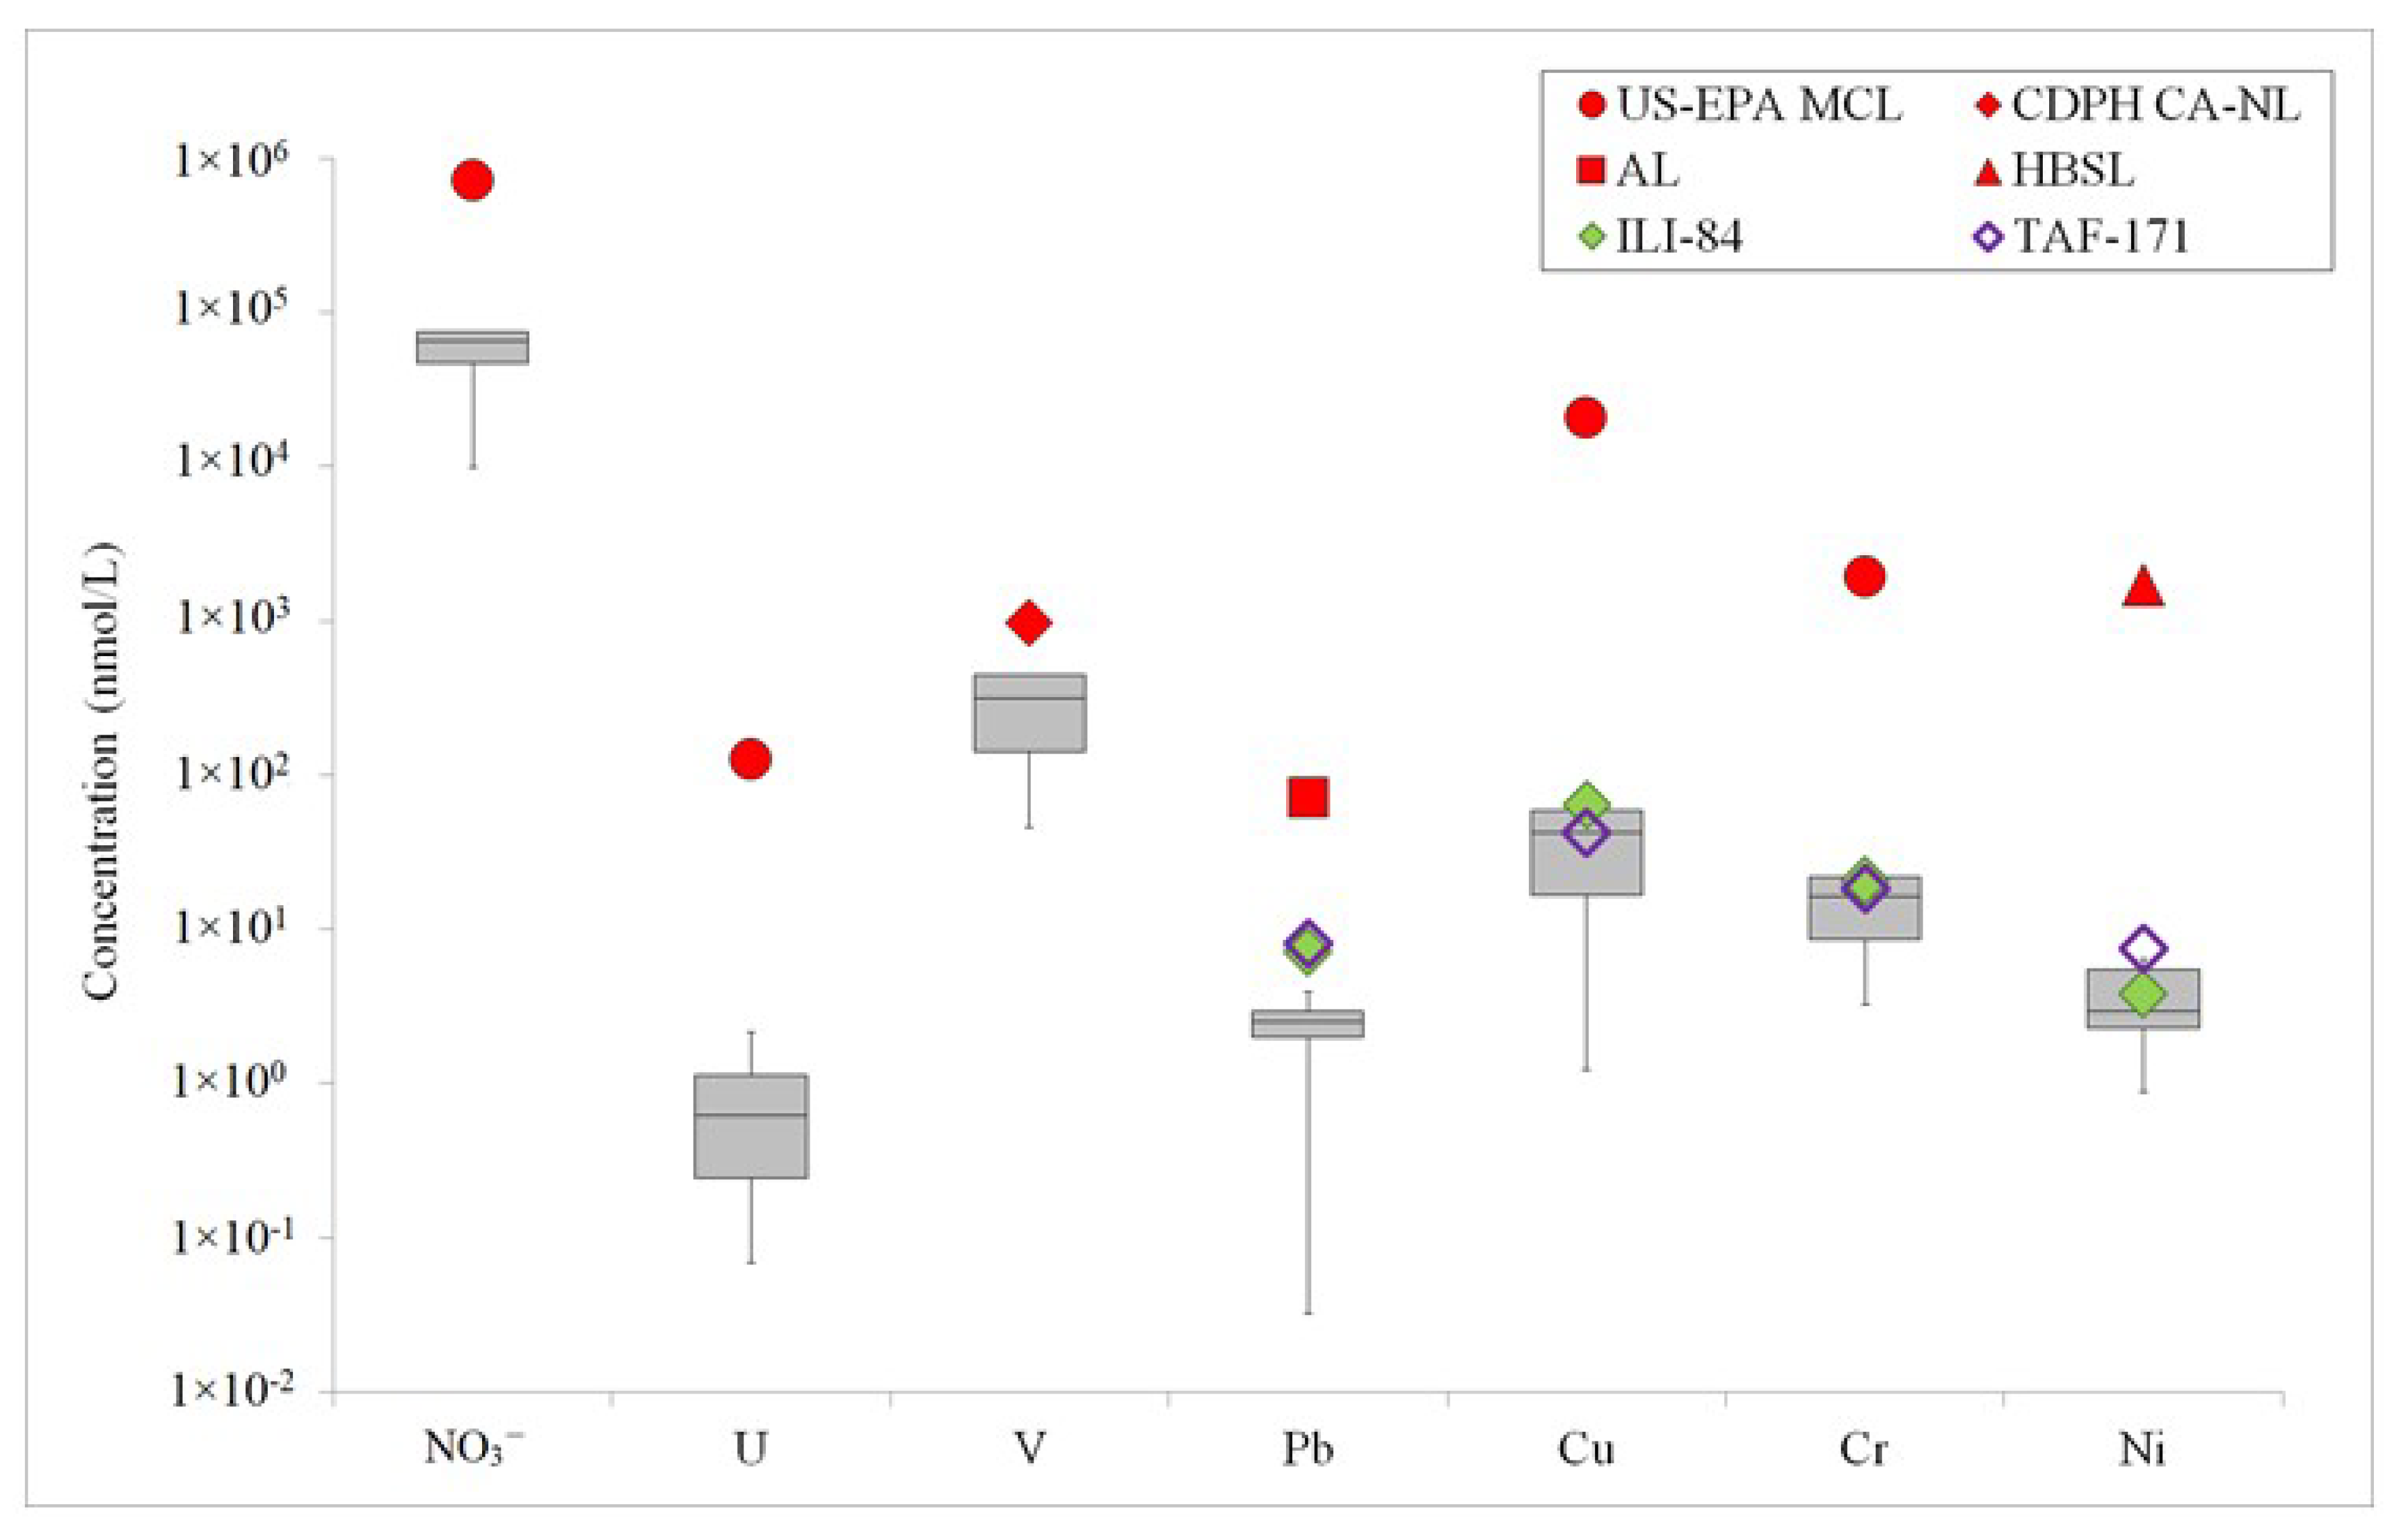
4.4. Comparison of Trace Metal Chemistry in Similar Environments
5. Conclusions
- Elevated levels of anthropogenically-sourced NO3− are positively correlated with U and V concentrations. The NO3− likely acts as an electron acceptor, oxidizing U and V, making them soluble and mobile in the groundwater.
- Elevated DIC concentrations in the Tafuna–Leone Plain are most likely a result of anthropogenic organic matter and are positively correlated with NO3−, U, and V. DIC forms soluble complexes with U and V, thus mobilizing both in the groundwater.
- Observed groundwater concentrations of Pb, Cu, Cr, and Ni were all relatively low and positively correlated with each other. This indicates that trace metals, including U and V, in sampled groundwaters are assumed to be sourced from natural dissolution of aquifer materials rather than anthropogenically sourced. This further justifies the hypothesis that the increased U and V concentrations are due to remobilization initiated by NO3− and DIC.
Supplementary Materials
Author Contributions
Funding
Acknowledgments
Conflicts of Interest
References
- Edworthy, K.J. Groundwater development for oceanic island communities. In Hydrogeology in the Service of Man; IAHS Publication: Cambridge, UK, 1985; Volume 2, pp. 65–75. Available online: http://hydrologie.org/redbooks/a154/iahs_154_02_0065.pdf (accessed on 23 July 2020).
- Shuler, C.K.; El-Kadi, A.I.; Dulai, H.; Glenn, C.R.; Fackrell, J. Source partitioning of anthropogenic groundwater nitrogen in a mixed-use landscape, Tutuila, American Samoa. Hydrogeol. J. 2017, 25, 2419–2434. [Google Scholar] [CrossRef]
- AS-DOC (American Samoa Department of Commerce). 2013 Statistical Yearbook for American Samoa. Available online: http://doc.as.gov/wp-content/uploads/2011/06/2013-Statistical-Yearbook-Final-Draft.pdf (accessed on 25 March 2020).
- Shuler, C.K.; Dulai, H.; DeWees, R.; Kirs, M.; Glenn, C.R.; El-Kadi, A.I. Isotopes, Microbes, and Turbidity: A Multi-Tracer Approach to Understanding Recharge Dynamics and Groundwater Contamination in a Basaltic Island Aquifer. Ground Water Monit. Remediat. 2019, 39, 20–35. [Google Scholar] [CrossRef] [Green Version]
- Comeros-Raynal, M.T.; Lawrence, A.; Sudek, M.; Vaeoso, M.; McGuire, K.; Regis, J.; Houk, P. Applying a ridge-to-reef framework to support watershed, water quality, and community-based fisheries management in American Samoa. Coral Reefs 2019, 38, 505–520. [Google Scholar] [CrossRef]
- Nolan, J.; Weber, K.A. Natural Uranium Contamination in Major U.S. Aquifers Linked to Nitrate. Environ. Sci. Tech. Let. 2015, 2, 215–220. [Google Scholar] [CrossRef] [Green Version]
- Burow, K.R.; Nolan, B.T.; Rupert, M.G.; Dubrovsky, N.M. Nitrate in Groundwater of the United States, 1991-2003. Environ. Sci. Technol. 2010, 44, 4988–4997. [Google Scholar] [CrossRef] [PubMed]
- Zhou, P.; Gu, B. Extraction of Oxidized and Reduced Forms of Uranium from Contaminated Soils: Effects of Carbonate Concentration and pH. Environ. Sci. Technol. 2005, 39, 4435–4440. [Google Scholar] [CrossRef]
- Wright, M.T.; Stollenwerk, K.G.; Belitz, K. Assessing the solubility controls on vanadium in groundwater, northeastern San Joaquin Valley, CA. Appl. Geochem. 2014, 48, 41–52. [Google Scholar] [CrossRef]
- Cumberland, S.A.; Douglas, G.; Grice, K.; Moreau, J.W. Uranium mobility in organic matter-rich sediments: A review of geological and geochemical processes. Earth-Sci. Rev. 2016, 159, 160–185. [Google Scholar] [CrossRef] [Green Version]
- Thomas, D.M.; Cuff, K.E. The association between ground gas radon variations and geologic activity in Hawaii. J. Geophys. Res. 1986, 91, 12186–12198. [Google Scholar] [CrossRef]
- Michel, J. Relationship of radium and radon with geological formations. In Radon, Radium and Uranium in Drinking Water; Cothern, C.R., Rebers, P.A., Eds.; Lewis Publishers, Inc.: Chelsea, MI, USA, 1991; pp. 83–95. Available online: https://books.google.com/books?hl=en&lr=&id=HU5ZDwAAQBAJ&oi=fnd&pg=PA83&dq=relationship+of+radium+and+radon+with+geological+formations&ots=G4axh_2-Ac&sig=1EIO_JC3EuvDbjTpmmEPhJtg2p4#v=onepage&q=relationship%20of%20radium%20and%20radon%20with%20geological%20formations&f=false (accessed on 23 July 2020).
- Hoehn, E.; von Gunten, H.R. Radon in Groundwater: A Tool to Assess Infiltration from Surface Waters to Aquifers. Water Resour. Res. 1989, 25, 1795–1803. [Google Scholar] [CrossRef] [Green Version]
- U.S. EPA. Basic Information about Radon in Drinking Water. Available online: https://archive.epa.gov/water/archive/web/html/basicinformation-2.html (accessed on 1 December 2019).
- Izuka, S.K.; Perreault, J.A.; Presley, T.K. Areas contributing recharge to wells in the Tafuna-Leone plain, Tutuila, American Samoa. In U.S. Geological Survey Scientific Investigations Report 2007-5167; USGS: Reston, VA, USA, 2007; 51p. Available online: https://pubs.usgs.gov/sir/2007/5167/#pdf (accessed on 23 July 2020).
- Armstrong, F.A.J.; Sterns, C.R.; Strickland, J.D.H. The measurement of upwelling and subsequent biological processes by means of the Technicon AutoAnalyzer and associated equipment. Deep-Sea Res. 1967, 14, 381–389. [Google Scholar]
- Grasshoff, K.; Ehrhardt, M.; Kremling, K. Methods of Seawater Analysis, 2nd ed.; Wiley-VCH: Weinheim, Germany, 1983; Available online: https://www.researchgate.net/profile/Meinrat_Andreae/publication/325091261_Arsenic_antimony_and_germanium_in_Methods_of_Seawater_Analysis_edited_by_K_Grasshof_K_Kremling_M_Ehrhard_pp_274-294_Wiley-VCH_Weinheim_1999/links/5af5b9b1aca2720af9c6af66/Arsenic-antimony-and-germanium-in-Methods-of-Seawater-Analysis-edited-by-K-Grasshof-K-Kremling-M-Ehrhard-pp-274-294-Wiley-VCH-Weinheim-1999.pdf (accessed on 23 July 2020).
- Shiller, A.M. Syringe filtration methods for examining dissolved and colloidal trace element distributions in remote field locations. Environ. Sci. Technol. 2003, 37, 3953–3957. [Google Scholar] [CrossRef] [PubMed]
- Thornberry-Ehrlich, T. National Park of American Samoa Geologic Resource Evaluation Report. In Natural Resource Report NPS/NRPC/GRD/NRR-2008/025; National Park Service: Denver, CO, USA, 2008. [Google Scholar]
- Stanton, M.R.; Wanty, R.B.; Lawrence, E.P.; Briggs, P.H. Dissolved Radon and Uranium, and Ground-Water Geochemistry in an Area near Hylas, Virgina. In U.S. Geological Survey Bulletin 2070; USGS: Reston, VA, USA, 1996; 23p. Available online: https://books.google.com/books?hl=en&lr=&id=bm0u3D2IW94C&oi=fnd&pg=PA1&dq=stanton+dissolved+radon+and+uranium&ots=7nK7IaOLo8&sig=MjhbECbmJcSub-BV7jZW-7F4b2Q#v=onepage&q=stanton%20dissolved%20radon%20and%20uranium&f=false (accessed on 23 July 2020).
- McDougall, I. Age and Evolution of the Volcanoes of Tutuila, American Samoa. Pac. Sci. 1987, 39, 311–320. [Google Scholar]
- Stearns, H.T. Geology of the Samoan Islands. Bull. Geol. Soc. Am. 1944, 55, 1279–1333. [Google Scholar] [CrossRef]
- Setwyn, L.; Vold, S.; Regis, J.; Banks, K.; Gambatese, J. AS-EPA and ASPA Report: Groundwater under the Direct Influence of Surface Water Study Well 080; American Samoa Power Authority: Pago Pago, AS, USA, 2012; 10p. [Google Scholar]
- Vold, S.; Regis, J.; Banks, K.; Gambatese, J. AS-EPA and ASPA Report: Groundwater under the Direct Influence of Surface Water Study Well 033; American Samoa Power Authority: Pago Pago, AS, USA, 2012; 9p. [Google Scholar]
- Vold, S.; Regis, J.; Gambatese, J. AS-EPA and ASPA Report: Groundwater under the Direct Influence of Surface Water Study Well 072; American Samoa Power Authority: Pago Pago, AS, USA, 2012; 9p. [Google Scholar]
- Vold, S.; Regis, J.; Gambatese, J. AS-EPA and ASPA Report: Groundwater under the Direct Influence of Surface Water Study Well 061; American Samoa Power Authority: Pago Pago, AS, USA, 2013; 8p. [Google Scholar]
- Hunt, C.D., Jr.; Rosa, S.N. A multitracer approach to detecting waste-water plumes from municipal injection wells in nearshore marine waters at Kihei and Lahaina, Maui, Hawaii. In U.S. Geol Surv Sci Invest Report 2009–5253; USGS: Reston, VA, USA, 2009; 166p. Available online: https://pubs.usgs.gov/sir/2009/5253/ (accessed on 23 July 2020).
- Clark, I.; Fritz, P. Environmental Isotopes in Hydrogeology; CRC Press: Boca Raton, FL, USA, 1997; 352p. [Google Scholar]
- Reimann, C.; Kashulina, G.; de Caritat, P.; Niskavaara, H. Multi-element, multi-medium regional geochemistry in the European Arctic: Element concentration, variation and correlation. Appl Geochem. 2001, 16, 759–780. [Google Scholar] [CrossRef]
- Morford, J.L.; Emerson, S.R.; Breckel, E.J.; Kim, S.H. Diagenesis of oxyanions (V, U, Re, and Mo) in pore waters and sediments from a continental margin. Geochim. Cosmochim. Acta 2005, 21, 5021–5032. [Google Scholar] [CrossRef]
- Moon, H.S.; Komlos, J.; Jaffe, P.R. Uranium Reoxidation in Previously Bioreduced Sediment by Dissolved Oxygen and Nitrate. Environ. Sci. Technol. 2007, 41, 4587–4592. [Google Scholar] [CrossRef]
- van Berk, W.; Fu, Y. Redox roll-front mobilization of geogenic uranium by nitrate input into aquifers: Risk for groundwater resources. Environ. Sci. Technol. 2017, 51, 337–345. [Google Scholar] [CrossRef]
- Senko, J.M.; Istok, J.D.; Suflita, J.M.; Krumholz, L.R. In-Situ Evidence for Uranium Immobilization and Remobilization. Environ. Sci. Technol. 2002, 36, 1491–1496. [Google Scholar] [CrossRef]
- World Health Organization. Nitrate and Nitrite in Drinking-Water: Background Document for Development of WHO Guidelines for Drinking-Water Quality; World Health Organization: Geneva, Switzerland, 2003; 16p. [Google Scholar]
- Schullehner, J.; Stayner, L.; Hansen, B. Nitrate, nitrite, and ammonium variability in drinking water distribution systems. Int. J. Environ. Res. Public Health 2017, 14, 276. [Google Scholar] [CrossRef] [Green Version]
- Libes, S. Introduction to Marine Biogeochemistry; Academic Press: Cambridge, MA, USA, 2011. [Google Scholar]
- Langmuir, D. Aqueous Environmental Geochemistry; Prentice Hall: Upper Saddle River, NJ, USA, 1997; 600p. [Google Scholar]
- Rose, S.; Long, A. Monitoring dissolved oxygen in ground water: Some basic considerations. Ground Water Monit. Remediat. 1988, 8, 93–97. [Google Scholar] [CrossRef]
- Ayotte, J.D.; Gronberg, J.M.; Apodaca, L.E. Trace elements and radon in groundwater across the United States, 1992-2003. In U.S. Geological Survey Scientific Investigations Report 2001-5059; USGS: Reston, VA, USA, 2011; 115p. Available online: https://pubs.usgs.gov/sir/2011/5059/ (accessed on 23 July 2020).
- Richardson, C.M.; Dulai, H.; Whittier, R.B. Sources and spatial variability of groundwater-delivered nutrients in Maunalua Bay, O‘ahu, Hawai‘i. J. Hydrol. Reg. Stud. 2017, 11, 178–193. [Google Scholar] [CrossRef] [Green Version]
- U.S. Census Bureau. American Samoa Demographic Profile Summary File. Available online: https://www.census.gov/prod/cen2010/doc/dpsfas.pdf (accessed on 20 October 2016).
- Wright, M.T.; Belitz, K. Factors Controlling the Regional Distribution of Vanadium in Groundwater. GroundWater 2010, 48, 515–525. [Google Scholar] [CrossRef]
- Shiller, A.M.; Boyle, E.A. Dissolved vanadium in rivers and estuaries. Earth Planet. Sci. Lett. 1987, 86, 214–224. [Google Scholar] [CrossRef]
- Krishnaiah, G.; Langan, L.V.; Rudesill, J.A.; Cheng, W.-C. Oxygen partial pressure effects on vanadium mobility and catalyst deactivation in a simulated FCCU regenerator. Stud. Surf. Sci. Catal. 2004, 149, 189–202. [Google Scholar]
- Wehrli, B.; Stumm, W. Vanadyl in natural waters: Adsorption and hydrolysis promote oxygenation. Geochim. Cosmochim. Acta 1989, 53, 69–77. [Google Scholar] [CrossRef]
- Huang, J.-H.; Huang, F.; Evans, L.; Glasauer, S. Vanadium: Global (bio)geochemistry. Chem. Geol. 2015, 417, 68–89. [Google Scholar] [CrossRef]
- Glenn, S.M.; Lester, L.J. An analysis of the relationship between land use and arsenic, vanadium, nitrate and boron contamination in the Gulf Coast aquifer of Texas. J. Hydrol. 2010, 389, 214–226. [Google Scholar] [CrossRef]
- Bentley, C.B. Ground-water resources of American Samoa with emphasis on the Tafuna-Leone Plain, Tutuila Island. In No. 75-29. U.S. Geological Survey Water-Resources Investigations; USGS: Reston, VA, USA, 1975; 33p. Available online: https://www.usgs.gov/media/files/American-Samoa-reports (accessed on 14 December 2016).
- Miyajima, T.; Tsuboi, Y.; Tanaka, Y.; Koike, I. Export of inorganic carbon from two Southeast Asian mangrove forests to adjacent estuaries as estimated by the stable isotope composition of dissolved inorganic carbon. J. Geophys. Res. 2009, 114, GO1024. [Google Scholar] [CrossRef]
- Richardson, C.M.; Dulai, H.; Popp, B.N.; Ruttenberg, K.; Fackrell, J.K. Submarine groundwater discharge drives biogeochemistry in two Hawaiian reefs. Limnol. Oceanogr. 2017, 62, S348–S363. [Google Scholar] [CrossRef]
- Griffith, D.R.; Barnes, R.T.; Raymond, P.A. Inputs of Fossil Carbon from Wastewater Treatment Plants to U.S. Rivers and Oceans. Environ. Sci. Technol. 2009, 43, 5647–5651. [Google Scholar] [CrossRef] [PubMed]
- Maher, K.; Bargar, J.R.; Brown, G.E., Jr. Environmental Speciation of Actinides. Inorg. Chem. 2013, 52, 3510–3532. [Google Scholar] [CrossRef] [PubMed]
- U.S. EPA. Drinking Water Requirements for States and Public Water Systems: Radionuclide Rules. Available online: https://www.epa.gov/dwreginfo/radionuclides-rule (accessed on 20 October 2016).
- ATSDR. Public Health Statement for Vanadium. Available online: https://www.atsdr.cdc.gov/ToxProfiles/tp58-c1.pdf (accessed on 20 October 2016).
- Walther, J.V. Earth’s Natural Resources, 1st ed.; Jones & Bartlett Learning: Massachusetts, MA, USA, 2014. [Google Scholar]
- Evangelou, A.M. Vanadium in cancer treatment. Crit. Rev. Oncol. Hemat. 2002, 42, 249–265. [Google Scholar] [CrossRef]
- U.S. EPA. Basic Information about Lead in Drinking Water. Available online: https://www.epa.gov/ground-water-and-drinking-water/basic-information-about-lead-drinking-water#regs (accessed on 1 December 2016).
- Whitall, D.; Rice, S.H. Pollution in surface sediments in Faga’alu Bay, Tutuila, American Samoa; NOAA Technical Memorandum NOS/NCCOS 201; Silver Spring: MD, USA, 2015; 54p. Available online: https://repository.library.noaa.gov/view/noaa/16193 (accessed on 23 July 2020).
- Karavoltsos, S.; Sakellari, A.; Mihopoulos, N.; Dassenakis, M.; Scoullos, M.J. Evaluation of the quality of drinking water in regions of Greece. Desalination 2008, 224, 317–329. [Google Scholar] [CrossRef]
- Falta, R.W.; Bulsara, N.; Henderson, J.K.; Mayer, R.A. Leaded-gasoline additives still contaminate groundwater. Environ. Sci. Technol. 2005, 39, 379A–384A. [Google Scholar] [CrossRef]
- Polidoro, B.A.; Comeros-Raynal, M.T.; Cahill, T.; Clement, C. Land-based sources of marine pollution: Pesticides, PAHs and phthalates in coastal stream water, and heavy metals in coastal stream sediments in American Samoa. Mar. Pollut. Bull. 2017, 116, 501–507. [Google Scholar] [CrossRef]
- Prouty, N.G.; Swarzenski, P.W.; Fackrell, J.F.; Johannesson, K.; Palmore, C.D. Groundwater-derived nutrient and trace element transport to a nearshore Kona coral ecosystem: Experimental mixing model results. J. Hydrol. Reg. Stud. 2017, 11, 166–177. [Google Scholar] [CrossRef] [Green Version]
- Swarzenski, P.W.; Dulaiova, H.; Dailer, M.L.; Glenn, C.R.; Smith, C.G.; Storlazzi, C.D. A Geochemical and Geophysical Assessment of Coastal Groundwater Discharge at select sites in Maui and O‘ahu, Hawai‘I. In Groundwater in the Coastal Zones of Asia-Pacific; Wetzelhuetter, C., Ed.; Springer: Dordrecht, The Netherlands, 2013; Volume 7, pp. 27–46. [Google Scholar]


| Sample ID | Lat | Lon | NO3− (µM) | TN (µM) | DIC * (µM) | δ13C * (‰) | U (nM) | V (nM) | Pb (nM) | Cu (nM) | Cr (nM) | Ni (nM) |
|---|---|---|---|---|---|---|---|---|---|---|---|---|
| ASI-1S ^ | −14.315 | −170.798 | 0.0 | 1.2 | 826 | −22.3 | 0.00 | 17 | 0.31 | 3.8 | 9.9 | 3.0 |
| FALU-179 ^ | −14.291 | −170.689 | 5.4 | 12.9 | 1741 | −16.1 | 0.13 | 51 | 2.18 | 43.3 | 0.7 | 1.4 |
| PAV-2R § | −14.336 | −170.757 | 9.8 | 15.7 | 908 | −12.6 | 0.00 | 46 | 0.03 | 1.2 | 3.2 | 0.9 |
| FASA-143 ^ | −14.293 | −170.725 | 10.2 | 14.9 | 1136 | −20.0 | 0.04 | 58 | 4.16 | 82.2 | 1.0 | 2.1 |
| MOA-168 § | −14.334 | −170.771 | 23.8 | 31.5 | 1375 | −16.9 | 0.07 | 110 | 3.16 | 101.0 | 7.8 | 4.9 |
| MOA-169 § | −14.333 | −170.773 | 28.1 | 28.3 | 1255 | −16.4 | 0.43 | 173 | 0.82 | 16.5 | 7.9 | 1.1 |
| MMI-89 § | −14.318 | −170.738 | 40.5 | 49.5 | 1391 | −20.7 | 0.07 | 76 | 4.53 | 126.7 | 21.8 | 2.3 |
| MES-85 § | −14.326 | −170.747 | 52.9 | 61.6 | 1190 | −14.6 | 0.35 | 218 | 2.95 | 51.2 | 16.2 | 1.7 |
| MMI-67 § | −14.319 | −170.738 | 54.7 | 64.4 | 1556 | −19.8 | 0.21 | 60 | 3.34 | 81.6 | 19.4 | 2.3 |
| MOA-83 § | −14.336 | −170.769 | 58.2 | 66.4 | 1438 | −17.1 | 0.14 | 268 | 2.29 | 56.1 | 8.6 | 2.8 |
| MOA-93 | −14.343 | −170.768 | 60.5 | 71.5 | 2516 | −15.7 | 1.22 | 729 | 2.52 | 13.0 | 38.9 | 5.4 |
| TAF-72 ‡ | −14.322 | −170.732 | 62.3 | 70.2 | 1147 | −18.7 | 0.05 | 53 | 4.83 | 189.1 | 16.7 | 8.3 |
| ILI-62 | −14.348 | −170.749 | 65.4 | 70.2 | 2561 | −11.2 | 1.35 | 662 | 2.82 | 12.9 | 22.6 | 4.7 |
| PAV-177 | −14.336 | −170.750 | 69.0 | 79.4 | 2096 | −15.7 | 0.91 | 312 | 2.35 | 31.1 | 15.2 | 37.0 |
| ILI-84 | −14.346 | −170.743 | 70.3 | 76.4 | 2309 | −13.2 | 2.07 | 454 | 7.18 | 63.9 | 20.7 | 3.9 |
| TAF-33 ‡ | −14.324 | −170.732 | 72.9 | 80.6 | 1260 | −16.7 | 0.18 | 81 | 3.50 | 70.6 | 15.3 | 3.0 |
| PUA-119 | −14.346 | −170.767 | 74.6 | 77.9 | 2760 | −12.5 | 3.21 | 630 | 1.72 | 30.0 | 58.3 | 8.8 |
| TAF-171 | −14.334 | −170.743 | 80.0 | 87.0 | 1888 | −15.9 | 0.52 | 392 | 8.05 | 42.7 | 18.3 | 7.4 |
| TAF-61 ‡ | −14.327 | −170.736 | 81.5 | 99.9 | 1344 | −12.1 | 0.16 | 125 | 10.22 | 103.9 | 18.7 | 6.3 |
| MOA-80 ‡ | −14.339 | −170.773 | 88.4 | 87.6 | 1284 | −17.4 | 0.20 | 285 | 2.61 | 59.6 | 9.9 | 2.9 |
| MOA-70 § | −14.340 | −170.775 | 117.9 | 117.1 | 2044 | −15.8 | 0.72 | 440 | 2.00 | 42.2 | 14.5 | 2.9 |
| ILI-167 | −14.342 | −170.747 | 119.7 | 126.3 | 2259 | −16.5 | 0.88 | 329 | 2.88 | 59.5 | 18.7 | 6.4 |
© 2020 by the authors. Licensee MDPI, Basel, Switzerland. This article is an open access article distributed under the terms and conditions of the Creative Commons Attribution (CC BY) license (http://creativecommons.org/licenses/by/4.0/).
Share and Cite
Okuhata, B.K.; Dulai, H.; Shuler, C.K.; Fackrell, J.K.; El-Kadi, A.I. Metal Mobilization As An Effect of Anthropogenic Contamination in Groundwater Aquifers in Tutuila, American Samoa. Water 2020, 12, 2118. https://doi.org/10.3390/w12082118
Okuhata BK, Dulai H, Shuler CK, Fackrell JK, El-Kadi AI. Metal Mobilization As An Effect of Anthropogenic Contamination in Groundwater Aquifers in Tutuila, American Samoa. Water. 2020; 12(8):2118. https://doi.org/10.3390/w12082118
Chicago/Turabian StyleOkuhata, Brytne K., Henrietta Dulai, Christopher K. Shuler, Joseph K. Fackrell, and Aly I. El-Kadi. 2020. "Metal Mobilization As An Effect of Anthropogenic Contamination in Groundwater Aquifers in Tutuila, American Samoa" Water 12, no. 8: 2118. https://doi.org/10.3390/w12082118