Abstract
Siberia and Central Asia are located at middle to high latitudes, encompassing a large landlocked area of the Eurasian continent and vast tracts of permafrost, which are sensitive to global climate change. Here, we investigated the data from 15 Global Network of Isotopes in Precipitation (GNIP) stations to clarify the relationship between precipitation δ18O (δ18OP) and the local temperature and precipitation amount on the monthly, seasonal, and annual timescales. Three main conclusions as following: (1) On the monthly time scale, the variation in δ18OP is mainly controlled by the “temperature effect”. (2) The weighted average value of precipitation δ18O (δ18Ow) exhibited “temperature effect” over 60° N–70° N. However, δ18Ow was dominated by multiple factors from 40° N to 60° N (e.g., the North Atlantic Oscillation (NAO) and water vapor source changes). (3) The variations of δ18OW can be attributed to the changes in pathway of the westerly dominated by the NAO at annual timescale. Therefore, it is possible to reconstruct the histories of past atmospheric circulations and water vapor sources in this region via δ18O in geologic archives, e.g., speleothem and ice core records.
1. Introduction
The stable oxygen isotopic compositions (δ18O) of ice cores, tree rings, ocean sediments, and cave speleothems have been widely used as proxies for paleo-climatic change. However, the climatological interpretation of δ18O among different paleo-archives remains controversial [1]. Monitoring the δ18O of modern atmospheric precipitation (δ18OP) can promote the understanding of climatic significance of δ18O in various paleo-archives. The Global Network of Isotopes in Precipitation (GNIP, Boulder, CO, USA) was established by the World Meteorological Organization (WMO, Geneva, Switzerland) and the International Atomic Energy Agency (IAEA, Vienna, Austria) in 1961 [2]. Stable hydrogen and oxygen isotopic compositions of precipitation (δ2HP and δ18OP) are observed constantly by GNIP, providing numerous isotope data sets for researchers in the field of global and local atmospheric circulation [3,4]. Subsequent related studies indicated that factors influencing the changes in δ2HP and δ18OP exhibited distinct characteristics at different latitudes, e.g., the variations in δ18OP over middle and high-latitude regions are dominated by temperature, while those at low latitudes are dominated by precipitation amount [5,6,7,8,9,10]. In addition, changes in the source of water vapor and in the atmospheric circulation pattern can also result in variations in δ2HP and δ18OP [11,12].
However, modern meteorological monitoring networks and paleo-climatic research are relatively scarce and the explanation of δ18O values in different archives is controversial in Siberia and Central Asia. For the present available paleo-climatic studies, the interpretation of δ18O values is diverse [13,14,15,16]. For example, the variation of stalagmite δ18O in the south of Ural Mountains [17] and the permafrost ice wedge δ18O in central Eurasia [18] are considered to be governed by winter temperature, and the authors found this proxy can also indicate the warming trend during the Holocene. The ice core δ18O record in Belukha plateau [19] and the alpine peat a-cellulose δ13C record [20] in Altai Mountains are dominated by the warm season temperature, which also show the trend of Holocene warming. In addition, the stalagmite δ18O in Central Asia has been considered as an indicator of climate changes, responding to the shift in the proportion of moisture deriving from mid-latitude westerlies during the winter/spring season [21]. Note that the δ18O records in the Kesang Cave in western China and the Tonnel’naya Cave in Uzbekistan reflect local precipitation, which showed similar signatures to the cave δ18O records in the Asian monsoon [22]. However, Cai et al. [1] interpreted the variation of the Kesang Cave δ18O as the change of water vapor source, while Rao et al. [23] proposed that the interpretation of the Kesang Cave δ18O should be the same as the ice core δ18O in the surrounding area, which is controlled by temperature change. In addition, stalagmite records in the Altai Mountains of southern Siberia also show that the δ18O is related to the intensity change of the Siberian high [24,25]. Since the δ18O in paleo-climate records is mainly inherited from the atmospheric precipitation, it is of great significance to clarify the climatic significance of δ18OP for the interpretation of paleo-climate carrier in Central Asia.
The findings of previous research on the stable isotopes of precipitation in this region have been summarized as follows: (1) The stable isotopes of meteoric precipitation are controlled by local temperature with a distinct “temperature effect” [26,27]. (2) The main source of moisture in Eurasia is the Atlantic Ocean [28,29], while in the summer season, the supply of circulating water makes an important contribution for the Eurasia region. The isotopic changes in circulating water also affect the relationship between δ18OP and temperature [13,16,21,26,30]. (3) Eurasian zonal circulation index (EZCI) represents the intensity of mid-latitude westerly wind of Eurasia, a common circulation pattern which leads to changes in the transport of water vapor over Siberia and Central Asia. Moreover, variation in δ18OP is positively correlated with the frequency of westerly wind [13,27,31,32]. (4) The climate of western Siberia displays obvious inter-annual variations dominated by North Atlantic Oscillation (NAO) during the winter period [16,21,33,34,35]. Regional temperature also affects the decadal winter variations in δ18OP, but the inter-annual summer variations in δ18OP can be attributed to short-term regional scale processes, such as evaporation and convective precipitation [16,35].
Though it has been proposed in some research that δ18OP changes in Siberia can be attributed to temperature effect and variations in the source of water vapor, there are still some pending scientific questions to consider. Notably, how do the abovementioned factors affect the isotopic composition of local atmospheric precipitation at different timescales (e.g., monthly, seasonal, and annual)?
The NAO has an enormous influence on climate patterns at middle to high latitudes within the Northern Hemisphere [35,36]. In addition, the monitoring data, climate simulation results, and paleoclimate proxies from Europe reflect a strong relationship between δ18OP and North Atlantic Oscillation index (NAOI) [37,38,39,40,41]. However, whether the Siberian δ18OP respond to the signals of NAO is still an open question. Similarly, the influences of Atlantic water vapor and Arctic Ocean water vapor on Siberia precipitation were not clearly understood. Consequently, addressing the above-mentioned scientific problems will provide more in-depth comprehension on climatic and environmental significance of isotopic composition on atmospheric precipitation throughout the region. Moreover, it is necessary to get a thorough understanding of the physical mechanisms related to regional changes in modern meteoric isotopes, which will build a framework for reconstructing the regional paleoclimate via geological records, such as speleothems and ice core records.
Here, we have analyzed stable isotopic observation data pertaining to atmospheric precipitation at 15 GNIP sites over Siberia and northern Central Asia (40° N–70° N, 55° E–125° E) (Figure 1). By analyzing these observed data in different patterns of atmospheric circulation, the following scientific issues have been clearly investigated: (1) variations in the characteristics of atmospheric precipitation isotopes in Siberia region and its controlling factors on different timescales (i.e., monthly, seasonal, and annual); (2) relationship between the isotopic compositions of precipitation and atmospheric circulations in the Siberia region. These questions were analyzed and discussed to provide reliable support for modern monitoring endeavors, and facilitating paleo-climatic reconstruction efforts via regional δ18O proxies.
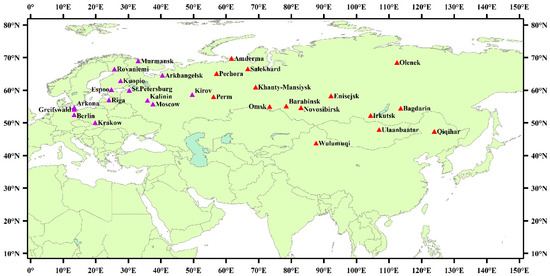
Figure 1.
Locations of the GNIP (Global Network of Isotopes in Precipitation) stations in Siberia and Central Asia (red triangles) and Europe (purple triangles) in this study.
2. Study Area
The study region, which is located in the northern part of Eurasia, includes inland Siberia and the northern part of Central Asia (40° N–70° N, 55° E–125° E) (Figure 1). The region of interest herein is a typical middle to high-latitude continental area extending from Ural Mountains in the west to Stanovoy Range in the east and from the Arctic Ocean in the north to a series of mountain ranges toward the south, namely, mountains in northern Kazakhstan to the southwest, Urumqi in the south, and Qiqihar (northeastern China) to the southeast (Figure 1).
The moisture over Eurasia is transported by the westerly, and water vapor flux decreases as the wind direction shifts from West Eurasia to East Eurasia [26,28,29,42]. Elevations of the sites in the study region range from 53 to 1338 m a.s.l. (above sea level), the annual average air temperature varies from −11.8 to 10.0 °C, and the annual average precipitation reaches 230–706 mm (Table 1). In winter, the moisture in this region originates from the ocean, whereas half of the precipitation in summer is sourced from local evaporation of water vapor due to the high evaporation rate [16,26,29]. In autumn and winter, the climatic conditions in this region are controlled mainly by the Siberian high-pressure system and the surface evaporation within the study area is relatively weak during these seasons due to low temperature and high snow cover, resulting in a wide range of cold and dry conditions throughout Siberia [30].

Table 1.
GNIP stations considered in this study. For each station, we report the annual precipitation; annual average temperature; weighted average annual δ18O values in precipitation (δ18OW); latitude; longitude; and altitude, as well as the monitoring period and the number of available monthly δ18OP (n) [2].
3. Data and Methods
The meteoric isotopic and meteorological data in this study were derived from the GNIP [2]. We mainly analyzed stable isotopic observation data from 15 stations located in the study region for statistical analysis (Figure 1, red triangles; Table 1, sites in bold). In addition, we have collected synchronous data from 14 sites in Europe outside the study area to explore the similarities and differences in δ18OP between Siberia and Europe on an interannual scale (Figure 1, purple triangles; Table 1, sites in non-bold). The δ18Op data were downloaded through the IAEA website (https://nucleus.iaea.org/wiser/index.aspx/). The monitoring period ranged from 1970 to 2016 (A.D), however, data for some years were missed within the monitoring period. For example, there are only 36 and 38 monthly samples in a 10-year period (1980–1990) for stations of Pechora and Perm, or only 14 samples instead of 228 for a 19-year period (in Irkutsk) and so on. The missing data should be attributed to an accident in sample collection or the termination of cooperation with IAEA by individual station in specific years (http://www-naweb.iaea.org/napc/ih/IHS_resources_gnip.html). For example, for the data of Irkutsk in the GNIP data center, which were monitored in February, June, October, and November in 1971 (A.D) and January, March to November in 1990 (A.D). But there are no data in the period from 1972 to 1989 (A.D). So, this is the main reason for the disagreement between the months of the monitoring period and the number of available data as presented in Table 1. In addition, for each station, the parameters of air temperature, precipitation amount, δ18OP, and δ2H are not always coupled strictly. The data missing resulted in the inconsistency in numbers of samples in different tables for a specific station. In order to be comparable to the majority of the published literature on meteoric water lines, we used an ordinary least square regression (OLSR) to determine the local meteoric water line (LMWL), which is of the form δ2H = a δ18O + b, though recent publications have suggested alternatives for calculating local meteoric water lines [43,44]. The NAOI data were downloaded from the National Centers for Environmental Prediction (NCEP) of the National Oceanic and Atmospheric Administration (NOAA) (http://www.cpc.ncep.noaa.gov/data/indices/). The Eurasian zonal circulation index (EZCI) data were downloaded from the National Climate Center of the China Meteorological Administration (http://cmdp.ncc-cma.net/cn/monitoring.htm).
To estimate the moisture transportation paths at different sites, we used the NCEP reanalysis data sets (ftp://arlftp.arlhq.noaa.gov/pub/archives/reanalysis) as the meteorological input for Hybrid Single-Particle Lagrangian Integrated Trajectory (HYSPLIT) back-trajectory analysis, which is available from the NOAA Air Resources Laboratory at http://ready.arl.noaa.gov/HYSPLIT.php. On the target month, 240-h (10-day) back trajectories were calculated for target sites at variable heights 500, 1000, 1500, 2500 m above ground level (a.g.l.) and statistical clustering of similar trajectories was done through the internal HYSPLIT clustering program [44].
We have compared the results for the identified moisture sources at four different elevations (500, 1000, 1500, and 2000 m a.g.l.), for four monitoring sites, namely Bagdarin, Qiqihar, Ulaanbaatar, and Wulumuqi. Most of the moisture in atmosphere is believed to reside up to 2000 m a.g.l. [12,27,45,46] therefore, we did not consider higher levels over 2000 m a.g.l. The results revealed little variation in the sources of moisture at different elevations (Figures S1–S3, Supplementary Materials) [47]. Hence, the air mass history was present for a single elevation of 1000 m a.g.l. during the previous 240-h (10-day) period, which is considered the average residence time of water vapor in the atmosphere [12,29,47].
4. Results
4.1. Seasonal Variations of δ18OP
The average monthly temperature and δ18OP exhibited seasonal variations, and δ18OP displayed positive excursion in summer and negative trend in winter (Figure 2). The maximum average monthly temperature was observed in July, and the minimum average monthly temperature was observed in January. The δ18OP also followed a similar trend, that is, the maximum values were observed in July, and the minimum values were observed between December and February (Figure 2). It is worth noting that the precipitation amount at all sites in the study area also presented similar seasonal variations with temperature and δ18OP.
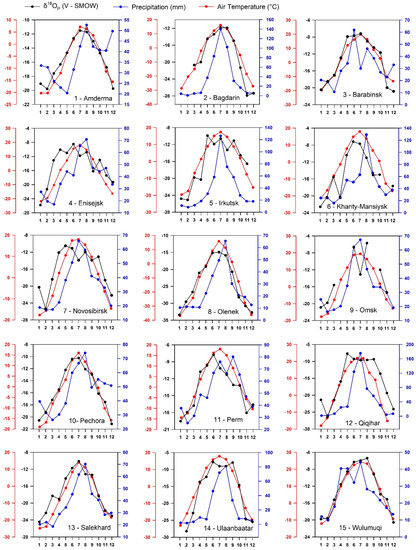
Figure 2.
Basic climate background for the 15 GNIP meteorological stations in the Siberia and Central Asia region referred in this study, including monthly mean precipitation amount (blue curve and axis in mm/month), monthly mean air temperature (red curve and axis in °C), and δ18O of monthly precipitation (black curve and axis in ‰, V-SMOW). X-axes (1–12) denote months (January–December). Although the elevation, geographic location, moisture sources, and precipitation amount seasonality may be quite different, the seasonal variation of temperature and δ18OP are broadly similar in the Siberia and Central Asia region.
4.2. Relationship between δ2HP and δ18OP
Craig [48] established the first global meteoric water line (GMWL): δ2H = 8.0 δ18O + 10.0 [48] using the relationship between δ2HP and δ18OP. As shown in Figure 3, a correlation analysis was performed on the relationship between δ2HP and δ18OP with data from 15 stations in Siberia and Central Asia to obtain the local meteoric water line (LMWL): δ2H = 7.8 δ18O + 5.0 (r = 0.98). We used δ2HP and δ18OP data from monthly precipitation observations collected at 9 GNIP site (the numbers of available monthly paired δ18OP and δ2HP must ≥ 30) to obtain the LMWL equations shown in Table 2. The slope of GMWL can reflect the fractionation or ratio between δ2HP and δ18OP [48], however, the LMWL slopes were generally lower than the GMWL slopes at most stations (8/9) (Table 2). Since the deuterium component is much less sensitive to kinetic effects than the 18O component, evaporation during the precipitation period in the inland region led to equations for atmospheric precipitation with a lower slope in most monitoring sites [5,9,49,50,51,52].
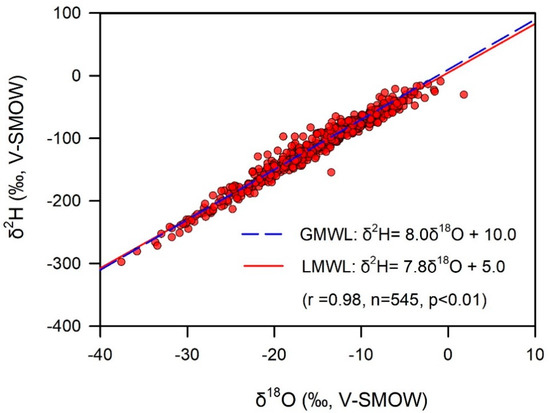
Figure 3.
LMWL (local meteoric water line; red line) based on the δ18O and δ2H values (red dots) of precipitation from 15 stations in Central Asia and Siberia. The GMWL (global meteoric water line; blue line; [48]) is plotted for comparison.
Table 2.
LMWL (local meteoric water line) of 15 studied GNIP sites in Siberia and Central Asia and the numbers of available monthly paired δ18OP and δ2HP (n ≥ 30).
5. Discussion
5.1. Relationship between Temperature and δ18Op
According to the patterns of changes in multi-year temperature and precipitation amount records, a year is divided into four seasons: spring (March–April–May, MAM), summer (June–July–August, JJA), autumn (September–October–November, SON), and winter (December–January–February of the following year, DJF) [26,53]. We have analyzed the correlation between δ18OP and monthly average temperature, monthly precipitation, EZCI in all seasons and monitoring sites with δ18OP data covering at least two years (Table 3, Table 4 and Table 5). Figure 4 also shows the correlation coefficients of the above stations in different seasons and all year round.
Table 3.
Correlation coefficients between δ18OP and temperature based on monthly data (RT). The numbers of available monthly paired δ18OP and temperature (n) have been noted.
Table 4.
Correlation coefficients between δ18OP and the precipitation amount based on monthly data (RP). The numbers of available monthly paired δ18OP and precipitation amount (n) have been noted.
Table 5.
Correlation coefficients between δ18OP and the EZCI (Eurasian zonal circulation index) based on monthly data (RZ). The numbers of available monthly δ18OP (n) have been noted.
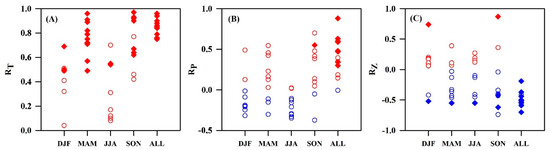
Figure 4.
Linear correlation coefficient between air temperature (RT)(A), precipitation amount (RP)(B), EZCI (RZ)(C), and δ18OP (calculated for every two consecutive years for GNIP stations with records longer than 2 years) plotted in different seasons and all year round (DJF, MAM, JJA, SON, and ALL). The diamonds represent correlation coefficients that are significantly lower than 0.05 (i.e., higher significance) and circles represent insignificant correlations greater than 0.05. Red means positive correlation and blue means negative correlation. (For details see Table 3, Table 4 and Table 5).
There is a significant positive correlation between δ18OP and monthly average temperature (Figure 4A, Table 3), coincident with the so-called “temperature effect” [5]. On the other hand, the correlation between δ18OP and monthly average temperature in spring and autumn was more significant than that in winter and summer (Figure 4A), demonstrating the dominant of “temperature effect” in the spring and autumn (Table 3). The correlation between δ18OP and monthly average temperature was weaker in summer, indicating that the effect of temperature on δ18OP is relatively imperceptible during this season. This result may be attributed to the strong surface water evaporation in summer, during which more than 80% of precipitation in Siberia originates from snowmelt and subsequent evaporation of soil moisture, resulting in a weak correlation between δ18OP and temperature in the summer season [26,31]. Previous research has suggested that the recycled water from land surfaces carrying the isotopic imprint of winter precipitation exerted significant influence on the isotopic composition of regional precipitation [26,29,30,31]. In addition, Kurita [31] noted that the isotope composition of meteoric precipitation in eastern Siberia was controlled by water vapor transportation from the westerly with relatively high δ18OP values in summer, and the water vapor may also be mixed with snowmelt water characterized by the lower δ18OP value. Because of the influence of changes in the source of water vapor, the temperature effect of δ18OP was not obvious in summer. The intense winter inversion disrupts the normal response of moisture content variations to the temperature anomaly. In fact, addition of water vapor and heat from the land surface, and the mixing of air masses of different origin, result in poor winter correlation [14,31].
5.2. Relationship between Precipitation Amount and δ18Op
A significant positive correlation was observed between δ18OP and monthly precipitation amount at 8 of 13 sites (Table 4, Figure 4B), furthermore, the correlation coefficient between δ18OP and monthly precipitation amount (RP) at every station (Table 4) was less than that between δ18Op and monthly average temperature (RT) (Table 3). A significant correlation exists between monthly average temperature and monthly precipitation amount at each monitoring site (Appendix Table A1). The positive correlation between precipitation amount and δ18OP is due to the similar seasonal variation in temperature, precipitation amount, and δ18OP (Figure 2), which is statistically positive. While, at seasonal timescale, there is no significant correlation between precipitation amount and δ18OP (Table 4). At annual timescale, the positive correlation between δ18OP and monthly precipitation amount (Table 4), is contrary to the “amount effect”. So, the “amount effect” is not the dominate reason for the change of δ18OP.
5.3. Relationship between EZCI and δ18OP
EZCI was used to represent the variation of westerly intensity. When the zonal circulation was strengthened (weakened) in the winter season, the westerly was also strengthened (weakened) as the intensity of warm oceanic air mass from the Atlantic increased (decreased), and the intensity of cold continental air mass decreased (increased), resulting in rising (falling) winter temperatures over Europe and northern Asia. In contrast, when the zonal circulation was strengthened (weakened) as the westerly winds strengthened (weakened) during the summer period, the intensity of cool air mass from the Atlantic Ocean increased (decreased), and the intensity of warm air mass from the continent decreased (increased), resulting in a decrease (increase) in the summer temperatures over Europe and northern Asia [32,54,55]. Our results indicated that the monthly δ18OP values at most stations (9 out of 13) were of significant negative correlation with the EZCI (Table 5, Figure 4C). At seasonal timescale, for most of the sites, there is no significant correlation between the δ18OP and EZCI (Table 5).
While, at annual and seasonal timescales, the different correlations between δ18OP and EZCI were the result of seasonal variations in temperature and zonal wind. At an annual timescale, EZCI presented seasonal variations opposite to those of the temperature (the EZCI is high in winter and low in summer) (Figure S4, Supplementary Materials). Additionally, δ18OP and monthly average temperature were positively correlated at an annual timescale (Table 3, Figure 4A), resulting in a significant negative correlation between δ18OP and the EZCI. In winter, when the zonal circulation was stronger (weaker), the westerly wind was strengthened (weakened), and the temperatures over Europe and northern Asia increased (decreased). Therefore, there is a positive correlation between δ18OP and EZCI in winter. By contrast, in spring and autumn, a negative correlation was found between δ18OP and EZCI due to the increase (decrease) of the westerly wind intensity, and this correlation led to a decrease (increase) in the temperature and δ18OP value [54]. In summer, as the EZCI weakened (Figure S4, Supplementary), the Arctic vortex extended toward the south [54], and water vapor from the Arctic and Pacific Oceans mixed with inland local evaporative water, which exerted potential influence on the relationship among the EZCI, δ18OP, and temperature. Therefore, the correlation coefficient (R) between δ18OP and EZCI exhibited a different trend of variation at each site. For example, in July 1996 and July 1998 (A.D), the temperatures at Bagdarin were similar (16.9 and 16.8 °C, respectively), whereas the δ18OP values were quite different (−10.3 and −15.8 (‰, V-SMOW), respectively). This difference can be attributed to an increase in moisture originating from the Pacific Ocean in July 1996 (A.D), resulting in a positive δ18OP value (Figure 5A,B). Furthermore, the temperatures at Qiqihar were both 6.2 °C in April 1990 and April 1991 (A.D). The increase in water vapor from the Arctic Ocean led to a lower δ18OP value in April 1990 (−18.0 (‰, V-SMOW)) than in April 1991 (−16.2 (‰, V-SMOW)) (Figure 5C,D). In both July 1994 and August 2000 (A.D), the temperature at Ulaanbaatar was 17.1 °C, the δ18OP values were −4.0 and −10.4 (‰, V-SMOW), respectively (Figure 5E,F), and the EZCI values were 6.1 and 10.9, respectively. In July 1994 (A.D), the EZCI decreased as the westerly wind weakened, in which inland evaporation played a leading role (Figure 5E). Moreover, warm water vapor from South China also affected the precipitation in the region and led to the enrichment of δ18OP in July 1994 (A.D) (Figure 5E). Conversely, in August, 2000 (A.D), almost all water vapor originated from high-latitude areas (i.e., the high latitudes of the North Atlantic and near the Ural Mountains), and the δ18OP values were lower (Figure 5F). In July and August 2001 (A.D), the temperatures at Wulumuqi were both 23.4 °C, and the EZCI (6.8) in July was lower than that in August (10.3). The polar air mass invaded Wulumuqi in July, resulting in a lower δ18OP value (−7.4 (‰, V-SMOW)) than that in August (−3.9 (‰, V-SMOW)) (Figure 5G,H).
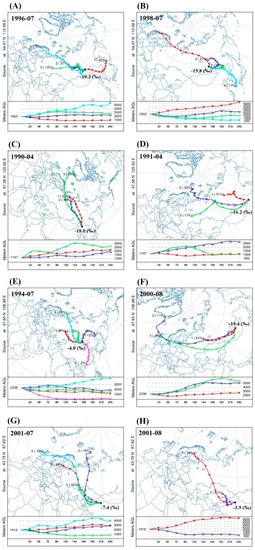
Figure 5.
Months with similar average monthly temperatures and with significantly different δ18OP values were compared to present the influence of the water vapor source on the change of precipitation δ18O. The cluster of back trajectories presented for Bagdarin (A) and (B), Qiqihar (C) and (D), Ulaanbaatar (E) and (F), and Wulumuqi (G) and (H) in different months. The bold black numbers in the figure are the monthly δ18OP values (‰, V-SMOW). The Hybrid Single-Particle Lagrangian Integrated Trajectory (HYSPLIT) model was used in the backward tracking of air parcels for the above sites. The air mass history was calculated at 1000 m a.g.l. (above ground level) over the previous 240 h. Each dot represents the location of the air parcel at 12-h intervals. The model is available from the NOAA Air Resources Laboratory at http://ready.arl.noaa.gov/HYSPLIT.php.
The above results suggested that changes in moisture sources and their relative proportions caused by variations in zonal circulation can be taken as the reason for the complex correlation between EZCI and δ18OP in summer, and less obvious temperature effect in summer than that in spring and autumn.
5.4. Inter-Annual Variations of δ18OP
The North Atlantic Oscillation (NAO) is named from the apparent dipolar nature of the weather between Greenland and Europe, and the zonal index (ZI) is the name given to the changes in zonal-averaged zonal wind. In fact, they are just different aspects of the same phenomenon [56]. However, the zonal circulation index ignores the effect in north-south oscillation of the westerly. Here, we mainly considered the relationship between δ18OP and NAO rather than the Eurasian zonal circulation index (EZCI) on the inter-annual scale. A correlation analysis was conducted between the weighted mean δ18O in annual precipitation amount (δ18OW) and the annual average temperature, annual precipitation, NAO at 20 stations that recorded over 5 years of δ18OP data (Table 6).
Table 6.
Correlation coefficients between the annual mean temperature, annual precipitation, annual mean NAOI (North Atlantic Oscillation index), and δ18OW (RT, RP, and RN). The numbers of available δ18OW (n) have been noted.
The δ18OW values at Espoo, Krakow, Kuopio, and Salekhard exhibited a significantly positive correlation (p < 0.05) with the average annual temperature, however, no significant correlation was observed at the other stations (Figure 6A, Table 6). The stations north of 60° N exhibited a positive correlation between the annual average temperature and δ18OP. In contrast, the correlation coefficient (RT) was irregular in the region to the south of 60° N (Figure 6A). Therefore, we proposed that the distribution of δ18OW at high latitudes over Eurasia reflected the changes of annual average temperature, while the δ18OW distribution in the range of 40° N–60° N did not follow the temperature trend at the inter-annual scale. For example, the correlation coefficient (RT) between δ18OW and annual average temperature at Qiqihar was negative, which was attributed to the Pacific Ocean and the effect of the Asian summer monsoon [57]. Moreover, Wulumuqi exhibited a negative correlation coefficient (RT) between δ18OW and annual average temperature due to the north-south swinging of the westerly wind at the inter-annual scale [58]. Therefore, annual mean temperature and δ18OW exhibited “temperature effect” at high latitudes (60° N–70° N). However, at an annual scale, the sites located within 40° N–60° N may be situated in a transition zone of “amount effect” or “circulation effect” and “temperature effect”. Therefore, different monitoring sites were controlled by different factors, resulting in complex relationships between δ18OW and the annual average temperature [6,42,47,53,59,60,61].
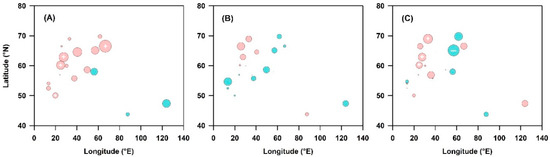
Figure 6.
Distribution of the correlation coefficients between annual average temperature (A), annual precipitation amount (B), NAOI (North Atlantic Oscillation index) (C), and δ18OW, respectively. Pink means positive correlation and cyan means negative correlation. The size of the circle indicates the absolute value of the correlation coefficient. Values significant at 0.05 levels are marked by a plus/minus sign. (Details refer to Table 6).
The correlation coefficient between NAO and annual weighted δ18OP (δ18OW) was not completely consistent with that between temperature and δ18OW (Figure 6), which might change with longitude, indicating that the influence of NAO on precipitation isotopes in different regions was not exactly the same (Figure 6C). The reason is that NAO affects the δ18OP indirectly by affecting temperature mainly in Europe [37,38,39,41]. From the Ural Mountains (60° E) to the east, the NAO models are different from those in Europe (Figure 6C), which we will discuss in Section 5.5.
5.5. Relationship between NAO and δ18OW
The North Atlantic Oscillation (NAO) is one of the most important modes for the variation of atmospheric circulation in the northern hemisphere. In positive NAO state, the surface pressures to the south of 55° N was higher than normal, while a broad region was with low surface pressure throughout the Arctic and Subarctic. It resulted in a strengthening sub-polar westerly [56], bringing about moisture with lower δ18OW from high-latitude ocean inland through the British Isles [62]. In negative state (NAO), both the Icelandic low and the Azores high-pressure were weaker than normal, which led to the weakening of the mid-latitude westerly [35]. The weakening of Azores anticyclone made a contribution to the change in the route of westerlies rich of moisture, which moved across the Iberian Peninsula into the Mediterranean and eventually to eastern Europe and Siberia, resulting in higher δ18OW values.
Isotopic composition of precipitation is changing in space and time. Therefore, it is important to compare only parallel sets of data. In order to explore the influence of atmosphere circulation on the moisture source and δ18OP in Europe and Siberia, we firstly analyzed the data for the period of 1980–1990 (A.D), when the largest number of parallel data was available for all stations (Figure S6, Supplementary Materials, modified by Hatvani et al., [63]. But even during this period, there is still a lot of data missed during 1984–1990 (A.D) (Figure S6, Supplementary Materials, modified by Hatvani et al., [63]. While, the relative complete data during the period of 1980–1983 (A.D) provided an opportunity to evaluate the correlation between the change of atmosphere circulation and δ18OP (Figure 7 and Figure 8). From 1980 to 1983, the sites with continuous monitoring data, namely, Arkhangelsk, Kalinin, Pechora, Perm, and St. Petersburg, were selected to investigate the δ18OP trends at different sites during this period. Negative δ18OP trends were found for all the stations, contrary to the trends for the NAO and EZCI (Figure S5). We arithmetically averaged and combined the δ18OP time series from Arkhangelsk, Kalinin, Pechora, Perm, and St. Petersburg (Figure 7A) into a single δ18OP sequence (Figure 7B). Additionally, NAOI and EZCI were compared with the δ18OP sequence (Figure 7C,D). Evident fluctuations were observed in the δ18OP, NAOI, and EZCI curves, which exhibited opposite trends (Figure 7B–D). Taking 1981 (NAOI: −0.21) and 1982 (NAOI: 0.43) as examples for comparison, when the NAO was negative (1981), the westerly wind (from ~45° N–55° N) passing by western Europe turned northeast at 30° E (Figure 8A), brought warmer water vapor from the southwest to the northeast, resulting in higher δ18OW values. When the NAO was positive (1982), the westerly strengthened, migrating toward the north (~50° N–60° N) and generally moved in the zonal direction. Therefore, the δ18OW values exhibited a relatively low trend (Figure 8B). Moreover, the NAO influenced the changes of δ18OW by changing the intensity and pathway of the westerly [38,56,64]. Therefore, we speculate that over middle to high-latitude regions throughout Eurasia δ18OW was affected by both pathways of the westerly and the temperature. This joint influence was the main reason for the absence of “temperature effect” in the variations of δ18OW at the inter-annual time scale. It is worthy to point out that all the deductions in this work were based on limited available data from GNIP. More continuous and long tern monitoring data throughout the vast Eurasia continent are essential to improve the understanding about the climatic significance of δ18OP in this region.
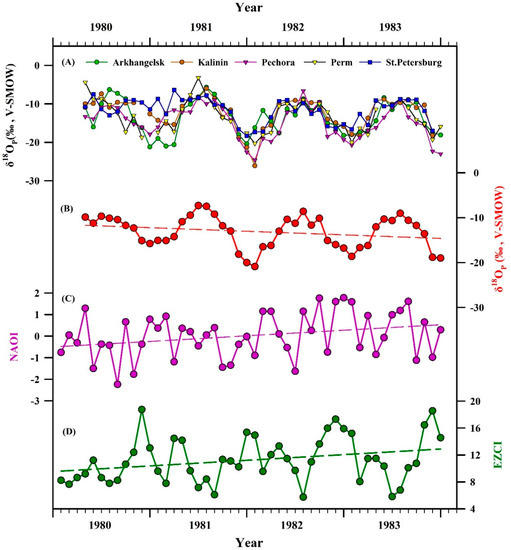
Figure 7.
Time series (1980–1983) of (A) δ18OP from Arkhangelsk (green dot), Kalinin (brown dot), Pechora (purple triangle), Perm (yellow triangle), and St. Petersburg (blue square). (B) Mean values of δ18OP from Arkhangelsk, Kalinin, Pechora, Perm, and St. Petersburg. (C) NAOI [56] and (D) EZCI [32]. The dashed lines in (B), (C), and (D) indicate the long-term trends.
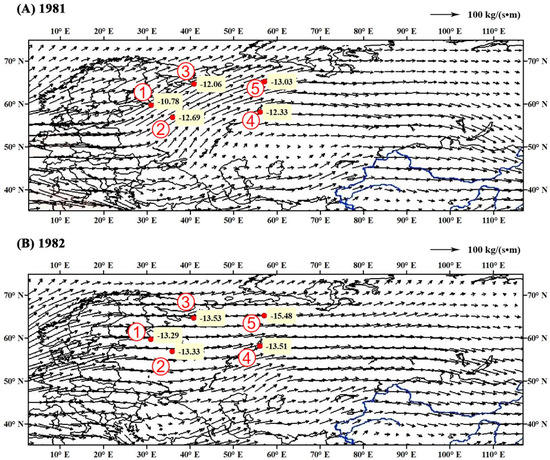
Figure 8.
Spatial distribution of δ18OW values in the precipitation at the GNIP stations in different NAO phases. The circled numbers (1–5) indicate ① St. Petersburg, ② Kalinin, ③ Arkhangelsk, ④ Perm, and ⑤ Pechora. The average atmospheric moisture transport fluxes (vectors; unit: kg/(m × s)) in different NAO phases are indicated: (A) 1981 (A.D) (NAOI = −0.21) and (B) 1982 (A.D) (NAOI = 0.43). The δ18OW values change due to different water vapor transport sources in different NAO phases.
6. Conclusions
In this study, 29 GNIP stations situated throughout middle and high latitudes of Eurasia were selected for analysis in combination with the changes in atmospheric circulation patterns at middle to high latitudes, and the conclusions are as follows:
(1) At monthly and seasonal time scales, the summer δ18OP values were higher, and the winter δ18OP exhibited lower values, which was in coincidence with “temperature effect”. At annual time scale, average temperature and δ18OW exhibited “temperature effect” at high latitudes (60° N–70° N), but the “temperature effect” was not observed in the region over 40° N–60° N.
(2) The δ18OP values were significantly positive-correlated with monthly precipitation at monthly time scale, which was contrary to “amount effect”. This phenomenon was attributed to the similar seasonal change between monthly average temperature and monthly precipitation amount in the study area. In comparison, no significant correlation was observed between δ18OW and local precipitation amount.
(3) The δ18OP values were negatively correlated with the EZCI at monthly time scale. The zonal circulation resulted in changes in δ18OP throughout Eurasia by exerting impact on local temperature and water vapor source. The relationship among δ18OP, the temperature, and the EZCI presented seasonal variations.
(4) The δ18OP values in the study region and the NAOI exhibited opposite trends on inter-annual timescale. The NAO can change the source of water vapor transported by the westerly, leading to changes in δ18OP and δ18OW.
(5) Based on above-mentioned findings, we proposed that reconstructing patterns of past atmospheric circulation and changes in water moisture sources via δ18O proxy in geologic archives (e.g., cave speleothems) within this region may be informative.
Supplementary Materials
The following are available online at https://www.mdpi.com/2073-4441/12/8/2132/s1, Figure S1: The backward trajectories at Bagdarin (A) and (B), Qiqihar (C) and (D), Ulaanbaatar (E) and (F) and Wulumuqi (E) and (F) in different months. The bold black numbers in the figure are the monthly δ18OP values (‰, V-SMOW). The Hybrid Single-Particle Lagrangian Integrated Trajectory (HYSPLIT) model was used for the backward tracking of air parcels at the above sites. The air mass history was calculated at 500 m a.g.l. (above ground level) over the previous 240 h. Each dot represents the location of the air parcel at 12-h intervals. The model is available from the NOAA Air Resources Laboratory at http://ready.arl.noaa.gov/HYSPLIT.php; Figure S2: The backward trajectories at Bagdarin (A) and (B), Qiqihar (C) and (D), Ulaanbaatar (E) and (F) and Wulumuqi (E) and (F) in different months. The bold black numbers in the figure are the monthly δ18OP values (‰, V-SMOW). The Hybrid Single-Particle Lagrangian Integrated Trajectory (HYSPLIT) model was used for the backward tracking of air parcels at the above sites. The air mass history was calculated at 1500 m a.g.l. (above ground level) over the previous 240 h. Each dot represents the location of the air parcel at 12-h intervals. The model is available from the NOAA Air Resources Laboratory at http://ready.arl.noaa.gov/HYSPLIT.php; Figure S3: The backward trajectories at Bagdarin (A) and (B), Qiqihar (C) and (D), Ulaanbaatar (E) and (F) and Wulumuqi (E) and (F) in different months. The bold black numbers in the figure are the monthly δ18OP values (‰, V-SMOW). The Hybrid Single-Particle Lagrangian Integrated Trajectory (HYSPLIT) model was used for the backward tracking of air parcels at the above sites. The historical air mass was calculated at 2000 m a.g.l. (above ground level) over the previous 240 h. Each dot represents the location of the air parcel at 12-h intervals. The model is available from the NOAA Air Resources Laboratory at http://ready.arl.noaa.gov/HYSPLIT.php; Figure S4: Annual variations in the Eurasian Zonal Circulation Index (EZCI, 1951–2017). The boxes represent the 25th–75th percentiles, and the line through each box represents the median. The whiskers indicate the 90th and 10th percentiles, and the points above and below the whiskers indicate the 95th and 5th percentiles, respectively; Figure S5: Time series (1980–1983) of the δ18OP at (A) Arkhangelsk, (B) Kalinin, (C) Pechora, (D) Perm, and (E) St. Petersburg and time series (1980–1983) of (F) the NAOI; Figure S6: Number of δ18OP records obtained from the GNIP stations (A). Time series of the δ18OP (1980–1990) (B).
Author Contributions
T.W. and T.-Y.L. designed the research. T.W. wrote the original draft, and T.-Y.L. revised it. Data curation, J.Z. and Y.W.; Investigation, C.-J.C.; Methodology, S.-Y.X.; Project administration, R.H.; Software, Y.W.; Supervision, J.-Y.L. and T.A.B. All authors have read and agreed to the published version of the manuscript.
Funding
This research was supported by the National Natural Science Foundation of China (NSFC, No. 41772170; 42011530078), and the Fundamental Research Funds for the Central Universities, China (No. XDJK2020D005) to T.-Y.L., and the Russian Foundation for Basic Research (RFBR, No. 20-55-53015/20) to T.A.B.
Acknowledgments
The authors wish to express their gratitude for mentorship to T.-Y.L. who made a great contribution to this article. Special thanks to Tatiana Artemevna Blyakharchuk. The authors thank her for the useful discussions. The authors wish to thank anonymous reviewers and guest editors for their very useful comments which have helped to improve the manuscript.
Conflicts of Interest
The authors declare no conflict of interest.
Appendix A
Table A1.
Correlation coefficients between the temperature and rainfall amount based on monthly data (RTP).
Table A1.
Correlation coefficients between the temperature and rainfall amount based on monthly data (RTP).
| Site | R(TP) | n |
|---|---|---|
| Amderma | 0.20 * | 122 |
| Bagdarin | 0.67 ** | 55 |
| Barabinsk | 0.34 ** | 60 |
| Enisejsk | 0.47 ** | 128 |
| Khanty-Mansiysk | 0.49 ** | 60 |
| Novosibirsk | 0.67 * | 12 |
| Olenek | 0.62 ** | 59 |
| Pechora | 0.38 ** | 129 |
| Perm | 0.30 ** | 209 |
| Qiqihar | 0.66 ** | 52 |
| Salekhard | 0.58 ** | 191 |
| Ulaanbaatar | 0.59 ** | 114 |
| Wulumuqi | 0.41 ** | 152 |
* Denotes a statistically significant relationship at p < 0.05. ** Denotes a statistically significant relationship at p < 0.01.
References
- Cai, Y.; Chiang, J.C.H.; Breitenbach, S.F.M.; Tan, L.; Cheng, H.; Edwards, R.L.; An, Z. Holocene moisture changes in western China, Central Asia, inferred from stalagmites. Quat. Sci. Rev. 2017, 158, 15–28. [Google Scholar] [CrossRef]
- IAEA/WMO. Global Network of Isotopes in Precipitation. The GNIP Database. Available online: https://nucleus.iaea.org/wiser (accessed on 25 June 2020).
- Rozanski, K.; Araguas-Araguas, L.; Gonfiantini, R. Isotopic Patterns in Modern Global Precipitation. In Climate Change in Continental Isotopic Records; Geophysical Monograph 78; Swart, P.K., Lohmann, K.C., Mckenzie, J., Savin, S., Eds.; American Geophysical Union: Washington, DC, USA, 1993; pp. 1–36. [Google Scholar] [CrossRef]
- Terzer, S.; Wassenaar, L.I.; Araguás-Araguás, L.J.; Aggarwal, P.K. Global isoscapes for δ18O and δ2H in precipitation: Improved prediction using regionalized climatic regression models. Hydrol. Earth Syst. Sci. 2013, 17, 4713–4728. [Google Scholar] [CrossRef]
- Dansgaard, W. Stable isotopes in precipitation. Tellus 1964, 16, 436–468. [Google Scholar] [CrossRef]
- Rozanski, K.; Araguás-Araguás, L.; Gonfiantini, R. Relation between long-term trends of oxygen-18 isotope composition of precipitation and climate. Science 1992, 258, 981–985. [Google Scholar] [CrossRef] [PubMed]
- Hoffmann, G.; Heimann, M. Water isotope modeling in the Asian monsoon region. Quat. Int. 1997, 37, 115–128. [Google Scholar] [CrossRef]
- Araguás-Araguás, L.; Froehlich, K.; Rozanski, K. Stable isotope composition of precipitation over southeast Asia. J. Geophys. Res. Atmos. 1998, 103, 28721–28742. [Google Scholar] [CrossRef]
- Yamanaka, T.; Tsujimura, M.; Oyunbaatar, D.; Davaa, G. Isotopic variation of precipitation over eastern Mongolia and its implication for the atmospheric water cycle. J. Hydrol. 2007, 333, 21–34. [Google Scholar] [CrossRef]
- Tang, Y.; Pang, H.; Zhang, W.; Li, Y.; Wu, S.; Hou, S. Effects of changes in moisture source and the upstream rainout on stable isotopes in summer precipitation—A case study in Nanjing, East China. Hydrol. Earth Syst. Sci. 2015, 12, 3919–3944. [Google Scholar] [CrossRef]
- Cruz, F.W.; Karmann, I.; Viana, O., Jr.; Burns, S.J.; Ferrari, J.A.; Vuille, M.; Sial, A.N.; Moreira, M.Z. Stable isotope study of cave percolation waters in subtropical Brazil: Implications for paleoclimate inferences from speleothems. Chem. Geol. 2005, 220, 245–262. [Google Scholar] [CrossRef]
- Krklec, K.; Domínguez-Villar, D.; Lojen, S. The impact of moisture sources on the oxygen isotope composition of precipitation at a continental site in central Europe. J. Hydrol. 2018, 561, 810–821. [Google Scholar] [CrossRef]
- Aizen, V.B.; Aizen, E.; Fujita, K.; Nikitin, S.A.; Kreutz, K.J.; Takeuchi, L.N. Stable-isotope time series and precipitation origin from firn-core and snow samples, Altai glaciers, Siberia. J. Glaciol. 2005, 51, 637–654. [Google Scholar] [CrossRef]
- Blyakharchuk, T.A.; Wright, H.E.; Borodavko, P.S.; Knaap, W.O.V.D.; Ammann, B. Late Glacial and Holocene vegetational history of the Altai Mountains (southwestern Tuva Republic, Siberia). Palaeogeogr. Palaeocl. 2007, 245, 518–534. [Google Scholar] [CrossRef]
- Opel, T.; Dereviagin, A.Y.; Meyer, H.; Schirrmeister, L.; Wetterich, S. Palaeoclimatic Information from Stable Water Isotopes of Holocene Ice Wedges on the Dmitrii Laptev Strait, Northeast Siberia, Russia. Permafr. Periglac. Process. 2010. [Google Scholar] [CrossRef]
- Butzin, M.; Werner, M.; Masson-Delmotte, V.; Risi, C.; Frankenberg, C.; Gribanov, K.; Jouzel, J.; Zakharov, V.I. Variations of oxygen-18 in West Siberian precipitation during the last 50 years. Atmos. Chem. Phys. 2014, 14, 5853–5869. [Google Scholar] [CrossRef]
- Baker, J.L.; Lachniet, M.S.; Chervyatsova, O.; Asmerom, Y.; Polyak, V.J. Holocene warming in western continental Eurasia driven by glacial retreat and greenhouse forcing. Nat. Geosci. 2017, 10, 430–435. [Google Scholar] [CrossRef]
- Meyer, H.; Opel, T.; Laepple, T.; Dereviagin, A.Y.; Hoffmann, K.; Werner, M. Long-term winter warming trend in the Siberian Arctic during the mid- to late Holocene. Nat. Geosci. 2015, 8, 122. [Google Scholar] [CrossRef]
- Aizen, E.M.; Aizen, V.B.; Takeuchi, N.; Mayewski, P.A.; Grigholm, B.; Joswiak, D.R.; Nikitin, S.A.; Fujita, K.; Nakawo, M.; Zapf, A.; et al. Abrupt and moderate climate changes in the mid-latitudes of Asia during the Holocene. J. Glaciol. 2016, 62, 411–439. [Google Scholar] [CrossRef]
- Rao, Z.G.; Huang, C.; Xie, L.; Shi, F.; Zhao, Y.; Cao, J.; Gou, X.; Chen, J.; Chen, F. Long-term summer warming trend during the Holocene in central Asia indicated by alpine peat α-cellulose δ13C record. Quat. Sci. Rev. 2019, 203, 56–67. [Google Scholar] [CrossRef]
- Wolff, C.; Plessen, B.; Dudashvilli, A.S.; Breitenbach, S.F.M.; Cheng, H.; Edwards, L.R.; Strecker, M.R. Precipitation evolution of Central Asia during the last 5000 years. Holocene 2016, 27, 142–154. [Google Scholar] [CrossRef]
- Cheng, H.; Spotl, C.; Breitenbach, S.F.; Sinha, A.; Wassenburg, J.A.; Jochum, K.P.; Scholz, D.; Li, X.; Yi, L.; Peng, Y.; et al. Climate variations of Central Asia on orbital to millennial timescales. Sci. Rep. 2016, 5, 36975. [Google Scholar] [CrossRef]
- Rao, Z.G.; Wu, D.D.; Shi, F.X.; Guo, H.C.; Cao, J.T.; Chen, F.H. Reconciling the ‘westerlies’ and ‘monsoon’ models: A new hypothesis for the Holocene moisture evolution of the Xinjiang region, NW China. Earth Sci. Rev. 2019, 191, 263–272. [Google Scholar] [CrossRef]
- Chen, Y.-S.; Li, H.-C.; Yin, J.-J.; Mii, H.-S.; Blyakharchuk, T.A.; Shen, C.-C. The Holocence Climate in South Siberia and Its Linkage to Siberia High, Russia; EGU: Munich, Germany, 2019. [Google Scholar]
- Ye, Y.-S.; Li, H.-C.; Mii, H.-S.; Blyakharchuk, T.A.; Shen, C.-C.; Tsai, H.-S. High Resolution Climate Record in South Siberia during MIS3 from a Stalagmite in the Altai Mountain Area, Russia; EGU: Munich, Germany, 2019. [Google Scholar]
- Kurita, N.; Yoshida, N.; Inoue, G.; Chayanova, E.A. Modern isotope climatology of Russia: A first assessment. J. Geophys. Res. Atmos. 2004, 109. [Google Scholar] [CrossRef]
- Yu, W.S.; Tian, L.D.; Risi, C.; Yao, T.D.; Ma, Y.M.; Zhao, H.B.; Zhu, H.F.; He, Y.; Xu, B.Q.; Zhang, H.B.; et al. δ18O records in water vapor and an ice core from the eastern Pamir Plateau: Implications for paleoclimate reconstructions. Earth Planet. Sci. Lett. 2016, 456, 146–156. [Google Scholar] [CrossRef]
- Aizen, V.; Aizen, E.; Melack, J.; Martma, T. Isotopic measurements of precipitation on central Asian glaciers (Southeastern Tibet, northern Himalayas, central Tien Shan). J. Geophys. Res. Atmos. 1996, 101, 9185–9196. [Google Scholar] [CrossRef]
- Numaguti, A. Origin and recycling processes of precipitating water over the Eurasian continent: Experiments using an atmospheric general circulation model. J. Geophys. Res. Atmos. 1999, 104, 1957–1972. [Google Scholar] [CrossRef]
- Henderson, K.; Laube, A.; Gäggeler, H.W.; Olivier, S.; Papina, T.; Schwikowski, M. Temporal variations of accumulation and temperature during the past two centuries from Belukha ice core, Siberian Altai. J. Geophys. Res. 2006, 111. [Google Scholar] [CrossRef]
- Kurita, N. Relationship between the variation of isotopic ratios and the source of summer precipitation in eastern Siberia. J. Geophys. Res. 2003, 108. [Google Scholar] [CrossRef]
- Li, J.P.; Wang, J.X.L. A modified zonal index and its physical sense. Geophys. Res. Lett. 2003, 30. [Google Scholar] [CrossRef]
- Peng, S.; Mysak, L.A. A teleconnection study of interannual sea surface temperature fluctuations in the northern North Atlantic and precipitation and runoff over Western Siberia. J. Clim. 1993, 6, 876–885. [Google Scholar] [CrossRef]
- Zhao, H.B.; Xu, B.Q.; Yao, T.D.; Wu, G.J.; Lin, S.B.; Gao, J.; Wang, M. Deuterium excess record in a southern Tibetan ice core and its potential climatic implications. Clim. Dyn. 2011, 38, 1791–1803. [Google Scholar] [CrossRef]
- Casado, M.; Ortega, P.; Masson-Delmotte, V.; Risi, C.; Swingedouw, D.; Daux, V.; Genty, D.; Maignan, F.; Solomina, O.; Vinther, B.; et al. Impact of precipitation intermittency on NAO-temperature signals in proxy records. Clim. Past. 2013, 9, 871–886. [Google Scholar] [CrossRef]
- Hurrell, J.W.; Kushnir, Y.; Ottersen, G.; Visbeck, M. An overview of the North Atlantic Oscillation. In The North Atlantic Oscillation: Climatic Significance and Environmental Impact; Geophysical Monograph 134; American Geophysical Union: Washington, DC, USA, 2003. [Google Scholar] [CrossRef]
- Baldini, L.M.; McDermott, F.; Foley, A.M.; Baldini, J.U.L. Spatial variability in the European winter precipitation δ18O-NAO relationship: Implications for reconstructing NAO-mode climate variability in the Holocene. Geophys. Res. Lett. 2008, 35. [Google Scholar] [CrossRef]
- Field, R.D. Observed and modeled controls on precipitation δ18O over Europe: From local temperature to the Northern Annular Mode. J. Geophys. Res. 2010, 115. [Google Scholar] [CrossRef]
- Sidorova, O.V.; Siegwolf, R.T.W.; Saurer, M.; Naurzbaev, M.M.; Shashkin, A.V.; Vaganov, E.A. Spatial patterns of climatic changes in the Eurasian north reflected in Siberian larch tree-ring parameters and stable isotopes. Glob. Chang. Biol. 2010, 16, 1003–1018. [Google Scholar] [CrossRef]
- Mischel, S.A.; Scholz, D.; Spötl, C. δ18O values of cave drip water: A promising proxy for the reconstruction of the North Atlantic Oscillation? Clim. Dyn. 2015, 45, 3035–3050. [Google Scholar] [CrossRef]
- Wassenburg, J.A.; Dietrich, S.; Fietzke, J.; Fohlmeister, J.; Jochum, K.P.; Scholz, D.; Richter, D.K.; Sabaoui, A.; Spötl, C.; Lohmann, G.; et al. Reorganization of the North Atlantic Oscillation during early Holocene deglaciation. Nat. Geosci. 2016, 9, 602–605. [Google Scholar] [CrossRef]
- Wang, S.J.; Zhang, M.J.; Crawford, J.; Hughes, C.E.; Du, M.X.; Liu, X.M. The effect of moisture source and synoptic conditions on precipitation isotopes in arid central Asia. J. Geophys. Res. Atmos. 2017, 122, 2667–2682. [Google Scholar] [CrossRef]
- Crawford, J.; Hughes, C.E.; Lykoudis, S. Alternative least squares methods for determining the meteoric water line, demonstrated using GNIP data. J. Hydrol. 2014, 519, 2331–2340. [Google Scholar] [CrossRef]
- Brittingham, A.; Petrosyan, Z.; Hepburn, J.C.; Richards, M.P.; Hren, M.T.; Hartman, G. Influence of the north atlantic oscillation on δD and δ18O in meteoric water in the armenian highland. J. Hydrol. 2019, 575, 513–522. [Google Scholar] [CrossRef]
- Zhang, X.-W. Vertical Distribution of the Transported Quantity of Material and Energy by Airflow. Desert Oasis Meteorol. 2009, 3, 1–5, (In Chinese with English Abstract and Figures). [Google Scholar]
- Bershaw, J.; Penny, S.M.; Garzione, C.N. Stable isotopes of modern water across the Himalaya and eastern Tibetan Plateau: Implications for estimates of paleoelevation and paleoclimate. J. Geophys. Res. Atmos. 2012, 117. [Google Scholar] [CrossRef]
- Krklec, K.; Domínguez-Villar, D. Quantification of the impact of moisture source regions on the oxygen isotope composition of precipitation over Eagle Cave, central Spain. Geochim. Cosmochim. Acta 2014, 134, 39–54. [Google Scholar] [CrossRef]
- Craig, H. Isotopic Variations in Meteoric Waters. Science 1961, 133(3465), 1702–1703. [Google Scholar] [CrossRef] [PubMed]
- Stewart, M.K. Stable isotope fractionation due to evaporation and isotopic exchange of falling waterdrops: Applications to atmospheric processes and evaporation of lakes. J. Geophys. Res. 1975, 80, 1133–1146. [Google Scholar] [CrossRef]
- Peng, H.-D.; Mayer, B.; Norman, A.-L.; Krouse, H.R. Modelling of hydrogen and oxygen isotope compositions for local precipitation. Tellus B 2005, 57, 273–282. [Google Scholar] [CrossRef]
- Pang, Z.H.; Kong, Y.L.; Froehlich, K.; Huang, T.M.; Yuan, L.J.; Li, Z.Q.; Wang, F.T. Processes affecting isotopes in precipitation of an arid region. Tellus B 2011, 63, 352–359. [Google Scholar] [CrossRef]
- Chen, F.L.; Zhang, M.J.; Wang, S.J.; Ma, Q.; Zhu, X.F.; Dong, L. Relationship between sub-cloud secondary evaporation and stable isotopes in precipitation of Lanzhou and surrounding area. Quat. Int. 2015, 380–381, 68–74. [Google Scholar] [CrossRef]
- Zhang, J.; Li, T.-Y. “Amount effect” vs. “Circulation effect”: The climate significance of precipitation and stalagmit δ18O in the Asian-Australian monsoon region over the past 1 ka. Quat. Sci. 2018, 38, 1532–1544, (In Chinese with English Abstract and Figures). [Google Scholar] [CrossRef]
- Hoy, A.; Sepp, M.; Matschullat, J. Large-scale atmospheric circulation forms and their impact on air temperature in Europe and northern Asia. Theor. Appl. Climatol. 2012, 113, 643–658. [Google Scholar] [CrossRef]
- Nowosad, M. Variability of the zonal circulation index over Central Europe according to the Lityński method. Geogr. Pol. 2017, 90, 417–430. [Google Scholar] [CrossRef]
- Hurrell, J.W. Decadal trends in the North Atlantic Oscillation: Regional temperatures and precipitation. Science 1995, 269, 676–679. [Google Scholar] [CrossRef] [PubMed]
- Li, X.-F.; Zhang, M.-J.; Ma, Q.; Li, Y.-J.; Wang, S.-J.; Wang, B.-L. Characteristics of Stable Isotopes in Precipitation over Northeast China and Its Water Vapor Sources. Environ. Sci. 2012, 33, 2924–2931, (In Chinese with English Abstract and Figures). [Google Scholar] [CrossRef]
- Liu, X.K.; Rao, Z.G.; Zhang, X.J.; Huang, W.; Chen, J.H.; Chen, F.H. Variations in the oxygen isotopic composition of precipitation in the Tianshan Mountains region and their significance for the Westerly circulation. J. Geogr. Sci. 2015, 25, 801–816. [Google Scholar] [CrossRef]
- Johnson, K.R.; Ingram, B.L. Spatial and temporal variability in the stable isotope systematics of modern precipitation in China: Implications for paleoclimate reconstructions. Earth Planet. Sci. Lett. 2004, 220, 365–377. [Google Scholar] [CrossRef]
- Tan, M. Circulation effect: Response of precipitation δ18O to the ENSO cycle in monsoon regions of China. Clim. Dyn. 2014, 42, 1067–1077. [Google Scholar] [CrossRef]
- Li, T.-Y. False amounte effect—A discussion on issue of isotopic climatology. Quat. Sci. 2018, 38, 1545–1548, (In Chinese with English Figures). [Google Scholar] [CrossRef]
- Clarke, M.; Rendell, H.M. Effects of storminess, sand supply and the North Atlantic Oscillation on sand invasion and coastal dune accretion in Western Portugal. Holocene 2006, 16, 341–355. [Google Scholar] [CrossRef]
- Hatvani, I.G.; Erdelyi, D.; Vreca, P.; Kern, Z. Analysis of the Spatial Distribution of Stable Oxygen and Hydrogen Isotopes in Precipitation across the Iberian Peninsula. Water 2020, 12, 481. [Google Scholar] [CrossRef]
- Langebroek, P.M.; Werner, M.; Lohmann, G. Climate information imprinted in oxygen-isotopic composition of precipitation in Europe. Earth Planet. Sci. Lett. 2011, 311, 144–154. [Google Scholar] [CrossRef]


© 2020 by the authors. Licensee MDPI, Basel, Switzerland. This article is an open access article distributed under the terms and conditions of the Creative Commons Attribution (CC BY) license (http://creativecommons.org/licenses/by/4.0/).