Article

Optimization of Process Parameters for Obtaining Polyethersulfone/Additives Membranes

by
Vanessa da Nóbrega Medeiros
*,
Bárbara Ianny Arruda Silva
,
Rodholfo da Silva Barbosa Ferreira
,
Sandriely Sonaly Lima Oliveira
,
Rafael Agra Dias
and
Edcleide Maria Araújo
Materials Engineering Department, Membrane Development Laboratory, Federal University of Campina Grande—UFCG, Paraíba 58109-970, Brazil
*
Author to whom correspondence should be addressed.
Water 2020, 12(8), 2180; https://doi.org/10.3390/w12082180
Submission received: 29 May 2020 / Revised: 1 July 2020 / Accepted: 3 July 2020 / Published: 3 August 2020
(This article belongs to the Section Wastewater Treatment and Reuse)

Abstract

:
The membrane separation process has been significantly highlighted for the treatment of water and effluents in a scenario of water resource scarcity. Effective treatments capable of reducing costs and waste are always necessary, with the planning of the experiments before their execution of interest. The purpose of this work was to evaluate, through experimental planning, the influence of the polyethersulfone (PES), polyvinylpyrrolidone (PVP), and clay variables on the membranes’ parameters (viscosity and contact angle), seeking the best compositions for the production of hollow fiber membranes. Membranes were produced according to the compositions proposed by the planning and were characterized by Viscosity, Contact Angle, X-ray diffraction (XRD), Scanning Electron Microscopy (SEM), and flow measurements. Through XRD, it was shown that the characteristic peaks of the clay remained in the membranes with higher concentrations. SEM analysis showed the influence of clay on the membranes’ porosity as well as the relation between “fingers” formation and PVP. From the flow measurement test, the relation between the obtained flow and the polymer and clay contents was verified. These tests showed the significant influence of clay on the membranes’ performance. Thus, the use of experimental planning resulted in the development of membranes and their importance in the design of future studies, making it possible to predict and simulate experiments.

1. Introduction

Water resources are essential inputs for the survival of living beings and are present in many types of activities involving man, from basic daily necessities to economic and industrial activities. Although water is a very abundant resource, its irresponsible and unconscious use has caused serious environmental impacts, in addition to the contribution of accelerated population growth and rapid economic growth, generating high pollution load and compromising its availability [1,2]. Thus, water conservation along with rational use and treatment of effluents are ways to maintain the development of human civilization [3,4].
In this way, more research and studies related to the treatment of water and effluents are emerging for later reuse, seeking to improve the quality and minimize the impacts caused by pollution. In this context, filter membrane technology has stood out significantly [5,6]. This is because membrane separation processes are a simple technology, are easy to operate, are energy-efficient, and have high separation efficiency [7,8]. It is a very effective technology as it is a highly flexible technique for selective solute concentration/separation, allowing recycling and reuse [9].
Polymeric membranes have great prominence in membrane technology due to their low cost and ease of manufacture, with wide applicability. However, some have a few properties that can restrict their use such as instability at high temperatures and low selectivity [10,11]. Such limitations can be easily remedied by inserting additives in the polymeric matrix. Among the available polymers for membranes production, polyethersulfone (PES) is one of the most widely used due to its good mechanical strength, thermal stability, and fast precipitation. However, the main disadvantage is the low hydrophilicity and permeability, leading to the possible increase of membrane fouling [8,12].
The addition of nanoparticles in polymeric materials improves the filtration properties of membranes, and has attracted great attention to the development of membrane science and technology. An alternative for correcting such disadvantages of PES is the insertion of additives into the polymeric membrane matrix. Studies have shown that the addition of inorganic nanoparticles to polymeric materials can improve mechanical properties, hydrophilicity, water permeability, and membrane fouling resistance [13].
The use of clay to improve the performance and properties of nanocomposites has been studied, and the application of this additive in membranes has shown to be something promising, since tests carried out previously indicate that, when inserted in the polymeric matrix, it is able to remedy the limitations of PES [14], resulting in significant changes in morphology, in addition to increasing the permeability and hydrophilicity. Another factor is that it be a material with natural abundance and low cost. The use of this material as an additive is one of the novelties of the work due to improvements in the properties of the membranes.
Another additive widely used to remedy the limitations of polyethersulfone (PES) is polyvinylpyrrolidone (PVP), which is a viscosifier capable of facilitating the processing of PES, favoring rapid precipitation, thus contributing to the formation of pores and thereby influencing the properties of flow [15,16].
A common technique for the preparation of polymer membranes with an asymmetric structure is the phase inversion process where a thin layer of the polymer dissolved in an appropriate solvent is cast on a suitable support and phase separation is introduced by a non-solvent [17,18]. According to Barth [19], the final membrane structure and its properties are influenced by the following experimental parameters:
  • the composition (concentration, solvent, additives) of the polymer solution;
  • the support material (glass, polymer, metal, non-wovens);
  • the thickness of the cast polymer film, which is adjustable by smoothing out the viscous solution on the support among wires of the desired diameter;
  • the non-solvent or the mixture of non-solvents;
  • the temperature of the polymer solution, the coagulation bath or the environment;
  • the duration of a dry phase inversion before the wet phase inversion (combination of processes);
  • air moisture.
Scientific studies in the field of experimentation promotes great technological advances in order to optimize processes and generate more reliable results based on statistical tools, while minimizing the process time [20]. In this context, the increasingly frequent use of design of experiments (DOE) with mixtures stands out, which through mathematical and statistical tools, allows the simulation and optimization of experiments, being able to reduce their quantity and obtain better experimental answers in more efficient way [21,22].
Through DOE, it is possible to verify how the properties of interest are affected by the variation of the proportions of the mixture components as well as to analyze which component has the greatest influence on the response variable [23,24]. Thus, it is desirable to estimate the system properties from a limited number of experiments using mathematical equations obtained in the DOE analysis, which allow for the simulation of the experiments and provide greater reliability.
In the DOE, the response surface methodology (RSM) consists of a collection of mathematical and statistical techniques useful for modeling and analyzing problems in which a response of interest is influenced by several variables [25]. Through the response surface, it becomes possible to find a mathematical function used to perform simulations and predict future responses, so that values capable of optimizing the function can be identified, and consequently the process in general [26], representing the biggest advantage of using experiment design.
Considering the various parameters that affect the membranes’ morphology and that in some works with polyethersulfone membranes there are still difficulties in their control and evaluation, the interest in studying them has arisen. The objective of this work was to investigate the influence of these different parameters on the structure and properties of asymmetric polyethersulfone and polyethersulfone/clay, with the aid of experimental mixture design as a way to optimize the process as well as the characterization of the hollow fiber membranes obtained.

2. Materials and Methods

2.1. Materials

For this research, we used polyethersulfone, PES (Mw = 63,000 g/mol), as the polymeric matrix, under the trade name Veradel® 3000P, supplied by Solvay, with the molecular structure shown in Figure 1. The membrane preparation solvent was N,N-Dimethylformamide P.A./ACS (DMF) from Labsynth Ltda. Additives used were polyvinylpyrrolidone, PVP (Mw = 45,000 g/mol), (C6H9NO)n, produced by Labsynth Ltda and a regional clay, montmorillonite ((Na,Ca)0,3(Al,Mg)2Si4O10(OH)2.nH2O) called Brasgel PA, provided by North Bentonit Union (BUN), located in Campina Grande/PB/Brazil, in powder form, with a particle size less than d = 74 µm and CEC (cation exchange capacity) = 90 meq/100 g (method of adsorption of methylene blue).

2.2. Design of Experiments

To determine the membrane compositions, a mixed experimental design was performed, since the factor levels are dependent and the proportions must be considered, totaling 100%. The tests were performed with three variables (PES, PVP, and clay).
The DOE was performed with the aid of STATISTICA software (STATSOFT), version 10. The obtained experiments were composed of nine experimental runs, varying the composition of the three considered variables and keeping the solvent fixed. Later, with the response values, it was possible to analyze and investigate the influence level of each variable and their interactions in the study. With the effects, it became possible to construct the mathematical model able to simulate the response values in the studied range.

2.3. Wiring Solution Preparation and Hollow Fiber Membranes Production

In the preparation of the solutions containing only PES and PVP, the polymers were added together to the solvent, under agitation of 1200 rpm for 1 h. For the preparation of the polyethersulfone/clay solutions, a dispersion containing clay and solvent was initially made under stirring for 1 h at a speed of 1200 rpm. After this time, polymer and PVP were added to the dispersion, remaining for the same period under the same stirring conditions. All solutions were prepared with a fixed volume of solvent, in this case, 210 g of DMF, which is equivalent to 70% of the final weight of the solution.
The solution was allowed to stand for 24 h to stabilize and eliminate possible bubbles. This procedure was performed for each of the nine compositions. The flowchart in Figure 2 illustrates the steps of solution preparation.
Hollow fiber membranes were prepared using an extruder containing two concentric holes, allowing simultaneous extrusion of the internal liquid (distilled water), which aims to prevent solution collapse, and the polymer solution, as shown in Figure 3.
The parameters for obtaining hollow fiber membranes were defined through tests previously performed. The experiment was carried out at room temperature. The parameters used for spinning and obtaining the membranes are shown in Table 1.
After extrusion, the polymer solution remained in contact with the non-solvent bath until complete precipitation. Then, all the fibers were collected and washed in distilled water, remaining there for 24 h. The membranes were stored in water + 10% glycerin.

2.4. Permeation Module Production

The hollow fiber membrane permeation modules were produced for use in the flow and separation tests, where each had a total of five membranes. Module manufacturing followed the methodology of [27], where 20 cm long pipettes were used, in which the membranes were deposited and waterproofed with epoxy resin at the ends to perform the analysis in distilled water.

2.5. Characterizations

Viscosity measurements were performed at room temperature using the Quimis Q860M21 rotary viscometer with a reading range of 100 to 600,000 mPa·s.
The structure obtained from the membranes via the introduction of the polymer chains between the clay lamellae were evaluated on a SHIMADZU X-ray diffractometer (model XRD 6000, Cu Kα radiation), 40 KV voltage, 30 mA current, sweep between 2θ of 2 to 30° and sweep speed of 2°/min.
Analysis of membrane morphology was done by scanning electron microscopy (SEM). Photomicrographs of the cross section were made, and fractured in liquid nitrogen to avoid plastic deformation. The surfaces were coated with gold and analyzed on SSX 550 Superscan—Shimadzu equipment, operating at 15 kV.
Contact angle analysis to determine membrane hydrophilicity was performed by the sessile drop method using a portable contact angle, Phoenix-i model from Surface Electro Optics, SEO.
Flow measurements were performed on the modules produced. The permeate flow (J) was determined through Equation (1):
J = P e r m e a t e   w e i g h t   ( k g ) M e m b r a n e   a r e a   ( m 2 ) x   T i m e   ( m i n )
To perform the flow calculation, the weight of the permeate was collected, which was made by a collection system consisting of a water reservoir, a centrifugal pump, and a pressure gauge to measure the water flow pressure.

3. Results and Discussion

3.1. Design of Experiments

For the analysis of the results of the tests, a mixed experimental design considering three variables was used: polyethersulfone, PES; poly(vinyl pyrrolidone), PVP; and a regional clay.
Table 2 shows the tests proposed by the DOE containing seven distinct compositions and two replicates. It can be seen that AM 8 and AM 9 consist of replicas of AM 1 and AM 7, respectively. The test results obtained for the two response variables considered were viscosity and contact angle.
Analyzing the viscosity response variable, it can be observed that its value increased as the polymer concentration increased. In addition, viscosity also tended to increase with increasing PVP concentration. However, if the increase in PVP resulted in a decrease in polymer, a decrease in viscosity was observed. Regarding the contact angle, it is clear that PVP and clay act directly on their value, so increasing their concentrations results in a decrease in contact angle.
The effects of each variable and their interactions were calculated using the software STATISTICA (STATSOFT), version 10. For each response variable, the linear and quadratic models were analyzed to identify which variable or interaction had the greatest influence on the responses considered.
a. Design Analysis for Viscosity: The DOE for viscosity was analyzed for linear and quadratic models. Table 3 presents the results of the analysis of variance (ANOVA) and their interactions for both models including the values of the multiple determination coefficients (R2), adjusted multiple determination coefficient (RA2), F value, and p value at the 95% confidence level.
Using the coefficients shown in Table 3, we can analyze the fit of the linear and quadratic models. The value of the multiple determination coefficient R2 indicates the percentage of variation in response explained by the model considered, with a value ranging from 0 to +1. That is, the higher the value of this coefficient, the model considered better fits the data. In addition, the p value at the 5% significance level indicates whether the model is statistically significant at the stipulated level (p value ≤ significance level) [20].
Analyzing the linear model, it can be observed that 88.44% of the variation can be explained by the model, resulting in a good fit and presenting a very low variability. In addition, as p ≤ 0.05, the linear model is considered statistically significant.
For the quadratic model, this model explains 98.65% of the variation, consisting of a higher multiple determination coefficient compared to the previous model, presenting less variability by external causes. However, the quadratic model is not considered statistically significant at the 5% level, given that the p value exceeded 0.05.
The Pareto chart is a very interesting statistical tool as it allows decision making to be prioritized, suggesting which resources should receive the most attention, following the “80–20” rule and prioritizing the most vital factors [28]. In the case of experimental design, this technique shows which factor has the greatest influence on the considered response variable.
Figure 4a,b shows through the Pareto chart, the effects of the variables and their interactions on viscosity for the linear and quadratic models, respectively, considering a 95% confidence interval.
Through the Pareto chart obtained for the linear model (Figure 4a), it can be observed that only PES had a significant effect. That is, for this model, PES is the factor that influences the response variable viscosity. In the Pareto chart obtained for the quadratic model (Figure 4b), in addition to the pure components, their interactions were analyzed. It can be observed that the effect of PES was the most significant, followed by the interaction between the variables PES and PVP, while the other factors had no significant effects. In this case, for the quadratic model, the factors that influenced viscosity were the PES and the interaction between PES and PVP, the former being the most intense.
Coded mathematical models are very important in design experimental as they are able to explain and infer processes through mathematical language. Table 4 presents the regression equations according to the linear and quadratic models.
Another statistical tool used in planning analysis is the response surface methodology. Such technique has wide practical applicability, being used in situations where the objective is to optimize the response variable, which may be influenced by several factors. Response surface graphs are often used in conjunction with contour graphs as they can assist in locating a possible optimal point.
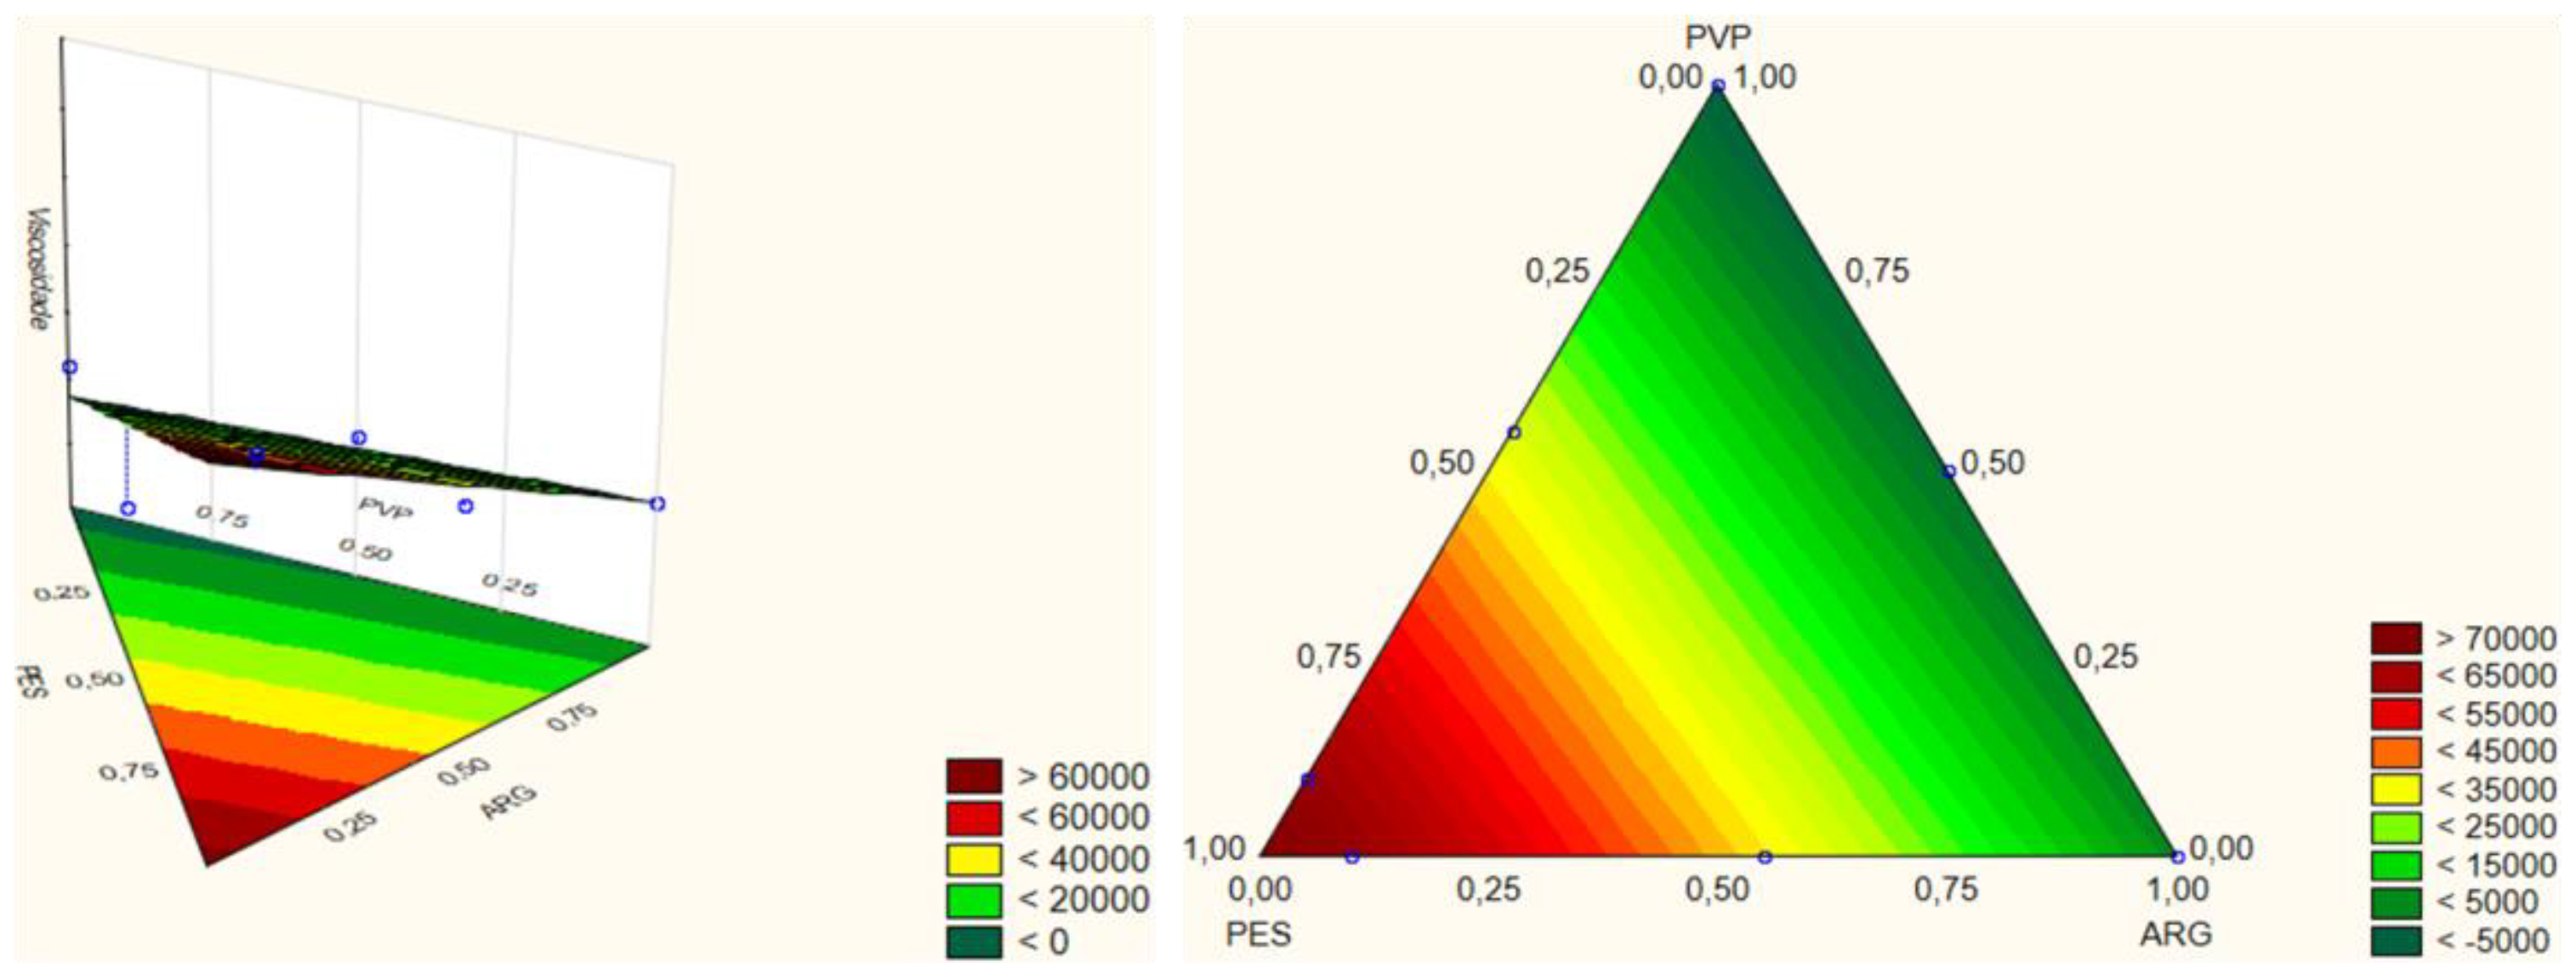
Figure 5 and Figure 6 show the response surface graphs with contour graphs for viscosity, according to the linear and quadratic models, respectively.
In both models, it is possible to note that PES is the component that most affects the viscosity value, reaffirming what was indicated in the Pareto charts. According to Figure 5 and Figure 6, for a higher concentration of PES, the decrease in clay concentration causes significant changes in viscosity, resulting in the maximum values of the response variable. According to the literature, PVP acts as a viscosifier, however, this effect was not very pronounced when compared to the effects of the concentration of PES and clay. As seen in [29], when the concentration of the polymer solution increased, the viscosity also tended to increase, causing a reduction in the solvent/non-solvent exchange rate during phase separation.
b. Design Analysis for Contact Angle: The DOE analysis for the contact angle was also performed for the linear and quadratic models. Table 5 presents the results of the analysis of variance (ANOVA) for the contact angle, considering both previously mentioned models. In it, the values of the multiple determination coefficient (R2), the adjusted multiple determination coefficient (RA2), F value, and p value, with a confidence interval of 95%, are all represented.
Analyzing the coefficient R2, we can observe very high values for both models, indicating a good fit in both cases. For the linear model, we noted that 89.28% of the existing variation could be explained by this model. In the quadratic model, this percentage was 99.29%. In both cases, the variability due to external causes was very low, being even lower in the quadratic model. Furthermore, analyzing the p value, it is clear to see that both models can. be considered statistically significant, considering that both cases presented p values of less than 0.05.
The analysis of the experimental design of mixtures was also made through the Pareto chart, which indicates to us which component or interaction has more influence on the contact angle response variable. Figure 7a,b shows the Pareto charts for the (a) linear and (b) quadratic models, respectively.
Through the Pareto chart for the linear model presented in Figure 7a, considering a 95% confidence interval, it was observed that the effect of the PES variable was the most significant, followed by the variables clay and PVP. All variables statistically influenced the contact angle response variable.
Conversely, the Pareto chart obtained for the quadratic model (Figure 7b) showed that only the interaction between PES and PVP had no significant effect on the contact angle. Clay was the component that indicated the most statistical influence, followed by PES, PVP, the interaction between PES and clay, and finally, the interaction between clay and PVP.
The coded mathematical models for the linear and quadratic models, which are of great importance in the planning analysis, are presented in Table 6; these were obtained based on the regression coefficients proposed by the experimental design of mixtures.
In the equations presented in Table 6, AC represents the contact angle response variable and XPES, XCLAY, and XPVP represent the PES, clay, and PVP fractions, respectively. The highlighted terms are those considered statistically significant at the 95% confidence level.
The response and contour surface graphs for the linear and quadratic models are presented in Figure 8 and Figure 9 in order to locate some point that allows the optimization of the contact angle response variable. It is possible to observe for both models that considering low clay and PVP levels and high PES level, more optimized yields were obtained. In addition, the optimal (maximum) yield point was at the bottom left, represented by the darker color.

3.2. X-ray Diffraction (XRD)

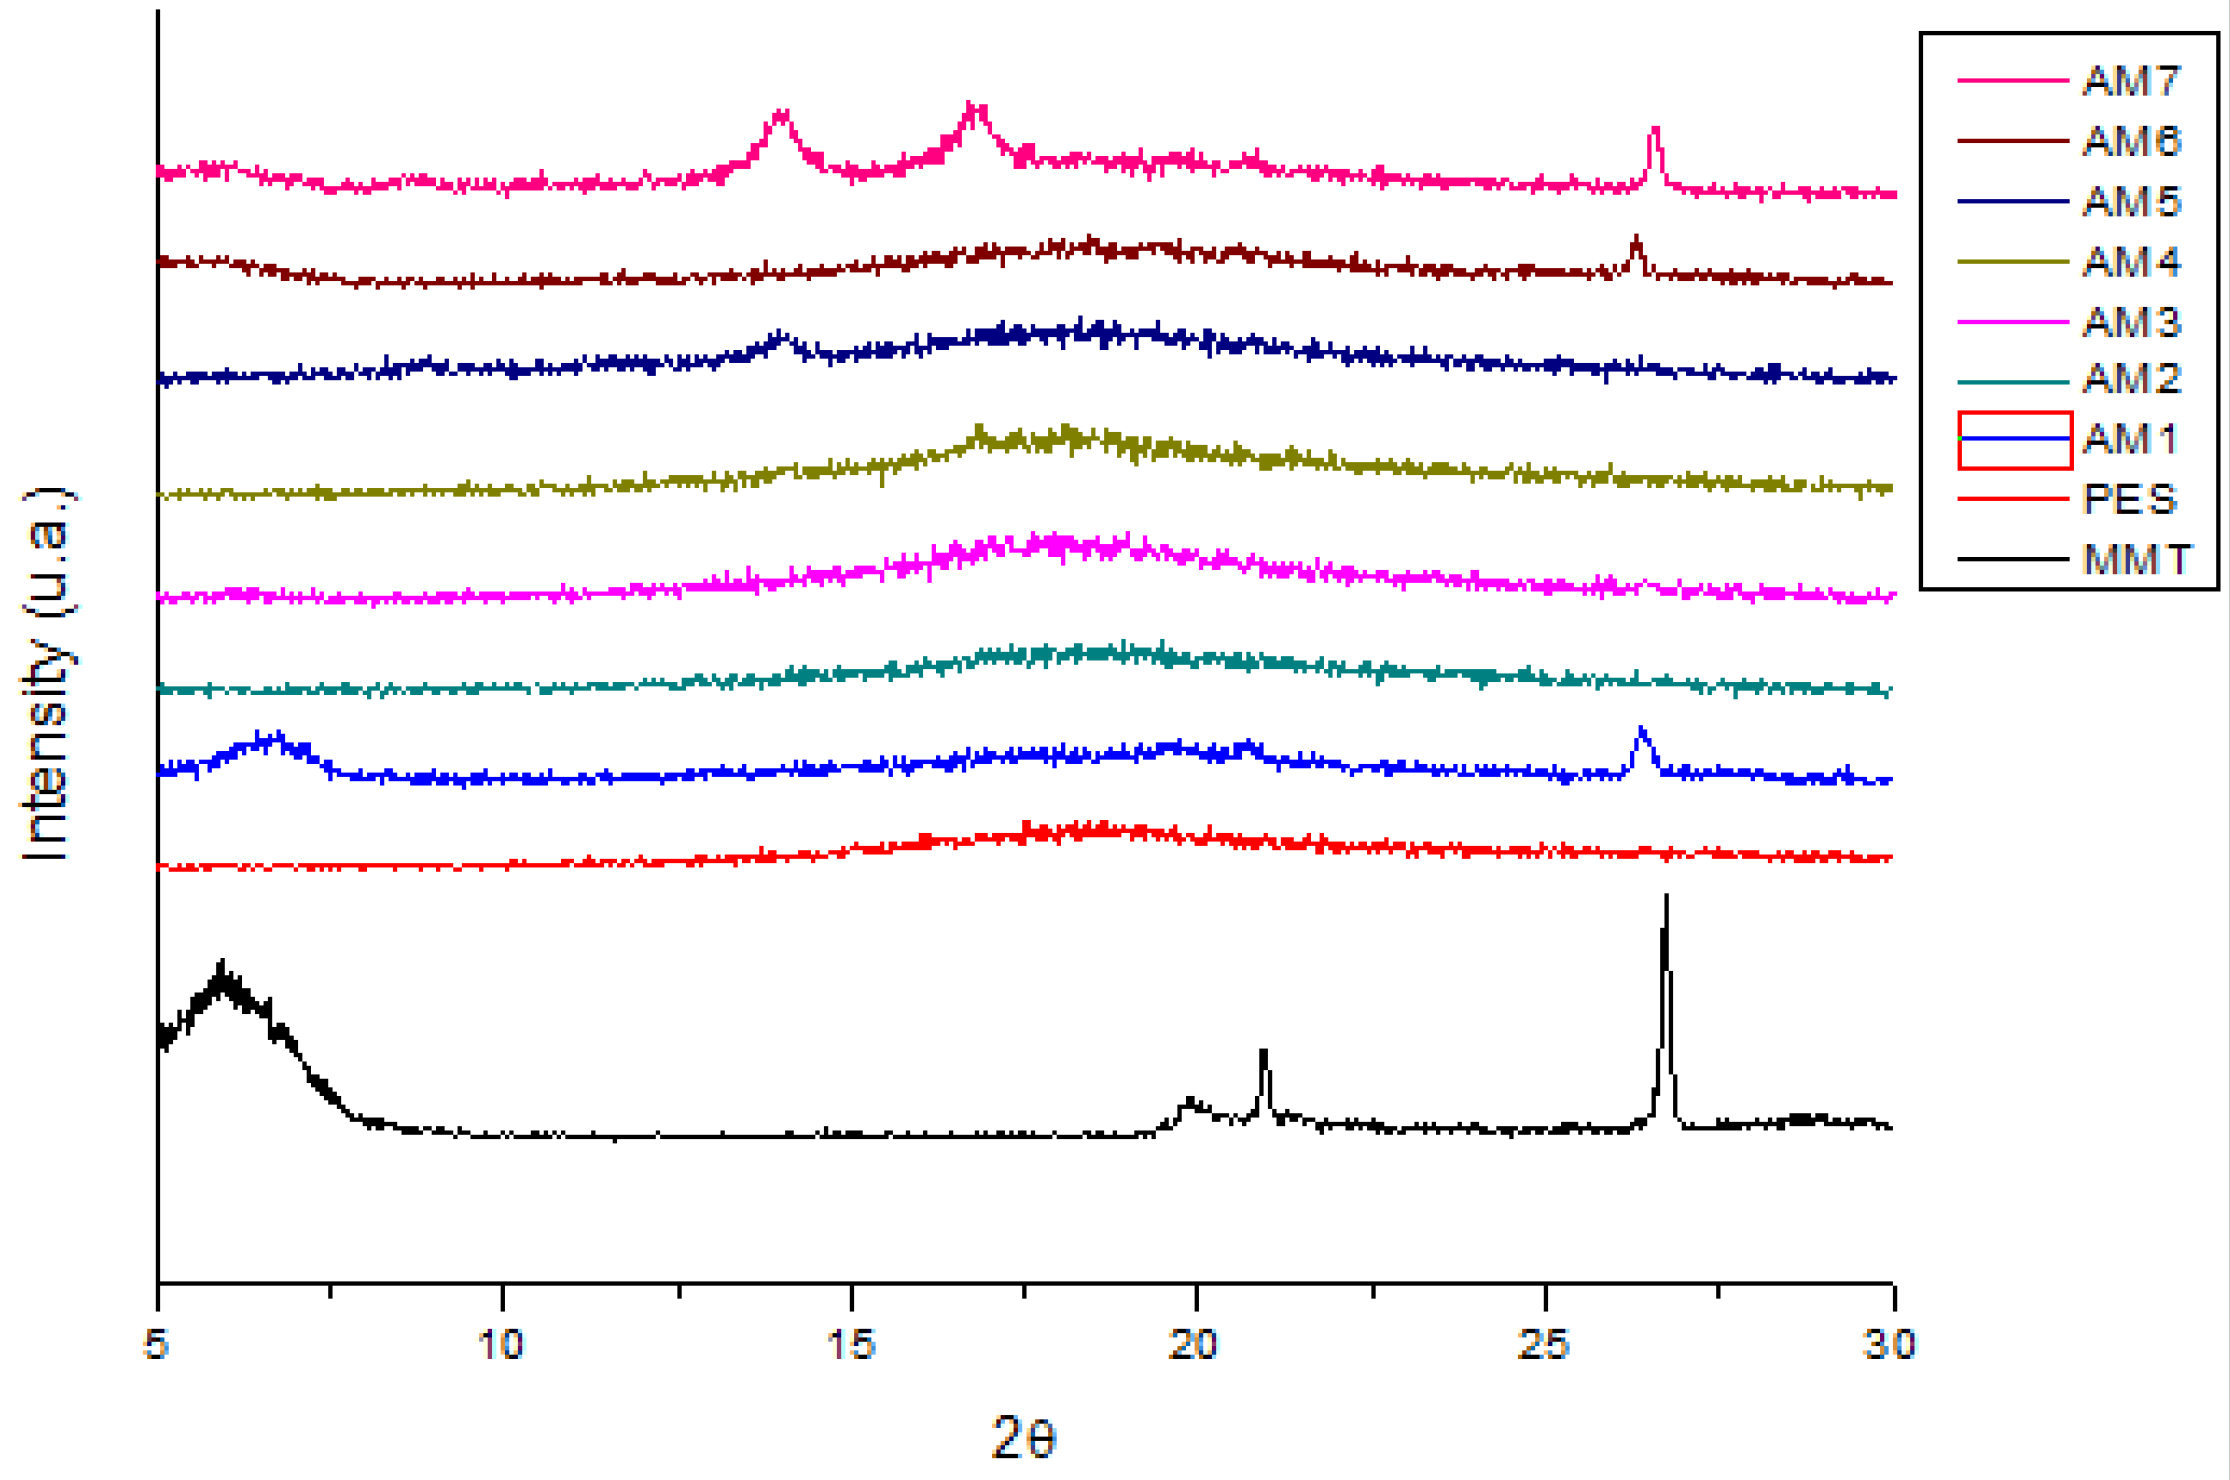
The X-ray diffractograms of the clay used for the production of the membranes, the pure PES and the membranes obtained are presented in Figure 10. From the analysis of the montmorillonite clay (MMT) diffractogram, it is possible to observe the presence of the characteristic peaks, which can be attributed to kaolinite peaks, or the presence of quartz impurities, which can be observed at angle ranges between 20° and 28°. Other authors such as [30] have already observed this behavior. Regarding the XRD analysis of pure PES, it was clear that it did not have a crystalline pattern since it was a characteristic amorphous polymer. In addition, a small prominent band was observed in the range of 15° to 21° [31].
Further shown in Figure 10 are the X-ray diffractograms of the obtained membranes from AM1 to AM7. When compared with those of clay and PES, it was found that, in general, all compositions had the characteristic small shoulder of the PES, around 18°. Furthermore, the characteristic peak of MMT was evident in the higher clay compositions in AM1, AM6, and AM7 between 26° and 28°.

3.3. Scanning Electron Microscopy (SEM)

Figure 11 shows the photomicrographs obtained by SEM of the membranes’ cross section under study at (a) 27× and (b) 700× magnification in order to observe their morphology. In all samples, it was possible to observe the existence of an inner and outer membrane layer, which were similar, in addition to the presence of the porous support center among them. This structure has been visualized by other authors in the literature such as [32] and [33].
It can be seen that all membranes had a typically asymmetric structure (Figure 11b), containing micropores and macropores along the cross section. In addition, the presence of “fingers” was also observed, which is probably related to the concentration of PVP, considering that the membranes that presented the largest proportions of this additive were those with the largest number of “fingers”.
Analyzing the influence of the components’ proportions of each composition, it can be seen that the higher the clay concentration, the membrane tended to be more porous and the dense layer in the center of the porous support tended to be less thick. Therefore, it can be seen from Figure 11 that the samples that did not contain clay in the composition, AM2, AM4, and AM5, had a dense layer in the center of the thicker porous support, while those with a higher clay content tended to be more porous such as AM1.
In addition, the relation of the “fingers” with the PVP concentration was observed, so that the presence of the additive favored its formation. This behavior can be explained by PVP’s characteristic of accelerating membrane precipitation, which eventually prevents solvent evaporation and, consequently forming longer “finger” shaped pores [34]. It can be seen that AM2, which had the highest concentration of PVP, had the highest number of “fingers”, followed by samples AM5 and AM7, respectively.
Through SEM analysis, it was also possible to identify which central holes were not uniform and concentric, with variation in the shape of the fibers, making them thicker on one side than the other. Thus, using the FIJI version ImageJ program, 20 points were selected along the entire membrane and the average thickness was calculated. The values of means and deviations are shown in Table 7. Analyzing the values, it can be seen that the average of the thicknesses showed significant deviations. The membranes with smaller thicknesses were those that did not have the PVP additive in their composition, with emphasis on the AM6 membrane. It is important to note that the thickness of the membranes can influence some properties such as flow measurements.

3.4. Flow Measurement Tests

The flow measurement tests were performed with distilled water to evaluate the water flow through the membranes under two different pressures (1.0 and 2.0 bar) with the same module and in sequence. In performing the assay, three compositions analyzed obtained no flow, namely AM3, AM4, and AM5. Verifying these samples’ composition, it was observed that they had the highest concentration of PES among all of those analyzed and also had the lowest concentrations of clay. Moreover, through the contact angle results, it is clear that these compositions presented the highest results (59°, 56.8°, and 54.9°, respectively), thus being the most hydrophobic of all of the analyzed samples.
For the membranes that obtained flow, there was a waiting time for the permeate collection of between 10 and 20 min, which can be attributed to the pore filling time. The test results are presented in Figure 12 through flow graphs versus time for their respective pressures.
From the analysis of the graph, it was possible to observe that the compositions AM1, AM2, AM7, AM8, and AM9 presented close flow values and tended to constancy over time for both pressures. Moreover, it was also noticed that these compositions had the same polymer concentration (21%), which is related to the proximity of these samples’ flows, leading to the conclusion that PES exerts a great influence on the flow.
It is also possible to verify that the increase in polymer concentration contributed to the increase of the flow, which could be observed in AM6. However, for even higher PES proportions, it was observed that the polymer played the opposite role, and in these cases, it was not possible to obtain flow such as in AM3, AM4, and AM5. This may be related to the possibility that the high polymer concentration may obstruct the membrane pores, compromising the passage of the water. These phenomena may have occurred due to the fact that the high polymer concentration contributes to the formation of a larger dense membrane layer, as observed by SEM, which dramatically increases the water permeation resistance [35,36].
The high flux obtained in AM6 relative to the rest of the compositions can be explained by some factors that may have contributed such as the polymer concentration cited above, the probable polymer–clay synergism, and the membrane thickness of this composition, which was the thinnest among those analyzed, as can be seen in Table 7, present in the results already presented by the SEM. Another possible explanation according to Chu [37] is that the formation of many micropores facilitates the passage of water molecules, thus favoring an increase in flow [38,39]. As observed by SEM, AM6 was the membrane that obtained the largest number of micropores and the lowest dense layer internally. It is also possible to observe that for this sample, the flow took longer to stabilize, obtaining its stability only close to 50 min.
Comparing the flows obtained for the pressures of 1.0 and 2.0 bar, it was noted that for the higher pressure, in general, the stabilization occurred for a higher flow, except for AM1, which was the only one that obtained a smaller flow with increasing pressure. Moreover, for this same pressure, the values were closer, even overlapping at some points. For AM6, it was noted that the presence of clay in the composition improved the pressure resistance of the hollow fiber membrane, thus bringing stability to the permeation with higher pressure. The results are consistent with the membrane morphology and structure already mentioned.

4. Conclusions

Hollow fiber membranes were produced according to the compositions established and were successfully obtained. The mixed experimental design allowed for the selection of the best compositions for the production, obtaining statistically significant and well-adjusted mathematical models, capable of describing and inferring the response variables, viscosity, and contact angle as well as identifying the significant control variables for the process. Through the design of experiments, it was concluded that AM6 consisted of the best composition, considering its characteristics and flow properties. From the results obtained, it was verified that the characteristic peaks of clay remained in the membranes with higher concentrations and their porosity was directly influenced by this content. In the flow measurements, samples with the same polymer concentration obtained very close flow rates and the one with the highest flow was the one with the highest concentration of PES and clay. Through DOE (design of experiments) analysis, it is possible to simulate situations that help in the design of future experiments.
In summary, the scope of the research was characterized by the realization and analysis of the experimental design for the response variables. This allowed for the statistical analysis of the membrane components’ influence, in order to develop membranes with better properties to be used efficiently in the treatment of aqueous effluents. The main limitation of this study is in the membranes that did not obtain flow, compromising their properties and efficiency in practical use.

Author Contributions

Conceptualization, V.d.N.M. and E.M.A.; Data curation, V.d.N.M., B.I.A.S., R.d.S.B.F., S.S.L.O., and R.A.D.; Formal analysis, V.d.N.M., B.I.A.S., R.d.S.B.F., S.S.L.O., and R.A.D.; Funding acquisition, E.M.A.; Methodology, V.d.N.M.; Project administration, V.d.N.M.; Resources, E.M.A.; Supervision, V.d.N.M. and E.M.A.; Writing—original draft, V.d.N.M. and B.I.A.S. All authors have read and agreed to the published version of the manuscript.

Funding

This research was financially assisted by MCTIC/CNPq, PNPD/CAPES and CAPES.

Acknowledgments

The authors are grateful to MCDL (Membrane Characterization and Development Laboratory/CCT/UFCG), Bentonit União Nordeste (BUN), MCTIC/CNPq, and PNPD/CAPES for their financial support.

Conflicts of Interest

The authors declare no conflicts of interest.

References

  1. Liao, Y.; Loh, C.H.; Tian, M.; Wang, R.; Fane, A.G. Progress in electrospun polymeric nanofibrous membranes for water treatment. Prog. Polym. Sci. 2018, 77, 69–94. [Google Scholar] [CrossRef]
  2. Kamali, M.; Suhas, D.P.; Costa, M.E.; Capela, I.; Aminabhavi, T.M. Sustainability considerations in membrane-based technologies for industrial effluents treatment. Chem. Eng. J. 2019, 368, 474–494. [Google Scholar] [CrossRef]
  3. Pendergast, M.M.; Hoek, E.M.V. A review of water treatment membrane nanotechnologies. Energy Environ. Sci. 2011, 4, 1946–1971. [Google Scholar] [CrossRef] [Green Version]
  4. Rather, L.J.; Jameel, S.; Dar, O.A.; Ganie, S.A.; Bhat, K.A.; Mohammad, F. Advances in the sustainable technologies for water conservation in textile industries. Water Text. Fash. 2019, 175–194. [Google Scholar] [CrossRef]
  5. Kim, J.; Van der Bruggen, B. The use of nanoparticles in polymeric and ceramic membrane structures. Environ. Pollut. 2010, 158, 2335–2349. [Google Scholar] [CrossRef] [PubMed]
  6. Ali, S.; Rehman, S.A.U.; Luan, H.Y.; Farid, M.U.; Huang, H. Challenges and opportunities in functional carbono nanotubes for membrane-based water treatment and desalination. Sci. Total Environ. 2019, 646, 1126–1139. [Google Scholar] [CrossRef]
  7. Farahani, M.H.D.A.; Rabiee, H.; Vatanpour, V. Comparing the effect of incorporation of various nanoparticulate on the performance and antifouling properties of polyethersulfone nanocomposite membranes. J. Water Process. Eng. 2019, 27, 47–57. [Google Scholar] [CrossRef]
  8. Wang, K.; Abdalla, A.A.; Khaleel, M.A.; Hilal, N.; Khraisheh, M.K. Mechanical properties of water desalination and wastewater treatment membranes. Desalination 2017, 401, 190–205. [Google Scholar] [CrossRef] [Green Version]
  9. Nath, K. Membrane Separation Processes, 2nd ed.; PHI Learning Pvt. Ltd.: Gujarat, India, 2017. [Google Scholar]
  10. Ng, L.Y.; Mohammad, A.W.; Leo, C.P.; Hilal, N. Polymeric membranes incorporated with metal/metal oxide nanoparticles: A comprehensive review. Desalination 2013, 308, 15–33. [Google Scholar] [CrossRef]
  11. Bet-moushoul, E.; Mansourpanah, Y.; Farhadi, K.; Tabatabaei, M. TiO2 nanocomposite based polymeric membranes: A review on performance improvement for various applications in chemical engineering processes. Chem. Eng. J. 2016, 283, 29–46. [Google Scholar] [CrossRef]
  12. Saranya, R.; Arthanareeswaren, G.; Dionysiou, D. Treatment of paper mill effluent using Polyethersulfone/functionalized multiwalled carbon nanotubes based nanocomposite membranes. Chem. Eng. J. 2014, 236, 369–377. [Google Scholar] [CrossRef]
  13. Wang, Y.; Zhu, J.; Dong, G.; Zhang, Y.; Guo, N.; Liu, J. Sulfonated halloysite nanotubes/polyethersulfone nanocomposite membrane for efficient dye purification. Sep. Purif. Technol. 2015, 150, 243–251. [Google Scholar] [CrossRef]
  14. Mierzwa, J.C.; Arieta, V.; Verlage, M.; Carvalho, J.; Vecitis, C.D. Effect of Clay nanoparticles on the structure and performance of polyethersulfone ultrafiltration membranes. Desalination 2013, 314, 147–158. [Google Scholar] [CrossRef]
  15. Abdel-Karim, A.; Gad-Allah, T.A.; El-Kalliny, A.S.; Ahmed, S.I.A.; Souaya, E.R.; Badawy, M.I.; Ulbricht, M. Fabrication of modified polyethersulfone membranes for wastewater treatment by submerged membrane bioreactor. Sep. Purif. Technol. 2017, 175, 36–46. [Google Scholar] [CrossRef]
  16. Mansur, S.; Othman, M.H.D.; Ismail, A.F.; Abidin, M.N.Z.; Said, N.; Goh, P.S.; Hasbullah, H.; Kadir, S.H.S.A. Study on the effect of PVP additive on the performance of PSf/PVP ultrafiltration hollow fiber membrane. Malays. J. Fund. Appl. Sci. 2018, 14, 343–347. [Google Scholar] [CrossRef]
  17. Kesting, R.E. Synthetic Polymeric Membranes; McGraw-Hill: New York, NY, USA, 1971. [Google Scholar]
  18. Koros, W.J.; Pinnau, I. Membrane formation for gas separation processes. In Polymeric Gas Separation Membranes; Paul, D.R., Yampol’skii, Y., Eds.; CRC Press: Boca Raton, FL, USA, 1994; pp. 209–271. [Google Scholar]
  19. Barth, C.; Gonçalves, M.C.; Pires, A.T.N.; Roeder, J.; Wolf, B.A. Asymmetric polysulfone and polyethersulfone membranes: Effects of thermodynamic conditions during formation on their performance. J. Membr. Sci. 2000, 169, 287–299. [Google Scholar] [CrossRef]
  20. Qasim, A.; Nisar, S.; Shah, A.; Khalid, M.S.; Sheik, M.A. Optimization of process parameters for machining of AISI-1045 steel using Taguchi design and ANOVA. Simul. Model. Pract. Theory 2015, 59, 36–51. [Google Scholar] [CrossRef]
  21. Moldovan, M.L.; Iurian, S.; Puscas, C.; Silaghi-Dumitrescu, R.; Hanganu, D.; Bodgan, C.; Vlase, L.; Oniga, I.; Benedec, D. A design of experiments strategy to enhance the recovery of polyphenolic compounds from vitis vinifera by-products through heat reflux extraction. Biomolecules 2019, 9, 529. [Google Scholar] [CrossRef] [PubMed] [Green Version]
  22. Matos, V.E.D.; Peres, A.E.C.; Pereira, C.A.; Nogueira, S.D.C.S. Analysis of quartz floatability using design of experiments. REM Int. Eng. J. 2019, 72, 501–506. [Google Scholar] [CrossRef]
  23. Nardi, J.V.; Acchar, W.; Hotza, D. Enhancing the properties of ceramic products through mixture design and response surface analysis. J. Eur. Ceram. Soc. 2004, 24, 375–379. [Google Scholar] [CrossRef]
  24. Jacyna, J.; Kordalewska, M.; Markuszewski, M.J. Design of Experiments in metabolomics-related studies: An overview. J. Pharm. Biomed. Anal. 2018, 164, 598–606. [Google Scholar] [CrossRef] [PubMed]
  25. Montgomery, D.C. Design and Analysis of Experiments, 5th ed.; John Wiley & Sons Inc.: Hoboken, NJ, USA, 2001. [Google Scholar]
  26. Xiangli, F.; Wei, W.; Chen, Y.; Jin, W.; Xu, N. Optimization of preparation conditions for polydimethylsiloxane (PDMS)/ceramic composite pervaporation membranes using response surface methodology. J. Membr. Sci. 2008, 311, 23–33. [Google Scholar] [CrossRef]
  27. Ferreira, R.D.S.B.; Oliveira, S.S.L.; Salviano, A.F.; Araújo, E.M.; Leite, A.M.D.; Lira, H.D.L. Polyethersulfone hollow fiber membranes developed for oily emulsion treatment. Mater. Res. 2019, 22, e20180854. [Google Scholar] [CrossRef]
  28. Khan, A.S.; Biggs, T.C.; Faoury, M. Improving the allocation of junior doctor resources using Pareto analysis of pager activity. Int. J. Otorhinolaryngol. Head Neck Surg. 2019, 5, 1–4. [Google Scholar] [CrossRef]
  29. Barzin, J.; Sadatnia, B. Theoretical phase diagram calculation and membrane morphology evaluation for water/solvent/polyethersulfone systems. Polymer 2007, 48, 1620–1631. [Google Scholar] [CrossRef]
  30. Anadão, P.; Sato, L.F.; Wiebeck, H.; Valenzuela-Díaz, F.R. Montmorillonite as a component of polysulfone nanocomposite membranes. Appl. Clay Sci. 2010, 48, 127–132. [Google Scholar] [CrossRef]
  31. Ge, L.; Zhu, Z.; Rudolph, V. Enhanced gas permeability by fabricating functionalized multi-walled carbon nanotubes and polyethersulfone nanocomposite membrane. Sep. Purif. Technol. 2011, 78, 76–82. [Google Scholar] [CrossRef]
  32. Salahi, A.; Mohammadi, T.; Behbahani, R.M.; Hemmati, M. Asymmetric polyethersulfone ultrafiltration membranes for oily wastewater treatment: Synthesis, characterization, ANFIS modeling and performance. J. Environ. Chem. Eng. 2015, 3, 170–178. [Google Scholar] [CrossRef]
  33. Sun, D.; Yang, Q.C.; Sun, H.L.; Liu, J.M.; Xing, Z.L.; Li, B.B. Effects of PES support layer structure on pervaporation performances of PDMS/PES hollow fiber composite membranes. Desalin. Water Treat. 2016, 57, 9123–9135. [Google Scholar] [CrossRef]
  34. Yuan, Z.; Dan-Li, X. Porous PVDF/TPU blends asymmetric hollow fiber membranes prepared with the use of hydrophilic additive PVP (K30). Desalination 2008, 223, 438–447. [Google Scholar] [CrossRef]
  35. Singha, N.R.; Karmakar, M.; Chattopadhyay, P.K.; Roy, S.; Deb, M.; Mondal, H.; Mahapatra, M.; Dutta, A.; Mitra, M.; Roy, J.S.D. Structures, properties and performances-relationships of polymeric membranes for pervaporative desalination. Membranes 2019, 9, 58. [Google Scholar] [CrossRef] [Green Version]
  36. Ferreira, R.D.S.B.; Salviano, A.F.; Oliveira, S.S.L.; Araújo, E.M.; Medeiros, V.D.N.; Lira, H.D.L. Treatment of effluents from the textile industry through polyethersulfone membranes. Water 2019, 11, 2540. [Google Scholar] [CrossRef] [Green Version]
  37. Chu, Z.; Chen, K.; Xiao, C.; Ji, D.; Ling, H.; Li, M.; Liu, H. Improving pressure durability and fractionation property via reinforced PES loose nanofiltration hollow fiber membranes for textile wastewater treatment. J. Taiwan Inst. Chem. Eng. 2020, 108, 71–81. [Google Scholar] [CrossRef]
  38. Xu, Z.L.; Qusay, F.A. Polyethersulfone (PES) hollow fiber ultrafiltration membranes prepared by PES/non-solvent/NMP solution. J. Membr Sci. 2004, 233, 101–111. [Google Scholar] [CrossRef]
  39. Alsalhy, Q.F.; Salih, H.A.; Simone, S.; Zablouk, M.; Drioli, E.; Figoli, A. Poly(ether sul-fone) (PES) hollow-fiber membranes prepared from various spinning parame-ters. Desalination 2014, 345, 21–35. [Google Scholar] [CrossRef]
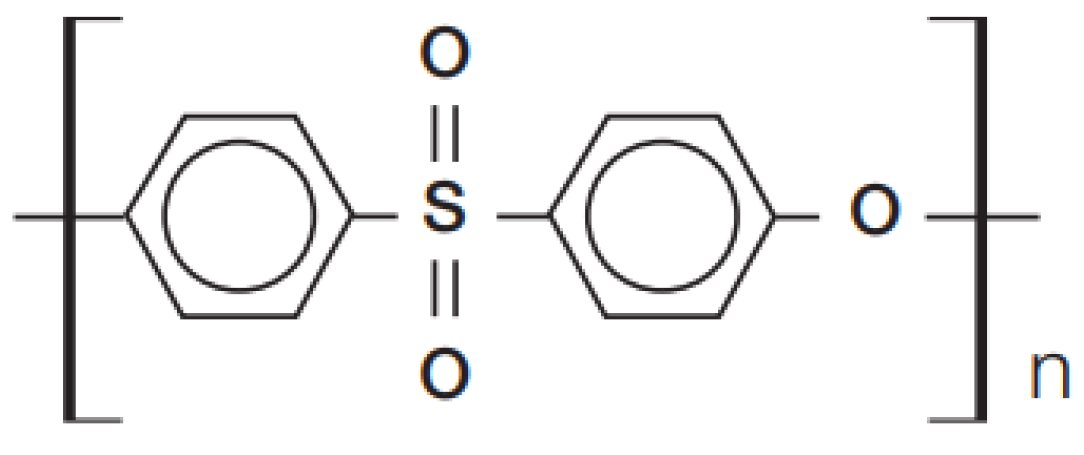
Figure 1. Molecular structure of the polyethersulfone (PES).
Water 12 02180 g001
Figure 2. Flowchart of the wiring solution preparation methodology.
Water 12 02180 g002
Figure 3. Schematic representation of the extruder for the production of hollow fiber membranes.
Water 12 02180 g003
Figure 4. Pareto chart for the models obtained by the mixed design for viscosity: (a) linear and (b) quadratic.
Water 12 02180 g004
Figure 5. Response surface graph and contour graph according to the linear model for viscosity.
Water 12 02180 g005
Figure 6. Response surface plot and contour plot according to the quadratic model for viscosity.
Water 12 02180 g006
Figure 7. Pareto chart for the models obtained by the mixed design for contact angle: (a) linear and (b) quadratic.
Water 12 02180 g007
Figure 8. Response surface graph and contour graph according to the linear model for the contact angle.
Water 12 02180 g008
Figure 9. Response surface graph and contour graph according to the quadratic model for the contact angle.
Water 12 02180 g009
Figure 10. X-ray diffractograms for clay, PES, and membranes.
Water 12 02180 g010
Figure 11. SEM photomicrographs of all hollow fiber membranes: (a) 27× and (b) 700×.
Water 12 02180 g011
Figure 12. Distilled water flow over time for hollow fiber membranes at pressures of 1.0 and 2.0 bar.
Water 12 02180 g012
Table 1. Wiring parameters for obtaining the hollow fiber.
PARAMETERSVALUES
Solution temperature≈26 °C
GAP5 cm
Flow of internal liquid (distilled water)3 g/min
Solution flow6 g/min
Extruder outer diameter2.5 mm
Extruder inner diameter2.0 mm
Table 2. Viscosity and contact angle results according to the experimental design tests.
SamplesPES
(%)
Clay
(%)
PVP
(%)
Viscosity
(mPa·s)
Contact Angle
(°)
AM1703003603.539.0
AM2700303655.846.6
AM3973071,092.059.0
AM4970377,581.056.8
AM5840165899.554.9
AM68416030,108.054.1
AM77015152501.640.0
AM8703003352.740.6
AM97015152586.038.3
Table 3. Analysis of variance (ANOVA) of linear and quadratic models for viscosity with a 95% confidence interval.
ModelR2RA2Fp
Linear0.8844250.84590022.957180.001544
Quadratic0.9864170.9639247.543020.065548
Table 4. Coded mathematical models: linear and quadratic for viscosity.
ModelCoded Mathematical Model
Linear V = 74341.13XPES + 3834.03XCLAY − 5409.50XPVP
QuadraticV = 92522XPES + 3814XCLAY + 2984XPVP − 64916XPESXCLAY − 141148XPESXPVP − 3421XCLAYXPVP
Table 5. Analysis of variance (ANOVA) of the linear and quadratic models for a contact angle with 95% confidence level.
ModelR2RA2Fp
Linear0.8928450.85712724.996890.001230
Quadratic0.9928800.98101414.050130.028490
Table 6. Coded mathematical models: linear and quadratic for the contact angle.
ModelCoded Mathematical Model
Linear CA = 61.64XPES + 39.56XCLAY + 44.72XPVP
QuadraticCA = 57.59XPES + 39.76XCLAY + 46.68XPVP + 26.70XPESXCLAY + 12.22XPESXPVP − 16.22XCLAYXPVP
Table 7. Average thickness values of the membranes.
SamplesAverage Thickness * (mm)
AM10.271 ± 0.075
AM20.391 ± 0.175
AM30.222 ± 0.035
AM40.228 ± 0.045
AM50.426 ± 0.175
AM60.171 ± 0.039
AM70.352 ± 0.160
AM80.301 ± 0.047
AM90.326 ± 0.054
* Average thickness = average of 20 measurements along the membrane.