1. Introduction
Freshwater plays an important role in human life. However, it is not plentiful. Saline water is available in abundance and represents 97% of the water on the planet, with the remaining 3% being freshwater, but unfortunately, most of it is concealed at the two poles of the Earth and in mountain ice caps. Although beneficial freshwater also comprises ground and surface water, these sources represent only 30.4% of the total freshwater available [
1]. According to the United Nations World Water Development Report [
2], global water demand is increasing at a high rate. More than 2 billion people live in high water risk countries. While the global average water stress is only 11%, 31 countries face water stress between 25% and 70%, and 22 countries are above 70% [
2]. It is foreseen that, in order to cover these freshwater requirements, desalination techniques will play an important role in the short term.
Conventional desalination methods, including Multi-Stage Flash (MSF), Multi-Effect Evaporation (MEE), and Reverse Osmosis (RO), are valid for wide freshwater output ranges of 100–50,000 m
3/day [
3]. However, such methods are costly for the limited amounts of freshwater they produce, and they cannot be used in areas like islands and remote regions, where relatively low maintenance and energy resources are available. Humidification–Dehumidification Desalination (HDH) is a safe, promising desalination technology suitable for low-quality energy sources such as low-temperature solar or waste heat energies. This method has several advantages, such as the ability to operate with low-grade heat energy, constant pressure, and low running costs, making it suitable for producing freshwater in remote rural areas [
4,
5,
6,
7,
8]. The HDH system concept consists of two steps: 1. A fluid (ambient air) goes through a duct where water is sprayed or sprinkled. In this way, the air becomes saturated (humidification process). 2. The water vapor held by the saturated fluid is condensed (dehumidification process); as a result, freshwater is produced.
Regarding the humidification process, in the literature, there are two methods commonly used. The first one uses a pad humidifier. It has a honeycomb structure where saline water is sprinkled and atomized. In the second one, the saline water is atomized using water sprayers.
With respect to the first method, there are several papers that have varied the material of the pad humidifier. Zamen et al. [
9] evaluated the optimum number of stages in the HDH process, using a polypropylene packed bed humidifier. The two-stage process improved the specific energy usage, efficiency and daily output per collector area, and also the investment costs. This process was around 20% more efficient than the single-stage one. Kabeel and Said [
10] experimentally studied a hybrid solar desalination system based on HDH. The pad humidifier consisted of PVC reaching rings. In this case, the maximum humidification efficiency was 98% at midday on a sunny day, and the maximum productivity was 45 L/day. Hamed et al. [
11] mathematically and experimentally studied a solar water heated HDH desalination system. The humidification process was achieved using a pad humidifier made from Cellulous paper. The average freshwater productivity was 22 L/day. Other investigations have studied this process using a mechanical vapor compression heat pump (Gao et al. [
12], Yuan et al. [
13]), increasing the productivity up to 60 L/day. Finally, Xu [
14] improved a water desalination system with a cellulous pad, using waste heat from the air-cooling condenser. They achieved a maximum humidification effectiveness of 65% and a productivity of 129 kg/day.
Regarding the second method, spray humidifiers, there are also several studies. Yanniotis and Xerodemas [
15] experimentally investigated two types of air humidification spray and pad humidifiers under different operating conditions. They demonstrated that a water droplet eliminator is necessary in the spray humidifier. Kang et al. [
16] assessed the performance of a multi-effect desalination system based on humidification-dehumidification. The main target was to make use of the latent heat of condensation and the residual heat in the brine and reuse it. The maximum GOR was 2.44 and the production of freshwater 72.6 kg/h. Hawlader et al. [
17] experimentally studied an HDH system with a modified solar assisted heat pump. The trials showed that the higher the compressor work and the inlet water temperature, the higher the productivity. Hegazy et al. [
18] experimentally investigated an HDH system with a heat pump. They analyzed different flow directions of the spray water and observed that the highest evaporation rate was achieved by the cross-flow spraying system. Later, El-Maghlany et al. [
19] improved the desalination system of Hegazy et al. [
18], increasing the productivity using a parallel spraying flow.
There are several papers investigating other methods for improving the humidification process. Elminshawy et al. [
20] presented an experimental and analytical study on a solar HDH desalination system where two water heaters of 500 W and a sunray reflector were used in the humidification process. Gang et al. [
21] sprayed warm water on porous balls in the humidification process and achieved an increase of 67.44% when the sprayed water temperature was increased from 60 °C to 90 °C using the HDH principle. Two solar collectors were used to heat the air and water. The proposed system showed high humidification efficiency in the middle of the day, as the solar radiation was high in this period. Agouz and Abugderah [
22] experimentally studied the air humidification process by passing air through saline water to generate an air column of bubbles inside the saline water. The experimental results indicated that the humidification efficiency and vapor content were mainly affected by saline water temperature, while the air temperature had a small effect. The maximum humidification efficiency achieved was 95% when the temperature of saline water was about 75 °C. Ghazal et al. [
23] presented a nontraditional HDH system enabling a more compact design by swapping certain components of a traditional HDH desalination unit with a solar collector. Air passed through the water-filled solar collector into the humidifier as bubbles. It was observed that humidification via direct contact bubbling could be efficient in the solar HDH desalination system. In fact, heat and mass transfer between air and water could be improved by increasing the air/water contact surface by using inverted sieves to modify the air bubbles. Sieves have improved heat transfer by acting as solar absorbers, further improving air carrying capacity by increasing the air temperature.
Another technology that could be used for humidification purposes is ultrasonic atomization. It is used in many technological operations, including therapeutic nebulizers, surface coatings, and liquid fuel sprays [
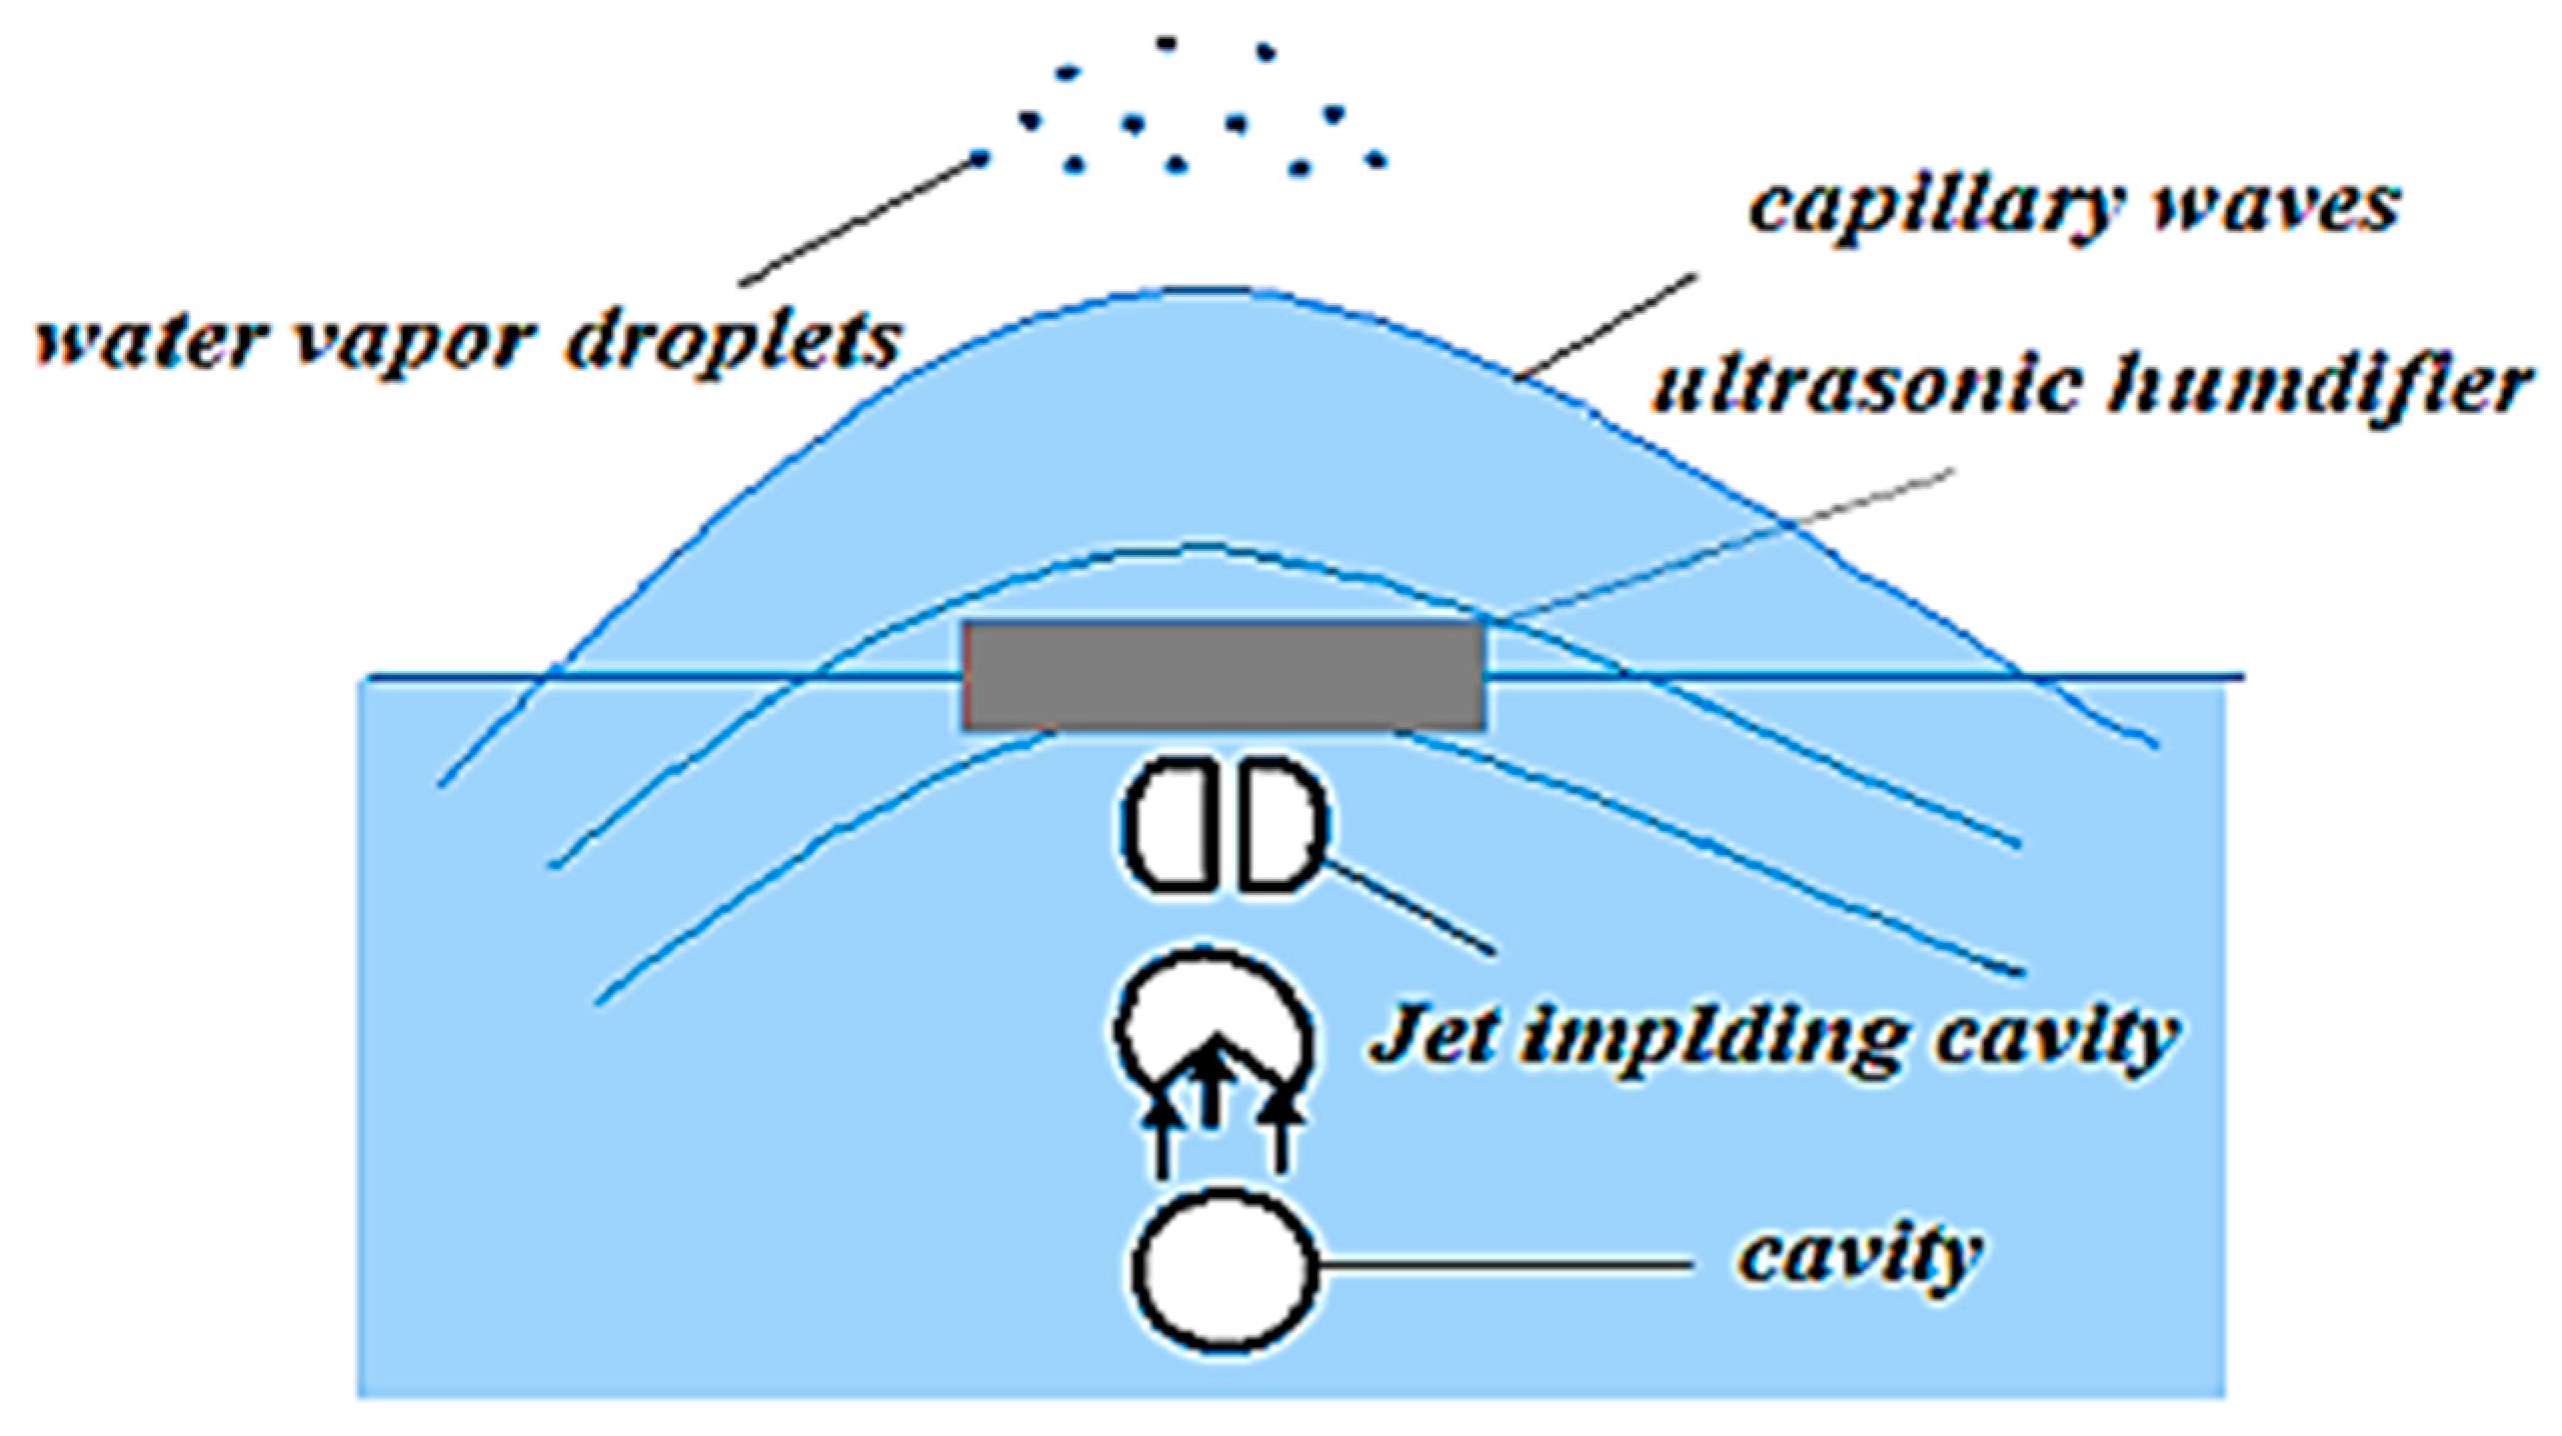
24]. For many years, ultrasonic atomization has been an area of interest, as spray consistency or fineness is an essential requirement. The liquid droplet disintegration during ultrasonic atomization is explained by a conjunction of two main hypotheses: the capillary wave and the cavitation hypotheses, as shown in
Figure 1. Ultrasonic excitation produces capillary waves at the liquid–gas interface, which becomes volatile due to the pinch-off of droplets from the wave peaks. While the cavitation theory indicates that as the transducer ultrasonic waves spread through the liquid phase, during the sound wave rarefaction process, the local fluid pressure drops below the vapor pressure due to vapor bubbles forming. Such cavitation bubbles explode aggressively during the compression process and unleash hydraulic shocks, breaking the liquid–gas interface and leading to atomization. Despite being an already-known technology, and highly effective, it has seldom been used in HDH water desalination systems. Just Zhang et al. [
25] used an ultrasonic water atomizer for HDH water desalination. The study assessed the effect of both water temperature and salinity on the rate of evaporation. Unfortunately, the authors did not evaluate the salinity of the produced water. Nevertheless, their experiments showed that ultrasonic atomization could improve the desalination process, especially humidification efficiency. They also recommended this new methodology for seawater desalination.
According to the literature review, it was found that the humidification processes could and should be improved. Zhang et al. [
25] pointed out that ultrasonic atomizer technology could be a good option. However, the literature related to the use of this technology in HDH desalination processes is scarce. This new technology needs further research, especially in assessing the capabilities of this new technique in water atomization taking into account the effect of feed water salinity on freshwater production. In this paper, a novel study related to the usage of ultrasonic atomizer technology for water atomization in HDH desalination is performed. An experimental and theoretical investigation was carried out, and is presented in the following sections. The humidification effectiveness and the productivity of the new process were calculated and compared with the results provided by traditional spraying atomization. Moreover, the quality of freshwater production is investigated in both systems at different salinities and temperatures of the feed water. Additionally, a hybrid concept is presented here, combining the traditional and the ultrasonic atomizer to detect the maximum capability of this system.
2. Description of the Desalination System
The basic experimental desalination system was previously proposed by our research group El-Maghlany et al. [
19]. The system is based on a humidification–dehumidification technique consisting of three main components: a humidifier, a dehumidifier, and a heat pump. A picture and a schematic diagram are shown in
Figure 2 and
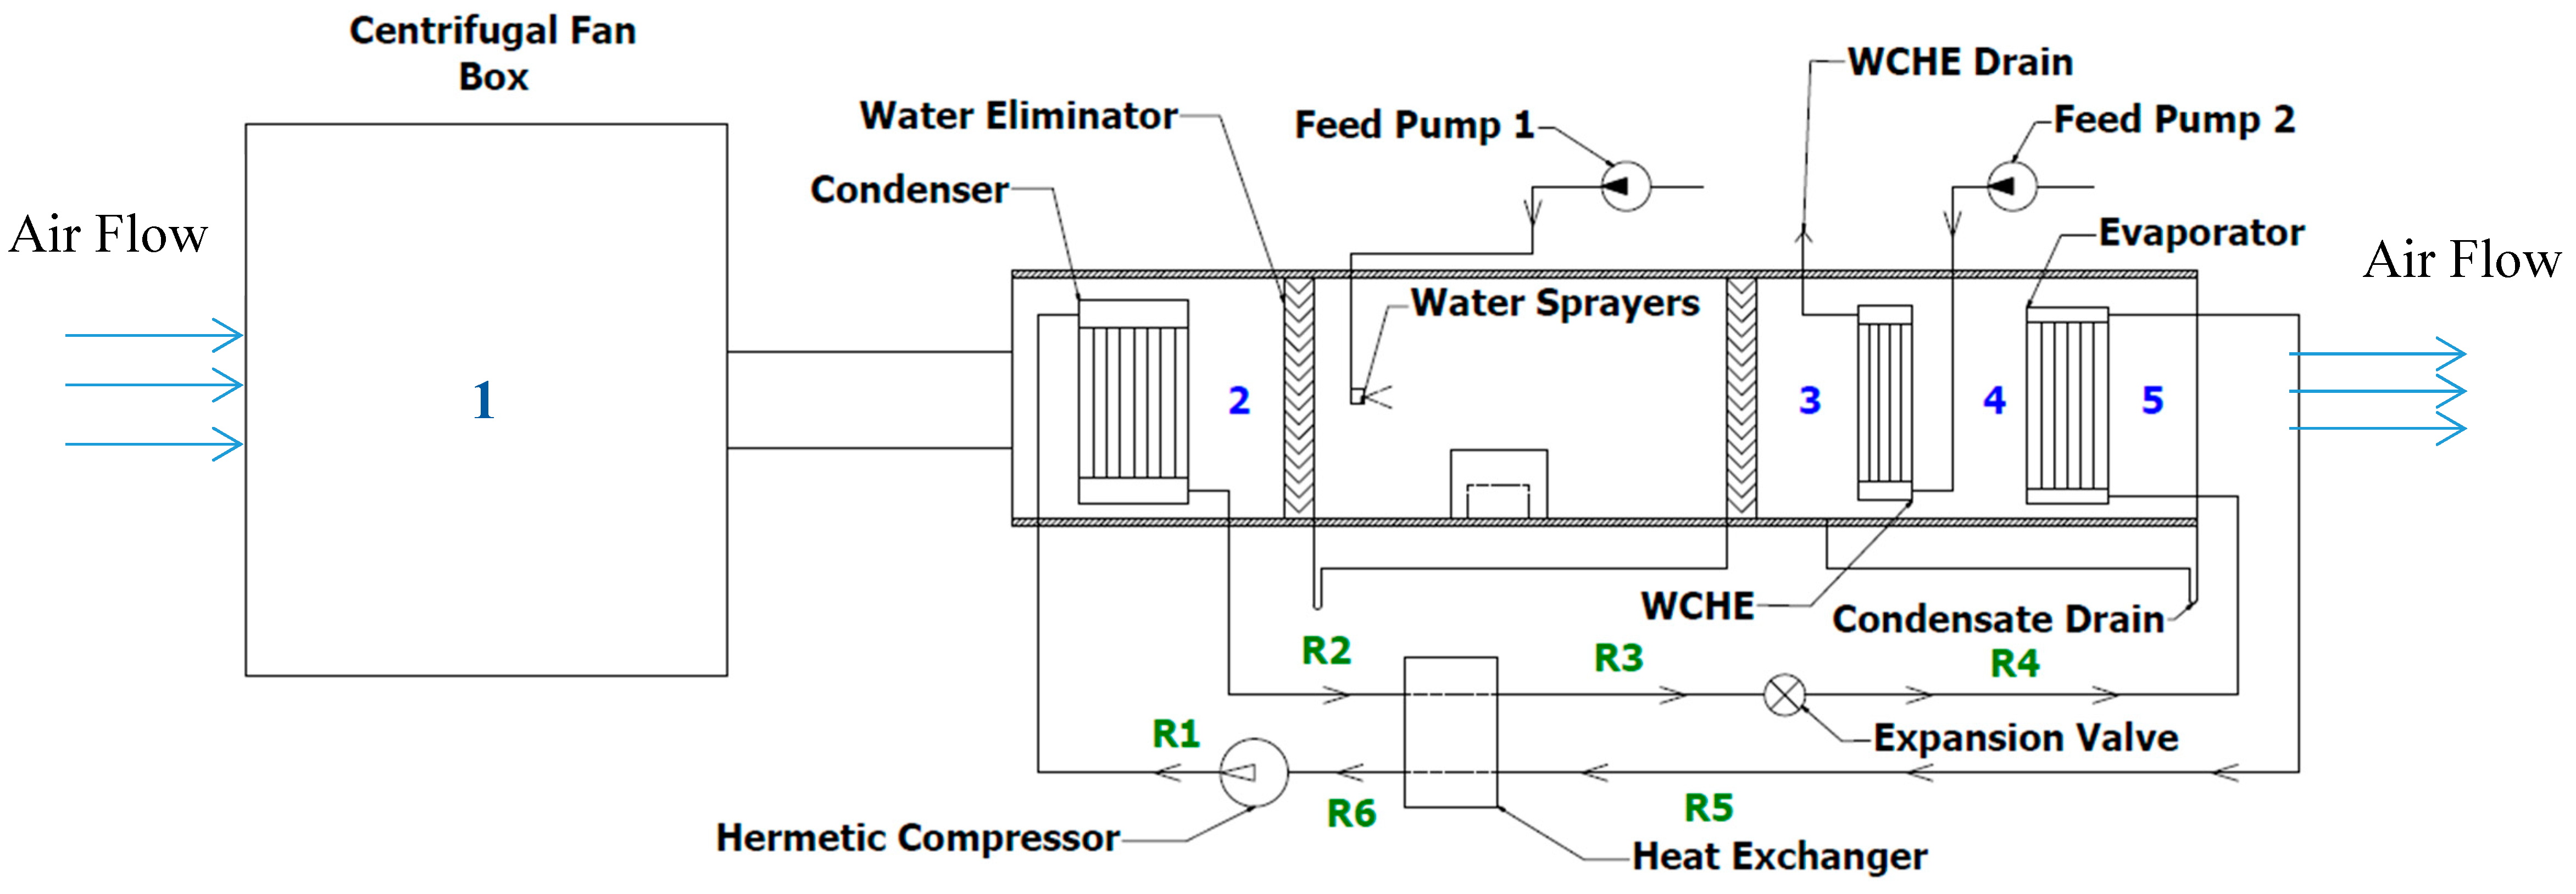
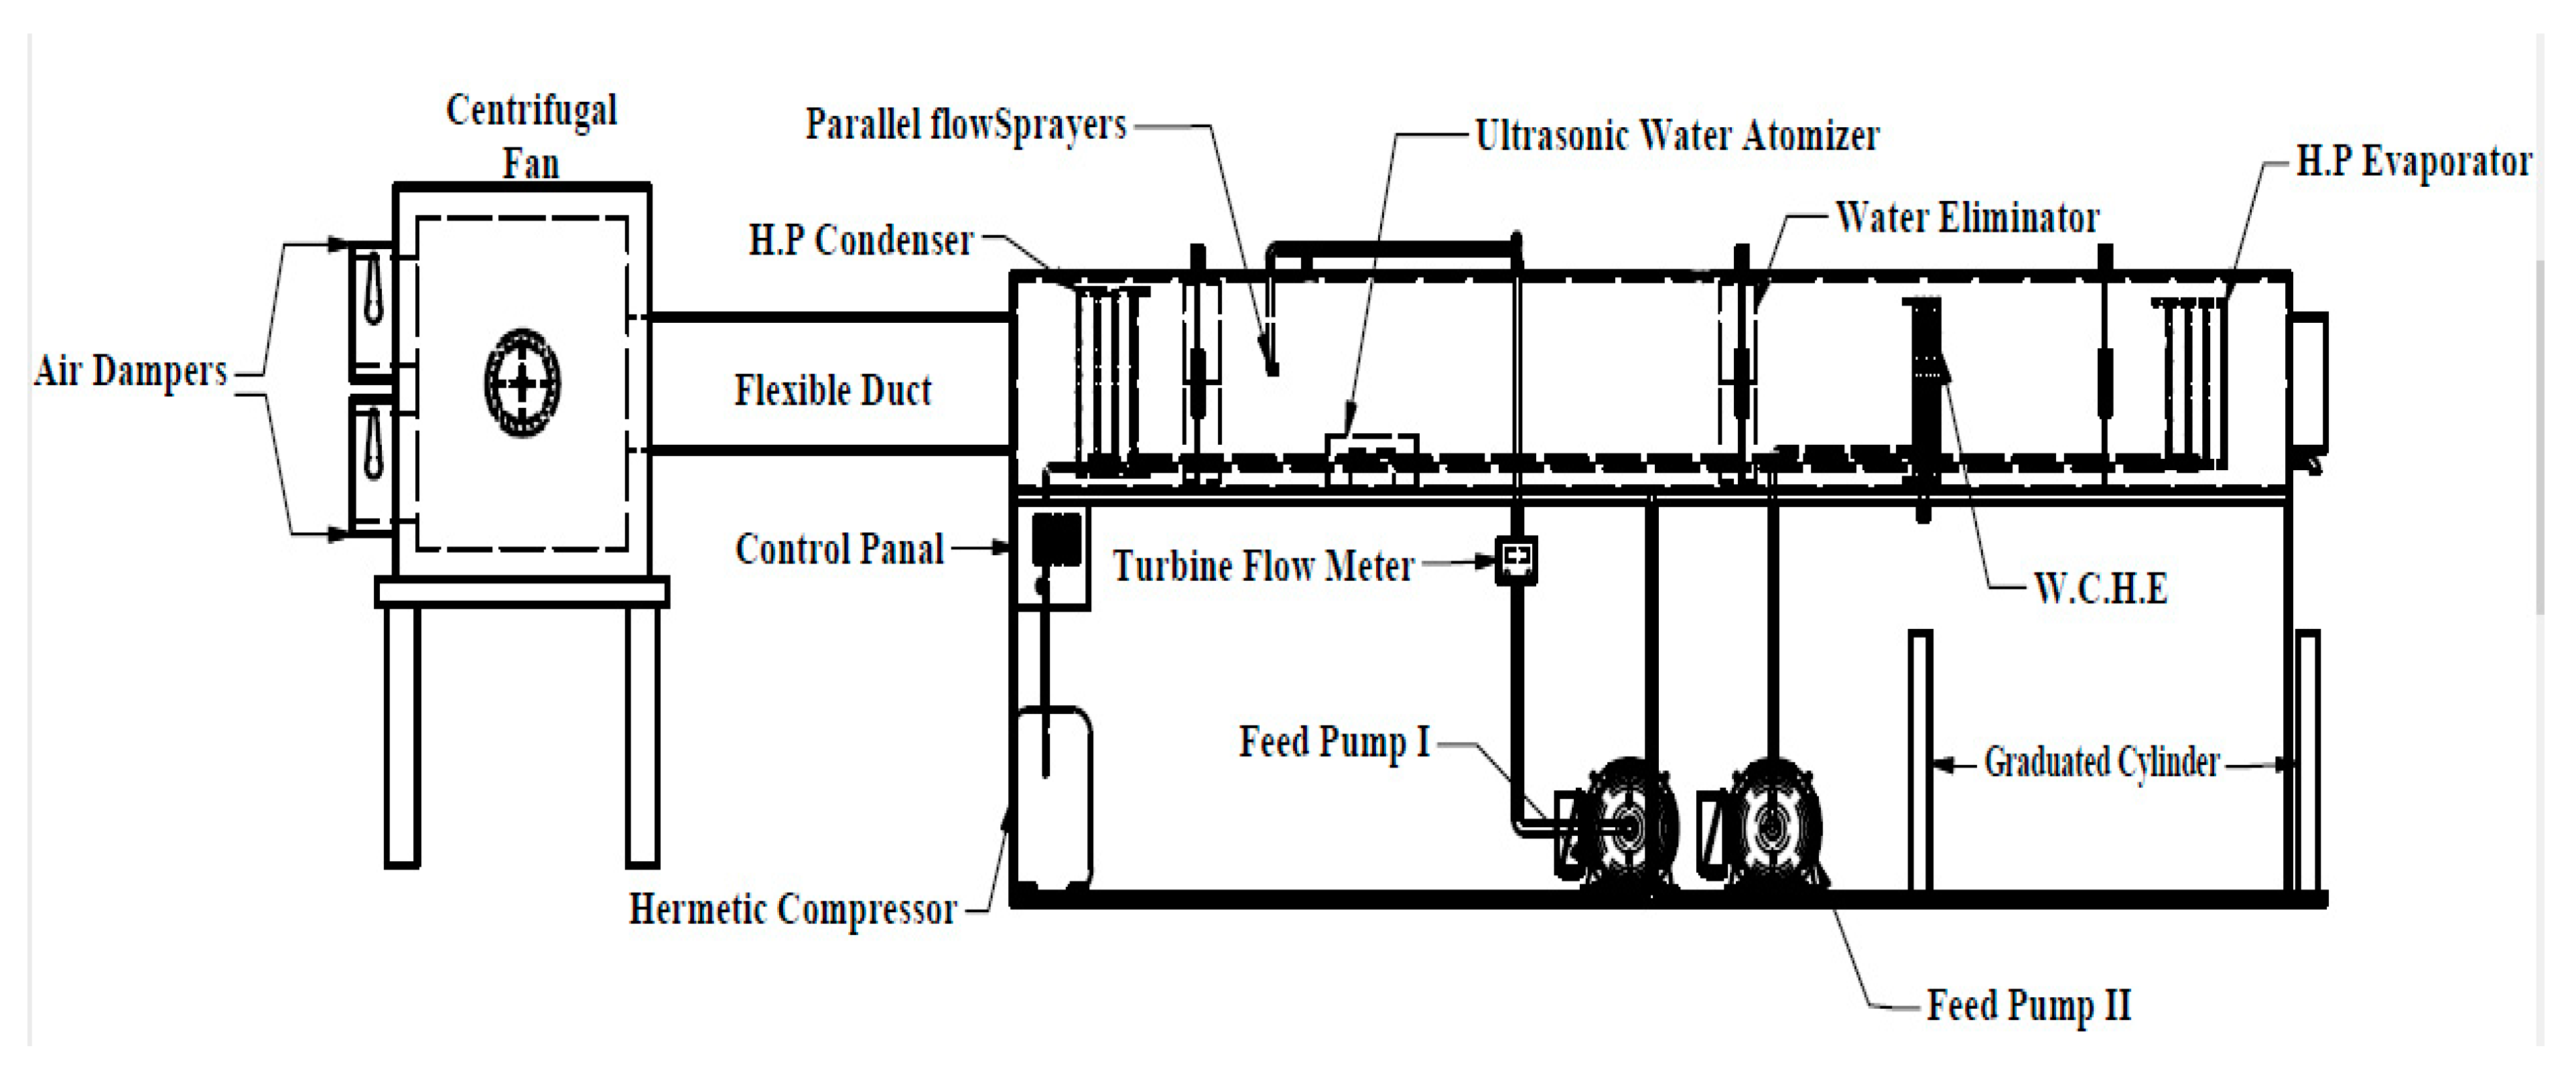
Figure 3, respectively. The heat pump is composed of five devices: an evaporator, a condenser, a compressor, a tree of capillary tubes, and a small heat exchanger located between the discharge line of the evaporator and the suction line of the heat pump compressor. The system configuration is based on an Open-air, Open-water cycle, and is air heated (AH). Air is withdrawn using a forced draft fan with two variable air dampers. As the air passes through the heat pump condenser, the air dry-bulb temperature increases. While the air crosses the heat pump condenser, the refrigerant is condensed, which consequently increases the air temperature. As the dry bulb temperature increases, the air becomes gluttonous to water.
Hot air gets humidified in the humidifier using two techniques. Firstly, a spray humidifier spraying saline water in parallel flow to the airflow. Secondly, by an ultrasonic atomizer generating a high-frequency sound wave. In the spray humidification step, a water eliminator is used to avoid the passage of any droplet of saline water to the other components of the system. After the humidification process, saturated air passes through a water-cooled heat exchanger (WCHE), simulating the effect of the weather conditions on saline water source temperature (three temperatures—15 °C, 20 °C, and 25 °C—were tested). The dehumidification process consists of two sections. The first is made up of the water-cooled heat exchanger, which improves the dehumidification process as it gets rid of some latent heat in the saturated air. In the other section, moist air passes through the heat pump evaporator; as a result, the heat content of moist air decreases, which is led in condensation of the water vapor, and freshwater is obtained. Finally, after the dehumidification process, the air is weeded out far from the working space in order to maintain the same operating conditions for all the experiments. The experiments carried out using different saline water of TDS at 35 (Mediterranean Sea), 7, 6, 5, 4, 3, 2, 1, and 0.35 g/kg.
4. Theoretical Model
Both energy and mass transfer balances of different elements of the systems are described in terms of unit size, operational conditions, and weather conditions. The steady-state approach for simulating the system assumes that there is no energy contained in each component’s building materials, thus ignoring the heat capacity of the materials.
To evaluate and investigate the performance of various parameters, such as air temperature, water temperature after each process, and productivity of the system, a mathematical model is developed. It solves energy balance equations for the heat pump condenser, humidifier, water-cooled heat exchanger and heat pump evaporator, where the previous parameters were studied under different conditions.
4.1. Heat Pump Condenser
The energy balance in the heat pump condenser, taking into consideration the steady-state condition, can be described as shown in Equation (1):
where
is the rate of heat transfer. This heat is introduced to the heat pump condenser via compressed refrigerant
, and specific enthalpy
. Moreover, there is heat that gets into the condenser from the ambient air of
. Therefore,
Due to the heat exchange between the hot refrigerant and ambient, air and refrigerant flows leave the heat pump condenser with an enthalpy of
and
, where air becomes dry and greedy to hold water vapor, while the refrigerant is condensed by losing its heat to the air.
The heat loss of the heat pump condenser to the atmosphere is determined using an analytical approach, assuming an average temperature,
, around the ambient temperature
.
where
is the average temperature between the refrigerant outlet temperature and the surrounding ambient temperature, so it can be written as follows:
Then, substituting Equations (2)–(4) into Equation (1), Equation (6) is obtained:
where
is the overall heat transfer coefficient and
is the outside surface area of the heat pump condenser.
The overall heat transfer coefficient in the condenser represents the sum of thermal resistance per unit area. It can be defined as:
while the overall fin efficiency can be calculated using Equation (8):
The fin efficiency in the condenser can be defined as:
where
mm is:
In the heat pump condenser, the outside heat transfer coefficient of the tubes as presented in [
27] is:
where
is the ratio of the surface area of the tube with fin per unit of length of the tube to the surface area without fin [
28]:
4.2. Humidifier
In the humidification process, the flow of spraying saline water is in parallel with the airflow according to our previous results (El-Maghlany et al. [
19]), which indicated that the highest humidification effectiveness and productivity were obtained with the parallel spraying system. Therefore, the model of the humidification process is based on a parallel-flow heat exchange between the sprayed saline water and the airflow. Furthermore, in the case of using an ultrasonic water atomizer, it produces water vapor, which is also flowing in the same direction as the airflow.
The energy balance in the humidification section, taking into consideration the steady-state condition, is presented in the following subsections.
4.2.1. Spraying System
where energy inlet to the humidifier is
while energy outlet from the humidifier is
Finally, energy loss at humidifier is
Then, by substituting Equations (16)–(18) into Equation (15), the total system energy balance for a humidifier is found as follows:
Air enthalpy is determined by air temperature and humidity as reported in [
11]:
The effectiveness of the humidification process can be calculated using Equation (21) for a parallel flow arrangement [
27]:
where
is the heat capacity ratio of air/water (minimum-to-maximum) streams,
NTU is the number of transfer units,
is the actual heat transferred, and
is the maximum possible heat that could be transferred.
where
is the minimum heat capacity of the air or water stream. It is related to the mass flow rate ratio of the HDH cycle, as presented by Sharqawy et al. [
29]
The mass transfer rate in the humidifier as presented in [
11]:
where (
k) is the mass transfer coefficient, (
a) is the humidifier substratum specific area, and
is the humidifier volume. While (
e) is, the correction factor due to the direction of the flow is equal to one because the flow here is parallel.
4.2.2. Ultrasonic Atomizer
In the case of using an ultrasonic atomizer, the atomized feed water output is assumed to be saturated vapor, where the enthalpy of the output water vapor,
is determined by both the inlet feed water temperature and the atmospheric pressure. According to this, the model of the ultrasonic atomizer is the same as the model of the spraying system except for the following Equation (26):
4.2.3. Hybrid System
The hybrid system combines the spraying and the ultrasonic atomization techniques. To determine the properties of the humidified air after the combined process, the mixture of the humidified air from the spraying system and the water vapor produced by the ultrasonic atomizer is considered. The enthalpy of the mixture can be finally calculated using Equation (27):
4.3. Dehumidifier
The dehumidification process is divided into two successive sections so that in the first section, the moist air passes through a water-cooled heat exchanger (WCHE). Meanwhile, in the second, moist air passes through the heat pump evaporator.
4.3.1. Water-Cooled Heat Exchanger
Similarly, the energy balance in the WCHE can be written as follows:
where energy inlet to the WCHE is
while energy outlet from the WCHE is
Finally, energy loss at WCHE is
Then, by substituting Equations (29)–(31) into Equation (28), the total system energy balance for WCHE is obtained as follows:
The effectiveness of the WCHE can be calculated using Equation (33), where the flow between cooling water and moist air is a crossflow arrangement [
27]:
4.3.2. Heat Pump Evaporator
Continuing the dehumidification process, energy balance is also performed in the second stage of the dehumidification process and written as follows:
where energy inlet to the evaporator is
while energy outlet from the evaporator is
Finally, energy loss at the evaporator is
Then, by substituting Equations (35)–(37) into Equation (34), the total system energy balance for the evaporator is found as follows:
The distillate flow rate is estimated from a mass balance, taking into account the difference in water content among air inlet and outlet from the dehumidification process, where distilled water is accumulated. This distillation rate is defined as presented by [
19]:
4.4. Solution Technique
The mathematical modeling for the heat pump condenser, humidifier, and dehumidifier is solved using MATLAB 2015. The following parameters are considered as shown:
Flow rates: , , , , and
Fluid properties: , , ,, and
Dimensions (external and internal): Heat pump condenser, humidifier, water-cooled heat exchanger, and heat pump evaporator.
is considered constant.
The performance of the heat pump is constant.
To assess the desalination process performance, specific productivity is used and calculated using Equation (40), which defines the amount of freshwater produced per unit of energy (kWh),
where
energy consumption is calculated by getting the electric
energy consumption for each component using electricity, such as a heat pump compressor, centrifugal fan, saline water feed pump, and the ultrasonic water atomizer. Therefore, electric power consumption can be written as follows:
5. Results and Discussion
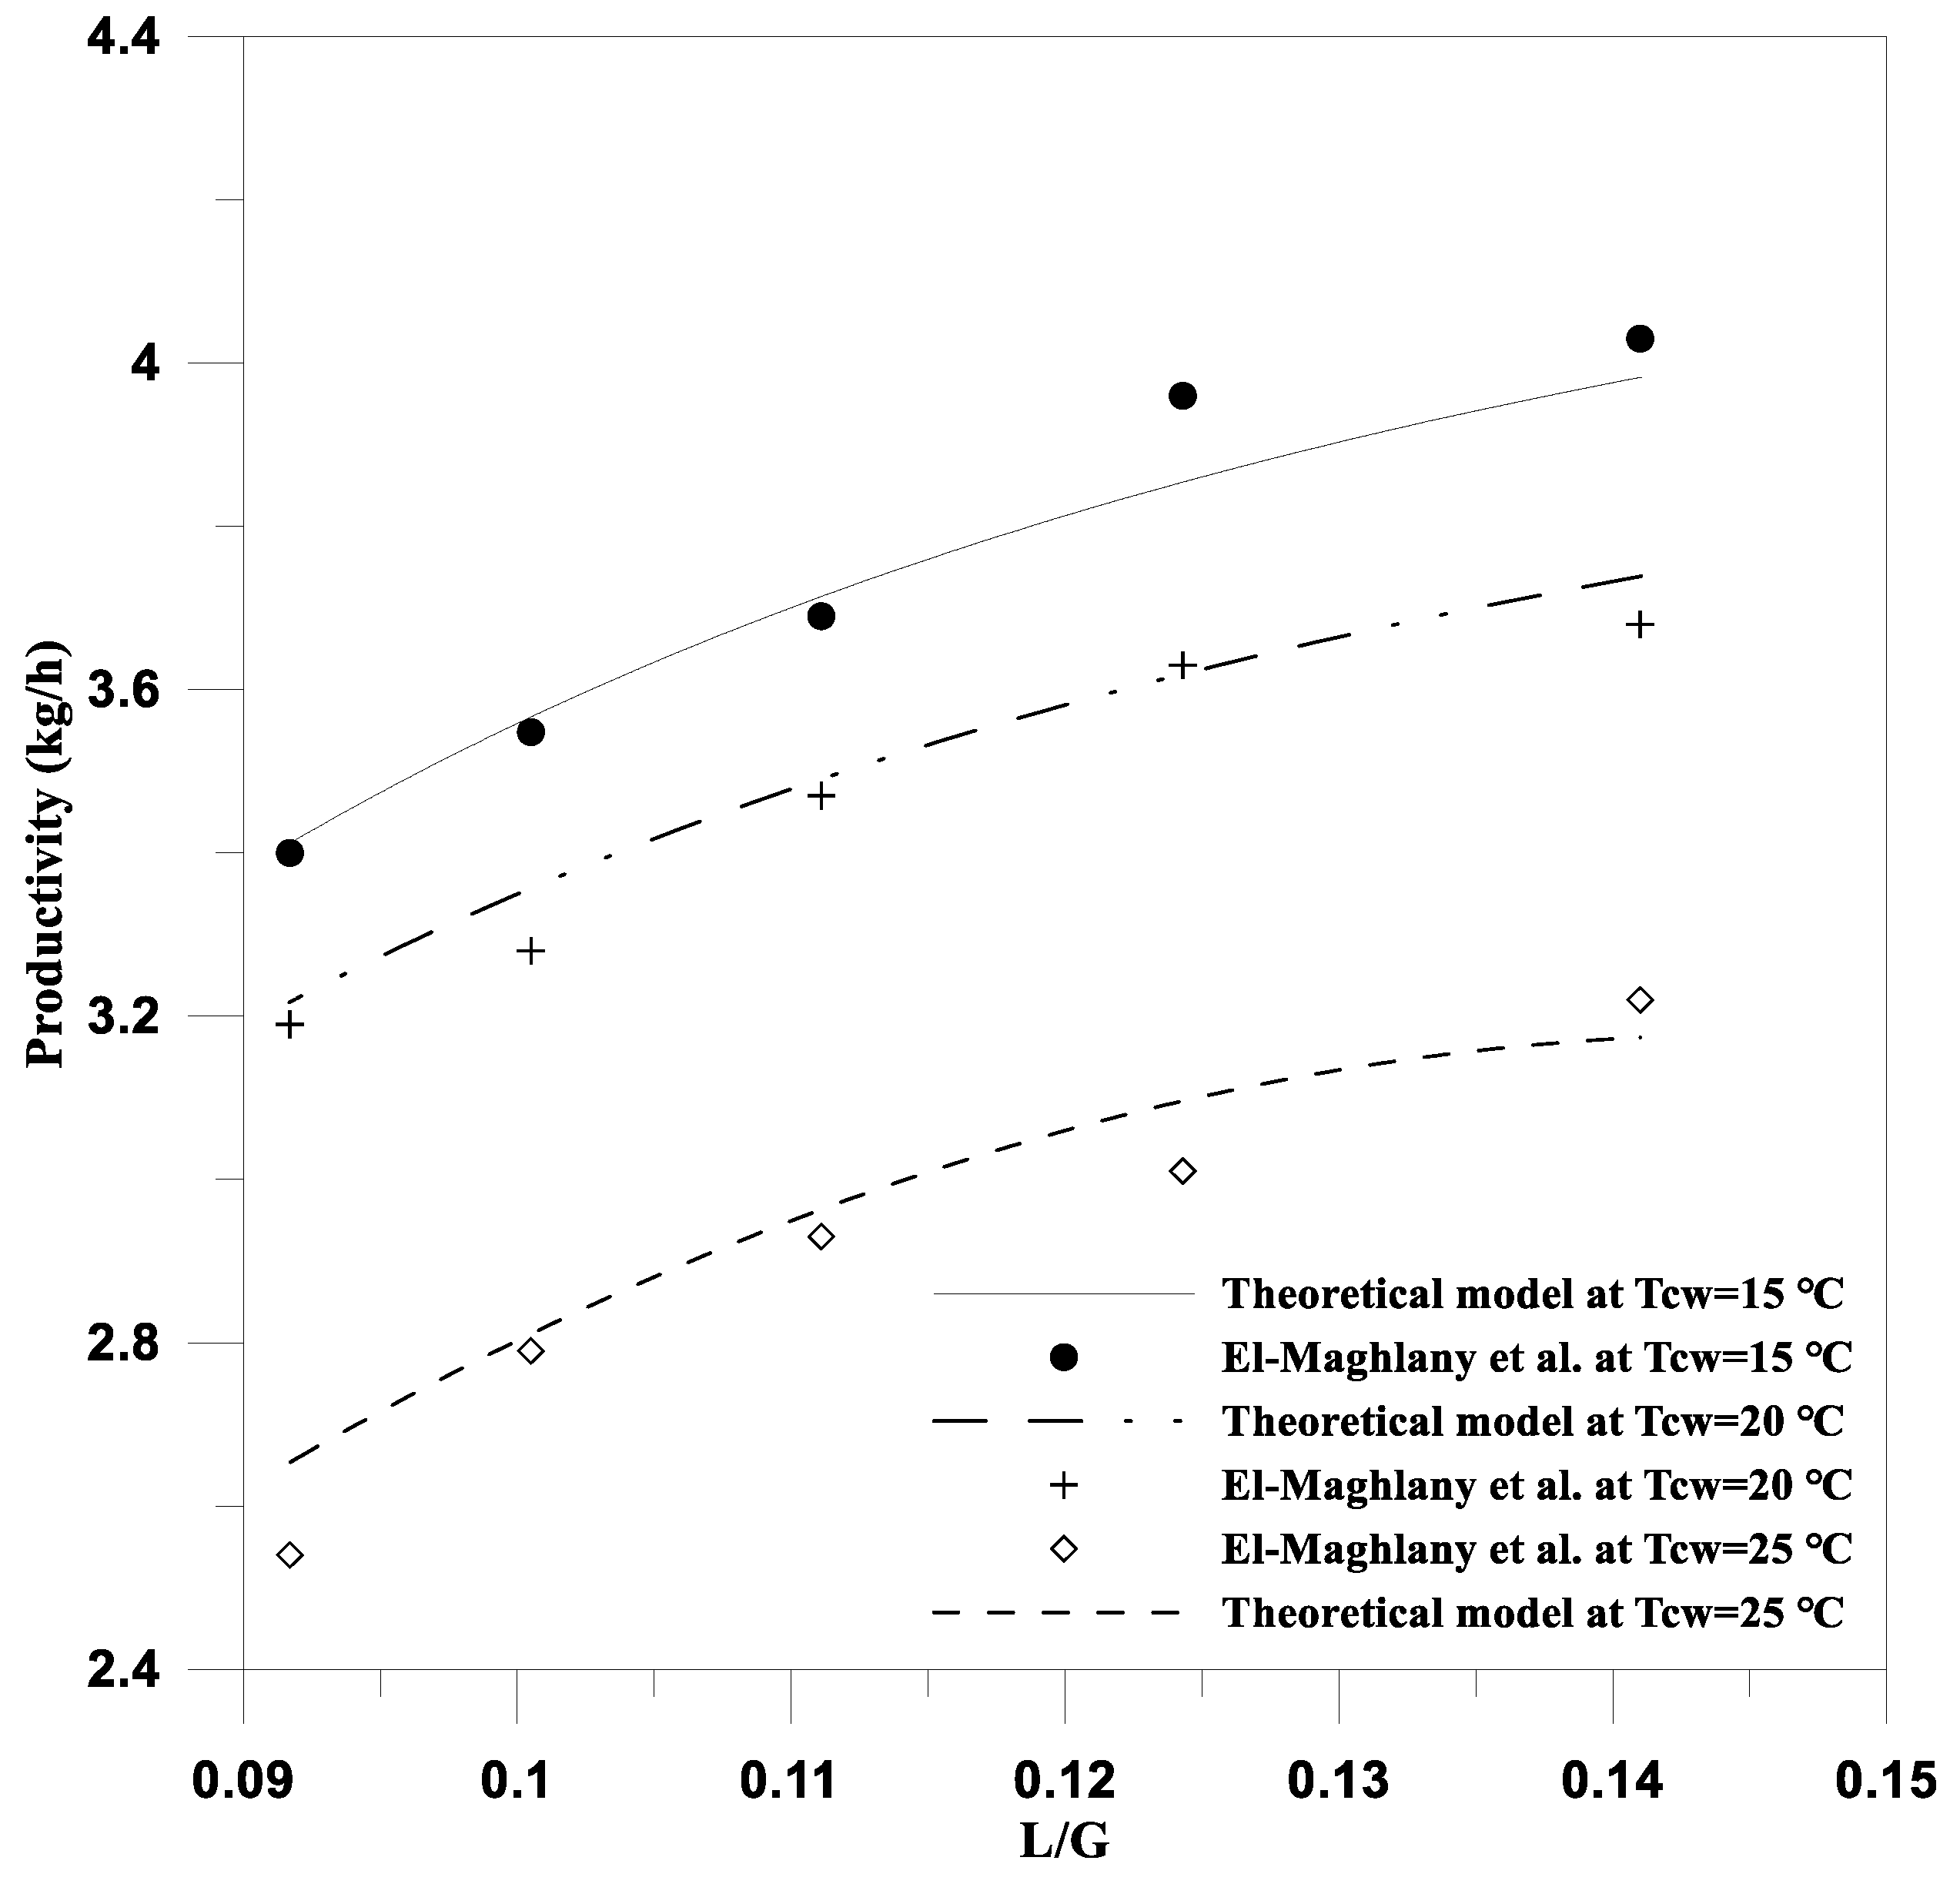
The proposed theoretical model is related to the spraying atomization method, which was already validated by our previous work [
19]. The main results are shown in
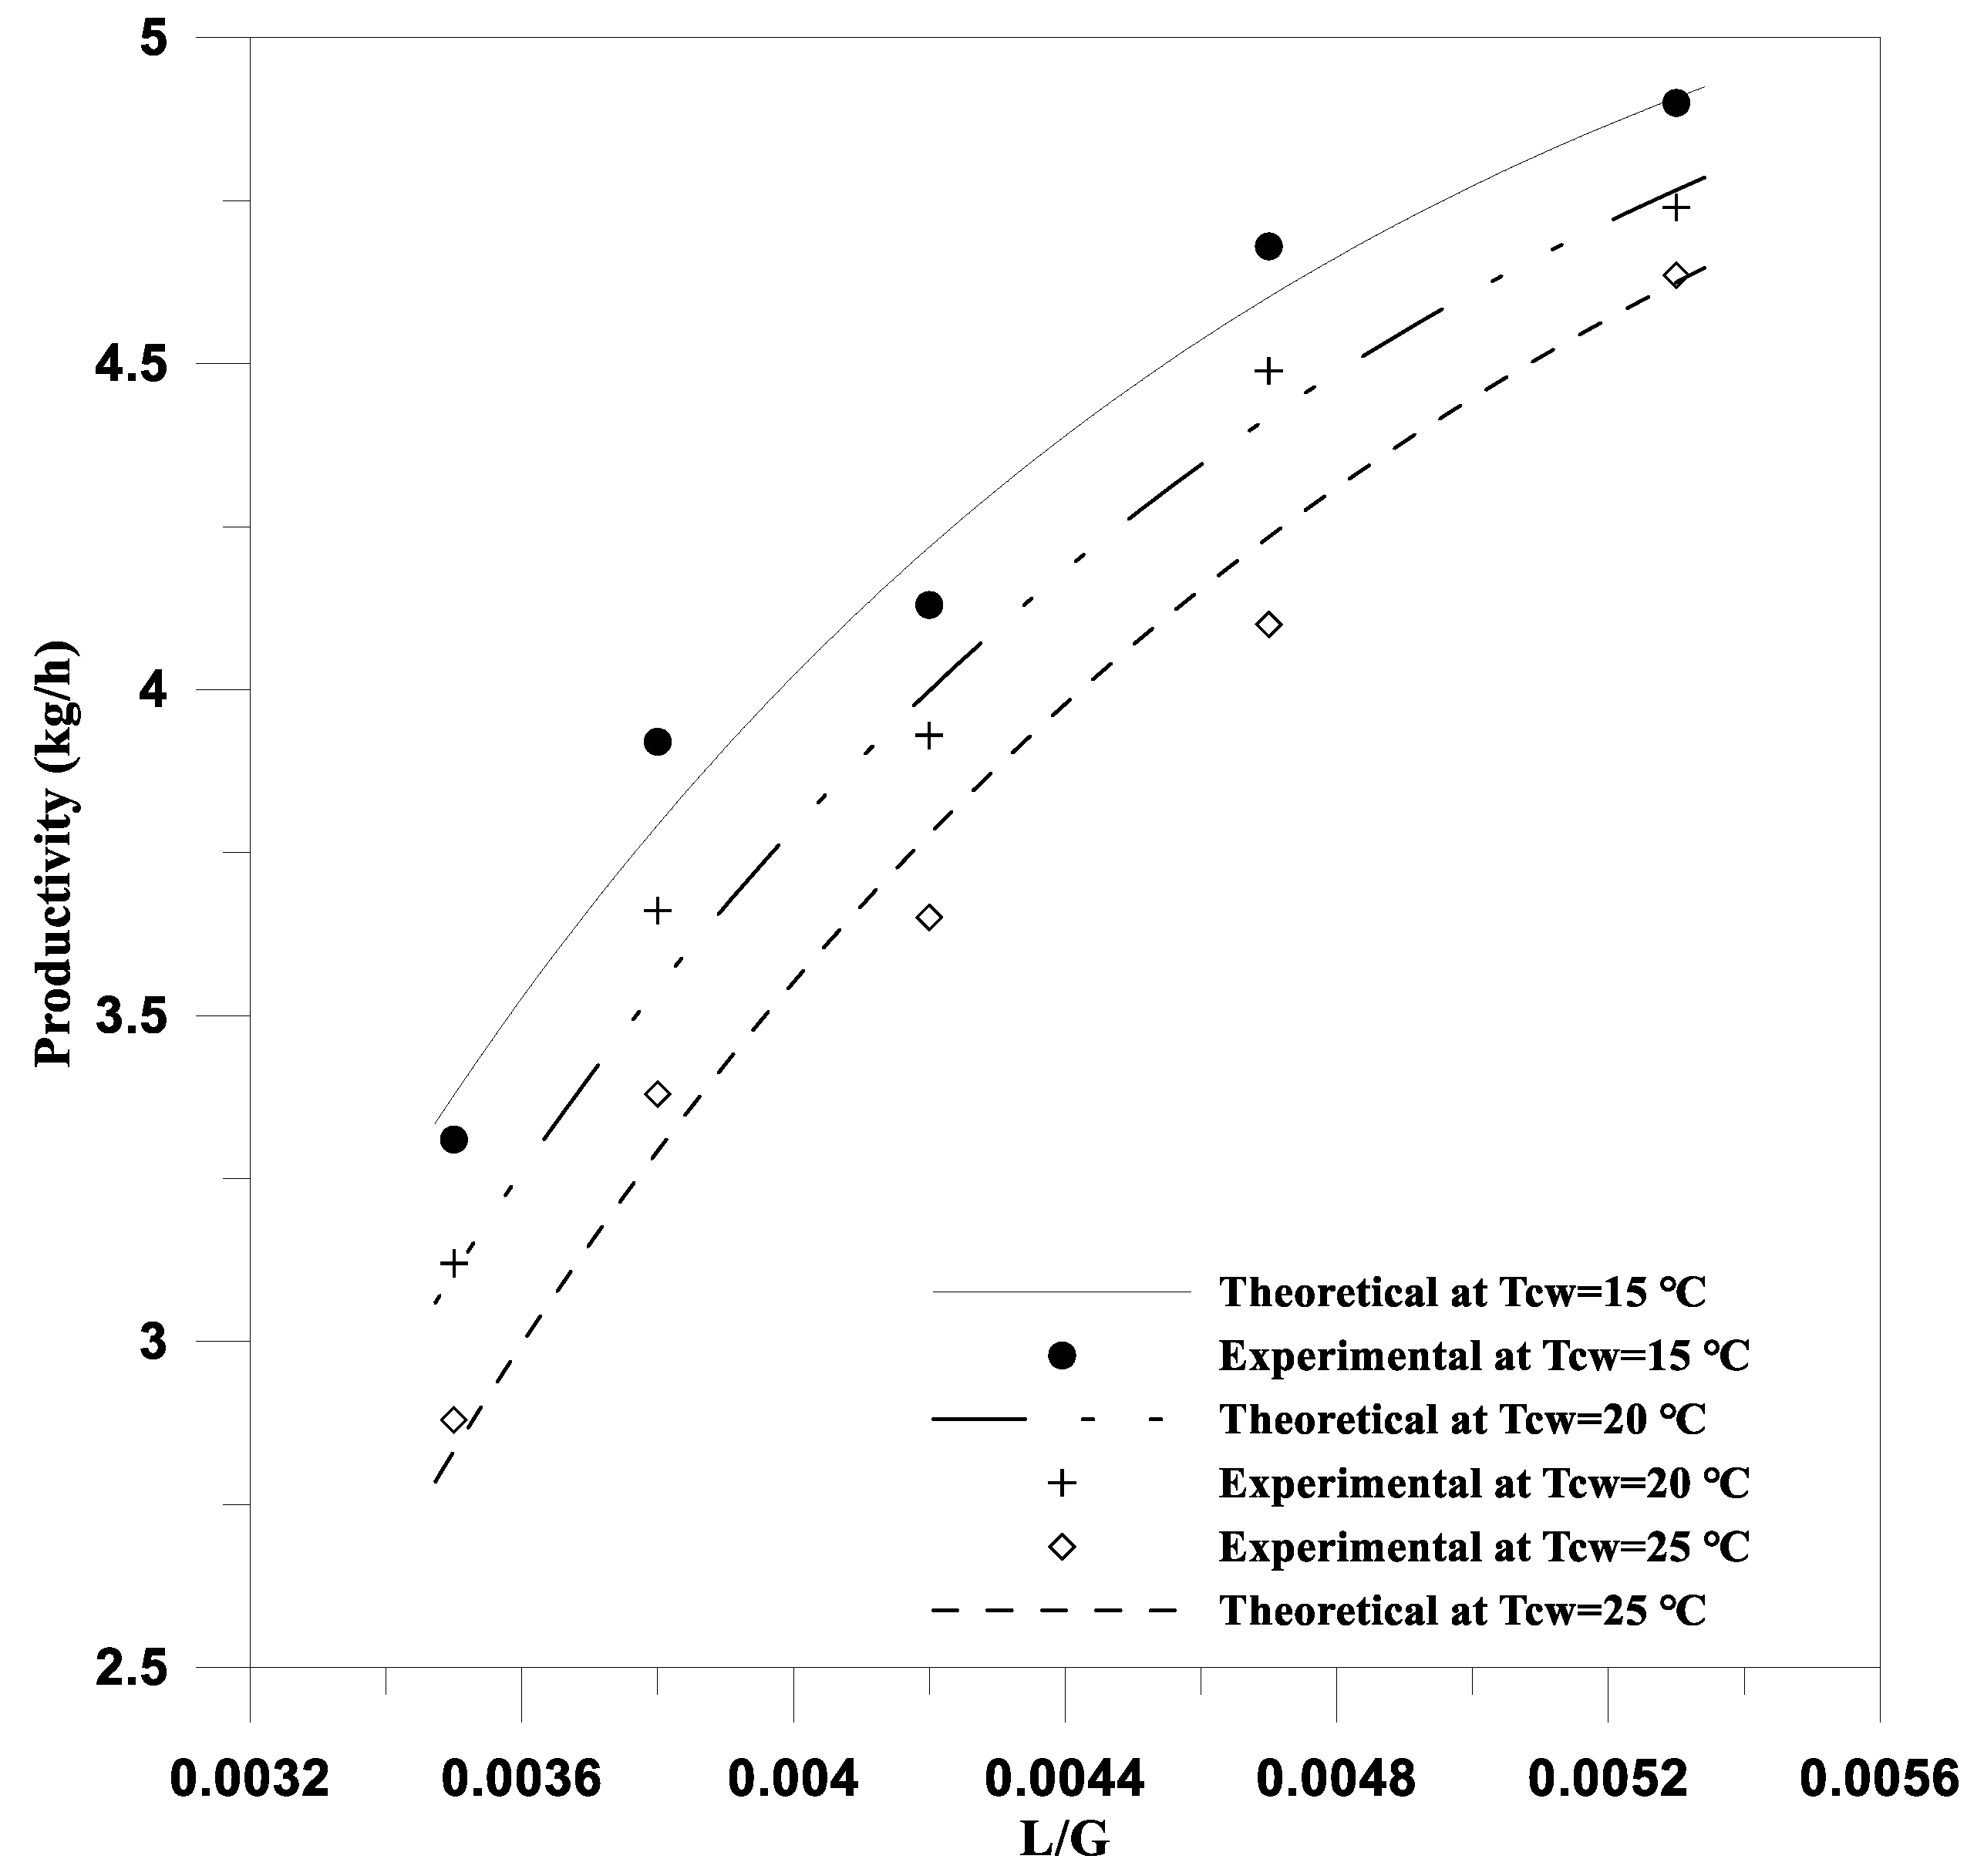
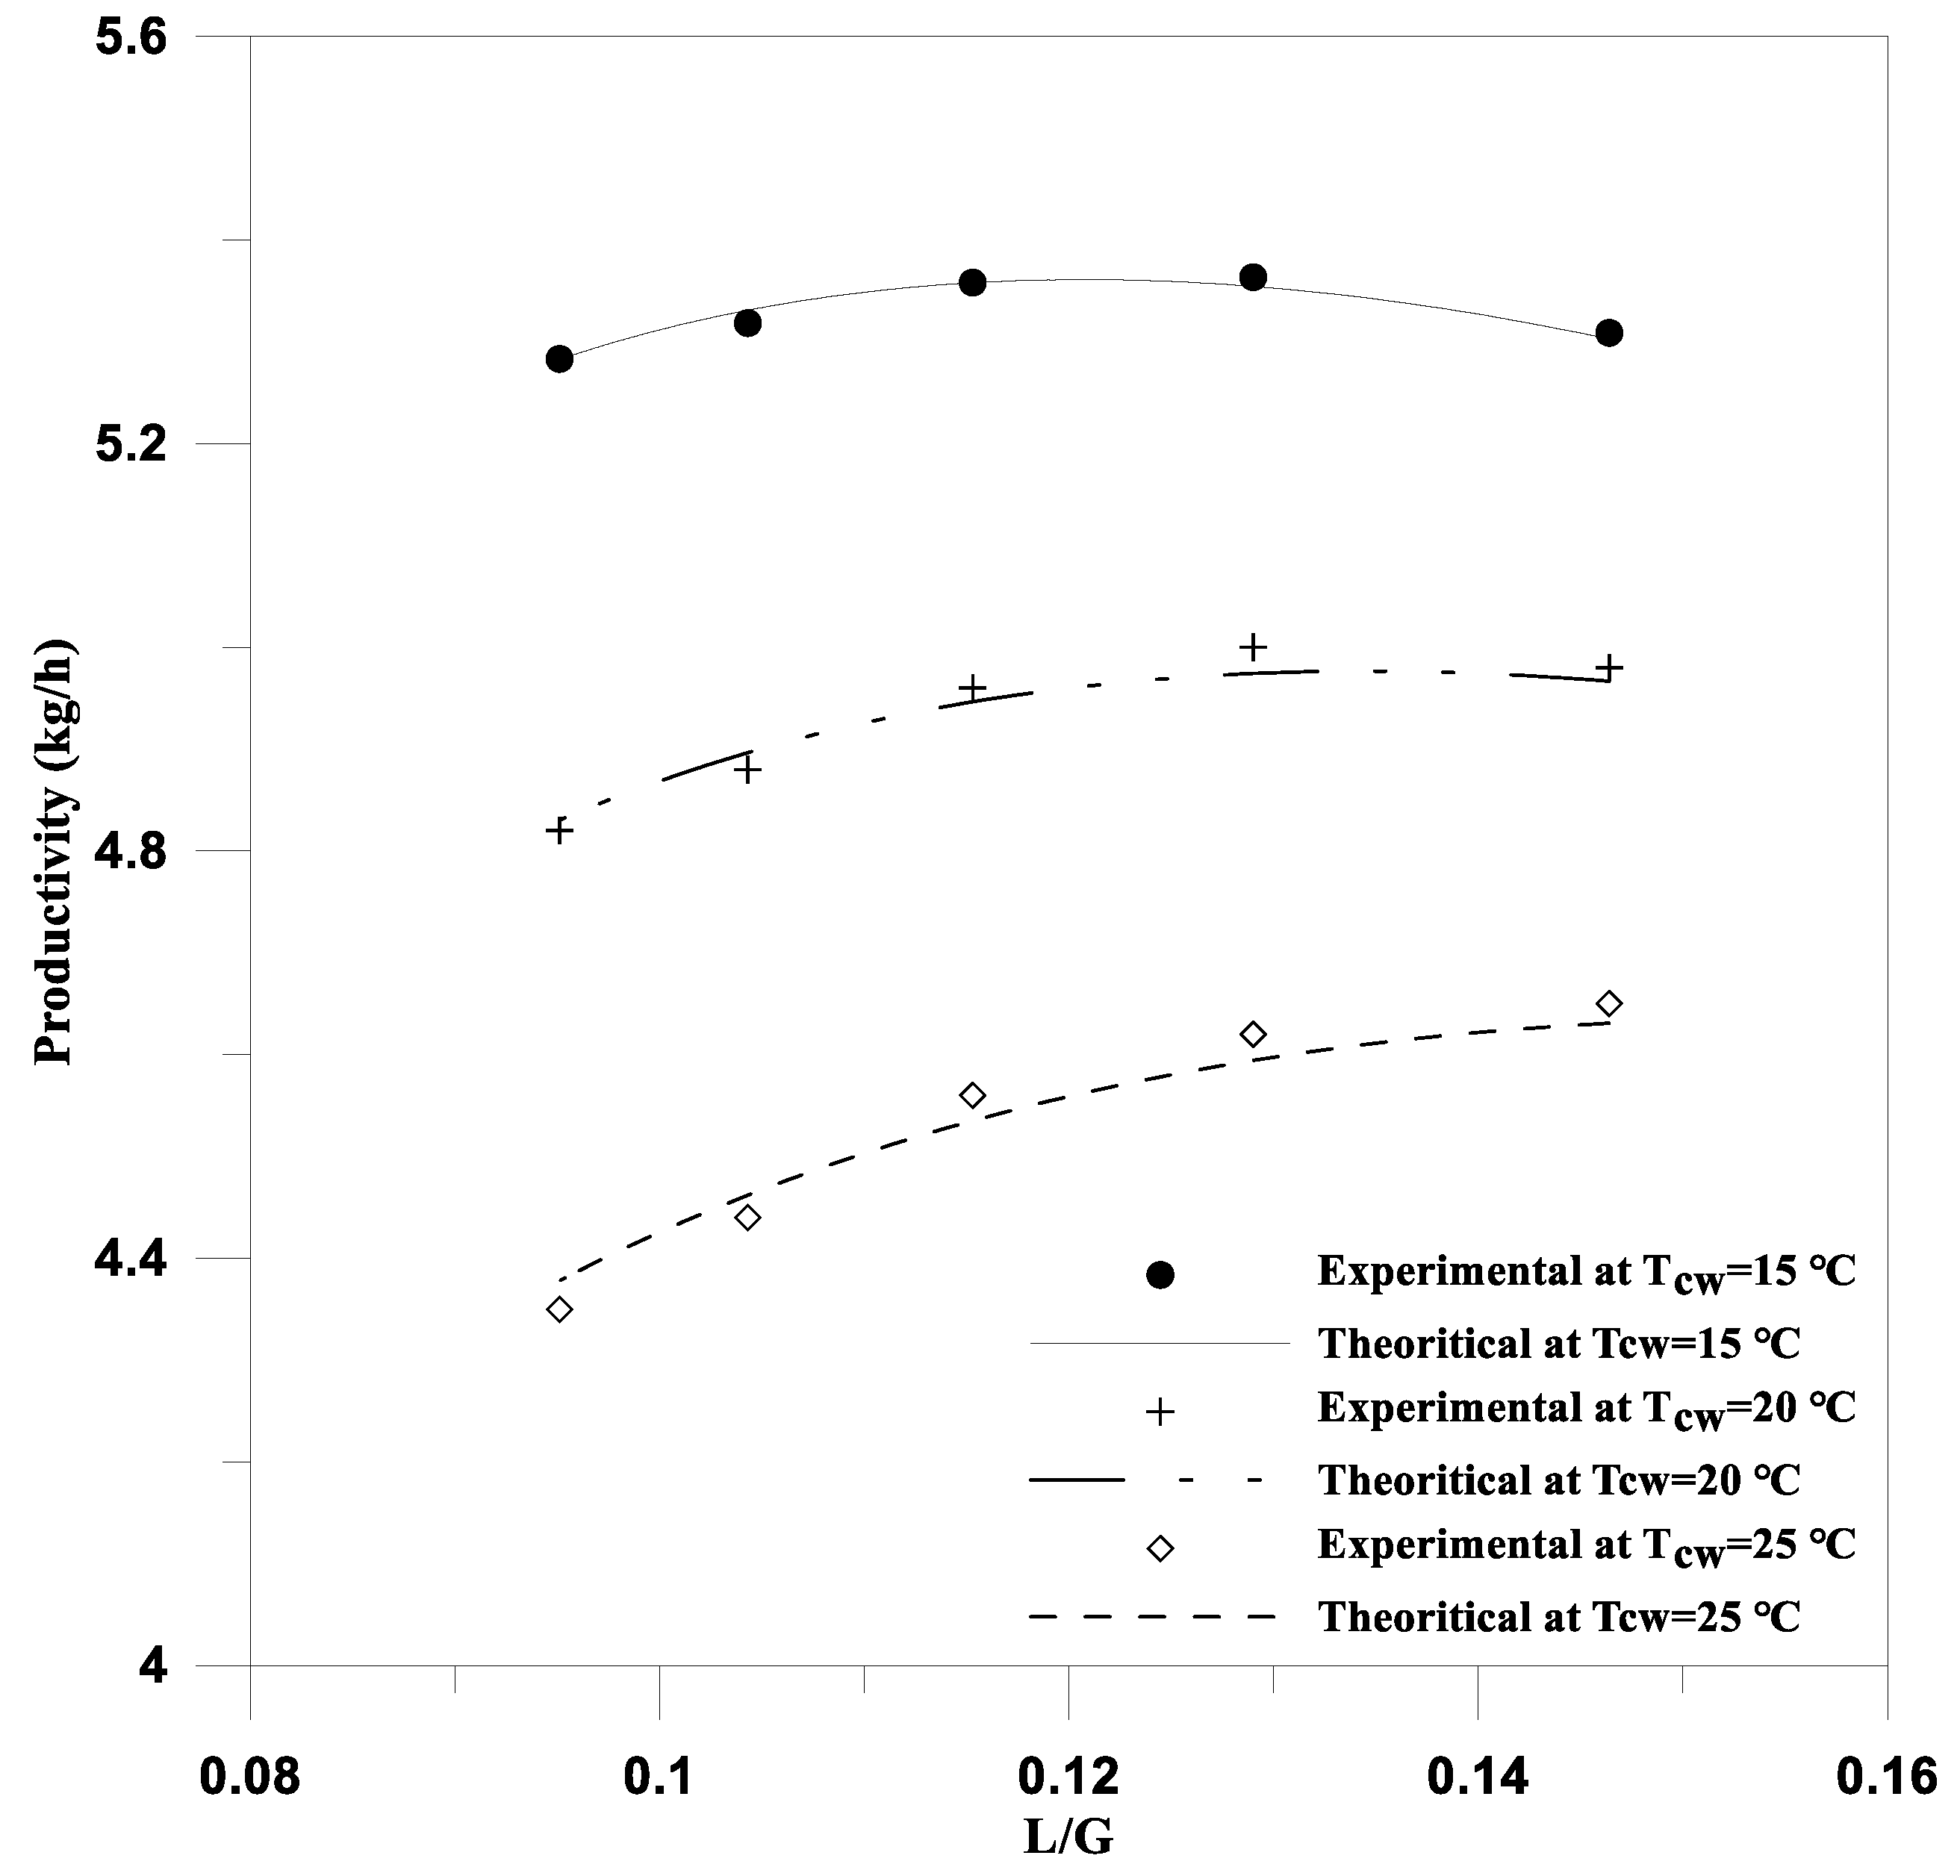
Figure 6, in terms of the productivity of the desalination unit. A mean deviation of only 0.168 was observed between the productivity calculated by the physical model and by the experimental data. In this work, the validation of the model using ultrasonic water atomization was performed (
Figure 7). In essence, the mean deviation of the productivity calculated by the physical model and the experimental data amounts to 0.468. The experiments showed that the traditional system produced freshwater with TDS of 0.16 g/kg in the case of using Mediterranean seawater as feedwater. In comparison, in the case of using low salinity feedwater, the freshwater resulted in a constant TDS value of 0.02 g/kg.
Different humidification processes (spraying atomization, ultrasonic water atomization, and hybrid atomization) are evaluated and compared in this work.
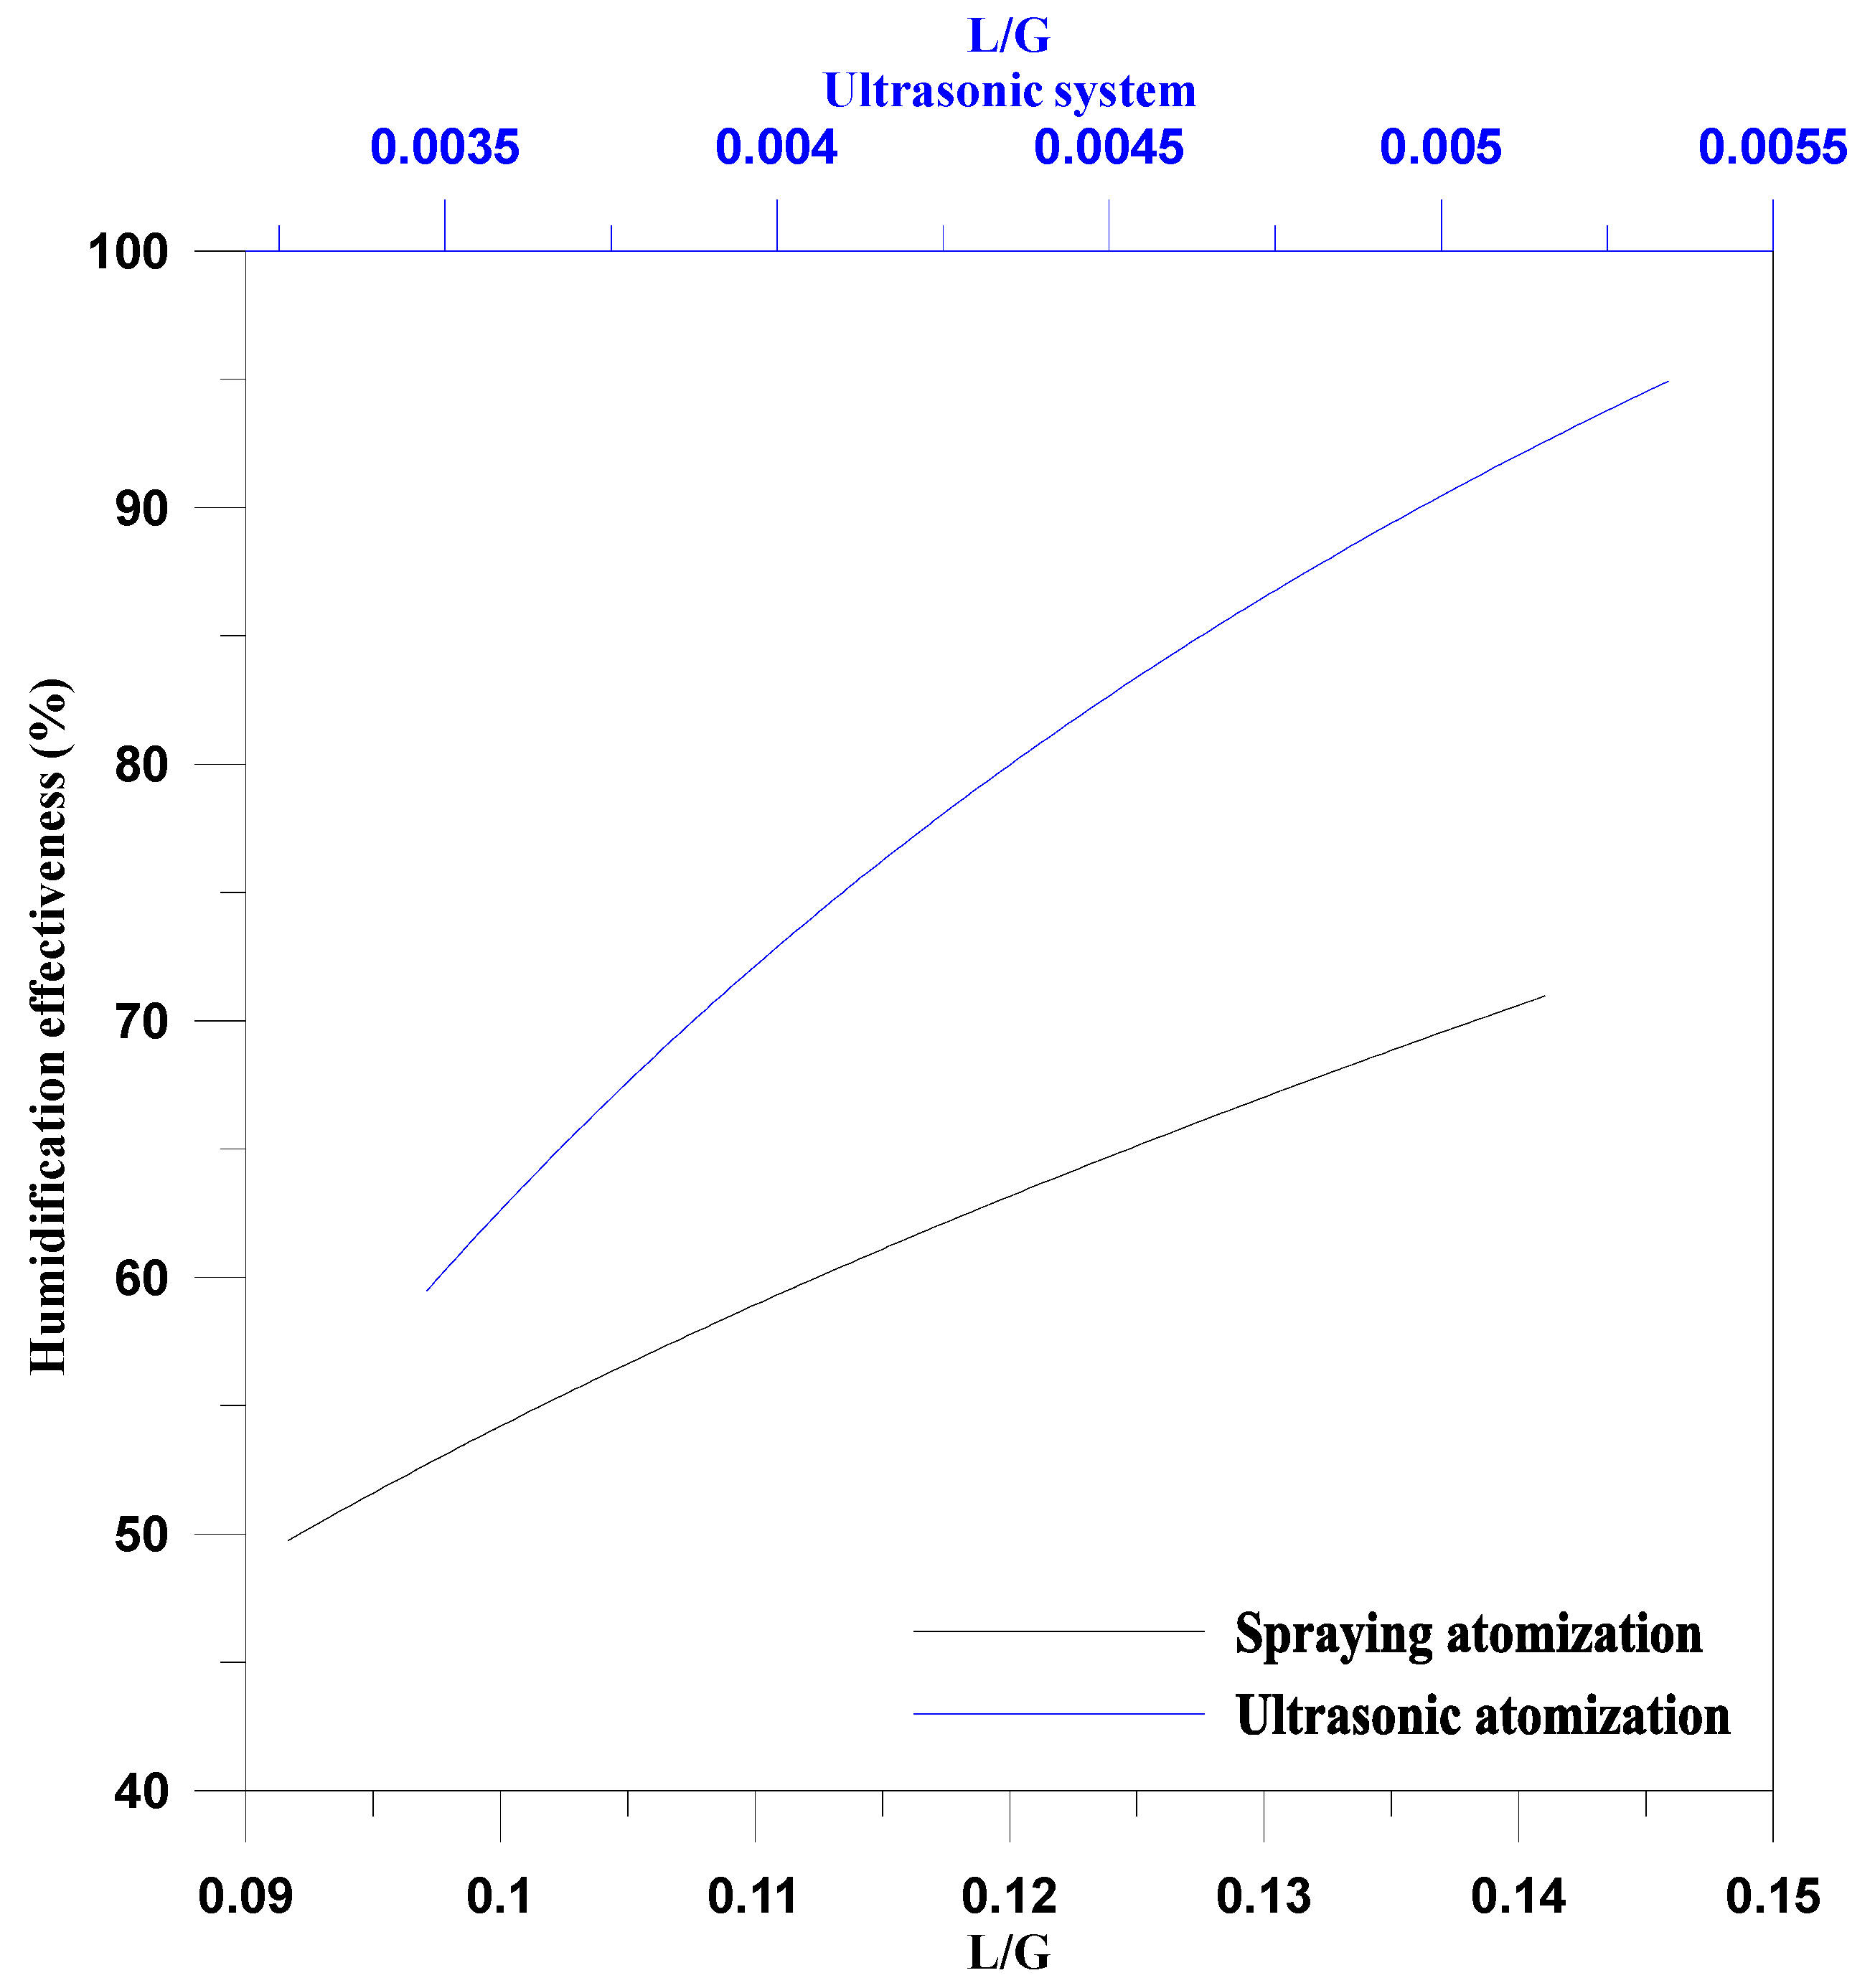
Figure 8 shows the humidification effectiveness for both spraying and ultrasonic water atomization methods at the same operating conditions (dry bulb temperature of 50 °C and relative humidity of 8%). The effectiveness of the process is more significant with the ultrasonic water atomization than with the simple spraying system. The comparison between these two humidification methods should also take into account that the ultrasonic atomizer produces just 5 kg/h of vapor, whereas direct spraying produces 132 kg/h of vapor. However, the low water consumption and the high effectiveness make ultrasonic atomization a remarkable option.
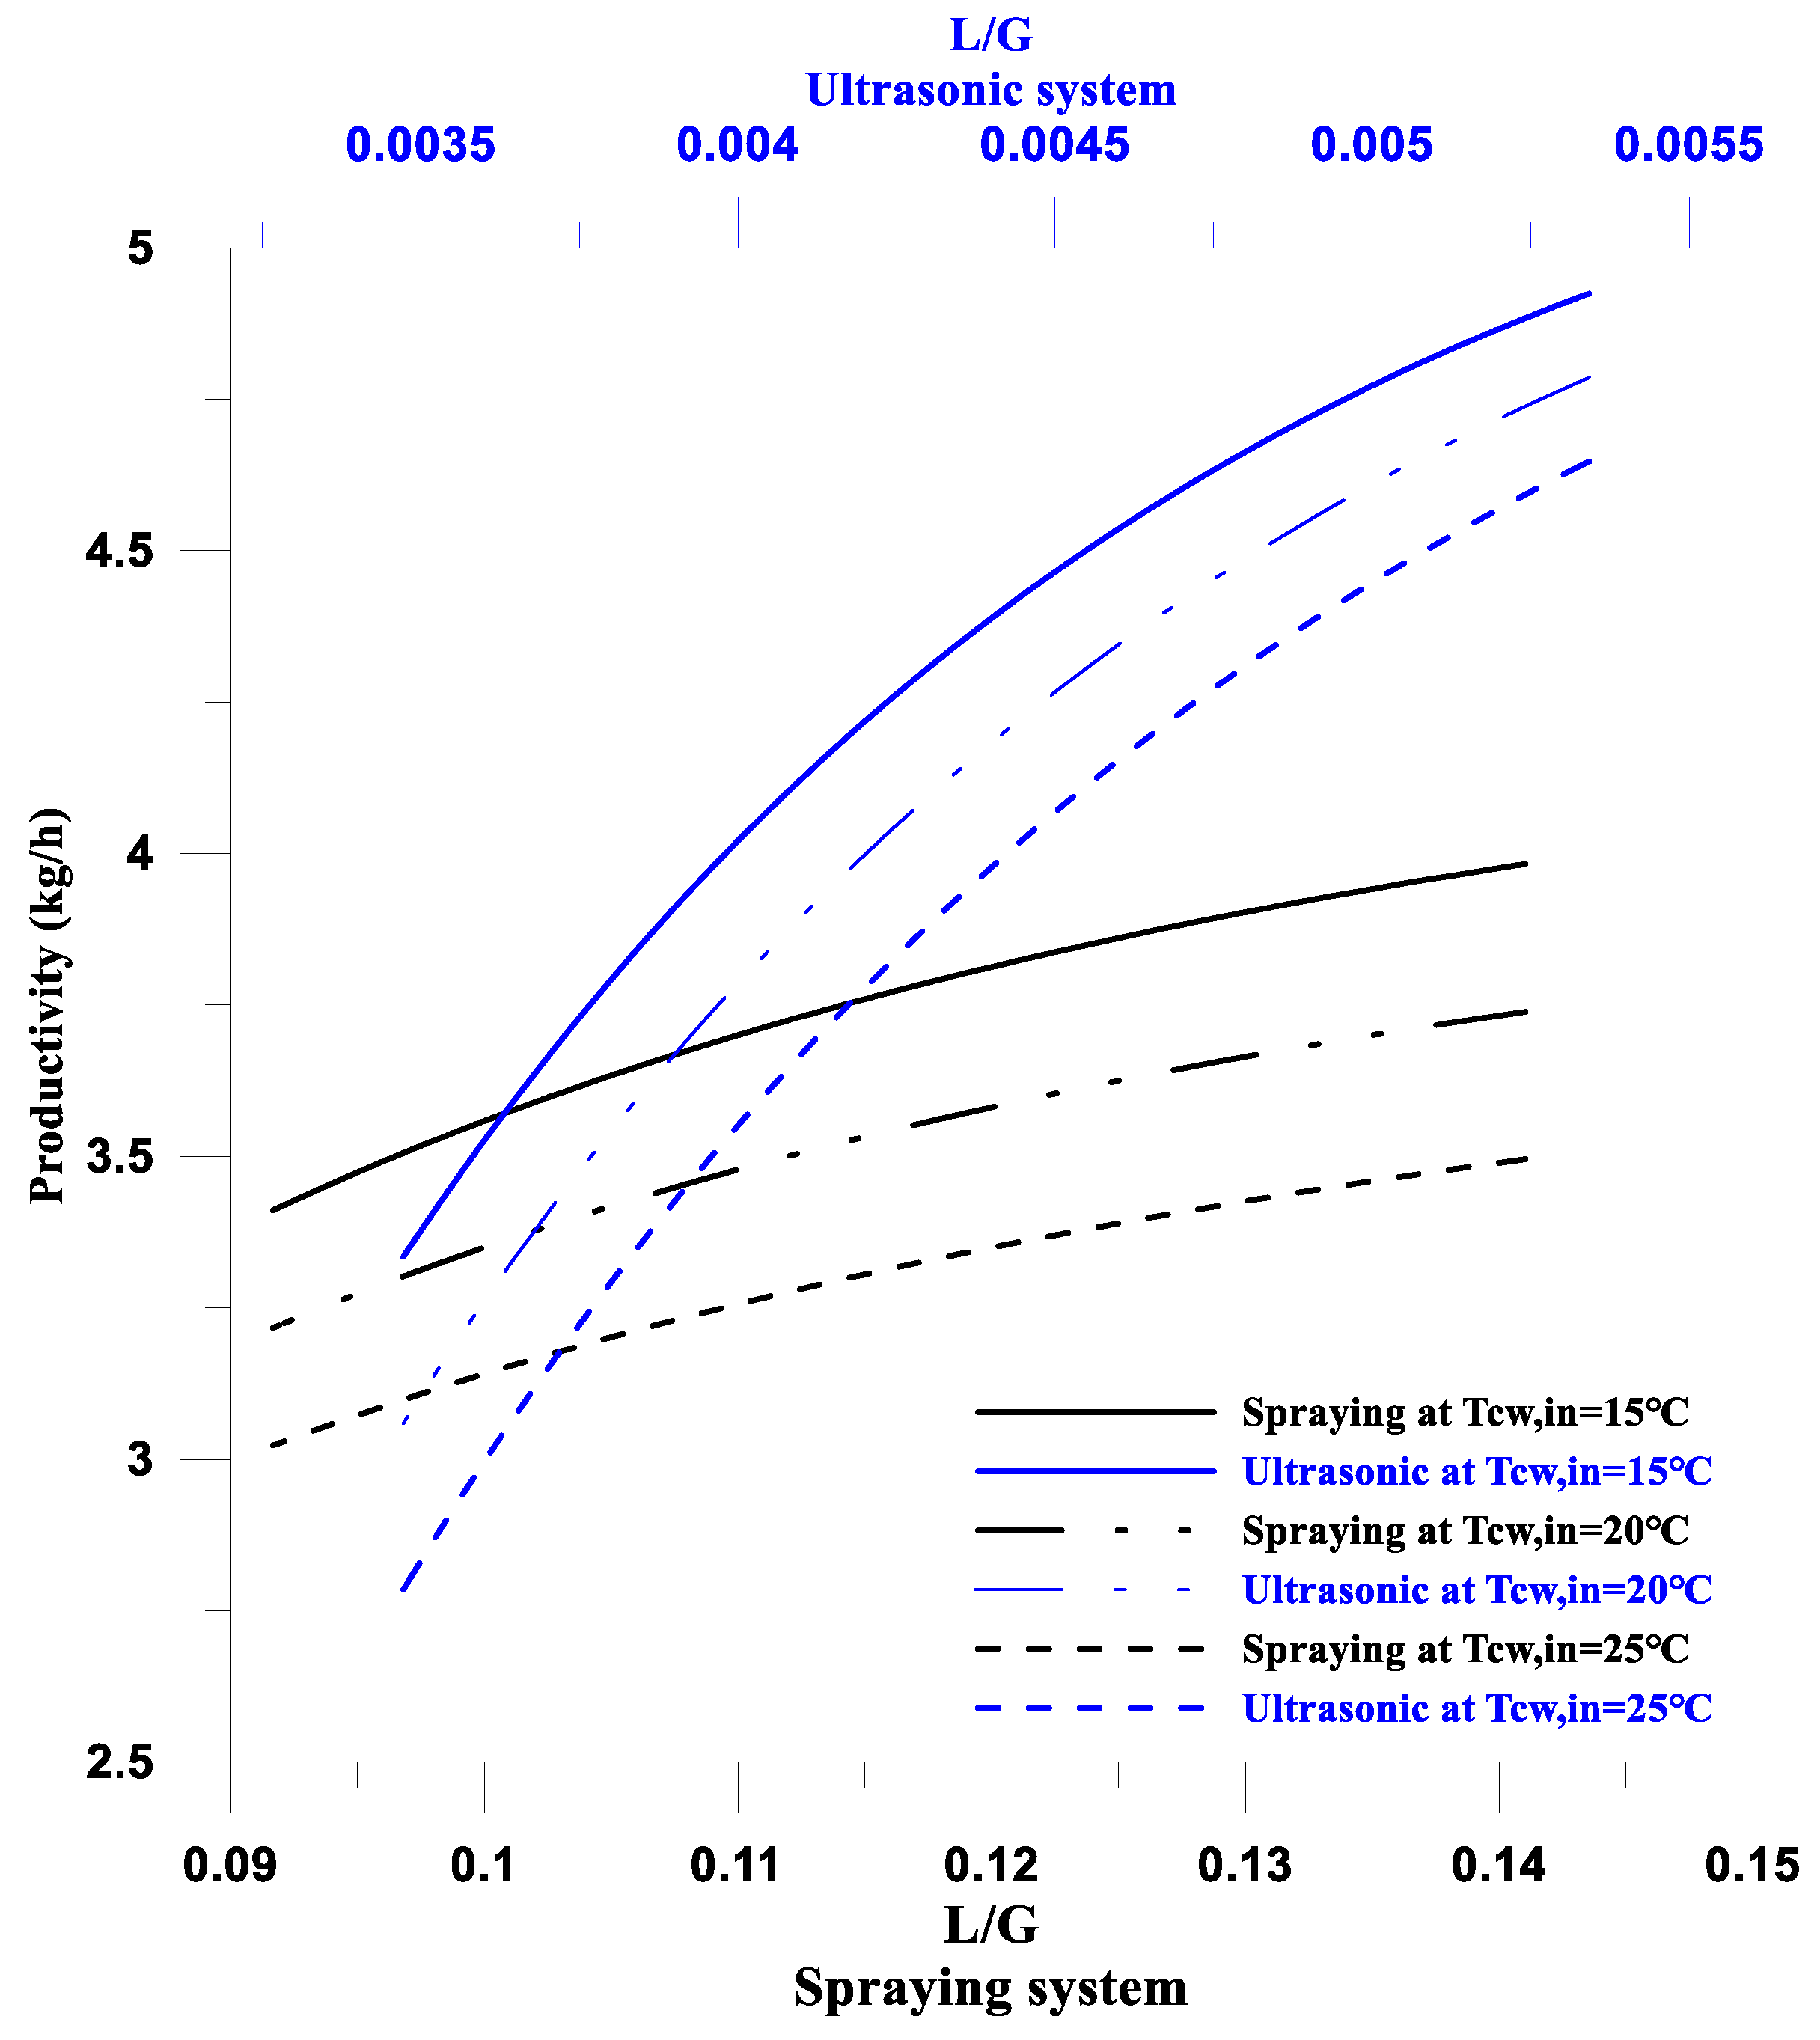
Figure 9 shows a comparison between the productivity achieved by the spraying and ultrasonic humidification systems at the same ambient air inlet conditions (dry bulb temperature of 25 °C and relative humidity of 50%) at different inlet cooling water temperatures Clearly, the productivity decreases as the temperature of the inlet cooling water increases, where the cooling load used in the dehumidification process decreases. The ultrasonic water atomizer has almost the same trend observed in its humidification effectiveness. Due to the low mass flow rate of atomized water produced compared to the amount of air flowing, the condensate tends to be near the amount of atomized water flow rate (
). It was observed that, for the new humidification system, the higher the capacity, the higher both productivity, and humidification effectiveness. However, to test this system, the quality of the freshwater must be checked. It has been shown that the ultrasonic water atomizer evaporates some salts with water.
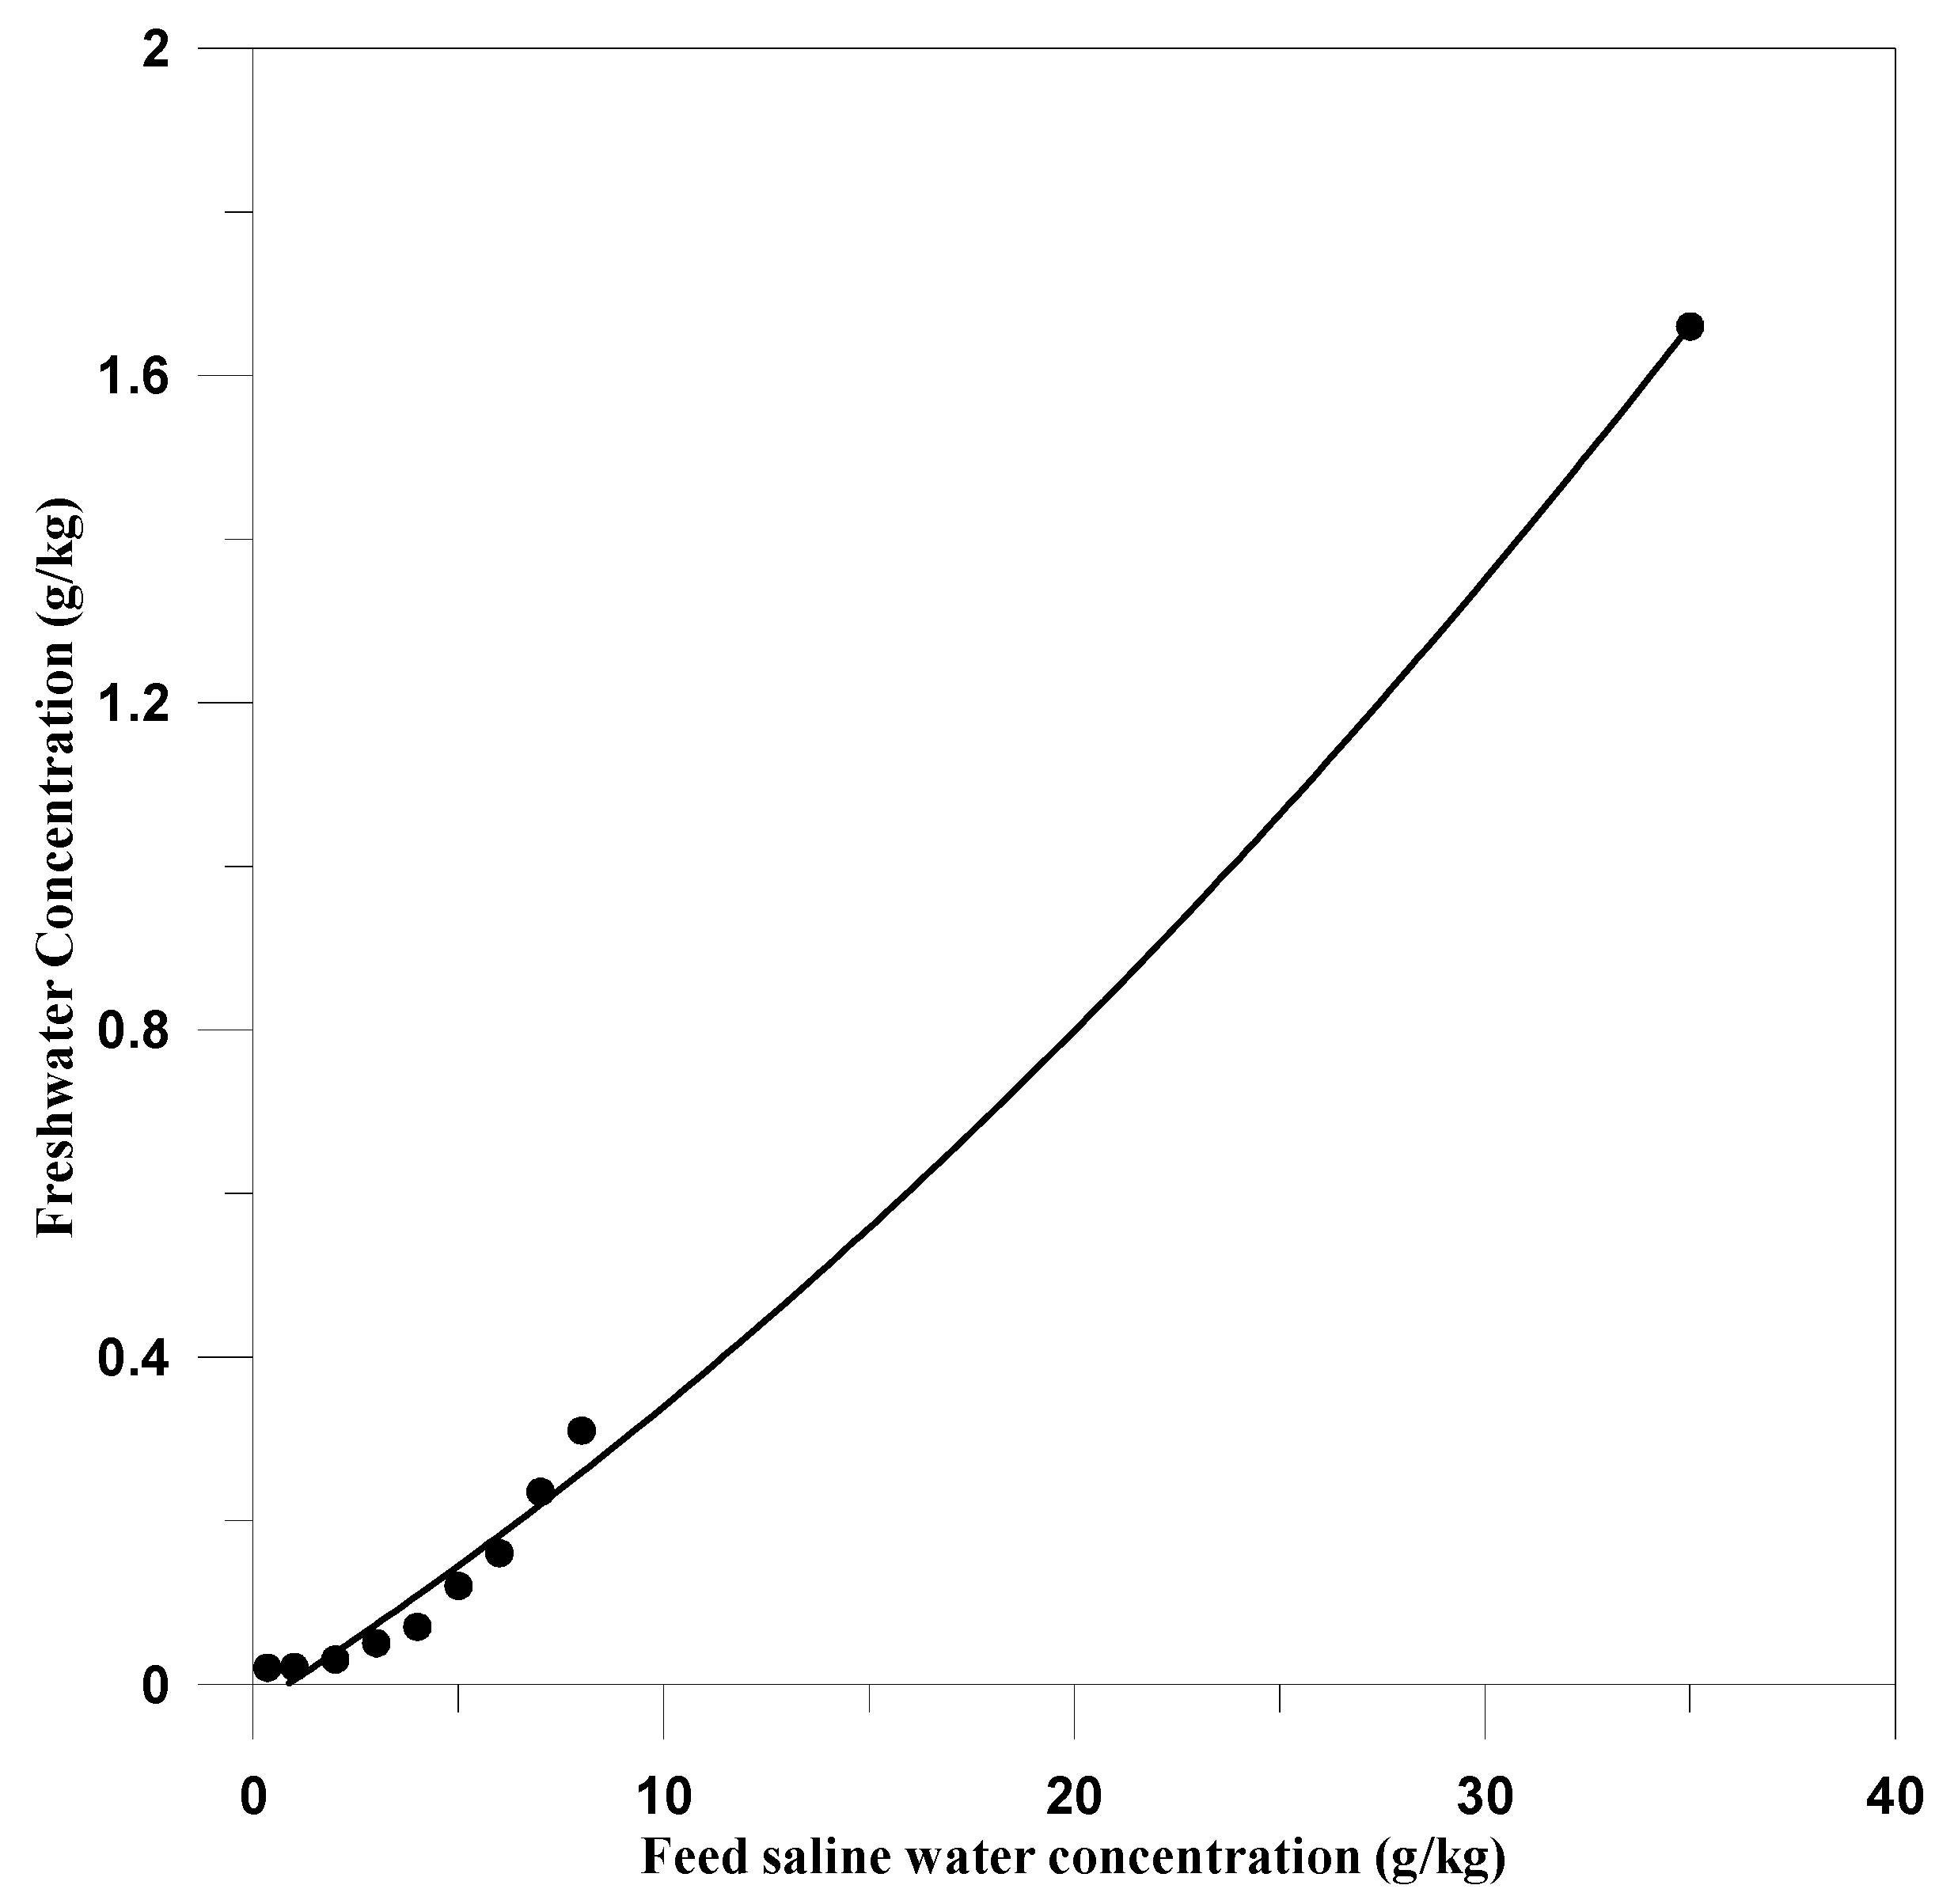
Figure 10 shows the amount of salt concentration in the freshwater. As the concentration of the brine in the feed water increases, the amount of salts in the freshwater increases gradually. The maximum concentration of salts in the feed water (TDS = 35, Mediterranean Sea) allowed the production freshwater for human drinking water (as reported by [
2], which is a maximum of 0.5 g/kg for drinking water) not exceeding 8 g/kg, which produced output freshwater with a salt concentration of 0.35 g/kg.
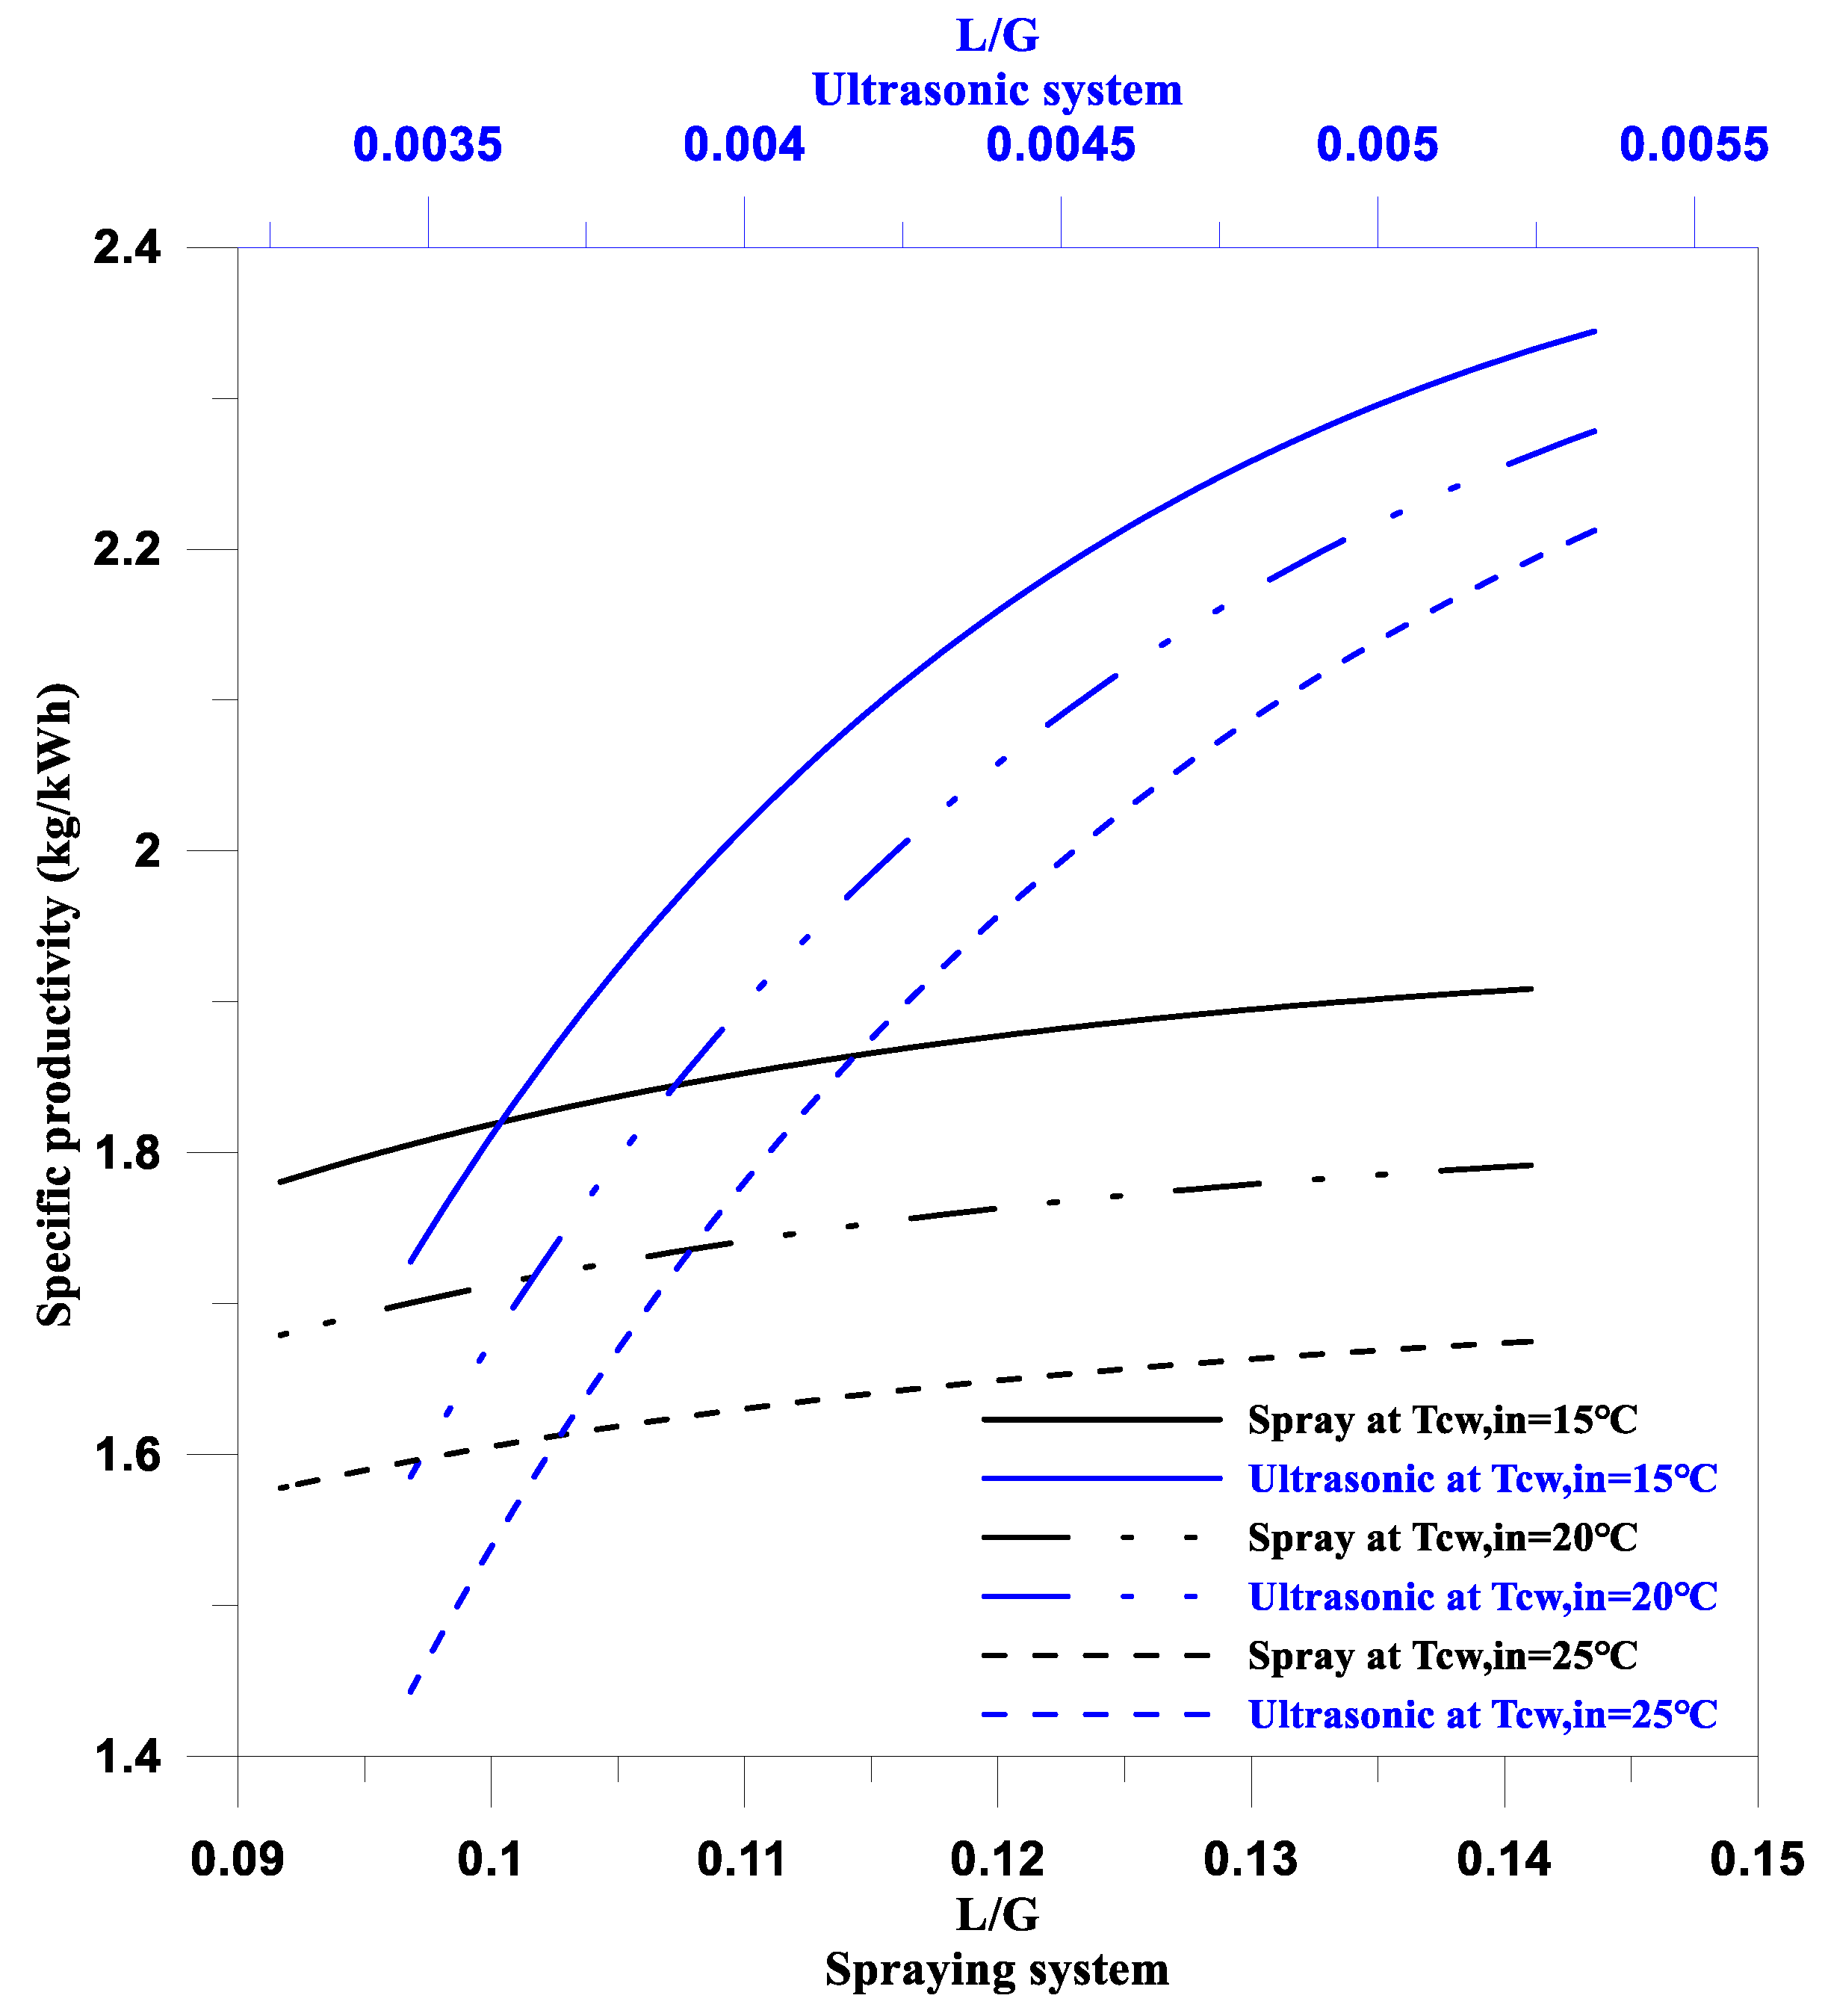
By evaluating the performance of the desalination system, the specific productivity can be considered to be an essential parameter that defines the amount of freshwater, which can be produced by consuming one unit of energy. The results calculated in this work are presented in
Figure 11. The specific productivity for both humidification systems has the same trend, as seen in
Figure 6 and
Figure 7. The power consumption of the ultrasonic atomizer is close to that of the saline water feed pump used in the spraying atomizer. However, the specific productivity is higher in the case of using an ultrasonic water atomizer, as it has higher productivity than the spraying system. The traditional system only appears to be more efficient for L/G ratios lower than 0.1.
Trying to improve the humidification process more and more, a hybrid humidification process is established using both spraying and ultrasonic saline water atomization, where the drain of the spraying system is used to feed the ultrasonic water atomizer.
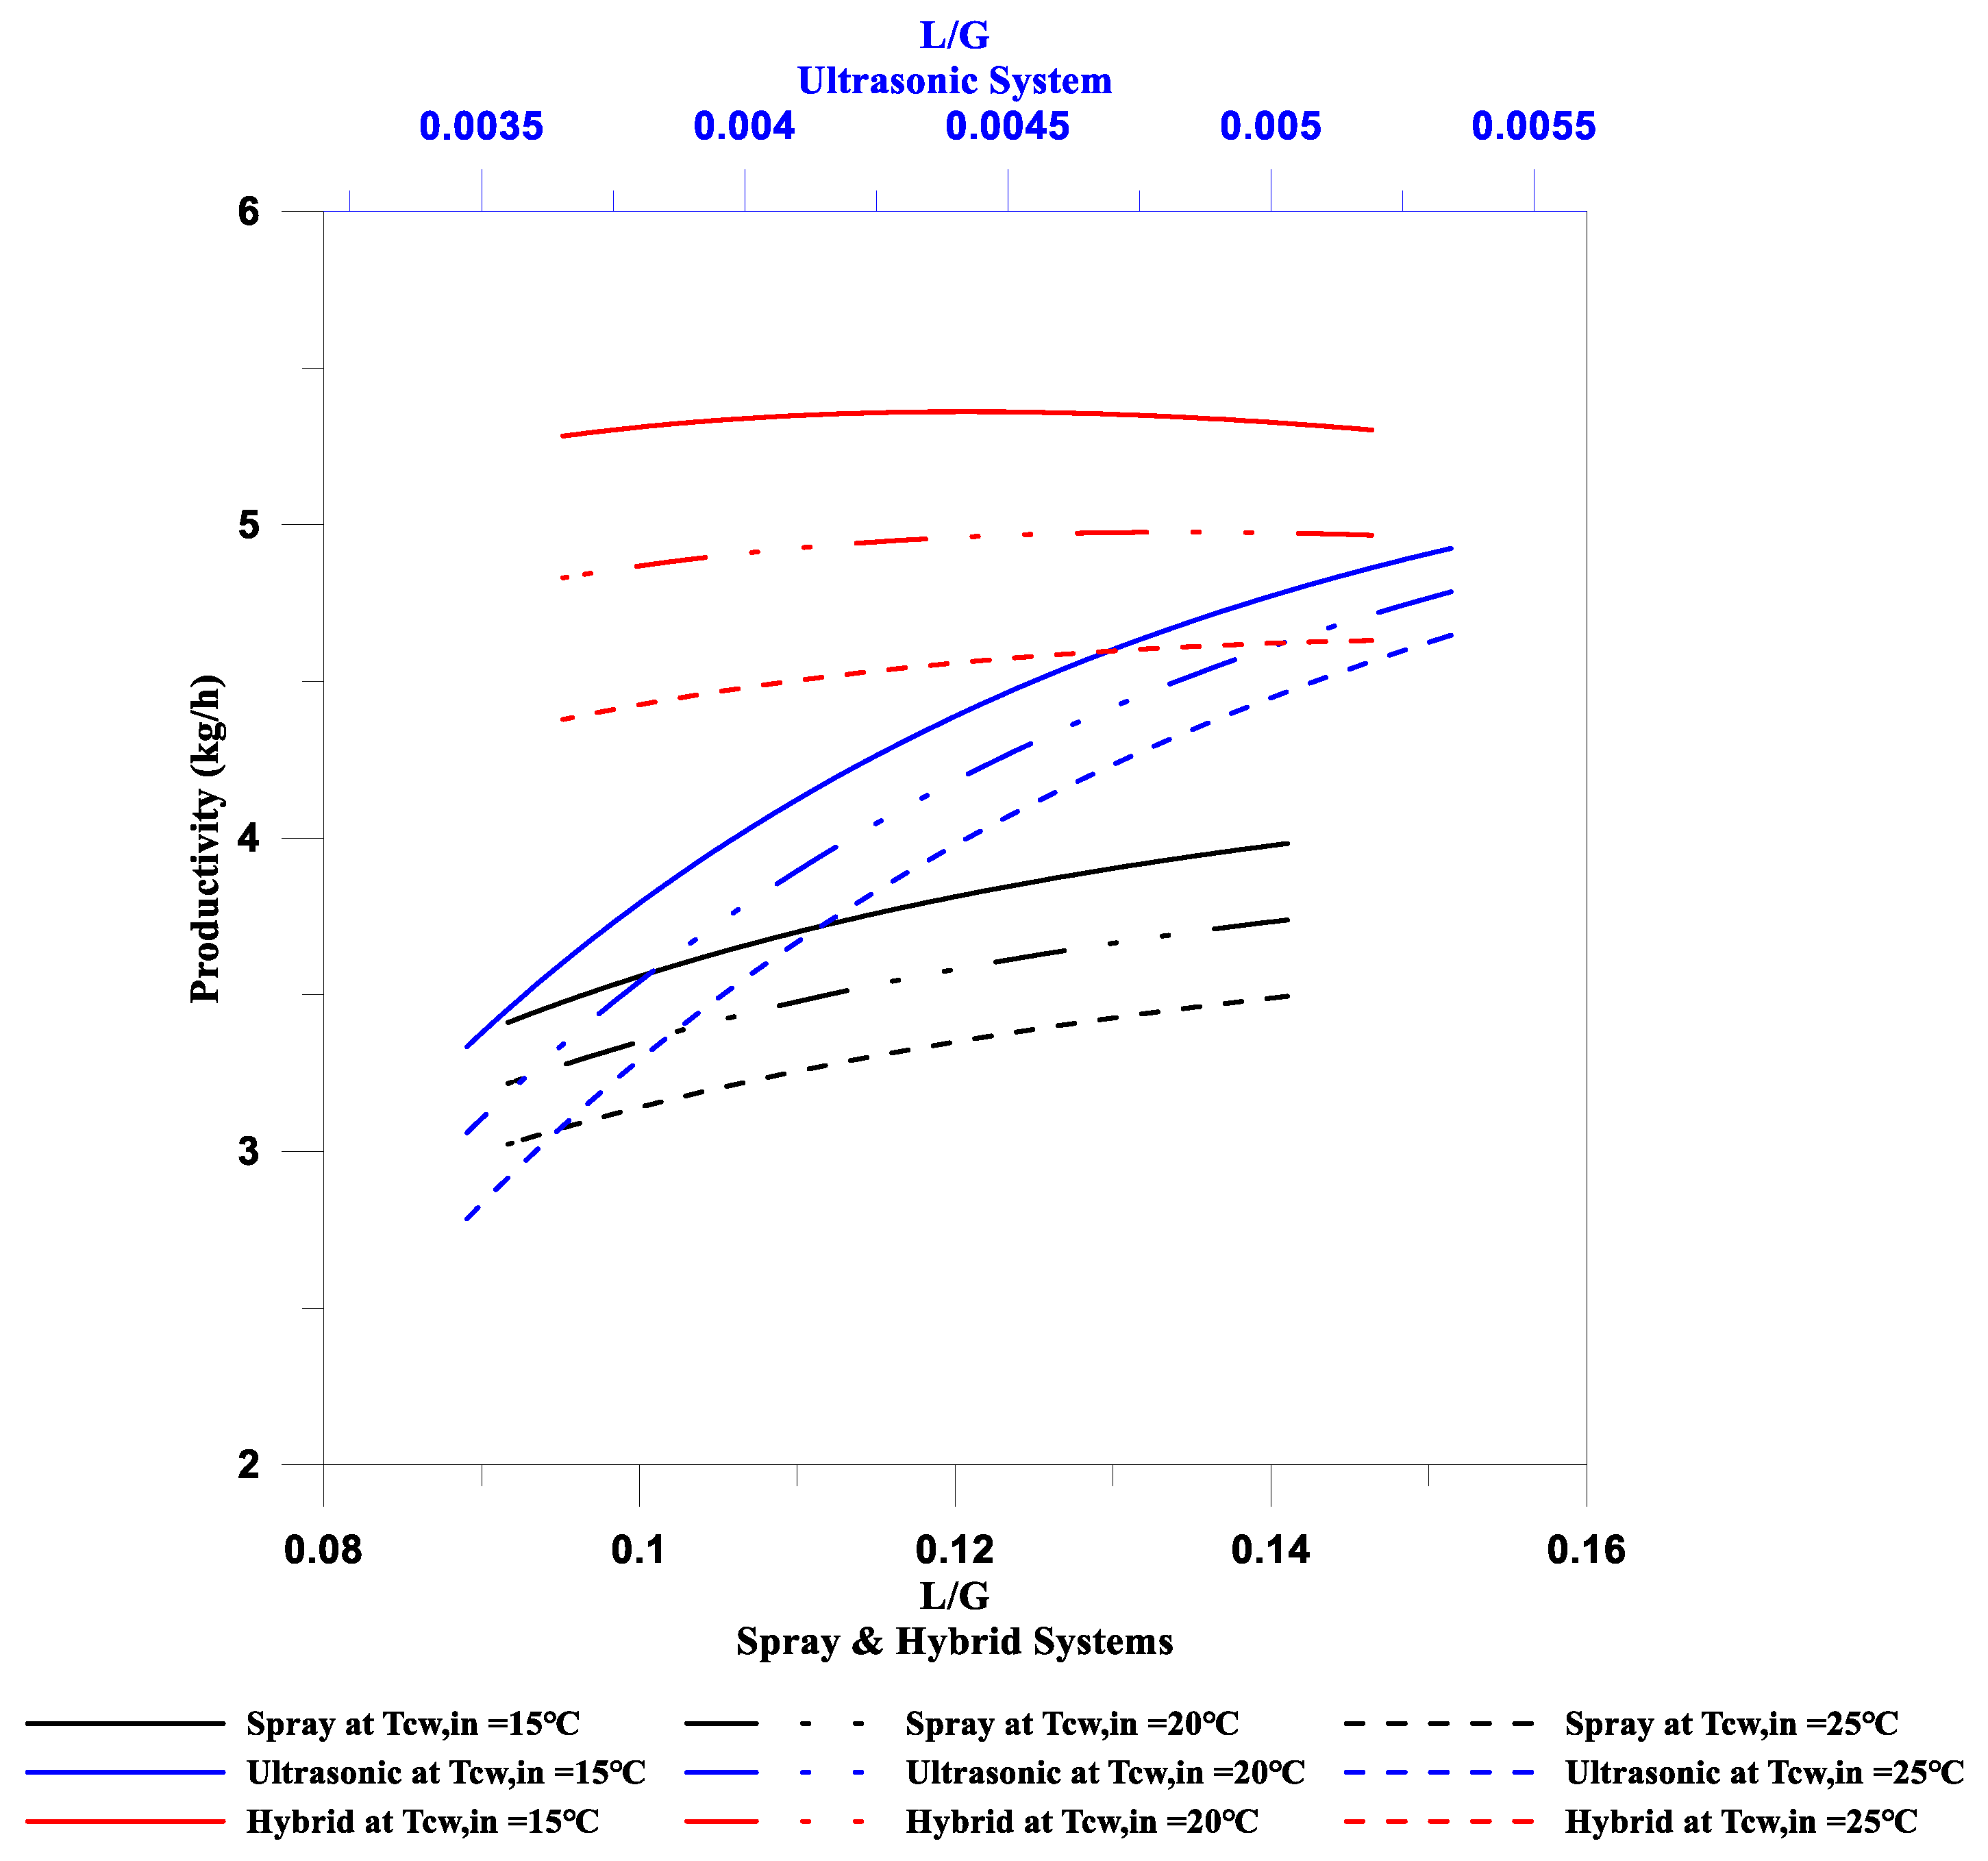
Figure 12 shows the condensate rate for the hybrid system under the same operating conditions used in the spraying and ultrasonic humidification systems (where the ambient air-dry bulb temperature is 25 °C and with 50% relative humidity). The figure shows that the difference in productivity between the different temperature operation conditions decreases with the L/G ratio (atomized saline water to air mass flow rates). This behavior does not occur in the previous humidification scenarios.
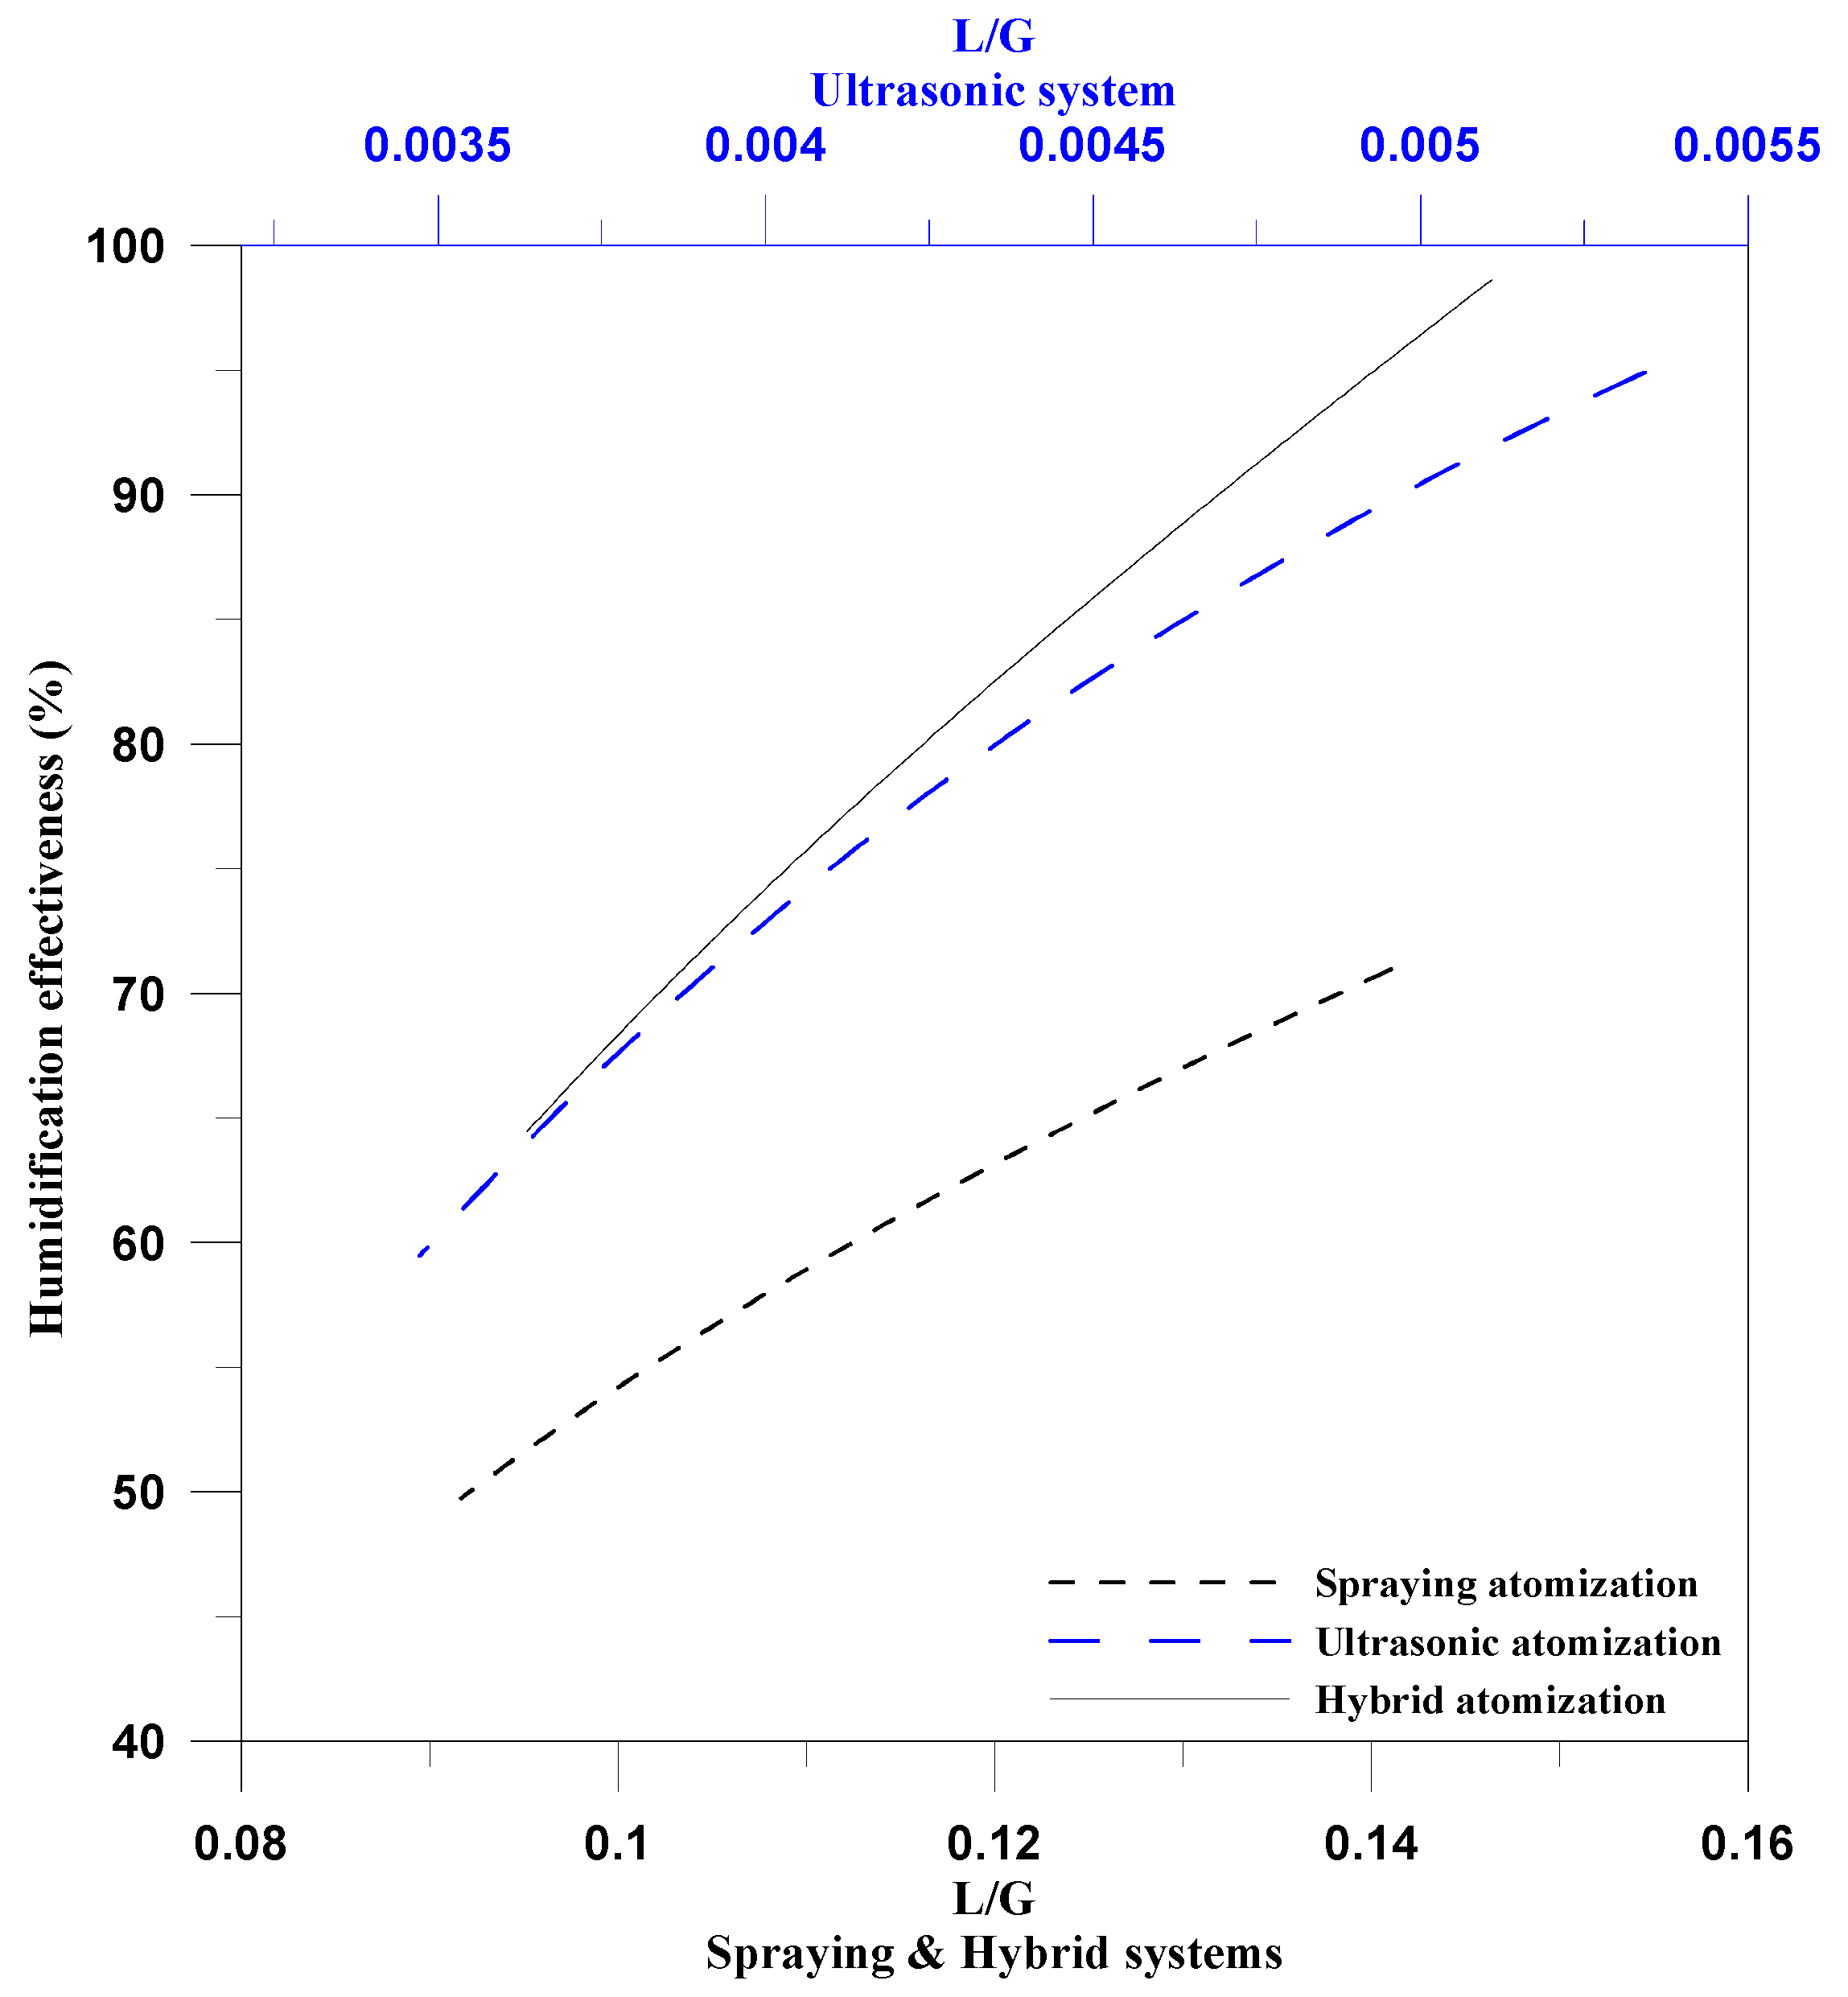
Figure 13 shows the effectiveness of the humidification process for each scenario at the same inlet air conditions (25 °C dry-bulb temperature and 50% relative humidity). The hybrid system presents higher effectiveness due to its higher requirement of atomized water.
Figure 14 compares the productivity of each humidification system showing the condensate rate at different inlet cooling water temperatures to the WCHE. Obviously, productivity decreases as the inlet cooling water temperature decreases. The hybrid system has higher productivity than the other systems because its requirements of atomized saline water are also higher. However, in the hybrid system, the change in the condensate rate with the saline water to the airflow rate ratio is so small. In this operation (hybrid system), the air is close to being saturated, while the cooling capacity of both WCHE and heat pump evaporator could not extract more freshwater from this saturated air. This scenario can be demonstrated from the relation between productivity and the humidification effectiveness of the hybrid system. As humidification effectiveness increases, productivity also does. However, at L/G of 0.12, the productivity begins to decrease as the amount of saline water increases due to its low cooling capacity.
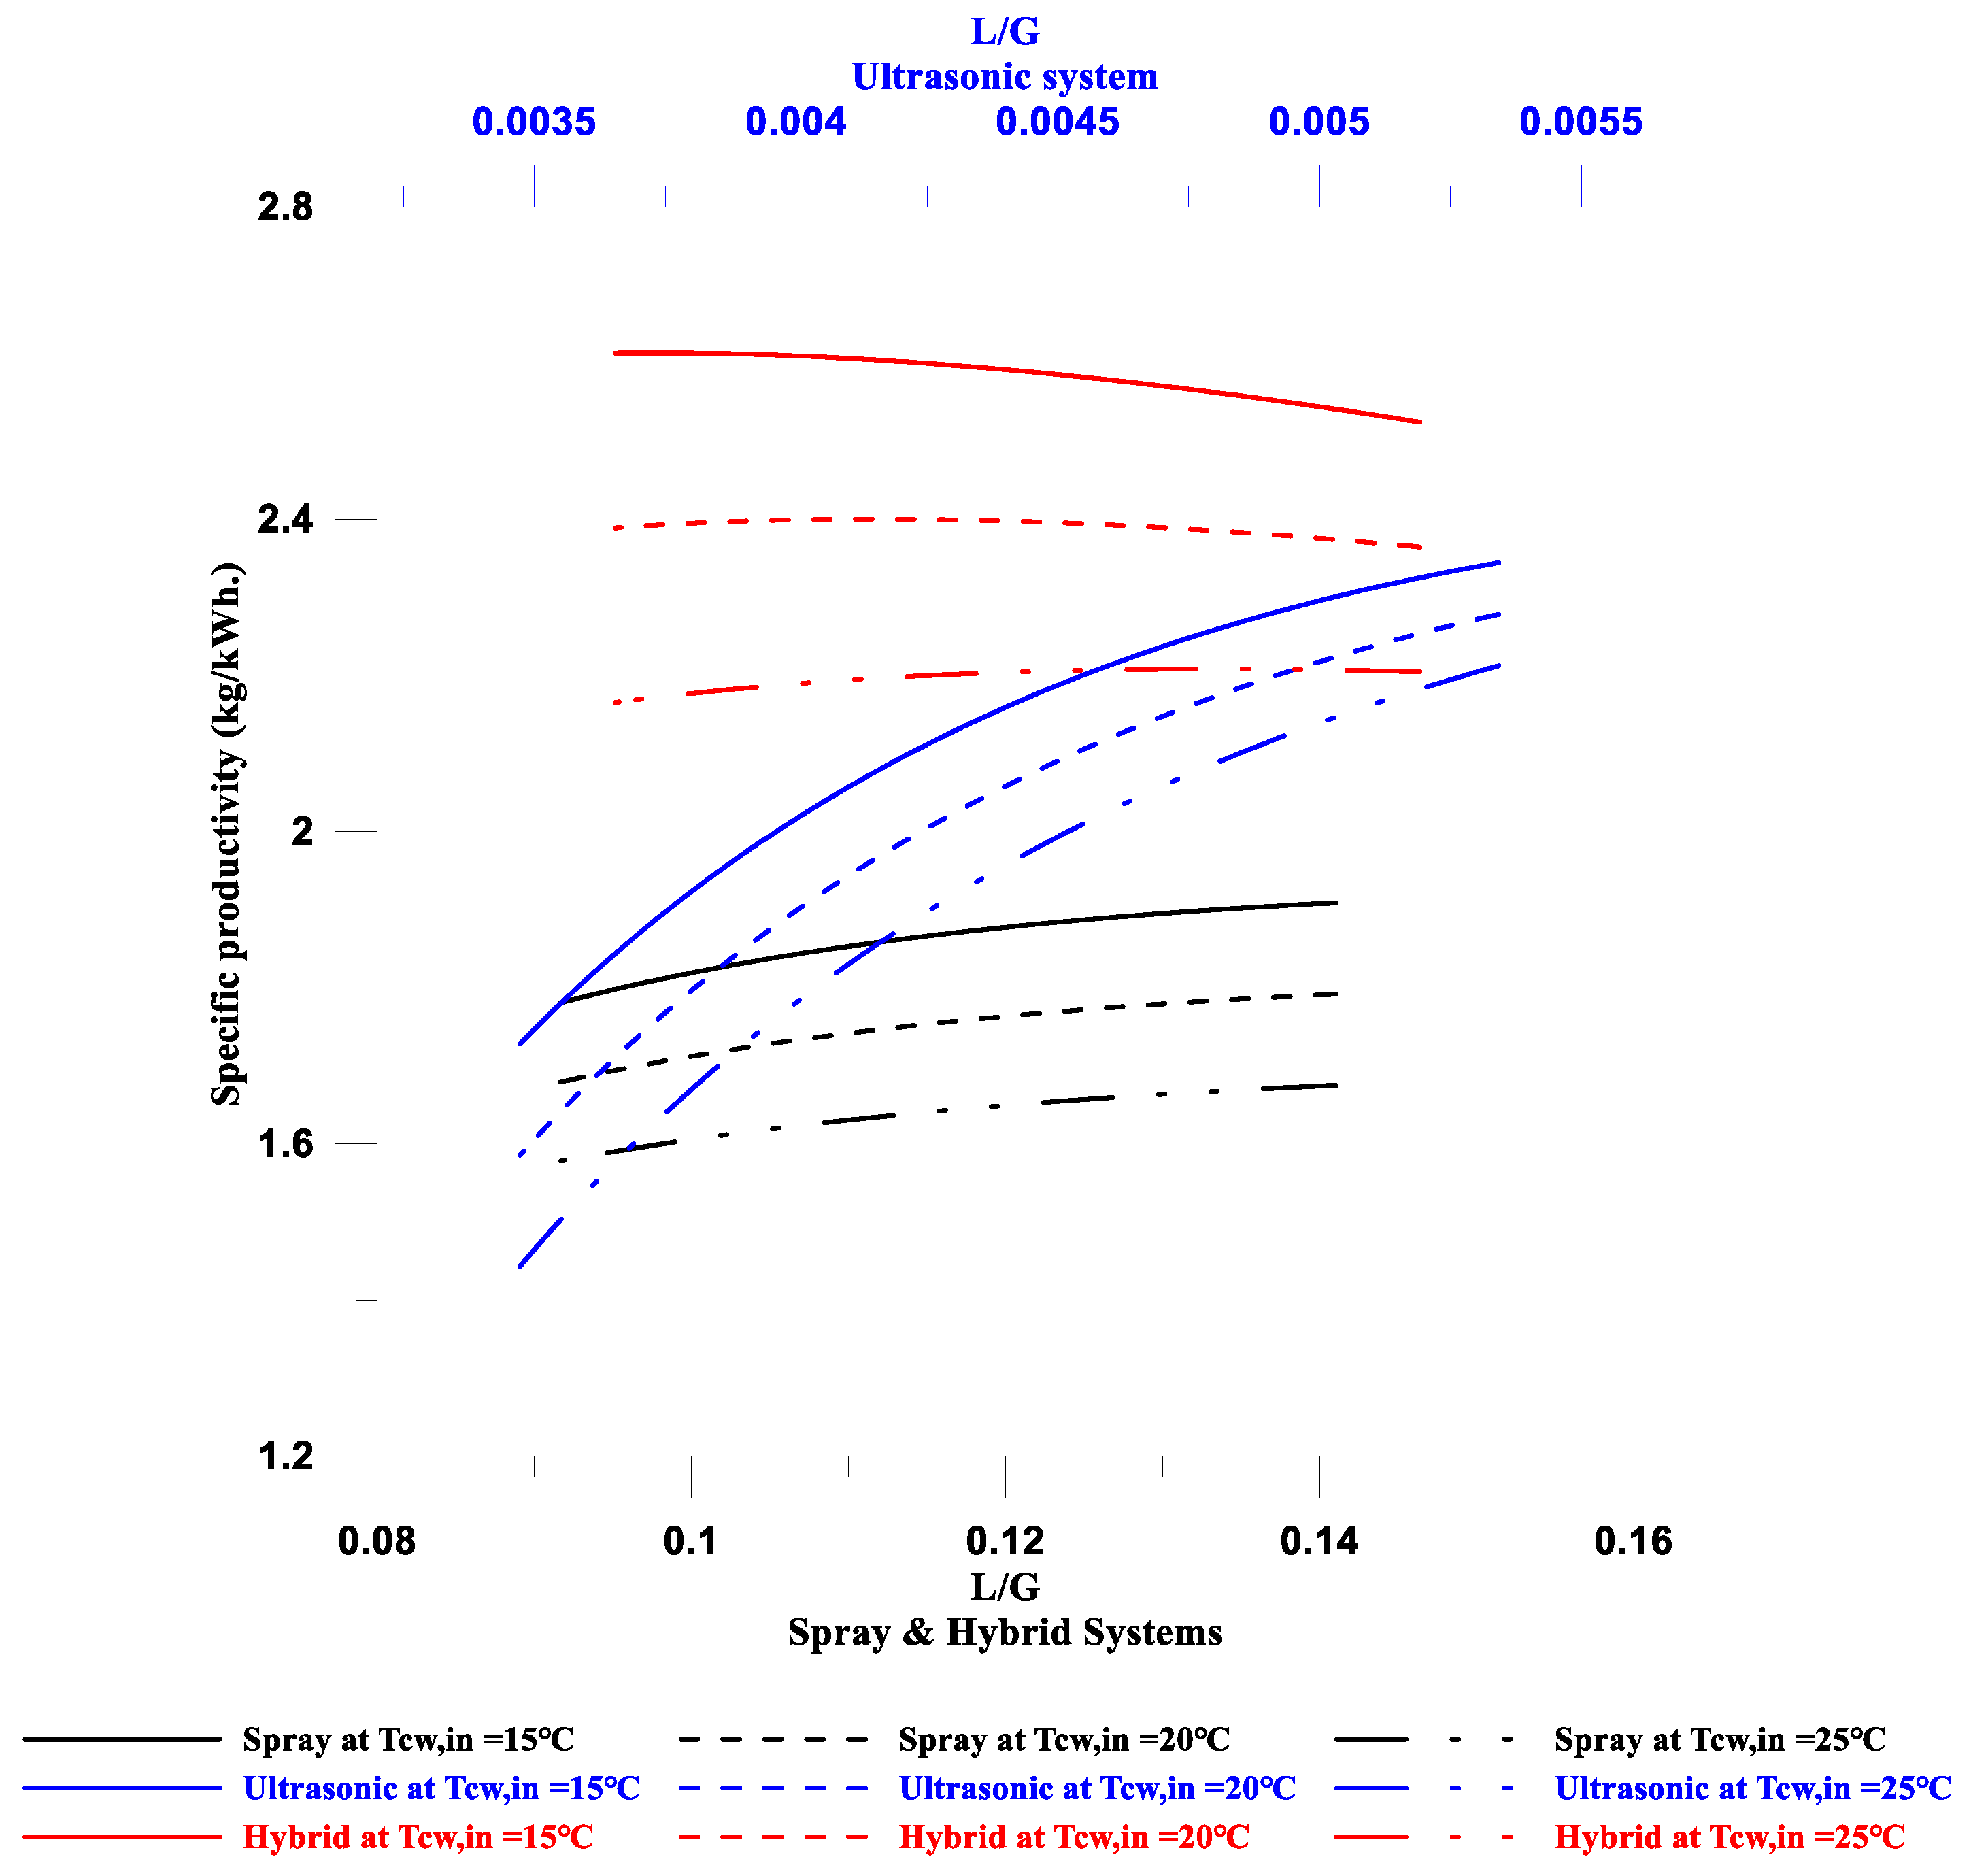
Using the spraying and ultrasonic water atomizers, the specific productivity increases as the amount of atomized water increases. However, in the case of the hybrid system, the specific productivity has a different trend:
Figure 15 shows that when the amount of atomized water increases, the specific productivity slightly decreases. According to
Figure 12, the condensate rate for the hybrid system has a small variation over the ratios of saline water and airflows. In addition to that, the power consumption decreases as the mass flow rate of air also does due to productivity reduction. As mentioned in the previous section: at low temperatures (15 and 20 °C), the lower the L/G ratio, the lower the heating load on the compressor and, the higher the L/G ratio, the lower the specific productivity. On the other hand, as the ratio decreases, where the heating load on the compressor drops, the specific productivity is reduced. In the other two systems, the specific productivity increases as the condensate rate also does. There is a huge difference in the condensate rate especially between the traditional atomization and hybrid systems. The trend of the specific productivity is the same for the three cases of humidification process at different inlet cooling water temperatures to the WCHE, and, obviously, the higher the temperature, the lower the specific productivity.
6. Cost Analysis
In this section, a cost analysis is performed on the proposed desalination systems in order to evaluate the desalination systems (spraying, ultrasonic, and hybrid atomization in the humidification process) from an economic point of view.
The costs of the various components used in the proposed humidification–dehumidification (HDH) desalination unit, based on the Egyptian market prices in 2019, are given in
Table 2. The capital cost estimated for the HDH desalination system amounts to
$535. To obtain the cost of the freshwater produced by these systems, other parameters must be taken into consideration: assuming installation costs to be 10% of the capital cost; expected lifetime (
N), 10 years; inflation rate (
dd), 8.65%; interest rates (i), 11.9% (based on 2020 Egyptian economic statistics). In addition to this, a yearly maintenance cost (
M/yr) of 5% of the capital cost has been considered for the following components: the centrifugal fan, the control panel, the water sprayers, the ultrasonic atomizer, and the feed pumps. Therefore, the PW of the maintenance cost (
) can be calculated using Equation (42) to be
$99.4,
$145.9, and
$146.35 for the spraying, ultrasonic, and hybrid water atomizers, respectively, using the maintenance cost per year (
M/yr) and the lifetime of the system (
N = 10 years).
The running cost () was calculated taking into account that this unit is powered by electricity, and assuming an average cost of $0.048 per kWh of electric energy, where the electric energy consumption for the desalination unit at different operating conditions was considered. The main variation in electric power consumption comes from changes in the air mass flow rate, which consequently affect fan power. In addition to this, the variation in air mass flow rate that passes through the heat pump condenser affects the heat pump compressor power consumption (based on the experiments carried out).
Calculating the life cycle cost analysis of the desalination system using Equation (43):
Finally, the total annual cost (TAC), which is a function of the capital, running, and maintenance costs, was calculated for each system using Equation (44). The values of TAC differ, as mentioned before, due to the difference in electric power consumption in each operating condition (due to the change in air mass flow rate and the cooling capacity of the heat pump), as presented in
Table 3. To get the cost of the freshwater produced using Equation (45), the TAC is divided by the freshwater produced per year. Therefore, the cost analysis showed that the cost per kilogram of freshwater varies from
$0.0311 to
$0.0328 for the spraying,
$0.0251 to
$0.0306 in the case of using the ultrasonic, and
$0.0250 to
$0.0233 for the hybrid system.
According to the cost analysis presented for the three humidification systems used, the hybrid system has the least cost per kilogram of freshwater. In comparing the freshwater cost to other desalination systems such as seawater reverse osmosis (SWRO), the cost is high [
6]. However, although the cost of this technology is still well above other more cost-effective technologies, such as seawater reverse osmosis, it can be considered a viable alternative in remote and arid areas, where there is not an adequate electric power supply to operate reverse osmosis. Other benefits for its affordable installation in dry and isolating regions include: (a) simple operation, (b) low maintenance requirements (c) low-temperature thermal energy demand, which can be easily obtained from a renewable source.

 ,
, 


