Article

Effects of Cyanobacteria on Phosphorus Cycling and Other Aquatic Organisms in Simulated Eutrophic Ecosystems

Department of Environmental Science and Engineering, Fudan University, Shanghai 200433, China
*
Author to whom correspondence should be addressed.
Water 2020, 12(8), 2265; https://doi.org/10.3390/w12082265
Submission received: 6 June 2020 / Revised: 30 July 2020 / Accepted: 10 August 2020 / Published: 12 August 2020
(This article belongs to the Section Water Quality and Contamination)

Abstract

:
Cyanobacterial blooms caused by eutrophication in Lake Taihu have led to ecological threats to freshwater ecosystems. A pilot scale experiment was implemented to investigate the relationship between cyanobacteria and other aquatic plants and animals in simulated eutrophic ecosystems under different phosphorus (P) regimes. The results of this study showed that cyanobacteria had two characteristics favorable for bloom formation in eutrophic ecosystems. One is the nutrient absorption. The presence of alkaline phosphatase was beneficial for algal cells in nutrition absorption under low P concentration. Cyanobacteria exhibited a stronger ability to absorb and store P compared to Vallisneria natans, which contributed to the fast growth of algal cells between 0.2 and 0.5 mg·L−1 of P (p < 0.05). However, P loads affected only the maximum biomass, but not the growth phases. The growth cycle of cyanobacteria remained unchanged and was not related to P concentration. P cycling indicated that 43.05–69.90% of the total P existed in the form of sediment, and P content of cyanobacteria showed the highest increase among the organisms. The other is the release of microcystin. Toxic microcystin-LR was released into the water, causing indirectly the growth inhibition of Carassius auratus and Bellamya quadrata and the reduction of microbial diversity. These findings are of importance in exploring the mechanism of cyanobacterial bloom formation and the nutrient management of eutrophic lakes.

1. Introduction

Lake Taihu is the third largest freshwater lake in China and is located in one of the most developed and densely populated regions in the country. Lake Taihu is rich in fisheries resources, with common species including Coilia mystus, Cyprinus carpio, and Carassius auratus [1]. Several submerged macrophytes also exist in Lake Taihu, dominated by Potamogeton wrightii Morong, Vallisneria natans, and Hydrilla verticillata [2]. Moreover, Bellamya quadrata and Corbicula fluminea are the reported widespread benthic fauna [3]. However, the area has experienced significant deterioration in recent decades as a result of urbanization and agricultural expansion, increased nutrient inputs from domestic wastes, industrial discharge, and fertilizer use. This eutrophication transformed Lake Taihu into a cyanobacteria-dominated system, with blooms now occurring regularly from April to November throughout the lake.
Microcystis is the dominant bloom-forming cyanobacteria genus in Lake Taihu, along with Aphanizomenon, Raphidiopsis, Dolichospermum, Nodularia, and Planktothrix in freshwater lakes. Phosphorus (P) is an essential element for the growth of cyanobacteria, with many studies investigating the effects of varying P concentrations. Total phosphorus concentration threshold of Microcystis-dominated blooms was determined to be below 0.05 mg·L−1 [4]. The increased availability of P due to external input also stimulated algal growth in the lake [5], but growth was suppressed again when P loading reached higher than 0.5 mg·L−1 [6]. In aquatic ecosystems, submerged macrophytes are also important P consumers, through their leaves and roots [7]. Thus, submerged macrophytes could compete with other phytoplankton such as cyanobacteria for P, but the dynamics of P competition and its implications remain unclear.
The major risk to public health associated with cyanobacterial bloom is the release of microcystins (MCs) [8]. In lake ecosystems, MCs are secondary metabolites of some cyanobacteria, characterized by cyclic heptapeptides with several amino acids, which are potent inhibitors of protein phosphatases with a wide range of toxic effects in plants, invertebrates, vertebrates, and even humans [9]. Hepatocytes were affected by toxic MCs via a carrier-mediated transport system, followed by the inhibition of serine/threonine protein phosphatases 1 and 2A [10]. It was also reported that MCs could accumulate in fish muscle tissues, reaching concentrations close to the recommended limit for human consumption (0.04 μg·kg−1·day−1) [11]. MCs showed toxic effects to submerged macrophytes as well. For example, at 0.0001–10 mg·L−1, the growth of Vallisneria natans was suppressed based on leaf and root length and changes in fresh weight [12].
Numerous studies have focused on the effects of nutrients on bloom formation and the toxic effects of harmful cyanobacterial blooms. However, studies about the relationship between cyanobacteria and other organisms are rarely reported. In this study, a pilot scale experiment was implemented to investigate the relationship between cyanobacteria and other aquatic organisms in simulated eutrophic ecosystems under different P regimes. Concrete pools were built near Lake Taihu, and local organisms were used to simulate the actual aquatic ecosystem. The experiment was carried out for 50 days during the summer of 2019 and was divided into two phases—25 days with single soluble reactive phosphorus (SRP) addition and 25 days with continuous SRP addition. Environmental conditions, water quality, and algal growth were monitored every three days. We also investigated the fresh weight of the organisms added into the pools, as well as changes in alkaline phosphatase activity and microcystin-LR (MC-LR) content. Furthermore, the P concentrations in different phases were studied to understand the P cycling in the system. Results of this study will contribute to mechanism exploration of cyanobacterial bloom formation and nutrient management of eutrophic lakes.

2. Materials and Methods

2.1. Experimental Design

Zhushan Bay was chosen as the study site (Figure 1a), having the highest frequency of cyanobacterial blooms in Lake Taihu. Concrete pools were built near Zhushan Bay, with each pool measuring an inner diameter of 1 m. These pools were filled with tap water for six months to allow the chemicals to be released from the walls. Microcystis aeruginosa (FACHB-912) isolated from the cyanobacterial bloom in 2007 in Lake Taihu were used in this study, which was purchased from the Institute of Hydrobiology, Chinese Academy of Sciences (Wuhan, China). To create a diverse ecosystem, Microcystis aeruginosa, Carassius auratus, Bellamya quadrata, and Vallisneria natans were used for the incubations (Figure 1b). All species used in this study were directly obtained from Lake Taihu and cultured in the laboratory for propagation. The bottom of the experimental pools was covered with 1 cm thick quartz sand and filled with a total volume of 800 L made up of 200 L water from Lake Taihu and 600 L distilled water to maintain water transparency. The biomass added was 32.7 ± 0.1 g of C. auratus (10 individuals), 160 ± 1 g of B. quadrata (50 individuals), and 270 ± 2 g of V. natans (30 g/pot, 9 pot/pool), with an initial algal cell density of 2.0 × 10⁵ cells·mL−1. A wave pump was also installed with a flow of 6000 L·h−1 to simulate water flow.
The experiment lasted for 50 days in the summer of 2019 and contained two phases. For the first 25 days (phase 1), Na2HPO4 was added to adjust the initial soluble reactive phosphorus (SRP) concentrations to 0 (no addition), 0.05, 0.1, 0.2, 0.5, 1.0 mg·L−1 for treatments 1 to 6, respectively. Meanwhile, an initial total dissolved nitrogen concentration (TDN) of 2.0 mg·L−1 in all six treatments was set up. During the last 25 days (phase 2), SRP sustained at 0.05, 0.1, 0.2, 0.5, and 1.0 mg·L−1 by adding Na2HPO4 every three days in treatments 2 to 6, respectively. Each treatment was carried out in triplicate.

2.2. Physical, Chemical, and Biological Analyses

2.2.1. Water Quality

Water samples were collected at depths of 0, 40, and 80 cm for each pool with preburied pipes and filtered through a 0.45 μm glass-fiber filter. Water temperature (T) and pH were detected using a multifunction water quality analyzer (AZ Instrument, China). Chemical analyses of water samples included total phosphorus (TP), total dissolved phosphorus (TDP), soluble reactive phosphorus (SRP), total dissolved nitrogen (TDN), and total organic carbon (TOC). SRP was analyzed using the molybdenum blue method [13], while TP and TDP were determined following the persulfate digestion approach [14] and measured with the same method as SRP. TDN and TOC were measured automatically under the analyzer (Shimadzu, Kyoto, Japan).

2.2.2. Phosphorus Contents

P content of the algal cells, the submerged macrophytes V. natans, and the sediments were analyzed. Samples of algal cells and V. natans were collected every 12 days, while sediment samples were obtained at the end of the experiment. The quantity of algal cells and V. natans used was 25 mL (water sample) and 0.03 g (dry weight), respectively. Sediments were collected in three positions across the bottom of the pool within an area of 25 cm2 (5 × 5 cm) and then transferred to a centrifuge tube, washed with distilled water with ultrasonic (SB-3200D, SCIENTZ, Shanghai, China) and fixed the volume to 500 mL. All samples were analyzed using the persulfate digestion following the molybdenum blue method used above. The P contents in C. auratus and B. quadrata were estimated based on their fresh weight [15].

2.2.3. Algal Cell Density

Algal samples were collected at the same depth as the water samples. A total of 1 mL of algal sample was transferred into a 2 mL centrifuge tube, added with 10 μL of Lugol’s reagent for fixation. Algal cell density was determined using an automatic algae counter (Countstar® BioMarine, ALIT Life Science, Shanghai, China). Each sample was counted five times and averaged after removing the maximum and minimum values.

2.2.4. Alkaline Phosphatase Activity

Alkaline phosphatase (ALP) activities were analyzed on algal cell surface, and algal samples were collected at the beginning and in the middle of phases 1 and 2. Samples were centrifuged at 2500× g for 15 min and the supernatant was carefully removed. Subsequently, the cells were suspended in 5 mL of 0.1 mol·L−1 PBS, ultrasonicated at 150 W for 60 s, and centrifuged again at 12,000× g for 15 min (VELOCITY 14R, Dynamica, Clayton, Victoria, Australia). The supernatant was then collected to measure ALP activity. ALP activity was analyzed via the disodium phenyl phosphate method [16] using an assay kit (Nanjing Jiancheng Bioengineering Institute, Nanjing, China), and their total protein was detected to calculate the ALP activity.

2.2.5. Microcystin Content

Presence of MC-LR and its concentrations were analyzed in filtered water samples. Samples of 10 mL were obtained at the beginning and at the end of the two phases and then filtered through a 0.45 μm glass-fiber filter [17]. The MC-LR content was analyzed with a double antibody sandwich enzyme-linked immunosorbent assay (ELISA) [18], using a commercial assay kit (Jianglai Co., Shanghai, China) following the manufacturer’s instructions.

2.2.6. Microbial Community Analysis

Analysis of the composition of the microbial community of sediments was carried out at the end of phases 1 and 2. Five-gram sediment samples were collected in a centrifuge tube and 20 mL of 0.1 mol L−1 PBS was added. The mixture was ultrasonicated for 20 min and centrifuged at 10,000× g for 15 min. Sediments were collected and stored at −80 °C for further DNA isolation and analysis. DNA extraction was performed using an E.Z.N.A. Soil DNA kit (Omega, D5625-01, NORCROSS, GA, USA), and high-throughput sequencing was carried out in an Illumina MiSeq platform in Personal Biotechnology Co., Ltd. (Shanghai, China). The V3-V4 hypervariable region of the 16S rRNA was amplified using a barcoded universal primer set, including 338F (ACTCCTACGGGAGGCAGCAG) and 806R (GGACTACHVGGGTWTCTAAT) [19]. Microbial species and diversity were analyzed subsequently using the sequenced amplicons [20].

2.3. Statistical Analysis

Data were analyzed by one-way ANOVA and differences were compared using Duncan’s test. Statistical analysis was performed using the IBM SPSS Statistics 23 software (IBM, Armonk, NY, USA). For all tests, values were considered significant at p < 0.05.

3. Results and Discussion

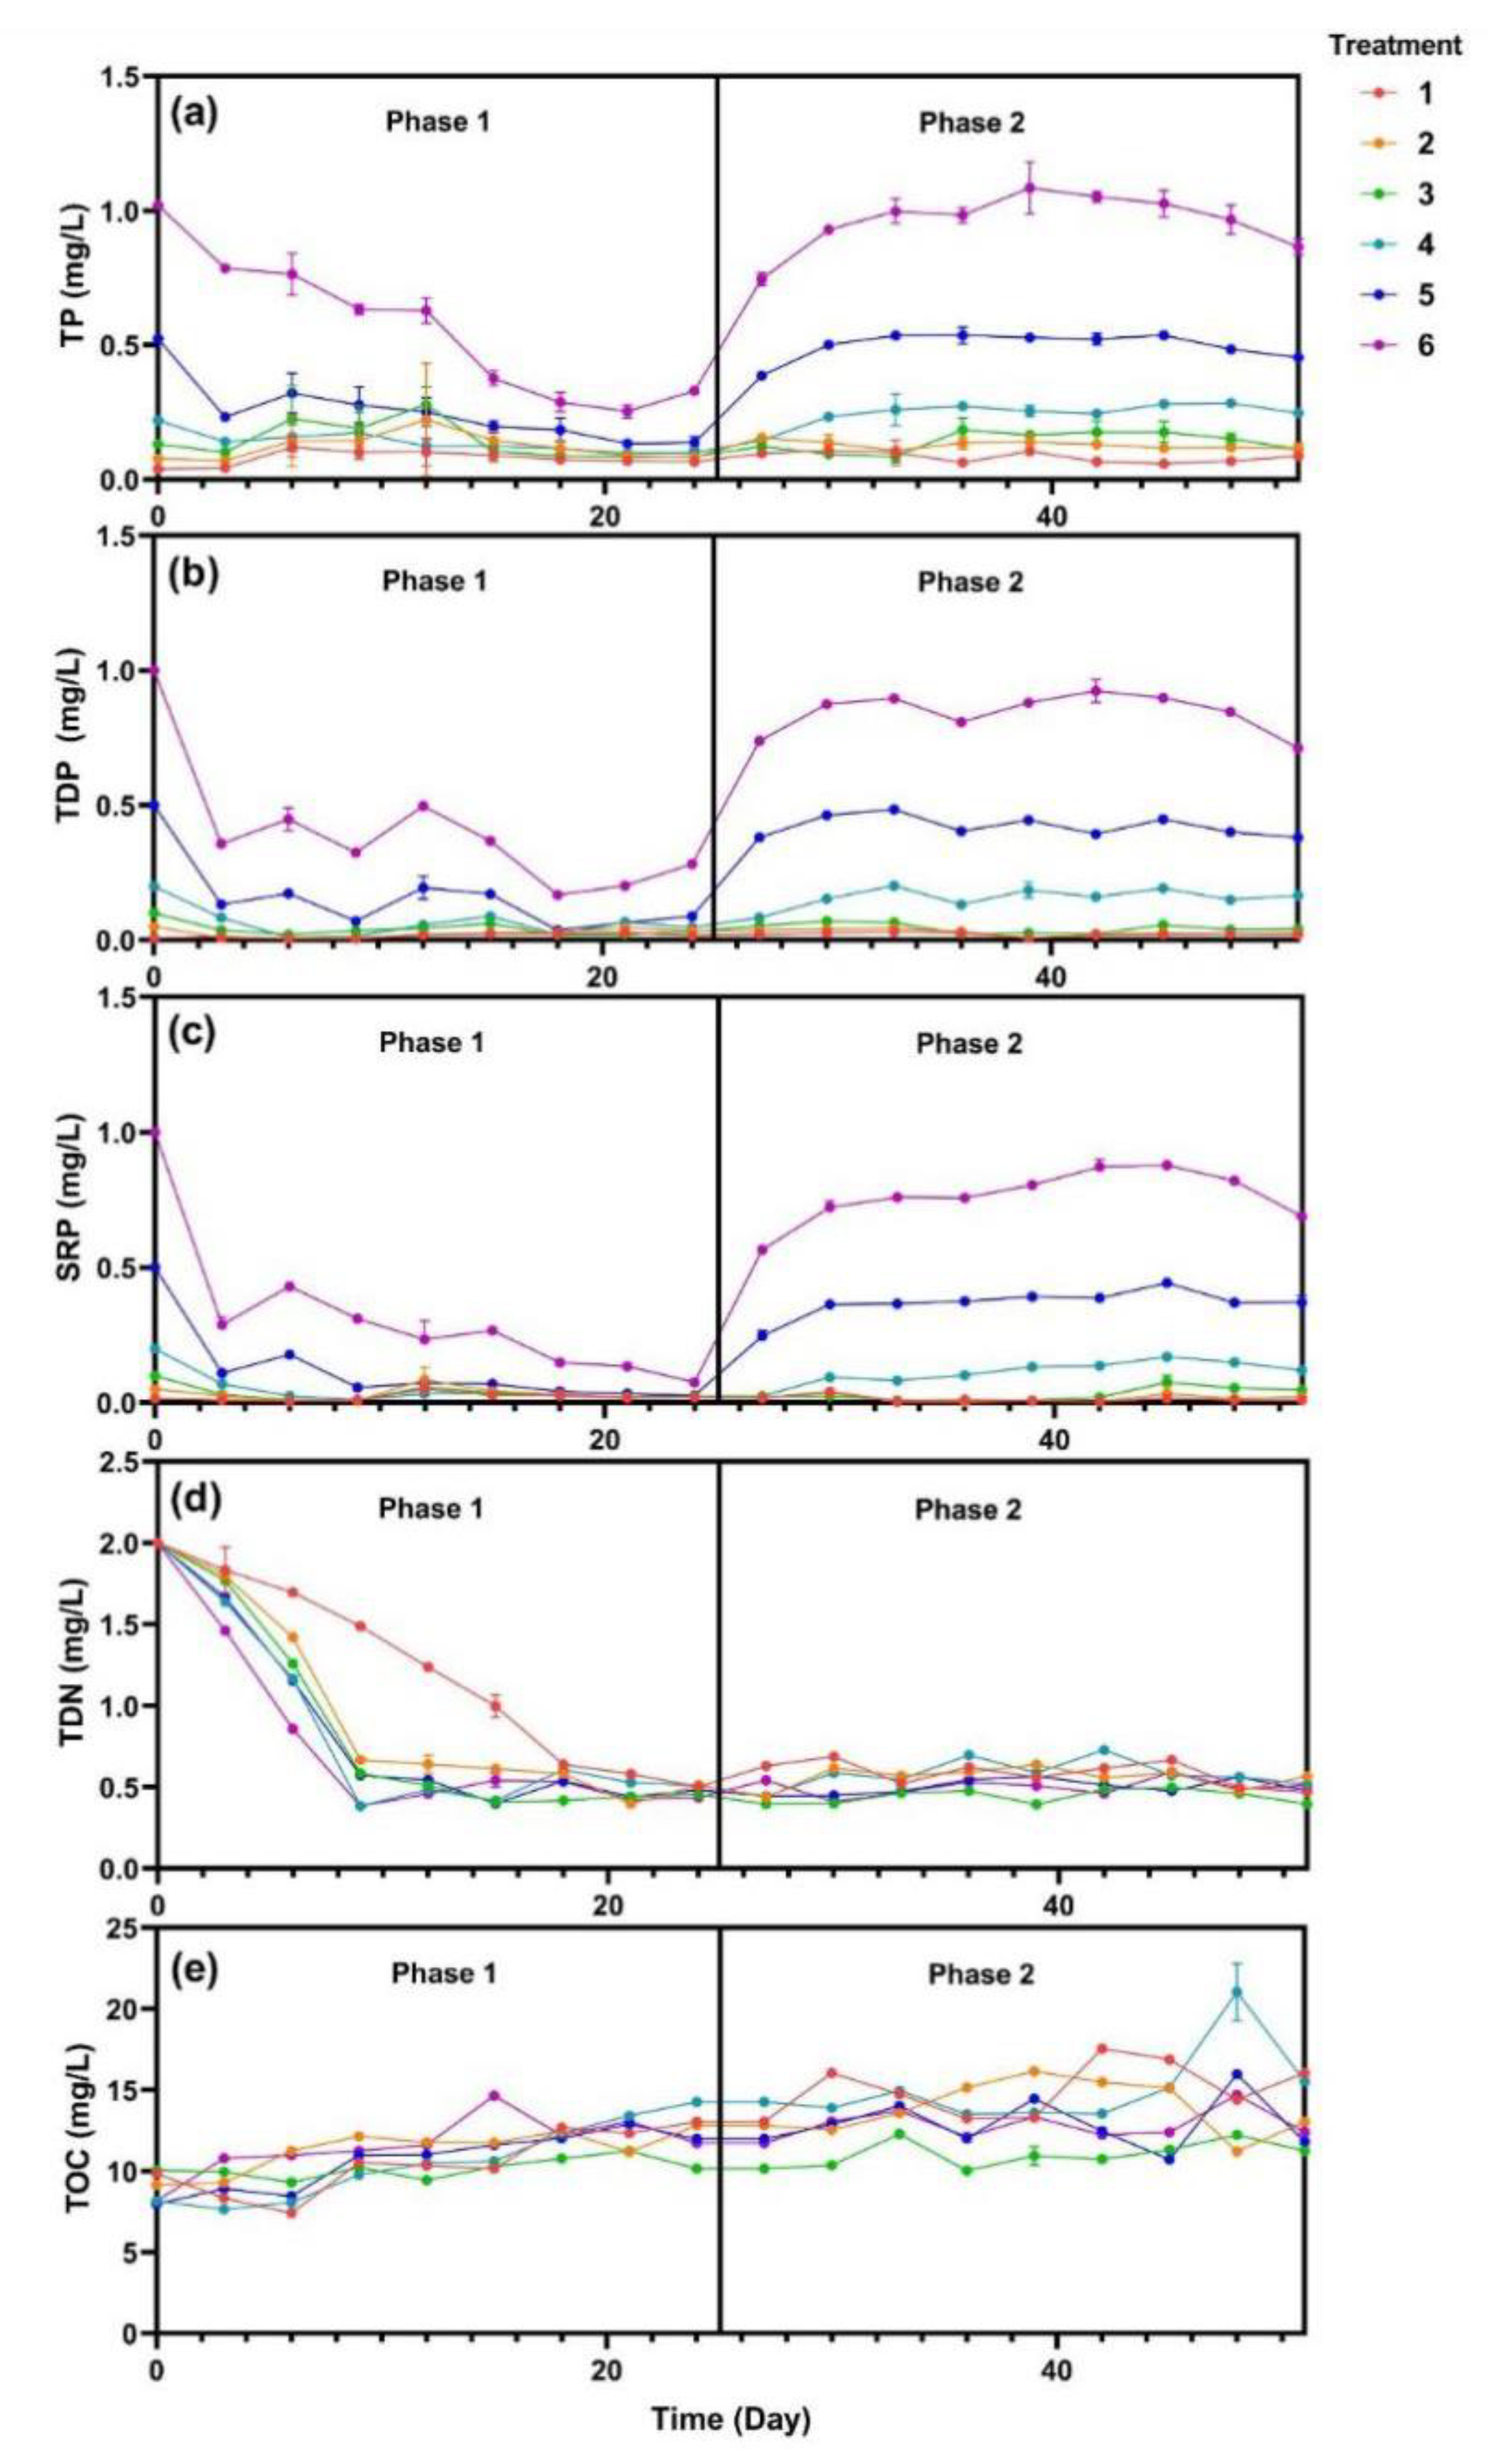
3.1. Water Quality Characterization

In this study, the temperature and pH were recorded during the experiments (Figure S1). During the phase 1, TP, TDP, and SRP decreased rapidly in the first three days (Figure 2). Subsequently, the rate of decrease slowed down and became stable. The TDN of the five treatments with added SRP decreased from 2.0 to 0.5 mg·L−1 in 10 days, while TDN of treatment 1 decreased much slower (p < 0.05). TOC of all six treatments increased gradually from 9 to 12 mg·L−1 and the six treatments appeared to have no significant difference. SRP were maintained at 0.05, 0.1, 0.2, 0.5, and 1.0 mg·L−1 for treatments 2 to 6 every three days during phase 2. TP, TDP, and SRP showed an increase followed by a plateau, while the TN and TOC of all six treatments were maintained at 0.5 mg·L−1 and 13 mg·L−1, respectively.
V. natans can take up N and P, which then reduce nutrient loadings with the absorption fitting exponentially for a given initial concentration [5]. In this study, the curves of SRP and TDN in phase 1 were also fitted by exponential equation (Table S1). Results showed that SRP of treatments 2 to 6 had a high correlation coefficient, while treatment 1 did not. Meanwhile, the curves of TDN were similar among the treatments except for treatment 1, indicating that the absorption of TDN was associated with the presence of P. A similar study of lake eutrophication in northwestern Ontario (Ontario, Canada) demonstrated that P was the key element driving eutrophication. Cyanobacterial blooms formed in the half of the lake upon the addition of C, N, and P, while the other half that was P-limited remained unchanged [21]. For phase 2, which had continuous P input, SRP was stable for each treatment and TDN was sustained at 0.5 mg·L−1. These results confirmed that sufficient P and low N was a typical characteristic of cyanobacterial blooms in freshwater environments [22]. However, Lake Taihu exhibits seasonal changes in nutrient limitation, with P being limited in spring, N and P colimitation in early summer and N limitation being more dominant in late summer and fall [23,24,25], and this study primarily focused on the condition of P limitation.

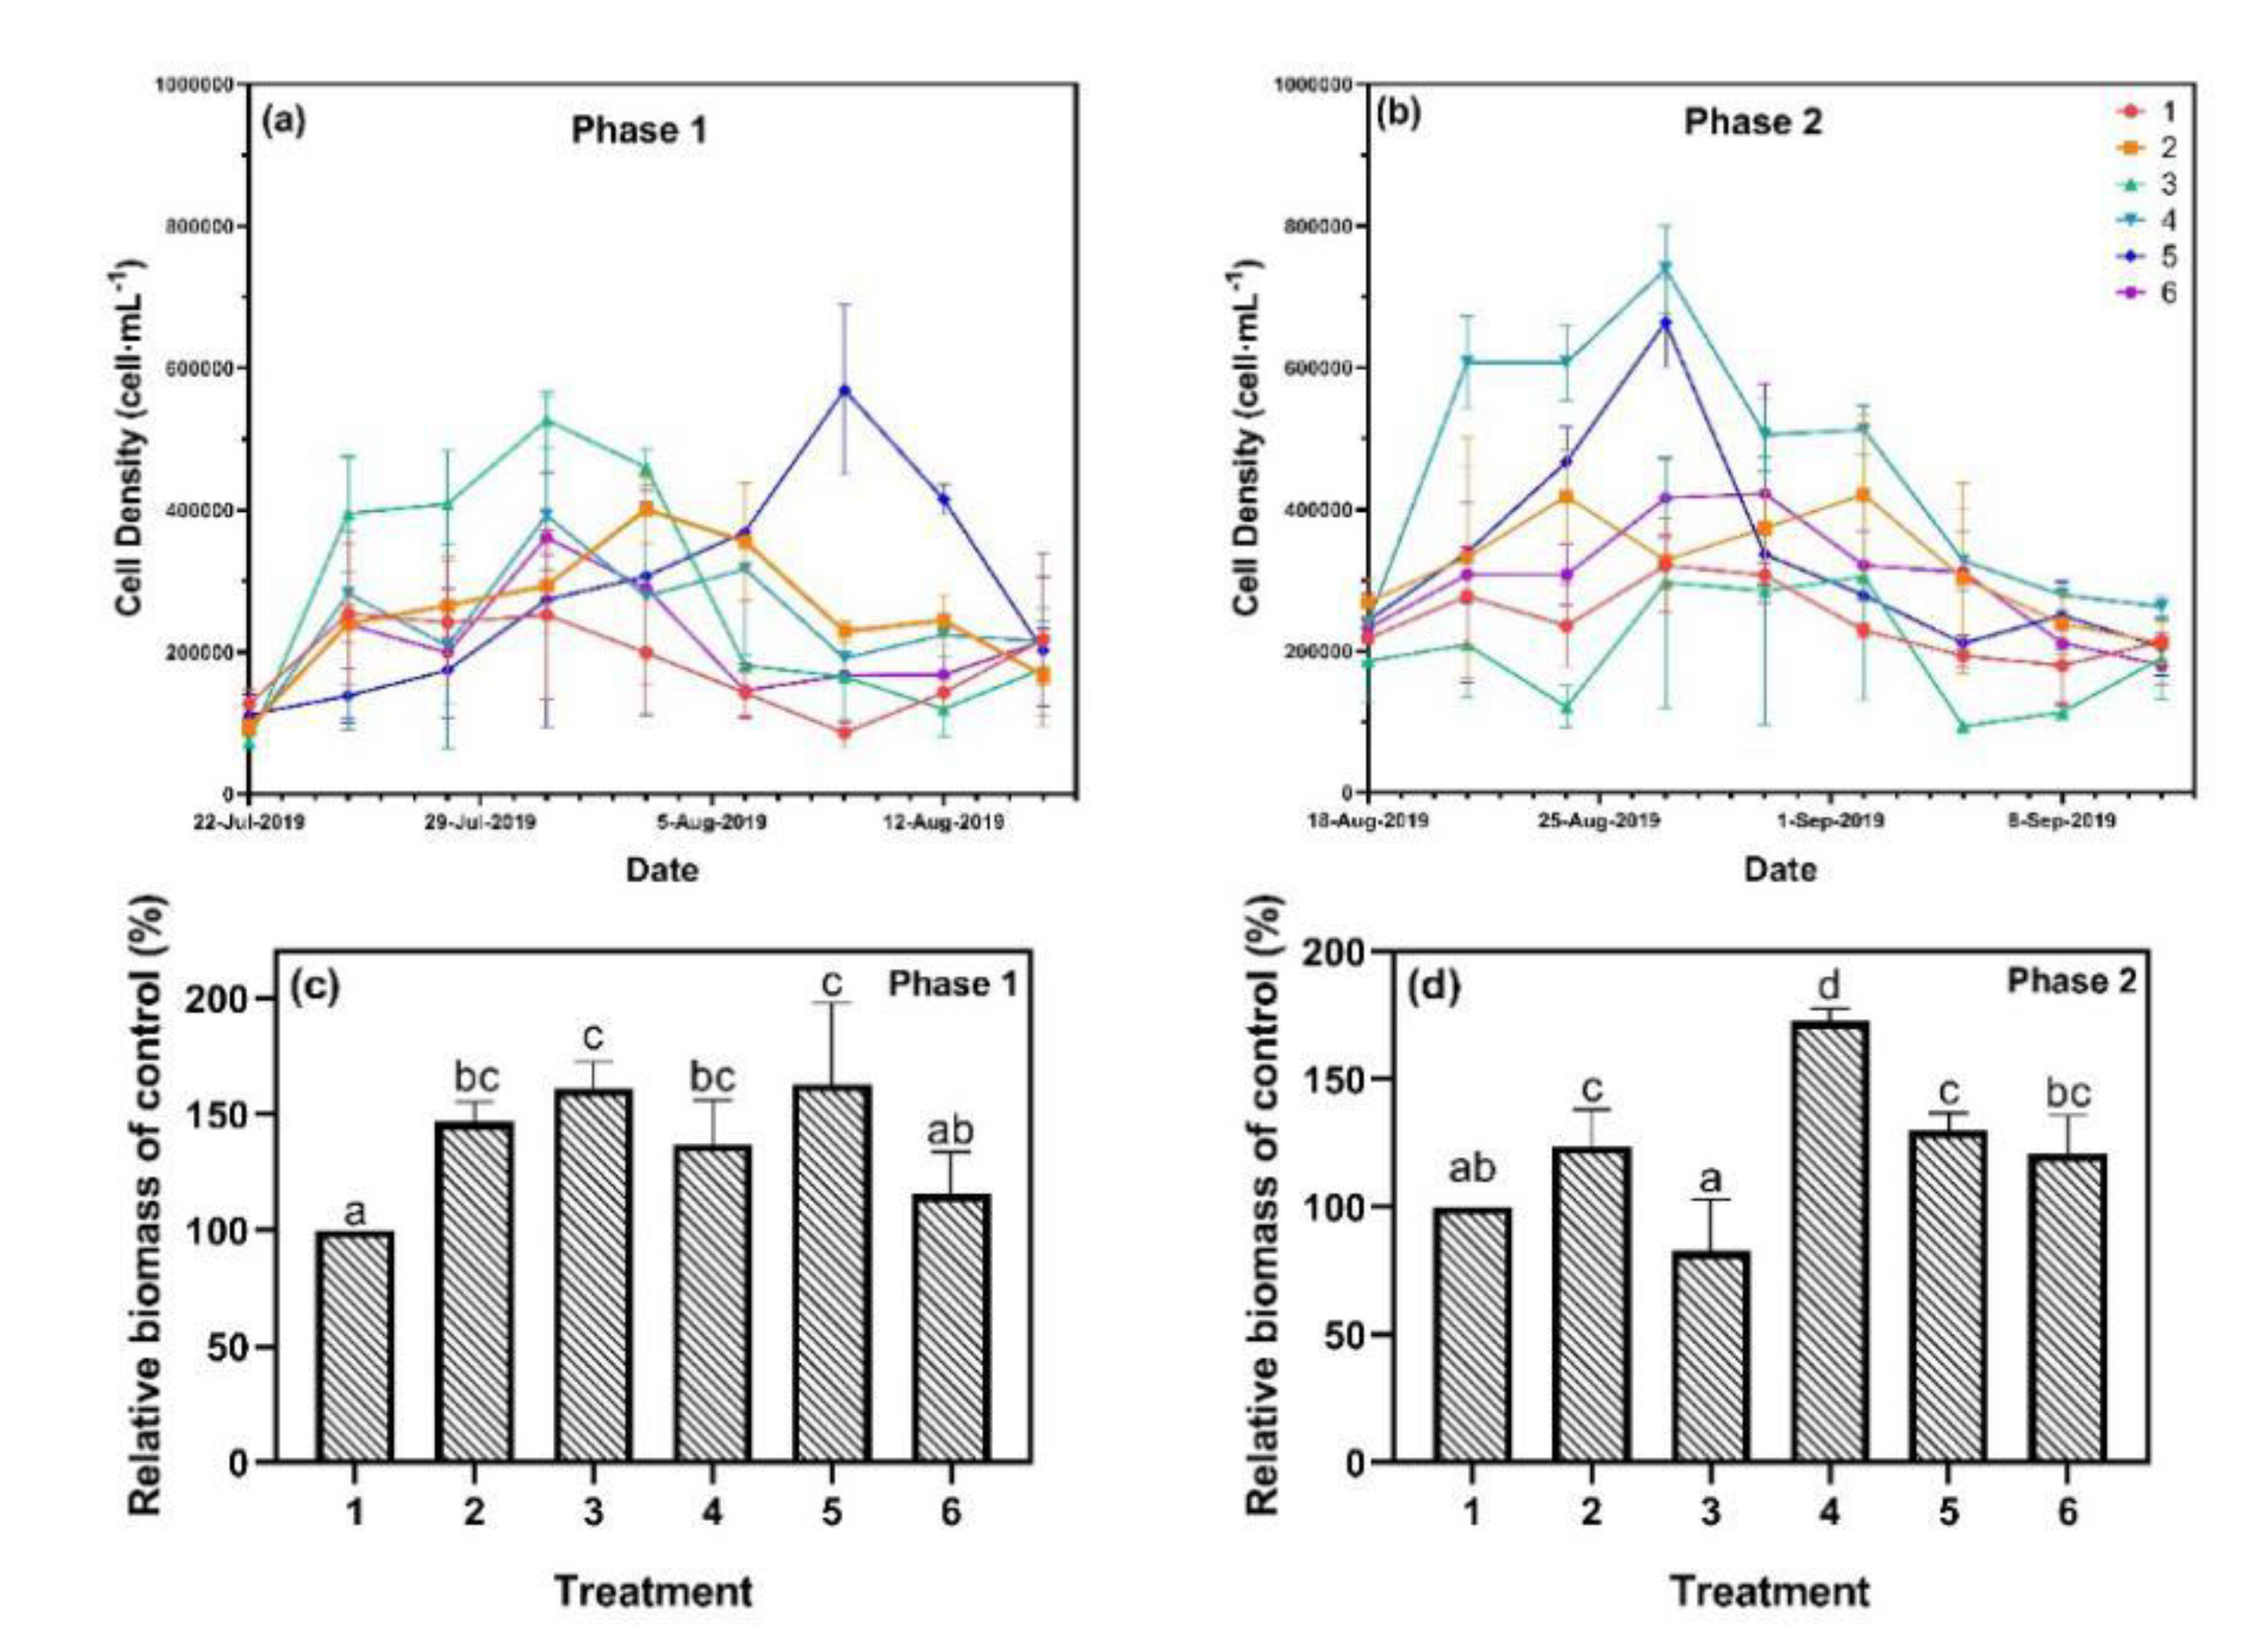
3.2. Algal Growth Analysis

During phase 1, the algal growth of treatments 1 and 6 slowly increased in the first 12 days and maintained at a very low level for the remaining time (Figure 3). In comparison, the cell density of treatment 3 rapidly increased in the first nine days and reached a maximum of 527,000 cells·mL−1. The peaks of treatments 2, 4, and 5 appeared later than treatment 3, reaching 401,000 cells·mL−1, 392,000 cells·mL−1, and 569,000 cells·mL−1, respectively. Similarly, in phase 2, peaks in cell density appeared on the 9th and 12th days. Nevertheless, treatments 4 and 5 became the treatments with the highest algal growth rate instead of treatment 3, and the maximum cell densities increased to 739,000 cell·mL−1 and 664,000 cell·mL−1, respectively. The algal growth of treatments 1 and 6 was stable and showed no significant difference compared to phase 1. Estimating the relative biomass of the cyanobacteria is also an effective way to describe algal growth [26]. Our results showed that the relative biomass of treatments 2, 3, 4, and 5 were about 150% of treatment 1 and 6 during phase 1. For phase 2, the difference in the relative biomass became smaller, with treatments 2, 5, and 6 being more than 125% of treatment 1. Meanwhile, the maximum value of treatment 4 increased to 175% and the minimum value of treatment 3 decreased to 82%.
In eutrophic lakes, P is a key nutrient element for algal growth [27], accelerating algal growth rate with increasing P loading [5]. However, high P loading (>0.5 mg·L−1) was also reported to suppress the growth of Microcystis [6]. In this study, algal growths of treatments 2, 3, 4, and 5 were promoted, while treatment 6 showed no changes during phase 1. For a continuous P input in phase 2, similar results were observed, where SRP of 0.2 mg·L−1 was found to be the most suitable concentration for algal growth. The growth patterns of cyanobacteria reflected a typical growth curve composed of lag growth phase, exponential growth phase, stationary phase, and decline phase [28]. The algal growth in this research showed a clear exponential growth phase and a decline phase, but with no stationary phase. Periodicity of cyanobacterial blooms in Lake Taihu was observed in 2007 with a period of 20 to 25 days [29]. In this study, the algal growth cycle of all six treatments remained unchanged and were 21 to 24 days for both phases, which revealed that the P loads affected only the maximum biomass, but not the growth phases.

3.3. Alkaline Phosphatase Activity and P Cycling

3.3.1. Alkaline Phosphatase (ALP) Activity
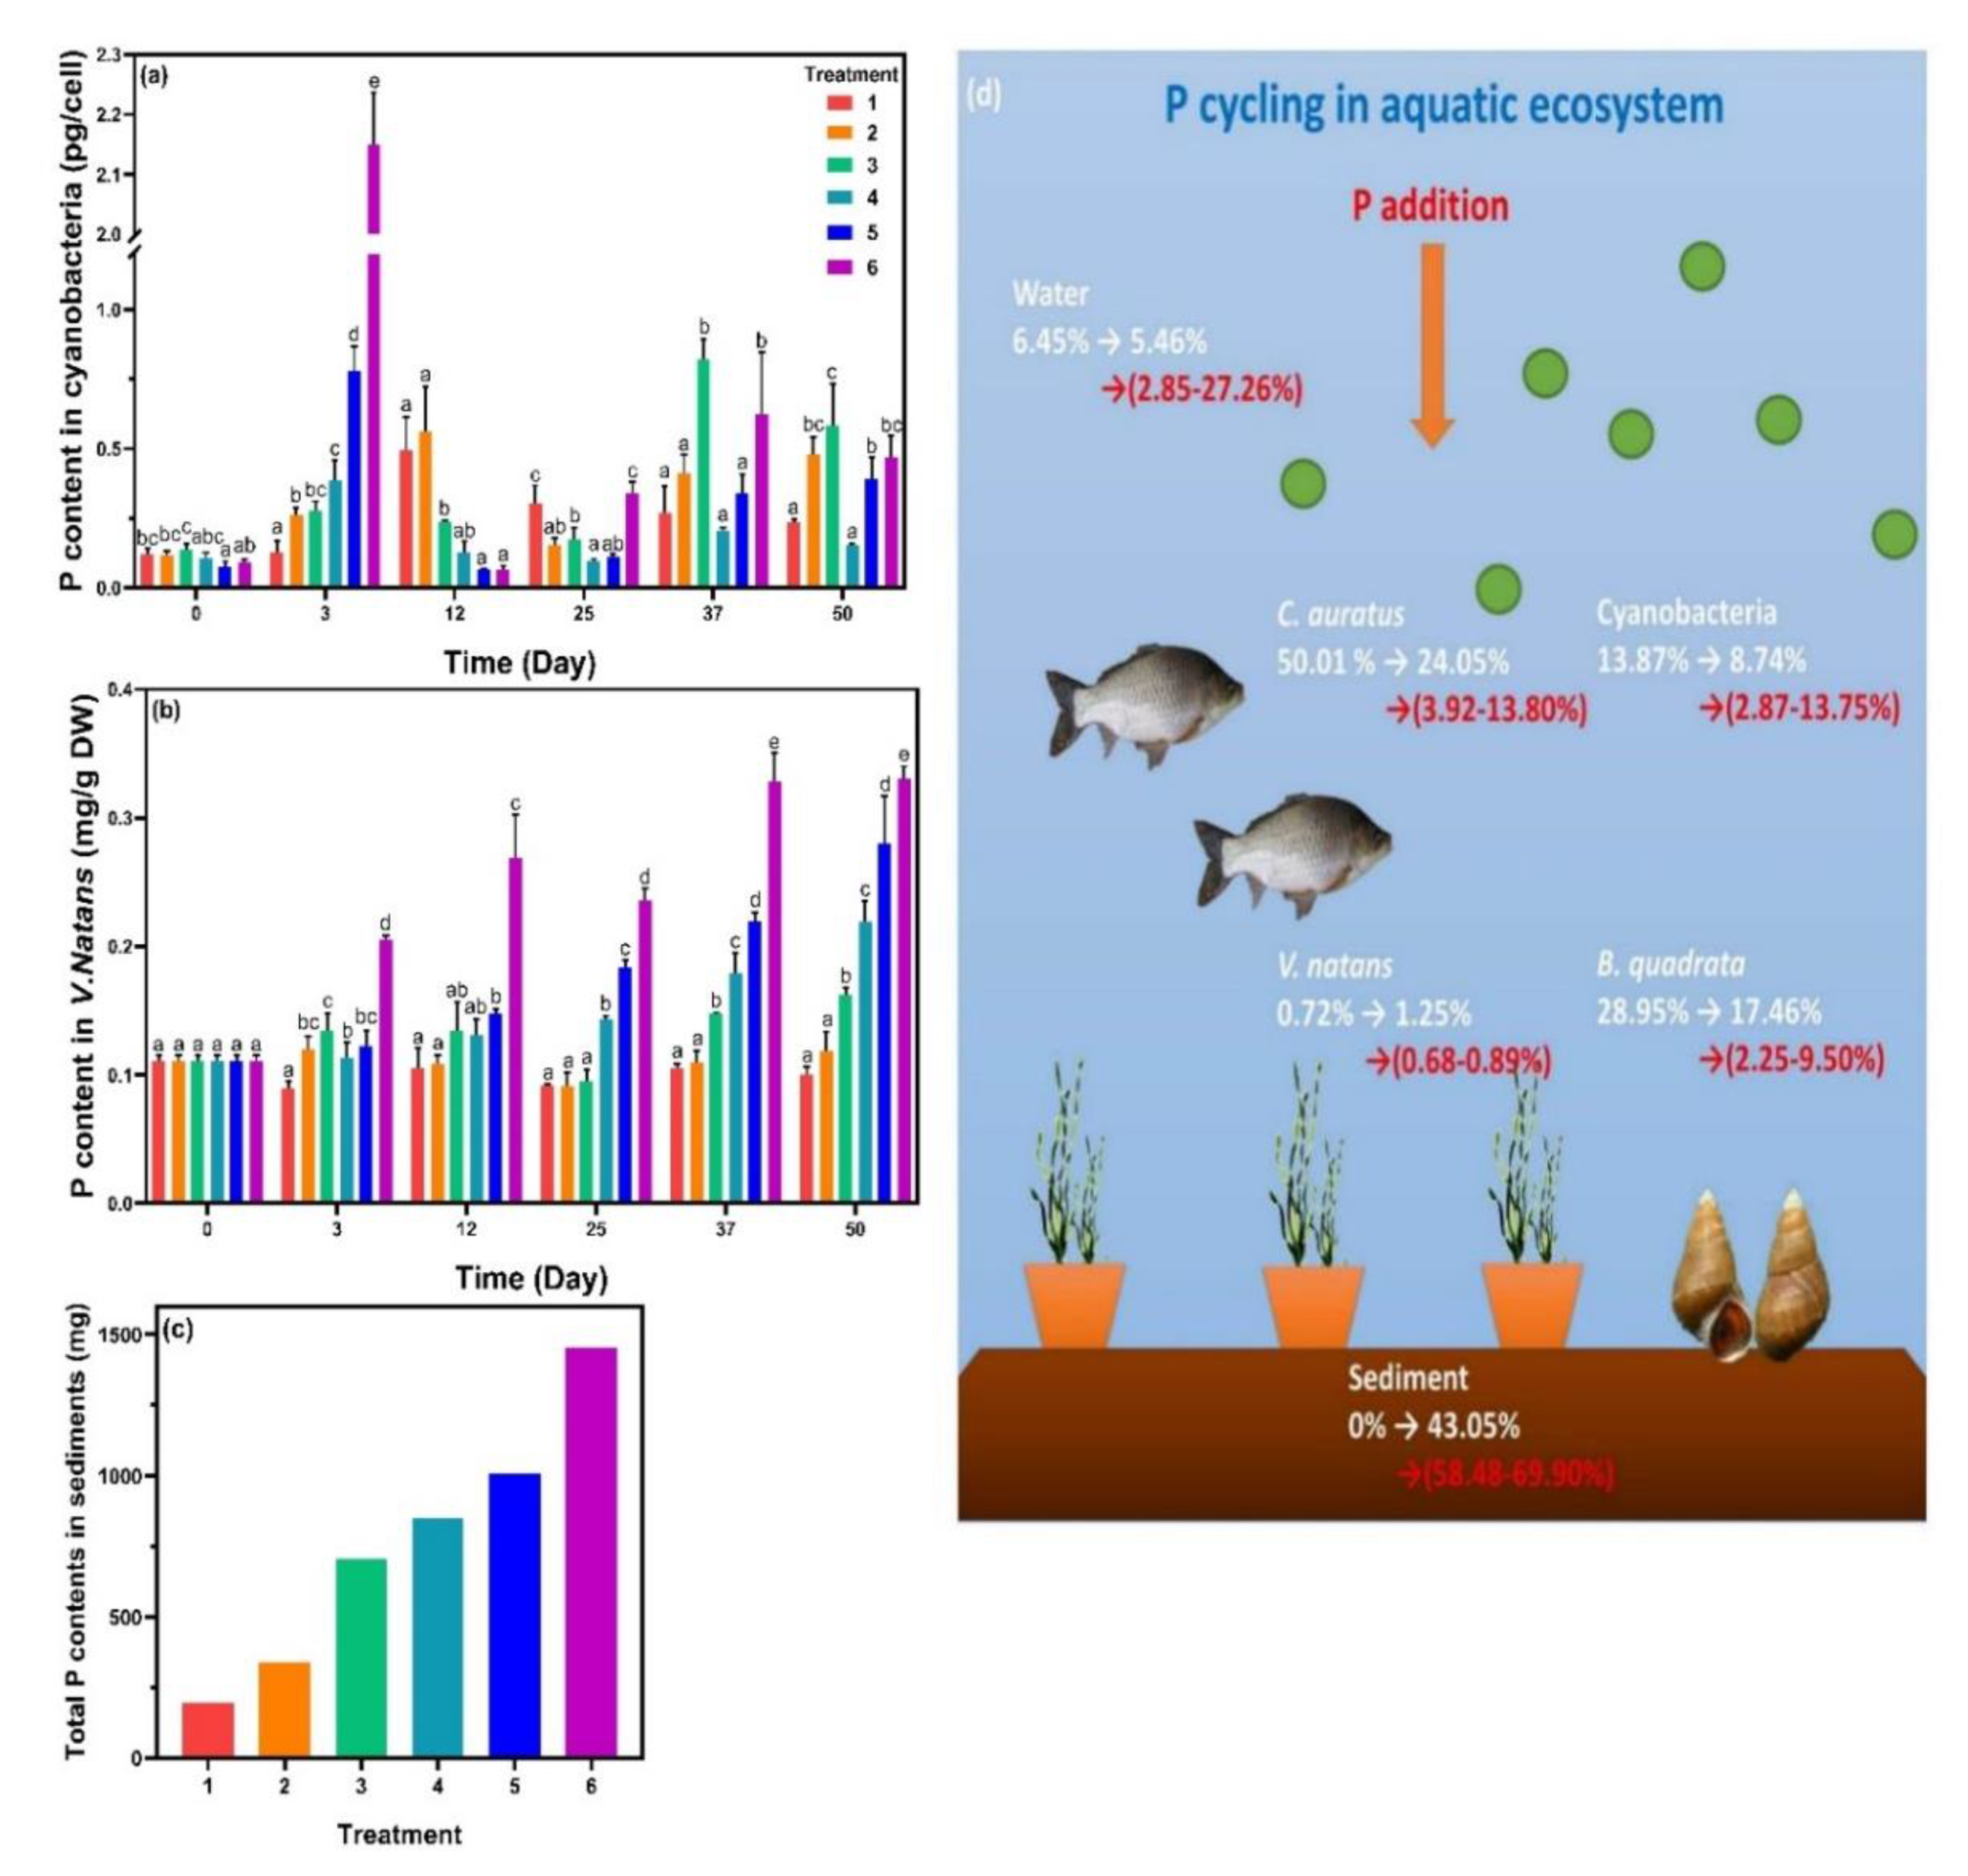
ALP activities were analyzed on algal cell surface (Figure 4). ALP activities of all six treatments increased significantly in phase 1. For phase 2, those in treatments with P addition decreased remarkably except for treatment 3, while treatment 1 did not exhibit significant changes. The production of ALP allows cyanobacteria to gain advantages under P-limited conditions, owing to the use of dissolved organic phosphorus by ALP as an additional strategy for P acquisition [30]. Previous studies found that ALP activity of Microcystis aeruginosa increased significantly in a system with no P addition [31], and similar results were observed in this study for phase 1. ALP activity was negatively regulated with P availability [32], therefore, with continuous P addition in phase 2, ALP activities of the P-added treatments decreased significantly, while ALP activity of treatment 1 was unchanged.

3.3.2. P Cycling

P contents were then analyzed in cyanobacteria, V. natans, and sediments (Figure 5). The initial P content in algal cells was 0.120 pg·cell−1. On the third day, P contents in cyanobacteria increased rapidly with increasing SRP concentration, and the values of treatment 5 and 6 were 0.778 and 2.150 pg·cell−1, respectively. On the twelfth day, algal cellular P contents in treatments 1 and 2 increased significantly (p < 0.05), while treatment 3 appeared to have no change. For treatments 4, 5, and 6, P in algal cells dropped to a level close to the values at the beginning. Subsequently, at the end of phase 1, the P contents in algal cells decreased gradually in the treatments except for those in treatment 6. During phase 2, the P contents in different treatments showed a similar tendency, which were then grouped into three, namely, low, mid, and high, corresponding to treatments 1 and 4, treatments 2 and 5 and treatments 3 and 6, respectively. P contents in V. natans of treatments 1 and 2 showed no significant change from beginning to end, while those in treatments 3, 4, 5, and 6 gradually increased with incubation time, and the values increased with the amount of P added. The trend of P contents in the sediments was like that in V. natans and the value increased with increasing SRP.
Previous research showed that cyanobacteria are able to increase the P uptake rate in response to low P supply [33]. Meanwhile, with increasing ALP activity, algal cells in this study accumulated intracellular P contents more rapidly compared to V. natans. During the exponential growth phase, intracellular P contents decreased significantly and continued until they reached the decline phase. Algal growth was supported by sufficient P supply [34]; therefore, algal cells maintained a certain intracellular P level for continuous P input. Nutrient uptake of V. natans was mainly through the leaves rather than the roots [35], as roots were strongly lignified and were impermeable to the tracers [36], resulting in the positive correlation between P contents in V. natans and SRP concentrations.
To investigate the P cycling in the system (Figure 5d), a total accounting of P in each treatment was carried out (Table S2). The P contents in C. auratus and B. quadrata were estimated based on their fresh weight [15]. In the beginning, biological P accounted for 93.55% and the majority were in C. auratus (50.01%) and B. quadrata (28.95%). For the treatment with no P addition, 43.05% of total P was converted into the form adsorbed to sediment from biological P. The addition of P (treatments 1–6) further increased the P contents in water and sediments, with biological P occupying a smaller proportion. However, the composition of biological P in aquatic organisms changed and P proportion in cyanobacteria became dominant. These results implied that more than half of P eventually migrated into the sediments. The sources of P that accumulated in sediments were metabolites of C. auratus and B. quadrata, rotten leaves of V. natans, dead algal cells, and adsorption of dissolved P. Meanwhile, bacteria in sediments can enhance sediment P release [37], and up to 70.2% of the released phosphorus could be absorbed by cyanobacteria and promoted the formation of cyanobacterial blooms [38].

3.4. MC-LR Release and Effects on Other Organisms

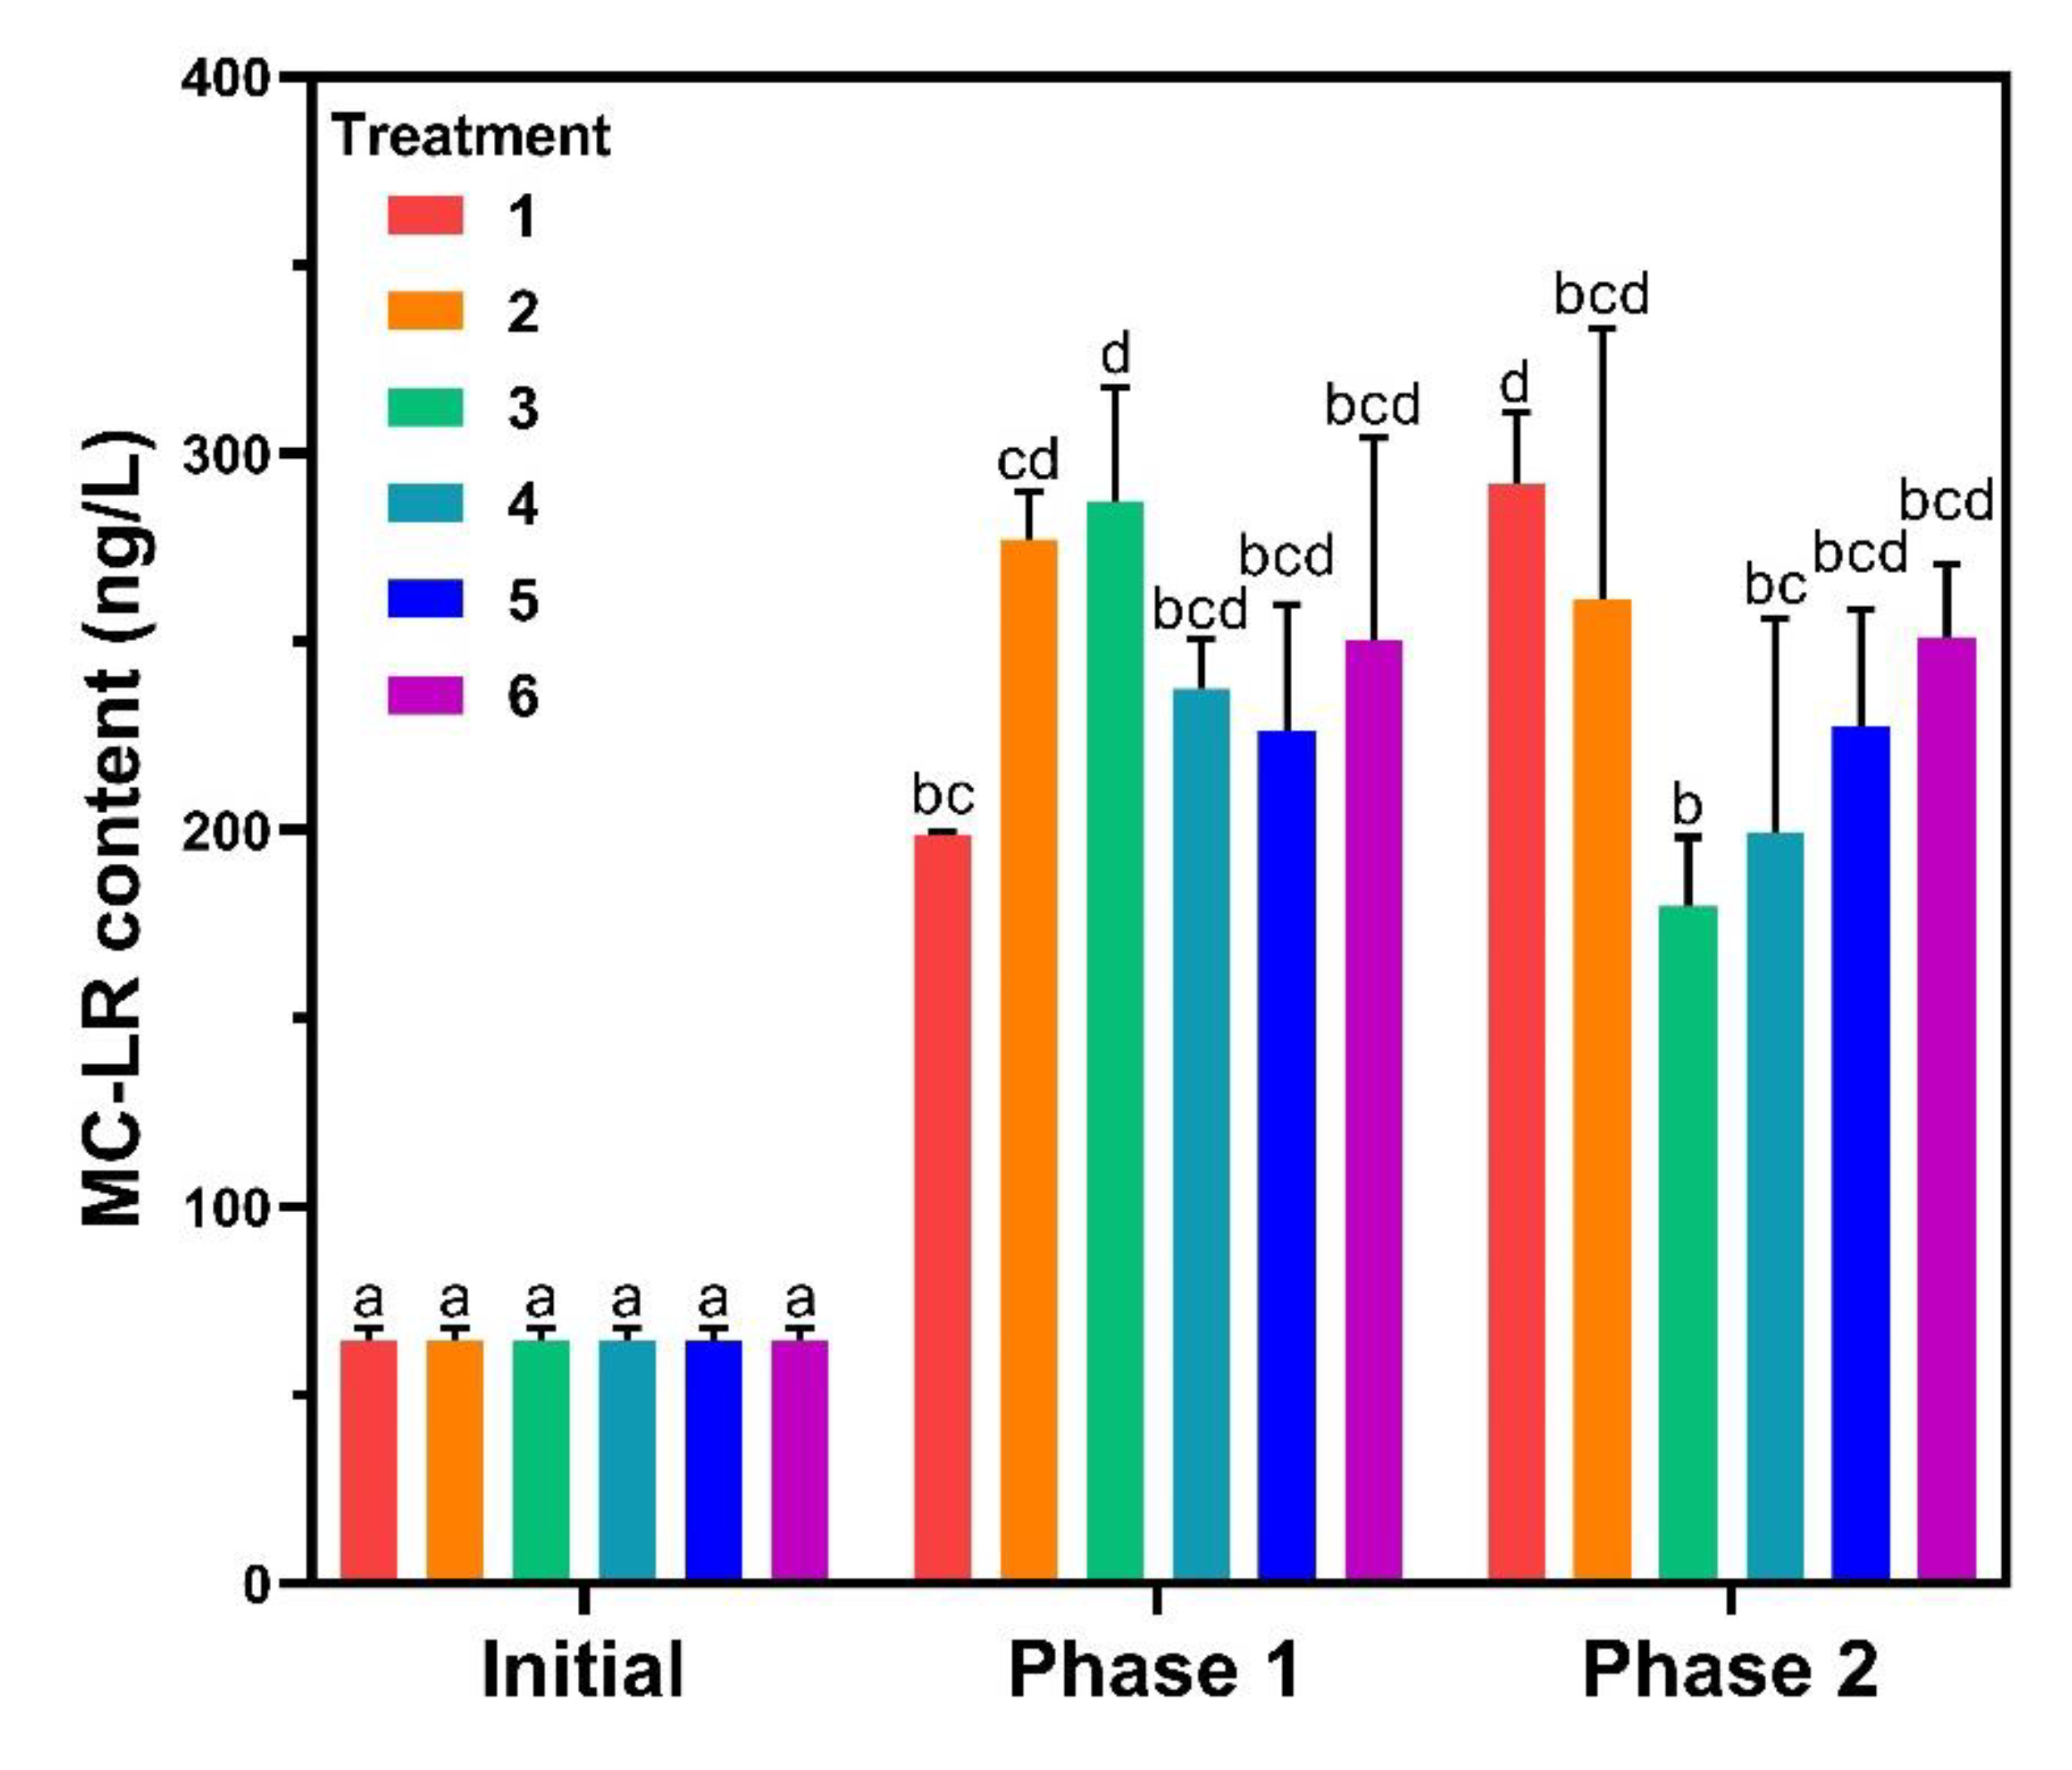
3.4.1. MC-LR Content

In lake ecosystems, MC-LR is secondary metabolite of some cyanobacteria, which has a great impact on aquatic ecosystems [9]. In this study, MC-LR contents in water were analyzed at the end of phase 1 and 2 (Figure 6). The MC-LR increased significantly at the end of phase 1 with the concentrations following the growth phase and the biomass except for treatment 5. For phase 2, MC-LR of treatment 1 was the highest while treatment 3 was the lowest, and the rest showed no difference compared to phase 1. MC-LR contents of treatments 1 and 5 were closer to each other and lower than the other treatments in the sediments. MC-LR is released during the decomposition of toxic Microcystis [39], and in Lake Taihu, Microcystis was the dominant bloom-forming cyanobacteria [40]. The production of MC-LR was positively correlated with the cell abundance of Microcystis in natural water for TP < 0.03 mg·L−1 [41], corroborating the experimental results of treatments 1, 2, and 3. No significant changes in algal biomass were observed for SRP between 0.05 and 0.5 mg·L−1 and similar results were obtained in former studies [42].

3.4.2. Response of Aquatic Organisms

C. auratus, B. quadrata, and V. natans are common species in freshwater lakes [43,44,45], which were the same species used in this study collected from Lake Taihu. The fresh weight of C. auratus, B. quadrata, and V. natans for treatments 1, 2, and 3 was smaller than the other treatments, and was negatively correlated with MC-LR content (Figure 7). These results implied that the presence of MC-LR was one of the important factors that inhibited the growth of aquatic organisms.
MC-LR was reported to have no significant effects on the fecundity of B. quadrata [46], but it was harmful to C. auratus, marked by hemorrhage and hyperemia as observed in their kidney and spleen [43]. Growth trends of both B. quadrata and C. auratus were similar, which were both related to MC-LR content, suggesting that MC-LR was actually toxic to both B. quadrata and C. auratus. The growth of V. natans showed the same trend, as MC-LR could have inhibited the growth of V. natans [47]. In addition to the effects of MC-LR, possible predation could exist between cyanobacteria, V. natans and B. quadrata, C. auratus. Microcystis accounted for 93.99% of the diet of C. auratus [48], while V. natans was the main food source of B. quadrata [49]. The fresh weight of C. auratus and B. quadrata was positively correlated with algal biomass.
Venn diagrams were used to compare the microbial diversity in sediments by visualizing the distribution operational taxonomic units (OTUs) numbers. For phase 1, the number of shared OTUs was 647, and the unique for each sample ranged from 1483 to 2264. The number of OTUs significantly decreased in phase 2, with the common OTUs at 293 and unique was between 685 and 1809 (Figure 7d,e). Both phases showed similar tendencies, where the OTU number of treatment 6 was the highest, while treatment 2 was the lowest. Cyanobacteria has been shown to contribute the highest variance in terms of changes in the abundances, affecting the structure of the entire microbial community [46], and MC-LR was also reported to have significant impact on microbial community structure and function. In this study, the microbial structure changed significantly in treatment 2, which contained a high amount of MC-LR.4.

4. Conclusions

This study confirmed that cyanobacteria had two characteristics favorable for bloom formation in eutrophic ecosystems. One is the nutrient absorption. Under low P concentration, the activity of ALP on algal cell surface increased significantly, which was beneficial for P transformation and absorption, and the increasing of intracellular P was detected. Cyanobacteria exhibited a stronger ability to absorb and store P compared with Vallisneria natans, which contributed to the fast growth of algal cells between 0.2 and 0.5 mg·L−1 of P. However, P loads affected only the maximum biomass, but not the growth phases. The growth cycle of cyanobacteria remained unchanged and was not related to P concentration. Meanwhile, P cycling indicated that 43.05–69.90% of the total P was existed in the form of sediments, and P content of cyanobacteria showed the highest increase among the organisms. The other is the release of microcystin. Along with algal growth, toxic MC-LR was released into the water, indirectly causing growth inhibition of the other aquatic organisms and the reduction of microbial diversity. Moreover, excessive P (1 mg·L−1) also showed inhibition of the entire ecosystem by suppressing the growth of animals and cyanobacteria. These findings provided valuable information on the mechanism of cyanobacterial bloom formation and the nutrient management of eutrophic lakes.

Supplementary Materials

The following are available online at https://www.mdpi.com/2073-4441/12/8/2265/s1, Figure S1: Environmental condition changes of (a) temperature and (b) pH, Table S1: Fitted regression equation of soluble reactive phosphorus (SRP) and total dissolved nitrogen (TDN) as a function of experimental time for each treatment, Table S2: Phosphorus contents distribution and total phosphorus accounting.

Author Contributions

Conceptualization, Z.Z.; Data curation, P.G., Q.L., H.Z., X.L. (Xin Luo) and W.Z.; Formal analysis, P.G. and Q.L.; Funding acquisition, Z.Z.; Methodology, P.G., H.Z., X.L. (Xin Luo) and W.Z.; Resources, Z.Z.; Software, P.G. and Q.L.; Supervision, X.L. (Xingzhang Luo); Visualization, Z.Z. and X.L. (Xingzhang Luo). All authors have read and agreed to the published version of the manuscript.

Funding

ABA Chemicals: 2019.

Acknowledgments

The study was supported by ABA Chemicals for funding support, and we appreciate the technical assistance of Cunhao Du, Hanqi Wu and Wenlu Sang from Hohai University.

Conflicts of Interest

The authors declare no conflict of interest.

References

  1. Li, W.; Yang, Q. Wetland utilization in Lake Taihu for fish farming and improvement of lake water quality. Ecol. Eng. 1995, 5, 107–121. [Google Scholar] [CrossRef]
  2. He, D.; Ren, L.; Wu, Q. Epiphytic bacterial communities on two common submerged macrophytes in Taihu Lake: Diversity and host-specificity. Chin. J. Oceanol. Limnol. 2012, 30, 237–247. [Google Scholar] [CrossRef]
  3. Chen, Q.; Zhang, X.; Shen, L.; Zhang, X.; Dongjiong, X.U. Community structure and species diversity of benthic macroinvertebrates in Taihu Basin of Jiangsu Province. J. Lake Sci. 2017, 29, 1398–1411. [Google Scholar]
  4. Xu, H.; Paerl, H.W.; Qin, B.; Zhu, G.; Hall, N.S.; Wu, Y. Determining critical nutrient thresholds needed to control harmful cyanobacterial blooms in eutrophic Lake Taihu, China. Environ. Sci. Technol. 2015, 49, 1051–1059. [Google Scholar] [CrossRef] [PubMed]
  5. Zhou, Y.W.; Xiao-Guang, X.U.; Han, R.M.; Zhou, X.H.; Feng, D.Y.; Zhi-Chun, L.I.; Wang, G.X. Effect of nutrient loadings on the regulation of water nitrogen and phosphorus by Vallisneria natans and its photosynthetic fluorescence characteristics. Environ. Sci. 2018, 39, 1180. [Google Scholar]
  6. Xu, H.; Yang, G.; Zhou, J.; Qin, B.; Zhang, G.; Zou, H.; Hu, X. Effect of nitrogen and phosphorus concentration on colony growth of Microcystis flosaquae in Lake Taihu. J. Lake Sci. 2014, 26, 213–220. [Google Scholar]
  7. Dhote, S.; Dixit, S. Water quality improvement through macrophytes—A review. Environ. Monit. Assess. 2009, 152, 149–153. [Google Scholar] [CrossRef]
  8. Huisman, J.; Codd, G.A.; Paerl, H.W.; Ibelings, B.W.; Verspagen, J.M.H.; Visser, P.M. Cyanobacterial blooms. Nat. Rev. Microbiol. 2018, 16, 471–483. [Google Scholar] [CrossRef]
  9. Merel, S.; Walker, D.; Chicana, R.; Snyder, S.; Thomas, O. State of knowledge and concerns on cyanobacterial blooms and cyanotoxins. Environ. Int. 2013, 59, 303–327. [Google Scholar] [CrossRef]
  10. Dawson, R.M. The toxicology of microcystins. Toxicon 1998, 36, 953–962. [Google Scholar] [CrossRef]
  11. Magalhães, V.F.D.; Soares, R.M.; Azevedo, S.M.F.O. Microcystin contamination in fish from the Jacarepagua Lagoon (Rio de Janeiro, Brazil): Ecological implication and human health risk. Toxicon 2001, 39, 1077–1085. [Google Scholar] [CrossRef]
  12. Yin, L.Y.; Huang, J.Q.; Li, D.H.; Hu, Z.Q.; Liu, Y. The effect of microcystin on the growth and development of submergent macrophyte Vallisneria natans Hara. Acta Hydrobiol. Sin. 2004, 28, 2115–2124. [Google Scholar]
  13. APHA; AWWA; WEF. Standard Methods for Examination of Water and Wastewater, 22nd ed.; American Public Health Association: Washington, DC, USA, 2012. [Google Scholar]
  14. Ebina, J.; Tsutsui, T.; Shirai, T. Simultaneous determination of total nitrogen and total phosphorus in water using peroxodisulfate oxidation. Water Res. 1983, 17, 1721–1726. [Google Scholar] [CrossRef]
  15. Griffiths, D. The direct contribution of fish to lake phosphorus cycles. Ecol. Freshw. Fish 2006, 15, 86–95. [Google Scholar] [CrossRef]
  16. Schwartz, M.K.; Kessler, G.; Bodansky, O. Comparison of serum alkaline phosphatase activities determined with sodium β-glycerophosphate and sodium phenylphosphate as substrates. Am. J. Clin. Pathol. 1960, 33, 275–280. [Google Scholar] [CrossRef] [PubMed] [Green Version]
  17. Kumar, P.; Hegde, K.; Brar, S.K.; Cledon, M.; Kermanshahi-Pour, A.; Roy-Lachapelle, A.; Galvez-Cloutier, R. Biodegradation of microcystin-LR using acclimatized bacteria isolated from different units of the drinking water treatment plant. Environ. Pollut. 2018, 242, 407–416. [Google Scholar] [CrossRef] [Green Version]
  18. Kerschbaumer, R.J.; Hirschl, S.; Kaufmann, A.; Ibl, M.; Koenig, R.; Himmler, G. Single-Chain Fv Fusion Proteins Suitable as Coating and Detecting Reagents in a Double Antibody Sandwich Enzyme-Linked Immunosorbent Assay. Anal. Biochem. 1997, 249, 219–227. [Google Scholar] [CrossRef] [PubMed]
  19. Kemp, P.F.; Aller, J.Y. Bacterial diversity in aquatic and other environments: What 16S rDNA libraries can tell us. FEMS Microbiol. Ecol. 2004, 47, 161–177. [Google Scholar] [CrossRef]
  20. Fadrosh, D.W.; Ma, B.; Gajer, P.; Sengamalay, N.; Ott, S.; Brotman, R.M.; Ravel, J. An improved dual-indexing approach for multiplexed 16S rRNA gene sequencing on the Illumina MiSeq platform. Microbiome 2014, 2, 1–6. [Google Scholar] [CrossRef] [Green Version]
  21. Schindler, D.W. Eutrophication and recovery in experimental lakes: Implications for lake management. Science 1974, 184, 897–899. [Google Scholar] [CrossRef] [Green Version]
  22. Conley, D.J.; Paerl, H.W.; Howarth, R.W.; Boesch, D.F.; Seitzinger, S.P.; Havens, K.E.; Lancelot, C.; Likens, G.E. Controlling eutrophication: Nitrogen and phosphorus. Science 2009, 323, 1014–1015. [Google Scholar] [CrossRef]
  23. Paerl, H.W.; Xu, H.; Hall, N.S.; Rossignol, K.L.; Joyner, A.R.; Zhu, G.; Qin, B. Nutrient limitation dynamics examined on a multi-annual scale in Lake Taihu, China: Implications for controlling eutrophication and harmful algal blooms. J. Freshw. Ecol. 2014, 30, 5–24. [Google Scholar] [CrossRef]
  24. Xu, H.; Paerl, H.W.; Qin, B.; Zhu, G.; Gaoa, G. Nitrogen and phosphorus inputs control phytoplankton growth in eutrophic Lake Taihu, China. Limnol. Oceanogr. 2010, 55, 420–432. [Google Scholar] [CrossRef] [Green Version]
  25. Xu, H.; Zhu, G.; Qin, B.; Paerl, H.W. Growth response of Microcystis spp. to iron enrichment in different regions of Lake Taihu 2012, China. Hydrobiologia 2012, 700, 187–202. [Google Scholar] [CrossRef]
  26. Paerl, H.W.; Scott, J.T.; McCarthy, M.J.; Newell, S.E.; Gardner, W.S.; Havens, K.E.; Hoffman, D.K.; Wilhelm, S.W.; Wurtsbaugh, W.A. It takes two to tango: When and where dual nutrient (N & P) reductions are needed to protect lakes and downstream ecosystems. Environ. Sci. Technol. 2016, 50, 10805–10813. [Google Scholar]
  27. Paerl, H.W.; Xu, H.; McCarthy, M.J.; Zhu, G.; Qin, B.; Li, Y.; Gardner, W.S. Controlling harmful cyanobacterial blooms in a hyper-eutrophic lake (Lake Taihu, China): The need for a dual nutrient (N & P) management strategy. Water Res. 2011, 45, 1973–1983. [Google Scholar]
  28. Wen, R.; Sui, Z.; Bao, Z.; Zhou, W.; Wang, C. Isolation and characterization of calmodulin gene of Alexandrium catenella (Dinoflagellate) and its performance in cell growth and heat stress. J. Ocean Univ. China 2014, 13, 290–296. [Google Scholar] [CrossRef]
  29. Zhang, N.; Li, G.; Yu, J.; Ding, M.; Xu, L. Character of blue-green algal blooms outbreak in Taihu Lake. Environ. Monit. China 2009, 25, 71–74. [Google Scholar]
  30. Wang, S.; Xiao, J.; Wan, L.; Zhou, Z.; Wang, Z.; Song, C.; Zhou, Y.; Cao, X. Mutual dependence of nitrogen and phosphorus as key nutrient elements: One facilitates Dolichospermum flos-aquae to overcome the limitations of the other. Environ. Sci. Technol. 2018, 52, 5653–5661. [Google Scholar] [CrossRef] [PubMed]
  31. Harke, M.J.; Berry, D.L.; Ammerman, J.W.; Gobler, C.J. Molecular response of the bloom-forming cyanobacterium, Microcystis aeruginosa, to phosphorus limitation. Microb. Ecol. 2012, 63, 188–198. [Google Scholar] [CrossRef] [PubMed]
  32. Chróst, R.J.; Overbeck, J. Kinetics of alkaline phosphatase activity and phosphorus availability for phytoplankton and bacterioplankton in lake pluβsee (North German Eutrophic Lake). Microb. Ecol. 1987, 13, 229–248. [Google Scholar] [CrossRef]
  33. Mazard, S.; Wilson, W.H.; Scanlan, D.J. Dissecting the physiological response to phosphorus stress in marine synechococcus isolates (Cyanophyceae). J. Phycol. 2012, 48, 94–105. [Google Scholar] [CrossRef]
  34. Baldia, S.F.; Evangelista, A.D.; Aralar, E.V.; Santiago, A.E. Nitrogen and phosphorus utilization in the cyanobacterium Microcystis aeruginosa isolated from Laguna de Bay, Philippines. J. Appl. Phycol. 2007, 19, 607–613. [Google Scholar] [CrossRef]
  35. Gras, A.F.; Koch, M.S.; Madden, C.J. Phosphorus uptake kinetics of a dominant tropical seagrass Thalassia testudinum. Aquat. Bot. 2003, 76, 299–315. [Google Scholar] [CrossRef]
  36. Barnabas, A.D. Thalassodendron ciliatum (Forssk.) Den Hartog: Root structure and histochemistry in relation to apoplastic transport. Aquat. Bot. 1991, 40, 129–143. [Google Scholar] [CrossRef]
  37. Spears, B.M.; Carvalho, L.; Perkins, R.; Kirika, A.; Paterson, D.M. Sediment phosphorus cycling in a large shallow lake: Spatio-temporal variation in phosphorus pools and release. Hydrobiologia 2007, 584, 37–48. [Google Scholar] [CrossRef]
  38. Cao, X.; Wang, Y.; He, J.; Luo, X.; Zheng, Z. Phosphorus mobility among sediments, water and cyanobacteria enhanced by cyanobacteria blooms in eutrophic Lake Dianchi. Environ. Pollut. 2016, 219, 580–587. [Google Scholar] [CrossRef]
  39. Watanabe, M.F.; Tsuji, K.; Watanabe, Y.; Harada, K.I.; Suzuki, M. Release of heptapeptide toxin (microcystin) during the decomposition process of Microcystis aeruginosa. Nat. Toxins 2006, 1, 48–53. [Google Scholar] [CrossRef]
  40. Tang, X.; Krausfeldt, L.; Shao, K.; LeCleir, G.; Stough, J.; Gao, G.; Boyer, G.; Zhang, Y.; Paerl, H.; Qin, B.; et al. Seasonal gene expression and the ecophysiological implications of toxic Microcystis aeruginosa blooms in Lake Taihu. Environ. Sci. Technol. 2018, 52, 11049–11059. [Google Scholar] [CrossRef]
  41. Yu, G.; Jiang, Y.; Song, G.; Tan, W.; Zhu, M.; Li, R.; Yu, G.; Jiang, Y.; Song, G.; Tan, W. Variation of Microcystis and microcystins coupling nitrogen and phosphorus nutrients in Lake Erhai, a drinking-water source in Southwest Plateau, China. Environ. Sci. Pollut. Res. Int. 2014, 21, 9887–9898. [Google Scholar] [CrossRef]
  42. Otten, T.G.; Xu, H.; Qin, B.; Zhu, G.; Paerl, H.W. Spatiotemporal Patterns and Ecophysiology of Toxigenic Microcystis Blooms in Lake Taihu, China: Implications for Water Quality Management. Environ. Sci. Technol. 2012, 46, 3480–3488. [Google Scholar] [CrossRef] [PubMed]
  43. Qiao, Q.; Liang, H.; Zhang, X. Effect of cyanobacteria on immune function of crucian carp (Carassius auratus) via chronic exposure in diet. Chemosphere 2013, 90, 1167–1176. [Google Scholar] [CrossRef] [PubMed]
  44. Shi, W.; Yu, N.; Jiang, X.; Han, Z.; Wang, S.; Zhang, X.; Wei, S.; Giesy, J.P.; Yu, H. Influence of blooms of phytoplankton on concentrations of hydrophobic organic chemicals in sediments and snails in a hyper-eutrophic, freshwater lake. Water Res. 2017, 113, 22–31. [Google Scholar] [PubMed]
  45. Song, Y.-Z.; Kong, F.-F.; Xue, Y.; Qin, B.-Q. Responses of chlorophyll and MDA of Vallisneria natans to nitrogen and phosphorus availability and epiphytic algae. J. Freshw. Ecol. 2014, 30, 85–97. [Google Scholar] [CrossRef]
  46. Qiao, F.; Lei, K.; Han, X.; Wei, Z.; Zhao, X.; An, L.; LeBlanc, G.A. No impacts of microcystins on wild freshwater snail Bellamya aeruginosa fecundity from a eutrophic lake. Environ. Toxicol. Pharm. 2018, 60, 165–168. [Google Scholar] [CrossRef] [PubMed]
  47. Li, Q.; Gu, P.; Zhang, H.; Luo, X.; Zhang, J.; Zheng, Z. Response of submerged macrophytes and leaf biofilms to the decline phase of Microcystis aeruginosa: Antioxidant response, ultrastructure, microbial properties, and potential mechanism. Sci. Total Environ. 2019, 699, 134325. [Google Scholar] [CrossRef] [PubMed]
  48. Liu, E.-S. A study on diet composition of dominant fishes in Lake Taihu. J. Fish China 2008, 32, 395–401. [Google Scholar]
  49. He, H.; He, Y.; Ji, Y.; Guo, L.; Li, K. Effects of cyanobacterial accumulation and snail grazing on the growth of Vallisneria natans. Acta Ecol. Sin. 2012, 32, 5562–5567. [Google Scholar] [CrossRef] [Green Version]
Figure 1. (a) Location of Lake Taihu and study site where the in situ experiments were conducted; (b) aquatic ecosystem established in the experiment, including water, mixed cyanobacteria, Carassius auratus, Bellamya quadrata, and Vallisneria natans collected from Lake Taihu.
Water 12 02265 g001
Figure 2. Water quality changes of (a) total phosphorus (TP), (b) total dissolved phosphorus (TDP), (c) soluble reactive phosphorus (SRP), (d) total dissolved nitrogen (TDN), and (e) total organic carbon (TOC). Data are represented as means ± standard deviation analyzed from three replicates.
Water 12 02265 g002
Figure 3. Algal growth curve of (a) phase 1 and (b) phase 2, and algal relative biomass of (c) phase 1 and (d) phase 2. Data are represented as means ± standard deviation analyzed from three replicates. Different characters indicate significant difference (p < 0.05, Duncan’s test).
Water 12 02265 g003
Figure 4. Alkaline phosphatase (ALP) activities on the algal surface. Data are represented as means ± standard deviation analyzed from three replicates. Different characters indicate significant difference (p < 0.05, Duncan’s test).
Water 12 02265 g004
Figure 5. Phosphorus (P) contents in (a) cyanobacteria, (b) Vallisneria natans, and (c) sediments. (d) P cycling was described as the P distribution (percentage of total P in the ecosystem) in the organisms, white numbers indicated the P changes from beginning to end with no P addition, while red numbers represented the final P proportion for P-added treatments. Data are represented as means ± standard deviation analyzed from three replicates. Different characters indicate significant difference (p < 0.05, Duncan’s test).
Water 12 02265 g005
Figure 6. Microcystin-LR (MC-LR) contents in water. Data are represented as means ± standard deviation analyzed from three replicates. Different characters indicate significant difference (p < 0.05, Duncan’s test).
Water 12 02265 g006
Figure 7. The fresh weight of (a) Carassius auratus, (b) Bellamya quadrata, and (c) Vallisneria natans, and microbial diversity in the sediments of (d) phase 1 and (e) phase 2. Data are represented as means ± standard deviation analyzed from three replicates. Different characters indicate significant difference (p < 0.05, Duncan’s test).
Water 12 02265 g007

