Abstract
Ice phenomena are construed as the occurrence of ice in water irrespective of its structure, form, and duration. One of the most frequently discussed research problems is the possibility of using long-term ice phenology as an indicator of changes of the thermal conditions of ambient air. The study used correlation analysis and regression models in order to determine changes in the parameters studied over time. In order to compare the ice regime of the study reservoir and other lakes in the region, discriminant function analysis, principal components analysis (PCA), and canonical redundancy analysis (RDA) were applied. During the 52 winter seasons studied (1964–2015), there were weak but still statistically significant trends concerning the increase in air temperature in the region (by 0.3 °C per decade), the reduction in the number of days with ice cover (by 8.6 days per decade) and the decline in the maximum and average thicknesses of lake ice (by 2.0 cm and 1.2 cm per decade). The low average depth and volume capacity are reflected in the rapid freezing rate of the reservoir, and its location results in a longer duration of ice cover, greater ice thickness, and later dates of its melting.
1. Introduction
Ice phenomena are construed as the occurrence of ice in water irrespective of its structure, form, and duration [1]. Of all the ice phenomena observed in lakes and other water bodies, the presence of a complete ice cover is the one most readily noticed [2].
Research into ice phenomena occurring in lakes and other water bodies situated in the temperate climate zone covers a broad range of issues. First of all, they focus on determining the basic regularities of changes to the ice regime [2,3,4,5,6,7,8,9,10,11].
The occurrence of ice phenomena, and in particular ice cover, affects the course of limnic processes in various ways, e.g., the dynamics of the water mass and its thermal and oxygen conditions [5,12,13], the occurrence of gases [14], and the determining of light conditions as well as the course of chemical and biochemical processes [13,14,15]. Ice phenomena are reflected in the shaping of the geomorphology of the shore area, affect the local climate conditions, modify the conditions of a small-scale water cycle—its vertical and horizontal exchange in the reservoir, and affect the vegetation and animal species of the shore area [16,17,18]. Ice phenomena are therefore an important factor in the formation of the biotope and biocenotic conditions [15,19]. Among the most frequently discussed research problems is the possibility of using long-term ice phenology as an indicator of contemporary climate change. In this approach, average dates of ice cover formation and disappearance and the duration of ice phenomena as well as the average and maximum thicknesses of ice on lakes are taken into account. These data are most often correlated with air temperature values recorded by weather stations in different parts of the world [3,4,7,8,9,20,21,22,23,24,25,26,27,28,29,30,31,32,33,34,35,36]. In some studies which deal with changes in the ice regime of lakes over long periods, the authors link the variability of ice phenomena to teleconnection effects [37,38,39,40,41,42,43,44,45,46].
The purpose of this paper is to determine the direction and degree of change in the ice regime of the water reservoir situated within the Silesian Upland under the influence of currently occurring climate change. The data series, which concerns the dates of ice cover formation and disappearance, the number of days with ice cover, and the average and maximum ice thicknesses for the reservoir in question, spans over 50 years and is among the longest in the region. In addition to filling a significant gap in hydrological research, the research problem presented here is important since ice phenomena (and the presence of the ice cover in particular) have a significant impact on the functioning of water bodies and on the manner in which these are used by humans.
The research conducted in this water body during three years of measurements has demonstrated that it exhibits natural (quasi-natural) ice phenomena, which result from its location: far away from urban and industrial areas (within an agricultural and forest catchment), in the suburban zone of the Katowice conurbation. Therefore, information on the variability of its ice regime within the last half-century may provide a good indicator of the climate change currently occurring in the region. Progressive warming is an indicator of regional climate change [47]. The increase in the average global air temperature since mid-19th century is estimated at approximately 0.6 °C [48]. In the second half of the 20th century, the average air temperature in Poland increased by approximately 1 °C [49].
The research results obtained fill the information gap concerning the patterns of ice phenomena in bodies of water located in Southern Poland. To date, ice phenomena in water bodies in Southern Poland have been studied on the basis of data from measurement series spanning a maximum of 30 years [50]. Results of this research provide an important indication of climate change, confirming the findings made by climatologists [47,48,49,51]. It is the first case in the Silesian Upland when lake ice phenology is used as an indicator of changes in air temperature in the area surrounding a water body. Knowledge of phenology of ice phenomena is useful not only for determining climate variability in the region over the past half-century. The results of such studies can be successfully used to predict the course of limnic processes (e.g., the variability of thermal and oxygen conditions, mixing processes)—this is a new aspect of limnological studies.
2. Materials and Methods
The Kozłowa Góra reservoir selected for study purposes is located in the southern part of Poland. It is part of the so-called Upper Silesian Anthropogenic Lake District—a concentration of anthropogenic water bodies which is the largest in Poland and among the largest in Europe [52]. The reservoir was constructed in the years 1933–1939 and its formation was the result of the Brynica River valley being impounded. The surface area of the reservoir at normal water level amounts to 5.5 km2 (with a maximum surface area of 5.9 km2), and its capacity is 13.1 hm3 (with a maximum capacity of 15.3 hm3). The average depth of the reservoir at normal water level is 2.4 m (with a maximum depth of 4.5 m), which makes this body of water a polymictic one [53].
The Kozłowa Góra reservoir offers one of the longest series of data on ice phenomena among the water bodies situated in the southern part of Poland. For this reservoir, measurements and observations concerning the average and maximum thicknesses of ice and the number of days with ice cover were first carried out in 1964, and thus the observational sequence until winter 2015 spanned more than 50 years (52 seasons) (Figure 1).
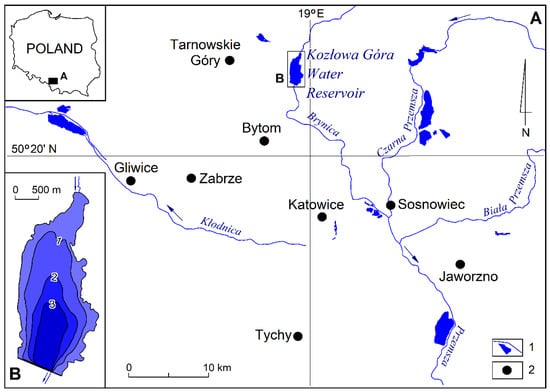
Figure 1.
Location of the Kozłowa Góra reservoir (A) together with its bathymetric plan (B): 1—water courses and water reservoirs, 2—major cities.
The study uses data on ice phenomena in the reservoir, which are regularly collected by the Katowice-based Górnośląskie Przedsiębiorstwo Wodociągów (GPW) water management company that manages the reservoir. The data series consists of 52 winter seasons and includes the dates of ice cover formation and breakup and the number of days with ice cover as well as average and maximum ice thicknesses.
The thickness of the ice was measured to an accuracy of 0.1 cm using an ice drill and a measuring staff or by direct measurement with a tape measure in places where the ice cover was freshly fractured. Measurements were conducted every day (at 6:00 GMT) during the entire reservoir operation period at measurement sites (primary and control sites) located near the dam, and when the ice was thin, from a nearby pier or directly from a boat. Occasionally, the thickness of the ice in other sectors of the reservoir was verified.
These data were set against average air temperatures in the winter half-year (from November to April and from December to March), which were obtained from the Institute of Meteorology and Water Management (IMGW) weather station located in Katowice [54]. For comparison purposes, the winter North Atlantic Oscillation indices were also used [55,56].
In order to assess changes in air temperature in the 1964–2015 winter seasons in relation to the average air temperature in winter seasons from the multiannual period studied, a fixed-base index was used. Winter season temperature in the first year of observation and average temperatures of winter seasons in selected periods, i.e., 1964–1990 and 1964–2015, were adopted as index baseline values. Similarly, fixed-base index values for maximum ice thickness in the Kozłowa Góra reservoir were calculated, taking the maximum thickness of the ice cover in the first year of observation and the average of maximum ice cover thicknesses in the 1964–1990 period and in the 1964–2015 period as base values. The index shows the number of times the average air temperature in a given winter season differs from the air temperature in the base period. The difference in ice cover thickness compared to baseline values is indicated in a similar manner. Moving averages for average atmospheric air temperatures in winter seasons in Katowice (periods: a—5 years, b—10 years, c—20 years) in the years from 1964 to 2015 were calculated as well.
In ice cover variability analysis, the so-called “degree-days of frost” indicator was used as an auxiliary tool. On the basis of data from the years 1999–2015, sums of negative air temperatures (so-called degree-days of frost) were calculated for the period preceding the formation of full ice cover.
The study used correlation analysis and regression models in order to determine changes in the parameters studied over time. Using the non-parametric Kolmogorov–Smirnov test, it was determined that the variables tested had a distribution similar to the normal one, and thus Pearson’s linear correlation coefficient was used for correlation analysis. The Pearson correlation coefficient was used to correlate NAO indices, average temperatures for the periods November–April and December–March with data regarding the ice phenology of the Kozłowa Góra reservoir as well as average temperatures from individual months with dates of formation and melting of the ice cover. The statistical significance of those correlations and of regression models was determined using Student’s t-test.
In order to compare the ice regime of the study reservoir and other lakes in the region, discriminant function analysis, principal components analysis (PCA), and canonical redundancy analysis (RDA) were applied [57]. Data concerning eighteen lakes located in northern Poland were taken from an article by Choiński et al. [9]. The analysis was based on data concerning the location of the reservoirs and their morphometric features: latitude and longitude, the altitude of the lake basin, the surface area of the lake, its volume capacity, and its average depth (independent variables) as well as data determining their ice regimes over several years: date of formation of ice cover (day of the year), date the ice cover melted (day of the year), ice cover duration (number of days), and maximum ice thickness (in cm). The study conducted by Choiński et al. [9] pertained to a very similar period. It included changes in the ice regime of the lakes in the period from 1960 to 2010 in connection with their location and morphometric features.
Discriminant function analysis was applied to isolate the differences between the Kozłowa Góra reservoir and other lakes. However, this type of analysis does not distinguish lakes as individual reservoirs but groups together all the lakes apart from Kozłowa Góra. Principal component analysis (PCA) was applied to determine the relationship between a group of independent and dependent variables between lakes. An analysis combining PCA with RDA was applied to determine the detailed directions of the largest differences between the reservoirs and the parameters measured. Redundancy analysis permits the examination of the relationships between two groups of variables and their directions. Independent variables were distinguished, including the morphometric features and the location of the study lakes, as well as dependent variables, including data describing the ice regimes of the lakes discussed. Quantitative independent and dependent variables are presented in the form of vectors. The direction of the vector corresponds to the direction of the greatest variability of the given variable, and its length indicates the dynamics of changes and the contribution of the given variable to the structure of the ordinates [58]. Calculations were performed using the STATISTICA.10 PL program [59].
3. Results
The earliest date on which the ice cover was formed was 5 November 1988 and the latest date was 4 February 1994, with the mean date over the multiannual analyzed study period falling on 22 December. The earliest date that the ice cover melted was 31 December 2008 and the latest date was 20 April 1996 with the average date falling on 16 March. The shortest ice cover duration was 10 days (2007), and the longest was 152 days (1996), averaging 93 days. The average thickness of the ice cover ranged from 2.0 cm (2007) to 28.8 cm (1964), with a mean value of 13.3 cm. The maximum thickness of the ice cover ranged from 5.0 cm (2007) to 42.0 cm (1965), averaging 23.0 cm over the multiannual study period.
The data on average air temperatures in individual months of the winter half-year (from November to April) were obtained from the IMGW weather station in Katowice, and these demonstrate that from 1964 to 2015, the temperatures exhibited significant interannual variability (Figure 2). To a certain extent, this variability can be explained by circulatory factors related to NAO activity. During the multiannual period studied, average air temperatures in the winter half-year ranged from −1.1 °C in 1996 to 5.2 °C in 2007, with the average for the entire period equal to 2.1 °C. The regression model developed, which was statistically significant at the level of p = 0.009, shows that the average temperature during the period in question increased from 1.6 °C in 1964 to 2.9 °C in 2015, i.e., around 0.03 °C per year on average (Figure 2).
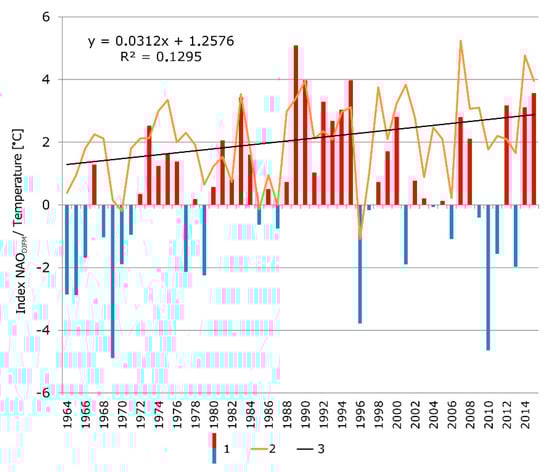
Figure 2.
Changes in average air temperature in the winter half-year (XI–IV) in the hydrological years 1964–2015 at the Katowice weather station and values of the winter NAODJFM index (D—December, J—January, F—February, M—March): 1—NAODJFM index, 2—average air temperature, 3—average air temperature trend.
Fixed-base index values and moving averages indicate the permanent occurrence of warmer winter seasons throughout the 1964–2015 period compared to baseline values, with only a few cases of winter seasons being colder (e.g., 1996). The values of the base air temperature index correspond to the analogous data obtained for maximum ice thickness in the reservoir for the same period, but the relationship is inversely proportional (Figure 3).
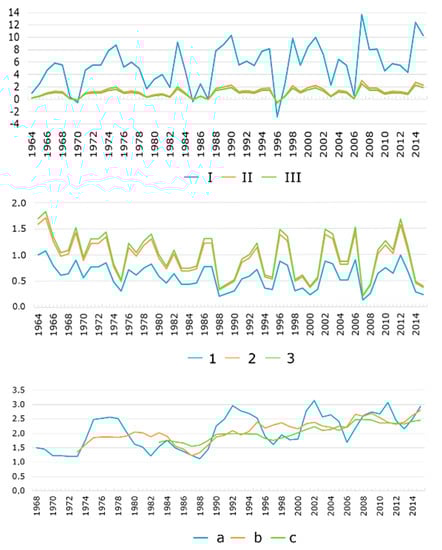
Figure 3.
Fixed-base index values for average atmospheric air temperatures in winter seasons in Katowice (baseline values: I—1964; II—1964–1990; III—1964–2015) and for maximum ice cover thickness in the Kozłowa Góra reservoir (baseline values: 1—1964; 2—1964–1990; 3—1964–2015) and moving averages for average atmospheric air temperatures in winter seasons in Katowice (periods: a—5 years, b—10 years, c—20 years) in the years from 1964 to 2015.
In the case of the Kozłowa Góra reservoir, in the years 1999–2015, sums of negative air temperatures for the period preceding the formation of full ice cover ranged from 20.0 degree-days of frost (in 2012, when the formation of full ice cover was preceded by a period of several dozen days of sub-zero temperatures) to 48.9 degrees of frost (in 2011, with a sudden and significant drop in temperature recorded before the formation of the ice cover), with the average and the median being 36.3 and 39.8 degree-days of frost, respectively. These data indicate a rapid freezing of the reservoir.
The increase in air temperatures translated into ice phenology in the reservoir studied. Regression analysis demonstrated that both the maximum and average thicknesses of the ice cover decreased in the multiannual period surveyed. In the first case, the decrease was from 28.2 cm to 18.0 cm, and in the second case, from 16.4 cm to 10.2 cm, i.e., 0.2 cm per year (10.2 cm over the entire period) and 0.1 cm per year (6.2 cm over the entire period), respectively. Both models were statistically significant (Figure 4). A statistically significant trend (p = 0.004) was also present with respect to the change in the number of days with ice cover during the 52 years studied. This parameter, in a similar manner to the previous two, indicated a decrease from 116 days at the beginning of the period analyzed to 71 days at the end. This translated into an average annual decrease in the number of days with ice cover of 0.86 days per year, which amounted to 45 days over the half-century in question (Figure 4). No such patterns were found in the case of the start and end dates of ice phenomena in the reservoir. Admittedly, according to the regression model ice cover tends to form later (R2 = 0.07; p = 0.058) and disappear earlier (R2 = 0.06; p = 0.080), but these trends are very weak and statistically insignificant.
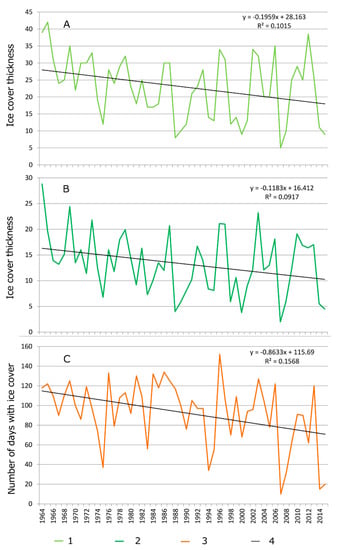
Figure 4.
Changes in the maximum (A) and average (B) ice cover thicknesses and the number of days with ice cover (C) for the Kozłowa Góra reservoir in the period from 1964 to 2015: 1—maximum ice cover thickness (cm), 2—average ice cover thickness (cm), 3—number of days with ice cover (days), 4—trends.
The correlation analysis of NAO indices with data specifying the phenology of the ice cover on the Kozłowa Góra reservoir shows that, in general, there is no correlation between NAO indices and the dates of ice cover formation on the reservoir (a rather weak correlation was only found in the case of comparing the lake freezing dates with the NAONDJ index). When comparing the NAO phases with the mean and maximum ice thickness and the date of complete melting of the ice on the reservoir, moderate or weak inverse relationships were found which were usually statistically significant. The highest correlations were found between the NAODJFM index and the features determining the ice regime of the reservoir. The NAODJF and NAOJFM indices correlated relatively well with the dates of ice melting on the reservoir and the thickness of the ice cover (Table 1).

Table 1.
Pearson’s correlation coefficients between the water body ice cover data and the NAO indices for the Kozłowa Góra water body.
The ice regime of the reservoir depends mainly on weather conditions, in particular on the course of the average air temperature during the winter months. The analysis of data from the multiannual period analyzed shows that the earliest date when ice cover formed on the basin was at the beginning of November and the latest it disappeared was at the end of April, and usually (on average) it formed at the end of December, and disappeared in mid-March. Therefore, two periods were selected to correlate the basic features of the ice regime: from November to April and from December to March. The analysis shows some weaker correlations between the average air temperature in both periods and the dates of formation of the ice cover. In the case of comparing the average air temperature from November–April and December–March with the features determining the ice regime of the reservoir, the correlations were strong (similar in strength) and statistically significant (Table 2).
Table 2.
Pearson’s correlation coefficients between water body ice cover data and meteorological data for the Kozłowa Góra water body.
In order to determine the effect of air temperature on the dates of formation and disappearance of the ice cover from the reservoir, an analysis was carried out of the correlations between the average temperatures in individual months from the first part of the winter (November–January) with the dates of ice cover formation and with average temperatures from the second part of the winter (February–April) with the dates when the ice cover melted. The analysis shows that the greatest correlations between the average air temperature and freezing dates occurred in the case of the average temperature for the months of November and December. When comparing the average temperature of the remaining months with the dates of total freezing of the reservoir, the effect was weaker (Table 3). Stronger correlations were found when the average temperature from the months of February and March was compared with the dates of complete melting of the ice cover. The strongest correlations were found for the period from February to March, after which they decreased in the subsequent months (March to April, April) (Table 4).
Table 3.
Pearson’s correlation coefficients between meteorological data and dates of ice cover formation for the Kozłowa Góra water body.
Table 4.
Pearson’s correlation coefficients between meteorological data and dates of ice cover break up for the Kozłowa Góra water body.
4. Discussion
Studies of ice phenomena occurring in multiannual periods in lakes and rivers have been among the problems most frequently researched in recent years. They fit into the broad spectrum of issues related to shifts in the natural environment which occur under the influence of contemporary climate change. A long time series of data concerning ice phenomena in lakes improves our ability to identify statistically significant trends and also enables us to determine the impact of large-scale climate variability (i.e., the effects of climate oscillations which take place between seasons, over several decades or within a single decade), while the spatial analysis of ice phenomena in lakes within a region provides a better understanding of the trends and variability of the thermal regime of water bodies in a given part of the world [60,61]. Historical data on ice phenomena in lakes may prove to be more reliable indicators of climate change than instrument measurements of air temperature owing to, among other things, the frequent heterogeneity of such measurements and changes in the locations of weather stations and observation posts as well as of observers who record air temperatures in the region in question [22,23]. They can also provide the only source of information on climate change in locations where no measurements are conducted [20].
Analyses of long series of measurements related to ice phenomena in lakes usually include ice cover formation and breakup dates, ice cover duration, and average and maximum ice thicknesses [3,4,8,9,21,23,24,26,28,32,33,37]. Researchers agree that the dates of ice phenomena disappearance are a much better indicator of contemporary climate change than the dates on which lakes freeze [3,24]. The formation of ice phenomena depends not only on air temperature, but also on the morphometric characteristics of the lake in question, primarily its average depth and the volume of water it retains [22]. On the other hand, the timing of ice phenomena disappearance depends mainly on external factors, among which the amount of solar radiation and the associated air temperature are of primary importance [12,28,30,62,63,64,65,66,67,68]. The rate of ice loss may also be affected by the lakes’ morphometric characteristics, the amount of heat accumulated in the water mass, the presence of snow on the ice, ice structure, and other factors.
Data on the patterns which govern ice phenomena over a long period come mostly from observations of lakes located in the temperate latitudes of the northern hemisphere [3,35,36]. In the case of several lakes, measurement series concerning ice phenology date back to the 19th century. Multiannual series of data most frequently show statistically significant trends towards the earlier disappearance of ice phenomena and, as a result, a shorter duration of ice phenomena in lakes, which results primarily from the increase in atmospheric air temperatures and from teleconnection effects [3,22,23,26,28,29,36,69].
The data series concerning ice phenomena in Polish lakes date back to the 1950s, and thus they are much shorter than in the case of the aforementioned examples of other lakes located in the temperate climatic zone. Most long series of observations concern lakes situated in the Polish lake districts in northern Poland [4,9,32,70]. The only exception is the Morskie Oko Lake in the Tatra Mountains, which, owing to its location in the high mountains, differs slightly from lowland lakes with respect to the patterns of occurrence of ice phenomena [8]. Systematic observations of ice phenomena in this lake date back to 1971 [8,34]. The analysis of data series related to ice phenomena in this lake from 1971–1995 and 1971–2010 demonstrates that ice phenomena tended to appear later and disappear earlier, and their duration decreased. The trend toward later freezing in this period amounted to 4.1 days per decade, and ice ablation occurred 4.5 days earlier per decade. Ice cover duration declined by 10 days per decade and maximum ice cover thickness decreased by 3 cm per decade [8].
Therefore, the study of changes in the ice regime of the Kozłowa Góra reservoir fills an information gap concerning ice phenomena in water bodies located in the southern part of Poland (apart from mountain areas). Comparing data regarding the location and morphometric features of the Kozłowa Góra reservoir with eighteen other lakes from northern Poland—studied by Choiński et al. [9]—it can be stated that this is the southernmost (1°27′ away from the southernmost Lake Sławskie) and the highest (its basin is located at an altitude of 278.6 m a.s.l., i.e., over 50 m higher than the basin of Lake Hańcza; the remaining lakes lie at altitudes from 0.1 m a.s.l. to 227.3 m a.s.l. with an average of 86.9 m a.s.l.). Taking into account the morphometric characteristics, the study reservoir is a small body of water. Its surface area (550.0 ha), average depth (2.4 m), and volume capacity (13.1 × 10⁶ m3) are among the lowest in the group examined. The surface area of other reservoirs ranges from 107.0 to 7020.0 ha with an average of 1387.8 ha, average depth—from 1.2 m to 38.7 m with an average of 8.4 m, and the water retention capacity from 6.4 × 10⁶ m3 to 141.6 × 10⁶ m3, averaging 63.2 × 10⁶ m3 [9].
Analyzing the ice regime of the study reservoir in comparison with the remaining 18 lakes, the Kozłowa Góra reservoir formed an ice cover on average on day 355 of the year in the multiannual study period, and for the remaining lakes, on average, on day 358. The complete melting of the cover took place on average on day 74 of the year, in the case of the remaining lakes, on average, on day 70. The average duration of ice cover on the Kozłowa Góra reservoir was 93 days, and in the case of the other lakes from northern Poland, 69 days. The maximum thickness of the ice cover on the study reservoir was 23 cm on average and 26 cm in the case of other lakes. Following the increase in air temperature in the winter half of the year, which on average amounted to 0.3 °C per decade at the stations in northern Poland and in Katowice, the ice cover formation was delayed (by 3.7 days per decade for the Kozłowa Góra reservoir and by 1.2 days per decade for the remaining lakes), the duration of ice covers was shortened (by 8.6 days per decade for the Kozłowa Góra reservoir and by 6.0 days per decade for the remaining lakes), the date of complete melting of the ice cover was accelerated (by 3.6 days per decade for the Kozłowa Góra reservoir and by 4.1 days per decade for the remaining lakes) and the maximum thickness of ice was reduced (by 2.0 cm per decade for the Kozłowa Góra reservoir and by 2.1 cm per decade for the remaining lakes).
The data quoted above show that ice appears earlier in the study area than on average in other lakes in northern Poland, which should be associated with its small volume capacity, reflected in the rapid cooling of water in the autumn. Ice melting, which depends solely on external factors—the course of air temperature and intensity of solar radiation—occurred later in the lakes located in the eastern part of Poland [9], which is connected with the increase of climatic continentalism towards the east (Figure 5). In the case of the Kozłowa Góra reservoir, the effect on the later—in comparison to lakes from northwestern Poland—melting of the ice cover, its longer duration, and higher maximum thickness may also be influenced by the increase of climatic continentalism (Figure 5).
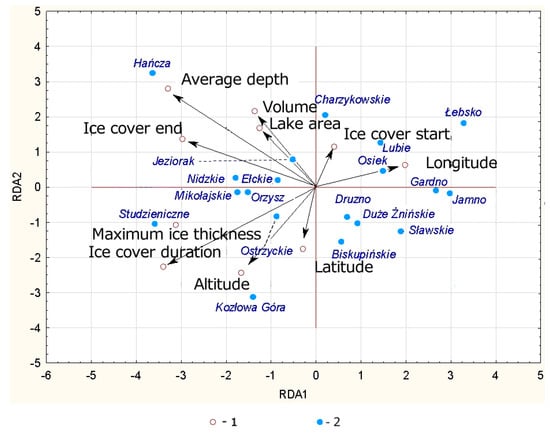
Figure 5.
RDA biplots illustrating relations between environmental variables and selected parameters of lake ice phenology for the Kozłowa Góra reservoir and lakes in northeastern Poland and northwestern Poland: 1—correlated variables, 2—lakes examined.
Statistical analyses showed that, in terms of the correlation of location, morphometric features, and ice regime, the Kozłowa Góra reservoir shows the greatest degree of difference when compared to other lakes located in the region in terms of the altitude and latitude of the basin as well as the length of ice cover. In terms of the ice regime, the Kozłowa Góra reservoir is more similar to lakes from northeastern Poland than to northwestern Poland (Figure 5). In response to the increase in the average winter air temperature in the region (by 0.3 °C per decade), the number of days with ice cover has declined (by 8.5 days per decade) and the maximum and average ice thicknesses decreased as well (by 1.6 cm and 1.2 cm per decade, respectively). The results obtained with respect to the ice regime of the reservoir examined are very similar to those presented by other authors who have studied ice phenomena in lakes located in this part of Europe.
A study conducted by Skowron [32] of 15 lakes situated in the Polish lake district area shows that in the period from 1956 to 2005, in response to an average increase in air temperature of 0.4–0.6 °C per decade, ice cover disappeared 5–6 days earlier each decade, ice cover duration decreased by 8–9 days per decade, and the maximum thickness declined by 2–4 cm per decade. The study also demonstrated the presence of statistically significant relationships between the main characteristics of ice phenomena in lakes, air temperatures, and winter NAO indices [32].
On the basis of the data collected by IMGW from 1961 to 2000, Marszelewski and Skowron [4] analyzed ice phenomena in six lakes located in northern Poland. Different trends were found with respect to the freezing of lakes, while earlier disappearance of ice from the water bodies was found in all cases (from six to eight days per decade). The research shows that the duration of ice phenomena decreased by 8–9 days per decade during the period surveyed while ice thickness decreased by 2.6 to 6 cm per decade [4].
Similar conclusions were reached by Choiński et al. [9] who stated that in 18 lakes within the area of the Weichselian glaciation, the duration of ice phenomena was reduced by 5.6 days per decade and ice thickness declined at the rate of 6.1 cm per decade from 1961 to 2010. On average, ice phenomena started 2.3 days later per decade, and the ice cover formed 1.2 days later per decade, with the ice cover breaking up 4.1 days earlier per decade and ice phenomena disappearing 4.3 days earlier per decade [9].
Borowiak and Barańczuk [39] attempted to determine the long-term variability of the durations of ice phenomena in the Raduńskie Górne Lake and their relationships to NAO phases. It was found that from 1961 to 2004, ice cover duration tended to decrease (by 9.8 days per decade) and the duration of ice phenomena declined as well (by 9.0 days per decade). The percentage share of ice cover duration in relation to the total duration of ice phenomena dropped by 6.3% per decade. Changes were also noted with respect to the start and end dates of individual stages of the ice regime, which amounted to 1.7 and 4.9 days per decade, respectively [39].
Sziwa and Jańczak [33] analyzed extreme values for lake ice thickness and the periods during which ice phenomena occurred from 1971 to 2005 in 40 lakes located in the lake district belt. Maximum ice thicknesses ranged from 30 to 75 cm, which resulted from the impact of external factors (geographical location, i.e., longitude) as well as from internal ones (lakebed morphometry and average lake depth). During the study period, both ice thickness and the number of days with ice cover exhibited downward trends. Ice thickness was correlated with ice cover duration (r > 0.8) as the thickest ice cover was present during long and cold winters [33].
Girjatowicz [27,71] examined the temporal and spatial variability of ice phenomena in four coastal lakes in Poland: Lakes Jamno, Gardno, Łebsko, and Bukowo. The study shows that ice phenomena in coastal lakes are also characterized by a downward trend, but not all trends were statistically significant. The decrease in the number of days with ice present (11 days per decade) and the dates of the last ice disappearing (eight days earlier per decade) were statistically significant, however [27,71]. Using correlation and regression analysis, an attempt was also made to determine the relationships between NAO phases and the parameters which describe ice phenomena in lakes. It was found that the positive NAO phase is associated with poorly developed ice phenomena in coastal lakes, while during the negative NAO phase, the duration of ice phenomena increases [71].
Research by Nowak et al. [72] concerning the variability and patterns of ice phenomena in four lakes situated in the Gniezno Lake District demonstrated that from 1976 to 2015, the number of days with ice cover decreased by 4.4 days per decade and the maximum ice thickness by 2 cm per decade (on average for all water bodies). The authors link these changes to an increase in average air temperatures in the winter half-year, which amounted to 0.37 °C per decade in the study period [72].
While studying the correlation between the winter NAO index and ice phenomena in 22 lakes located within the area of the Weichselian Glaciation, Wrzesiński et al. [73] concluded that in the period from 1961 to 2010, the winter NAO index had a considerable and statistically significant impact on the duration of ice phenomena and ice cover, their end dates and ice thickness. However, they did not find any relationship between the NAO on the one hand and the start dates of ice phenomena and the formation of ice covers on the other hand. A similar pattern was also found in the case of the Kozłowa Góra reservoir, where no connection was determined between the NAO and ice cover formation dates, while with respect to the other ice characteristics (ice cover duration, ice cover breakup date, and ice thickness), statistically significant relationships between those characteristics and the NAO index were found, although they were much less pronounced than in the case of the lakes located in northern Poland.
Observations concerning long-term changes in the ice regime of the Kozłowa Góra reservoir are well aligned with results of studies concerning changes in ice phenology in other lakes situated in the temperate climate zone in the northern hemisphere [51]. The water body studied is located in a zone where ice phenomena will not occur at all or will only occur sporadically with the further increase in the average annual air temperature (by about 2 °C).
5. Conclusions
The study has demonstrated that ice phenomena in the Kozłowa Góra reservoir have been strongly dependent on air temperature in the winter half-year, and moderately dependent on the phases of the North Atlantic Oscillation (NAO). The weakest correlations concerned air temperature in the winter months and ice cover appearance dates, which results from the fact that water body freezing dates depend not only on external (meteorological) factors, but also on internal ones (the morphometric characteristics of the water body in question). During the 52 winter seasons studied, there were weak but still statistically significant trends concerning the increase in air temperature in the region (by 0.3 °C per decade), the reduction in the number of days with ice cover (by 8.6 days per decade), and the decline in the maximum and average thicknesses of lake ice (by 2.0 cm and 1.2 cm per decade, respectively). The aforementioned data may point to contemporary climate change in the region.
Redundancy analysis (RDA) showed that the greatest differences between the study reservoir and the eighteen lakes located in northern Poland were related to the altitude of the basin, its latitude (independent variables), and the duration of ice cover (dependent variable). The largest effects on the ice regime of the study basin are exerted by its morphometric features and location resulting in impacts due to climatic continentalism, which are reflected in a fast freezing rate. The ice regime of the Kozłowa Góra reservoir is similar to that of lakes located in the north-eastern part of Poland.
The statistical research carried out demonstrates that correlation and regression analysis can be successfully adapted to predict ice thickness and ice cover duration, even in a warming climate. If the current trends continue, in the future, the duration of ice cover in the reservoir will be reduced to a few days in a year or no ice phenomena will be present within the reservoir at all. The absence of ice cover may result in the modification of thermal and water mixing conditions in the Kozłowa Góra reservoir. Under warming climate conditions, reverse stratification may disappear and the incidence of homothermal conditions (even in the winter season) may increase; mixing patterns may change as well from dimictic to polymictic. Therefore, the lack of ice cover may contribute to the elimination of oxygenation deficits, an increase in water oxygenation to normal saturation levels and the amount of oxygen in the reservoir becoming permanently uniform, which will create more favourable ecological conditions for aerobic organisms. Changes in the presence of ice cover in the Kozłowa Góra reservoir and the consequences of its development or disappearance can therefore be treated as benchmarks for studies carried out in other lakes in the region.
Author Contributions
M.S. and M.R. conceived and planned the study, conducted field work, and analyzed the results and wrote the paper. M.S. and M.R. collaborated on manuscript editing at all stages. All authors have read and agreed to the published version of the manuscript.
Funding
This research was funded by University of Silesia in Katowice (Poland)—Institute of Earth Sciences, project no. WNP/INoZ/2020_ZB25.
Acknowledgments
We would like to thank the linguistic team for correcting the English language of the manuscript. We would also like to thank Mariusz Topolski and Łukasz Potempka for consulting on the statistical methods applied.
Conflicts of Interest
The authors declare no competing interests.
References
- Choiński, A. Physical Limnology of Poland; Adam Mickiewicz University: Poznań, Poland, 2007. [Google Scholar]
- Leppäranta, M. Freezing of Lakes and the Evolution of their Ice Cover; Springer Science and Business Media: Berlin, Germany, 2015; pp. 1–301. [Google Scholar]
- Magnuson, J.J.; Robertson, D.M.; Benson, B.J.; Wynne, R.H.; Livingstone, D.M.; Arai, T.; Assel, R.A.; Barry, R.G.; Card, V.; Kuusisto, E.; et al. Historical Trends in Lake and River Ice Cover in the Northern Hemisphere. Science 2000, 289, 1743–1746. [Google Scholar] [CrossRef] [PubMed]
- Marszelewski, W.; Skowron, R. Ice cover as an indicator of winter air temperature changes: Case study of the Polish Lowland lakes. Hydrol. Sci. J. 2006, 51, 336–349. [Google Scholar] [CrossRef]
- Sporka, F.; Livingstone, D.M.; Stuchlik, E.; Turek, J.; Galas, J. Water temperatures and ice cover in lakes of the Tatra Mountains. Biologia 2006, 61, 77–90. [Google Scholar] [CrossRef]
- Brown, L.C.; Duguay, C.R. A comparison of simulated and measured lake ice thickness using a Shallow Water Ice Profiler. Hydrol. Process. 2011, 25, 2932–2941. [Google Scholar] [CrossRef]
- Karetnikov, S.G.; Naumenko, M.A. Lake Ladoga ice phenology: Mean condition and extremes during the last 65 years. Hydrol. Process. 2011, 25, 2859–2867. [Google Scholar] [CrossRef]
- Pociask-Karteczka, J.; Choiński, A. Recent trends in ice cover duration for Lake Morskie Oko (Tatra Mountains, East-Central Europe). Hydrol. Res. 2012, 43, 500–506. [Google Scholar] [CrossRef]
- Choiński, A.; Ptak, M.; Skowron, R.; Strzelczak, A. Changes in ice phenology on polish lakes from 1961 to 2010 related to location and morphometry. Limnologica 2015, 53, 42–49. [Google Scholar] [CrossRef]
- Hewitt, B.A.; Lopez, L.S.; Gaibisels, K.M.; Murdoch, A.D.; Higgins, S.N.; Magnuson, J.J.; Paterson, A.M.; Rusak, J.A.; Yao, H.; Sharma, S. Historical Trends, Drivers, and Future Projections of Ice Phenology in Small North Temperate Lakes in the Laurentian Great Lakes Region. Water 2018, 10, 70. [Google Scholar] [CrossRef]
- Lopez, L.S.; Hewitt, B.A.; Sharma, S. Reaching a breaking point: How is climate change influencing the timing of ice breakup in lakes across the northern hemisphere? Limnol. Oceanogr. 2019, 64, 2621–2631. [Google Scholar] [CrossRef]
- Gao, S.; Stefan, H.G. Multiple Linear Regression for Lake Ice and Lake Temperature Characteristics. J. Cold Reg. Eng. 1999, 13, 59–77. [Google Scholar] [CrossRef]
- Leppäranta, M.; Reinart, A.; Erm, A.; Arst, H.; Hussainov, M.; Sipelgas, L. Investigation of Ice and Water Properties and Under-ice Light Fields in Fresh and Brackish Water Bodies. Hydrol. Res. 2003, 34, 245–266. [Google Scholar] [CrossRef]
- Prowse, T.D.; Stephenson, R.L. The relationship between winter lake cover, radiation receipts and the oxygen deficit in temperate lakes. Atmos. Ocean 1986, 24, 386–403. [Google Scholar] [CrossRef]
- Shuter, B.J.; Finstad, A.G.; Helland, I.P.; Zweimuller, I.; Hölker, F. The role of winter phenology in shaping the ecology of freshwater fish and their sensitivities to climate change. Aquat. Sci. 2012, 74, 637–657. [Google Scholar] [CrossRef]
- Bryan, M.L.; Marcus, M.G. Physical Characteristics of Near-Shore Ice Ridges. Arctic 1972, 25, 182–192. [Google Scholar] [CrossRef]
- Cox, G.F. A preliminary investigation of thermal ice pressures. Cold Reg. Sci. Technol. 1984, 9, 221–229. [Google Scholar] [CrossRef]
- Banach, M. Morphodynamics of the Włocławek Reservoir coastal zone. Geogr. Stud. 1994, 161, 1–181. [Google Scholar]
- Fang, X.; Stefan, H.G. Potential climate warming effects on ice covers of small lakes in the contiguous U.S. Cold Reg. Sci. Technol. 1998, 27, 119–140. [Google Scholar] [CrossRef]
- Palecki, M.A.; Barry, R.G. Freeze-up and Break-up of Lakes as an Index of Temperature Changes during the Transition Seasons: A Case Study for Finland. J. Clim. Appl. Meteorol. 1986, 25, 893–902. [Google Scholar] [CrossRef]
- Kuusisto, E. An analysis of the longest ice observation series made on Finnish lakes. Aqua Fenn. 1987, 17, 123–132. [Google Scholar]
- Assel, R.A.; Robertson, D.M. Changes in winter air temperatures near Lake Michigan, 1851-1993, as determined from regional lake-ice records. Limnol. Oceanogr. 1995, 40, 165–176. [Google Scholar] [CrossRef]
- Livingstone, D.M. Break-up Dates of Alpine Lakes As Proxy Data for Local and Regional Mean Surface Air Temperatures. Clim. Chang. 1997, 37, 407–439. [Google Scholar] [CrossRef]
- Livingstone, D.M. Impact of Secular Climate Change on the Thermal Structure of a Large Temperate Central European Lake. Clim. Chang. 2003, 57, 205–225. [Google Scholar] [CrossRef]
- Kuusisto, E.; Elo, A.-R. Lake and river ice variables as climate indicators in Northern Europe. Verh. Int. Ver. Limnol. 2000, 27, 2761–2764. [Google Scholar] [CrossRef]
- Hodgkins, G.A.; James, I.C.; Huntington, T.G. Historical changes in lake ice-out dates as indicators of climate change in New England, 1850–2000. Int. J. Clim. 2002, 22, 1819–1827. [Google Scholar] [CrossRef]
- Girjatowicz, J.P. Ice conditions in coastal lakes of the southern Baltic Sea. Ann. Limnol. Int. J. Limnol. 2003, 39, 317–331. [Google Scholar] [CrossRef]
- Futter, M. Patterns and trends in Southern Ontario lake ice phenology. Environ. Monit. Assess. 2003, 88, 431–444. [Google Scholar] [CrossRef]
- Johnson, S.L.; Stefan, H.G. Indicators of Climate Warming in Minnesota: Lake ICE Covers and Snowmelt Runoff. Clim. Chang. 2006, 75, 421–453. [Google Scholar] [CrossRef]
- Jensen, O.P.; Benson, B.J.; Magnuson, J.J.; Card, V.M.; Futter, M.; Soranno, P.A.; Stewart, K.M. Spatial analysis of ice phenology trends across the Laurentian Great Lakes region during a recent warming period. Limnol. Oceanogr. 2007, 52, 2013–2026. [Google Scholar] [CrossRef]
- Adrian, R.; Reilly, C.M.O.; Zagarese, H.; Baines, S.B.; Hessen, D.O.; Keller, W.; Livingstone, D.M.; Sommaruga, R.; Straile, D.; Van Donk, E.; et al. Lakes as sentinels of climate change. Limnol. Oceanogr. 2009, 54, 2283–2297. [Google Scholar] [CrossRef]
- Skowron, R. Changeability of the Ice Cover on the Lakes of Northern Poland in the Light of Climatic Changes. Bull. Geogr. Phys. Geogr. Ser. 2009, 1, 103–123. [Google Scholar] [CrossRef]
- Sziwa, R.; Jańczak, J. Extreme values of ice cover thickness and ice phenomena duration on lakes in Poland. Limnol. Rev. 2009, 9, 111–119. [Google Scholar]
- Choiński, A.; Kolendowicz, L.; Pociask-Karteczka, J.; Sobkowiak, L. Changes in lake ice cover on the Morskie Oko lake in Poland (1971–2007). Adv. Clim. Chang. Res. 2010, 1, 71–75. [Google Scholar] [CrossRef]
- Weyhenmeyer, G.A.; Livingstone, D.M.; Meili, M.; Jensen, O.; Benson, B.; Magnuson, J.J. Large geographical differences in the sensitivity of ice-covered lakes and rivers in the Northern Hemisphere to temperature changes. Glob. Chang. Biol. 2010, 17, 268–275. [Google Scholar] [CrossRef]
- Benson, B.J.; Magnuson, J.J.; Jensen, O.P.; Card, V.M.; Hodgkins, G.; Korhonen, J.; Livingstone, D.M.; Stewart, K.M.; Weyhenmeyer, G.A.; Granin, N.G. Extreme events, trends, and variability in Northern Hemisphere lake-ice phenology (1855–2005). Clim. Chang. 2012, 112, 299–323. [Google Scholar] [CrossRef]
- Livingstone, D.M. Ice break-up on southern Lake Baikal and its relationship to local and regional air temperatures in Siberia and to the North Atlantic Oscillation. Limnol. Oceanogr. 1999, 44, 1486–1497. [Google Scholar] [CrossRef]
- Yoo, J.; D’Odorico, P. Trends and fluctuations in the dates of ice break-up of lakes and rivers in Northern Europe: The effect of the North Atlantic Oscillation. J. Hydrol. 2002, 268, 100–112. [Google Scholar] [CrossRef]
- Borowiak, D.; Barańczuk, J. Secular fluctuations of ice phenomena in Upper Radunia Lake, Kashubian Lakeland. Limnol. Rev. 2004, 4, 17–24. [Google Scholar]
- George, D.G. The Impact of the North Atlantic Oscillation on the development of ice on Lake Windermere. Clim. Chang. 2007, 81, 455–468. [Google Scholar] [CrossRef]
- Ghanbari, R.N.; Bravo, H.R.; Magnuson, J.J.; Hyzer, W.G.; Benson, B.J. Coherence between lake ice cover, local climate and teleconnections (Lake Mendota, Wisconsin). J. Hydrol. 2009, 374, 282–293. [Google Scholar] [CrossRef]
- Mudelsee, M. A proxy record of winter temperatures since 1836 from ice freeze-up/breakup in lake Näsijärvi, Finland. Clim. Dyn. 2011, 38, 1413–1420. [Google Scholar] [CrossRef]
- Sharma, S.; Magnuson, J.J. Oscillatory dynamics do not mask linear trends in the timing of ice breakup for Northern Hemispher lakes from 1855 to 2004. Clim. Chang. 2014, 124, 835–847. [Google Scholar] [CrossRef]
- Sánchez-López, G.; Hernández, A.; Pla-Rabes, S.; Toro, M.; Granados, I.; Sigro, J.; Trigo, R.; Rubio-Inglés, M.J.; Camarero, L.; Valero-Garcés, B.; et al. The effects of the NAO on the ice phenology of Spanish alpine lakes. Clim. Chang. 2015, 130, 101–113. [Google Scholar] [CrossRef]
- Sharma, S.; Magnuson, J.J.; Batt, R.D.; Winslow, L.A.; Korhonen, J.; Aono, Y. Direct observations of ice seasonality reveal changes in climate over the past 320–570 years. Sci. Rep. 2016, 6, 25061. [Google Scholar] [CrossRef] [PubMed]
- Ptak, M.; Tomczyk, A.M.; Wrzesiński, D.; Bednorz, E. Effect of teleconnection patterns on ice conditions in lakes in lowland Poland. Theor. Appl. Clim. 2019, 138, 1961–1969. [Google Scholar] [CrossRef]
- Anders, I.; Stagl, J.; Auer, I.; Pavlik, D. Climate Change in Central and Eastern Europe. In Advances in Global Change Research; Springer Science and Business Media: Berlin, Germany, 2013; Volume 58, pp. 17–30. [Google Scholar]
- Jones, P.D.; Osborn, T.J.; Briffa, K.R. The Evolution of Climate Over the Last Millennium. Science 2001, 292, 662–667. [Google Scholar] [CrossRef]
- Degirmendzic, J.; Rozuchowski, K.; Zmudzka, E. Changes of air temperature and precipitation in Poland in the period 1951–2000 and their relationship to atmospheric circulation. Int. J. Climatol. 2004, 24, 291–310. [Google Scholar] [CrossRef]
- Rzetala, M. Ice cover development in a small water body in an undrained depression. In International Multidiscyplinary Scientific Geoconferences, Proceedings of the 14th GeoConference on Water Resources, Albena, Bulgaria, 17–26 June 2014; STEF92 Technology Ltd.: Sofia, Bulgaria, 2014; pp. 397–404. [Google Scholar]
- Sharma, S.; Blagrave, K.; Magnuson, J.J.; O’Reilly, C.M.; Oliver, S.; Batt, R.D.; Magee, M.R.; Straile, D.; Weyhenmeyer, G.A.; Winslow, L.A.; et al. Widespread loss of lake ice around the Northern Hemisphere in a warming world. Nat. Clim. Chang. 2019, 9, 227–231. [Google Scholar] [CrossRef]
- Rzetala, M.; Jaguś, A. New lake district in Europe: Origin and hydrochemical characteristics. Water Environ. J. 2011, 26, 108–117. [Google Scholar] [CrossRef]
- Jagus, A.; Rzetala, M. Kozłowa Góra Water Reservoir—Functioning and Protection against a Background of Geographical and Limnological Characteristics; Polish Geographical Society—Hydrological Commission: Warsaw, Poland, 2003. [Google Scholar]
- Statistical Yearbook of Poland; Statistics Poland: Warsaw, Poland, 1964–2015.
- Hurrell, J.W. Decadal Trends in the North Atlantic Oscillation: Regional Temperatures and Precipitation. Science 1995, 269, 676–679. [Google Scholar] [CrossRef]
- Hurrell Station-Based DJFM NAO Index. Available online: https://climatedataguide.ucar.edu/sites/default/files/nao_station_djfm.txt (accessed on 20 December 2018).
- Kocherlakota, K.; Kocherlakota, S.; Krzanowski, W.J. Principles of Multivariate Analysis, A User’s Perspective; Oxford University Press: Oxford, UK, 2000; pp. 1–608. [Google Scholar]
- Misztal, M. On the Use of Redundancy Analysis to Study the Property Crime in Poland. Acta Univ. Lodz. Folia Oeconomica 2018, 6, 99–109. [Google Scholar] [CrossRef]
- StatSoft Inc. STATISTICA (Data Analysis Software System). Version 10. 2011. Available online: www.statsoft.com (accessed on 20 December 2018).
- Mishra, V.; Cherkauer, K.A.; Bowling, L.C.; Huber, M. Lake Ice phenology of small lakes: Impacts of climate variability in the Great Lakes region. Glob. Planet. Chang. 2011, 76, 166–185. [Google Scholar] [CrossRef]
- Mishra, V.; Cherkauer, K.A.; Bowling, L.C. Changing thermal dynamics of lakes in the Great Lakes region: Role of ice cover feedbacks. Glob. Planet. Chang. 2011, 75, 155–172. [Google Scholar] [CrossRef]
- Williams, G.P. Correlation of freezing and break up with weather conditions. Can. Geotech. J. 1965, 2, 313–326. [Google Scholar] [CrossRef]
- Stefan, H.G.; Fang, X. Simulated climate change effects on ice and snow covers on lakes in a temperate region. Cold Reg. Sci. Technol. 1997, 25, 137–152. [Google Scholar] [CrossRef]
- Assel, R.; Cronk, K.; Norton, D. Recent Trends in Laurentian Great Lakes Ice Cover. Clim. Chang. 2003, 57, 185–204. [Google Scholar] [CrossRef]
- Williams, G.; Layman, K.L.; Stefan, H.G. Dependence of lake ice covers on climatic, geographic and bathymetric variables. Cold Reg. Sci. Technol. 2004, 40, 145–164. [Google Scholar] [CrossRef]
- Leppäranta, M. Modelling the formation and decay of lake ice. In The Impact of Climate Change on European Lakes; George, G., Ed.; Springer: Dordrecht, The Netherland, 2009. [Google Scholar]
- Bernhardt, J.; Engelhardt, C.; Kirilin, G.; Matschullat, J. Lake ice phenology in Berlin-Brandenburg from 1947–2007: Observations and model hindcasts. Clim. Chang. 2011, 112, 791–817. [Google Scholar] [CrossRef]
- Kirilin, G.; Leppäranta, M.; Terzhevik, A.; Granin, N.; Bernhardt, J.; Engelhardt, C.; Efremova, T.; Golosov, S.; Palshin, N.; Sherstyankin, P.; et al. Physics of seasonally ice-covered lakes: A review. Aquat. Sci. 2012, 74, 659–682. [Google Scholar] [CrossRef]
- Korhonen, J. Long-term changes in lake ice cover in Finland. Hydrol. Res. 2006, 37, 347–363. [Google Scholar] [CrossRef]
- Barańczuk, J.; Bajkiewicz-Grabowska, E.; Barańczuk, K.; Staszek, W. The ice regime of Lake Raduńskie Górne (Kashubian Lakeland, Northern Poland). Limnol. Rev. 2017, 17, 61–70. [Google Scholar] [CrossRef]
- Girjatowicz, J.P. The influence of the North Atlantic Oscillation on ice conditions in coastal lakes of the Southern Baltic Sea. Ann. Limnol. Int. J. Limnol. 2003, 39, 71–80. [Google Scholar] [CrossRef][Green Version]
- Nowak, B.; Nowak, D.; Ptak, M. Variability and course of occurrence of ice cover on selected lakes of the Gnieźnieńskie Lakeland (Central Poland) in the period 1976–2015. In Proceedings of the E3S Web of Conferences 44, 10th Conference on Interdisciplinary Problems in Environmental Protection and Engineering EKO-DOK, Polanica-Zdrój, Poland, 16–18 April 2018. [Google Scholar]
- Wrzesiński, D.; Choiński, A.; Ptak, M.; Skowron, R. Effect of the North Atlantic Oscillation on the Pattern of Lake Ice Phenology in Poland. Acta Geophys. 2015, 63, 1664–1684. [Google Scholar] [CrossRef]


© 2020 by the authors. Licensee MDPI, Basel, Switzerland. This article is an open access article distributed under the terms and conditions of the Creative Commons Attribution (CC BY) license (http://creativecommons.org/licenses/by/4.0/).