Decision-Making of LID-BMPs for Adaptive Water Management at the Boise River Watershed in a Changing Global Environment


Abstract
:1. Introduction
2. Materials and Methods
2.1. Study Area
2.2. Hydrological Simulation Program–Fortran (HSPF) Model
2.3. Data Used
2.3.1. Meteorological Data
2.3.2. Hydrological Data
2.3.3. Geospatial Data
2.3.4. Global Circulation Model (GCM) and Land Use Land Cover (LULC) Data
2.4. BEO-Parameter ESTimation (BEOPEST)
2.5. Watershed Management Tool (WMT)
3. Results
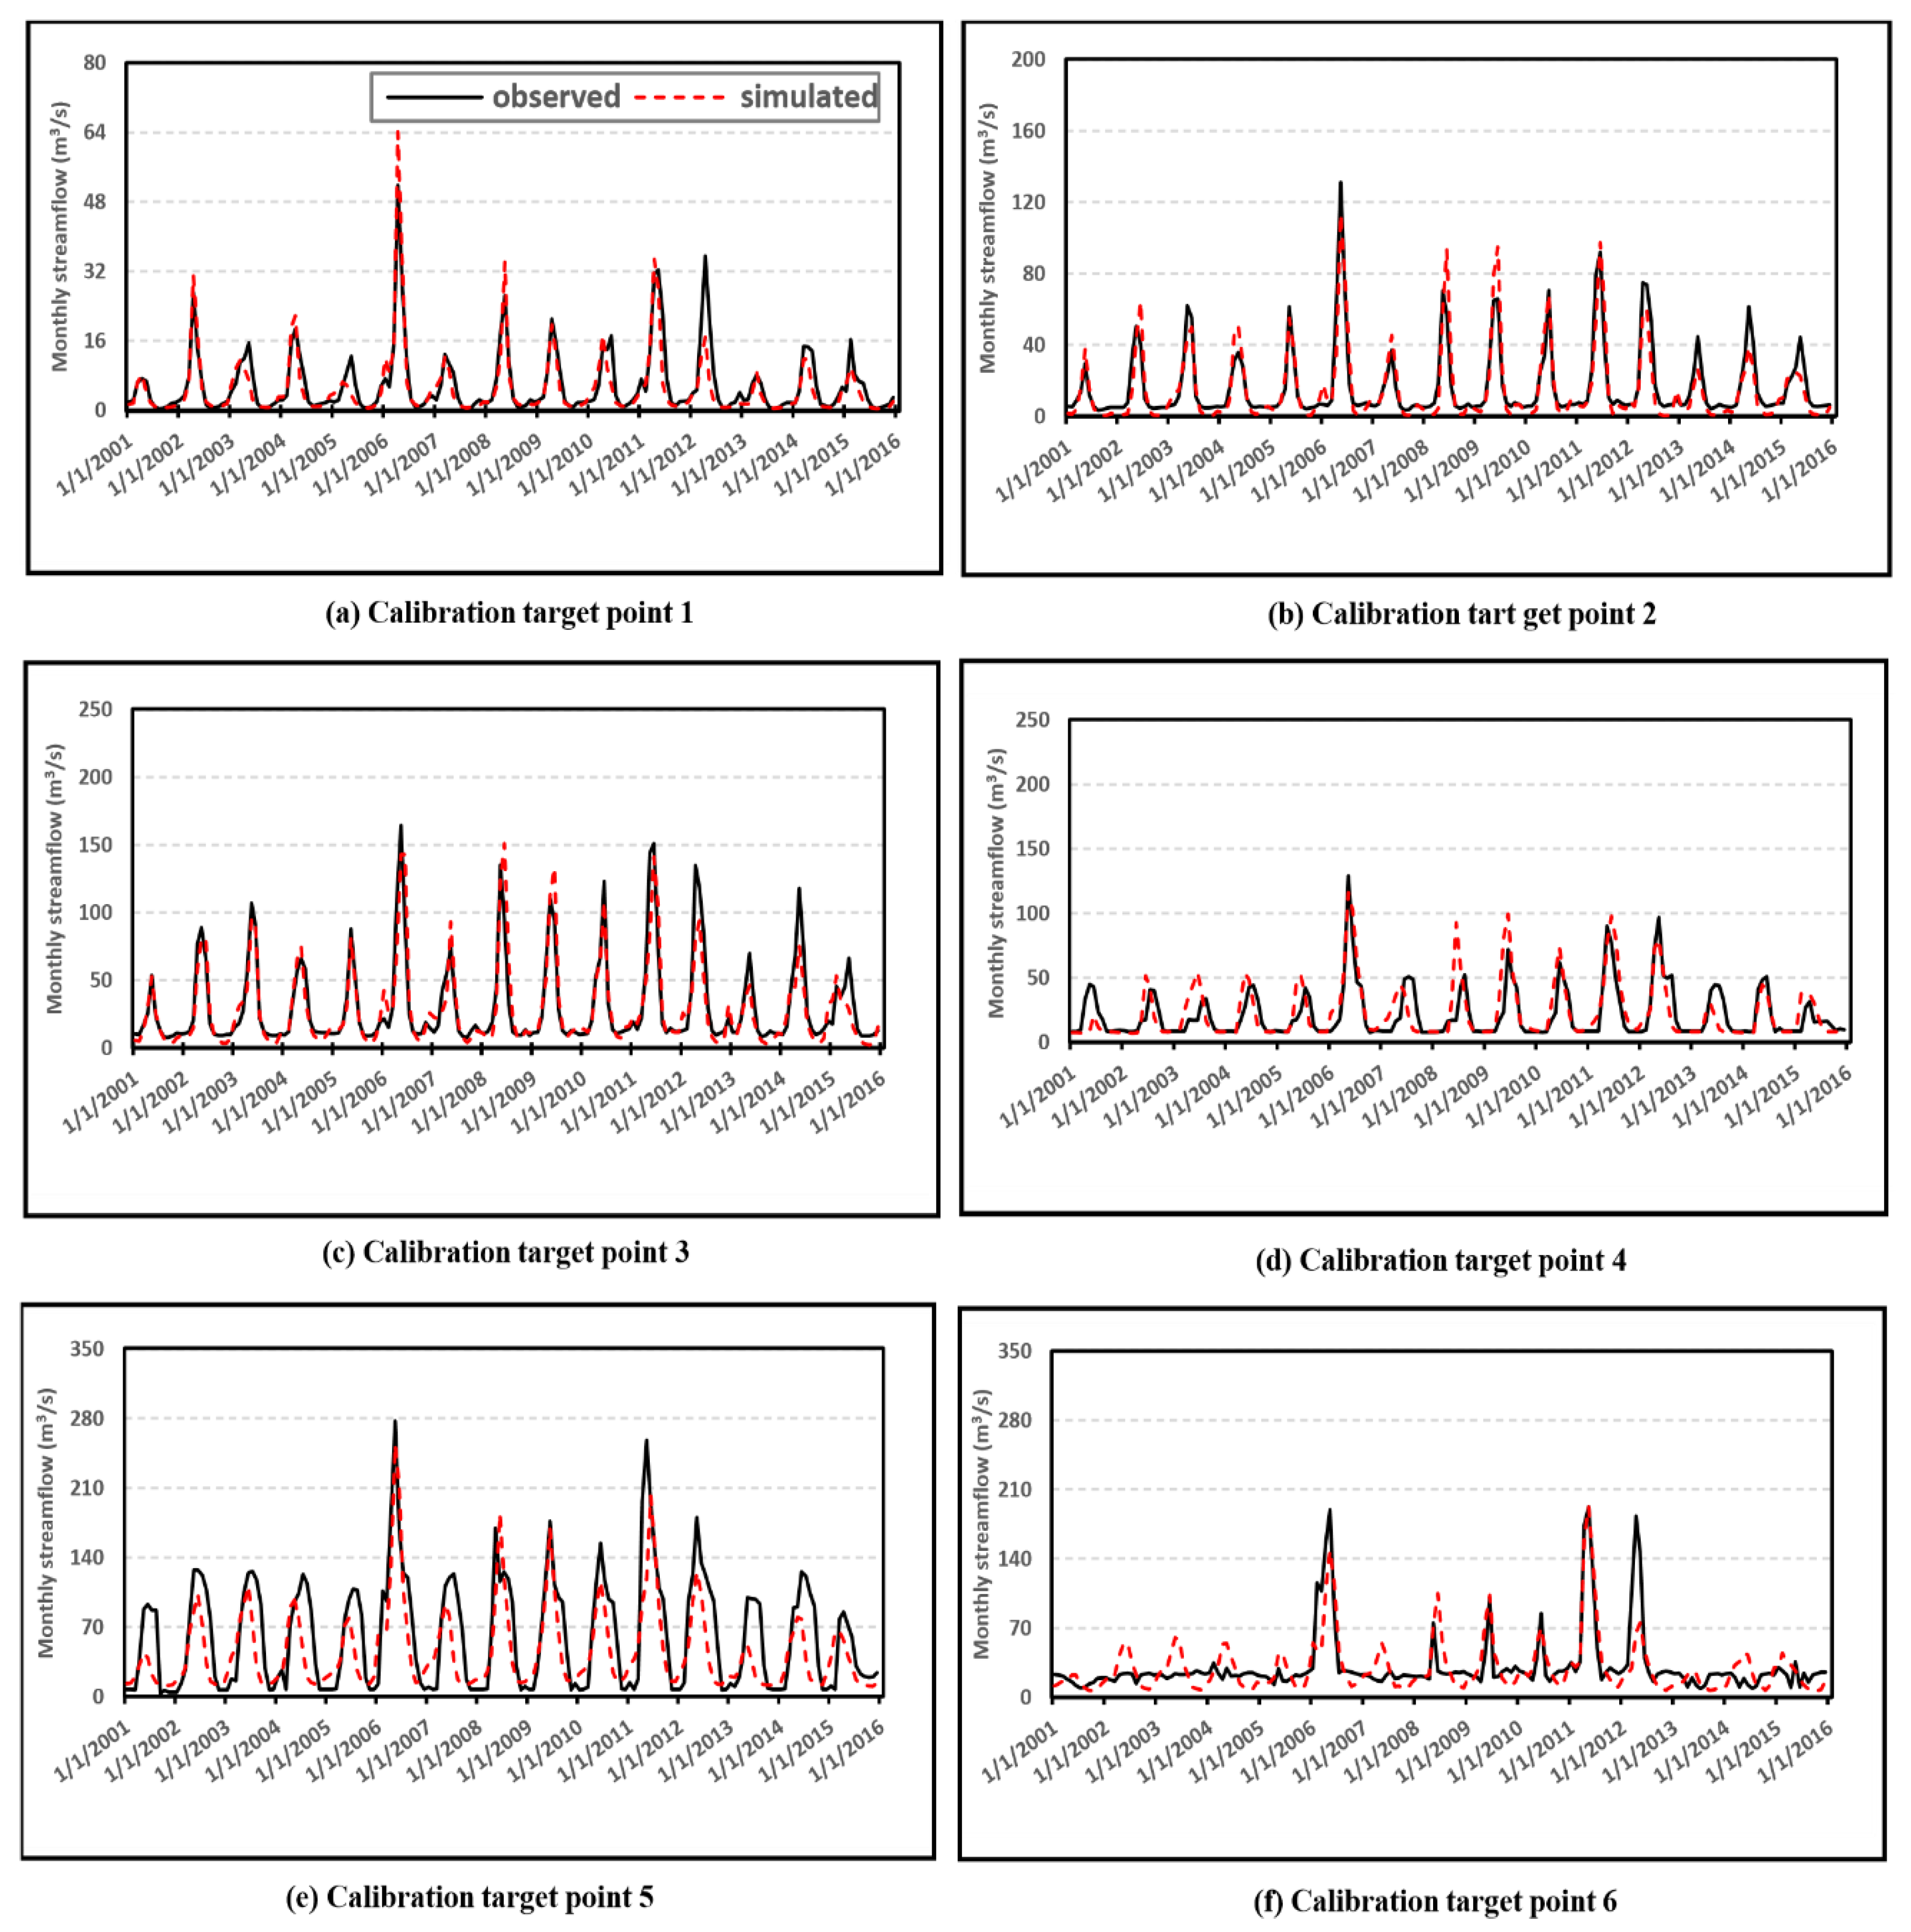
3.1. HSPF Calibration
3.2. Future Climate and Streamflow Variations
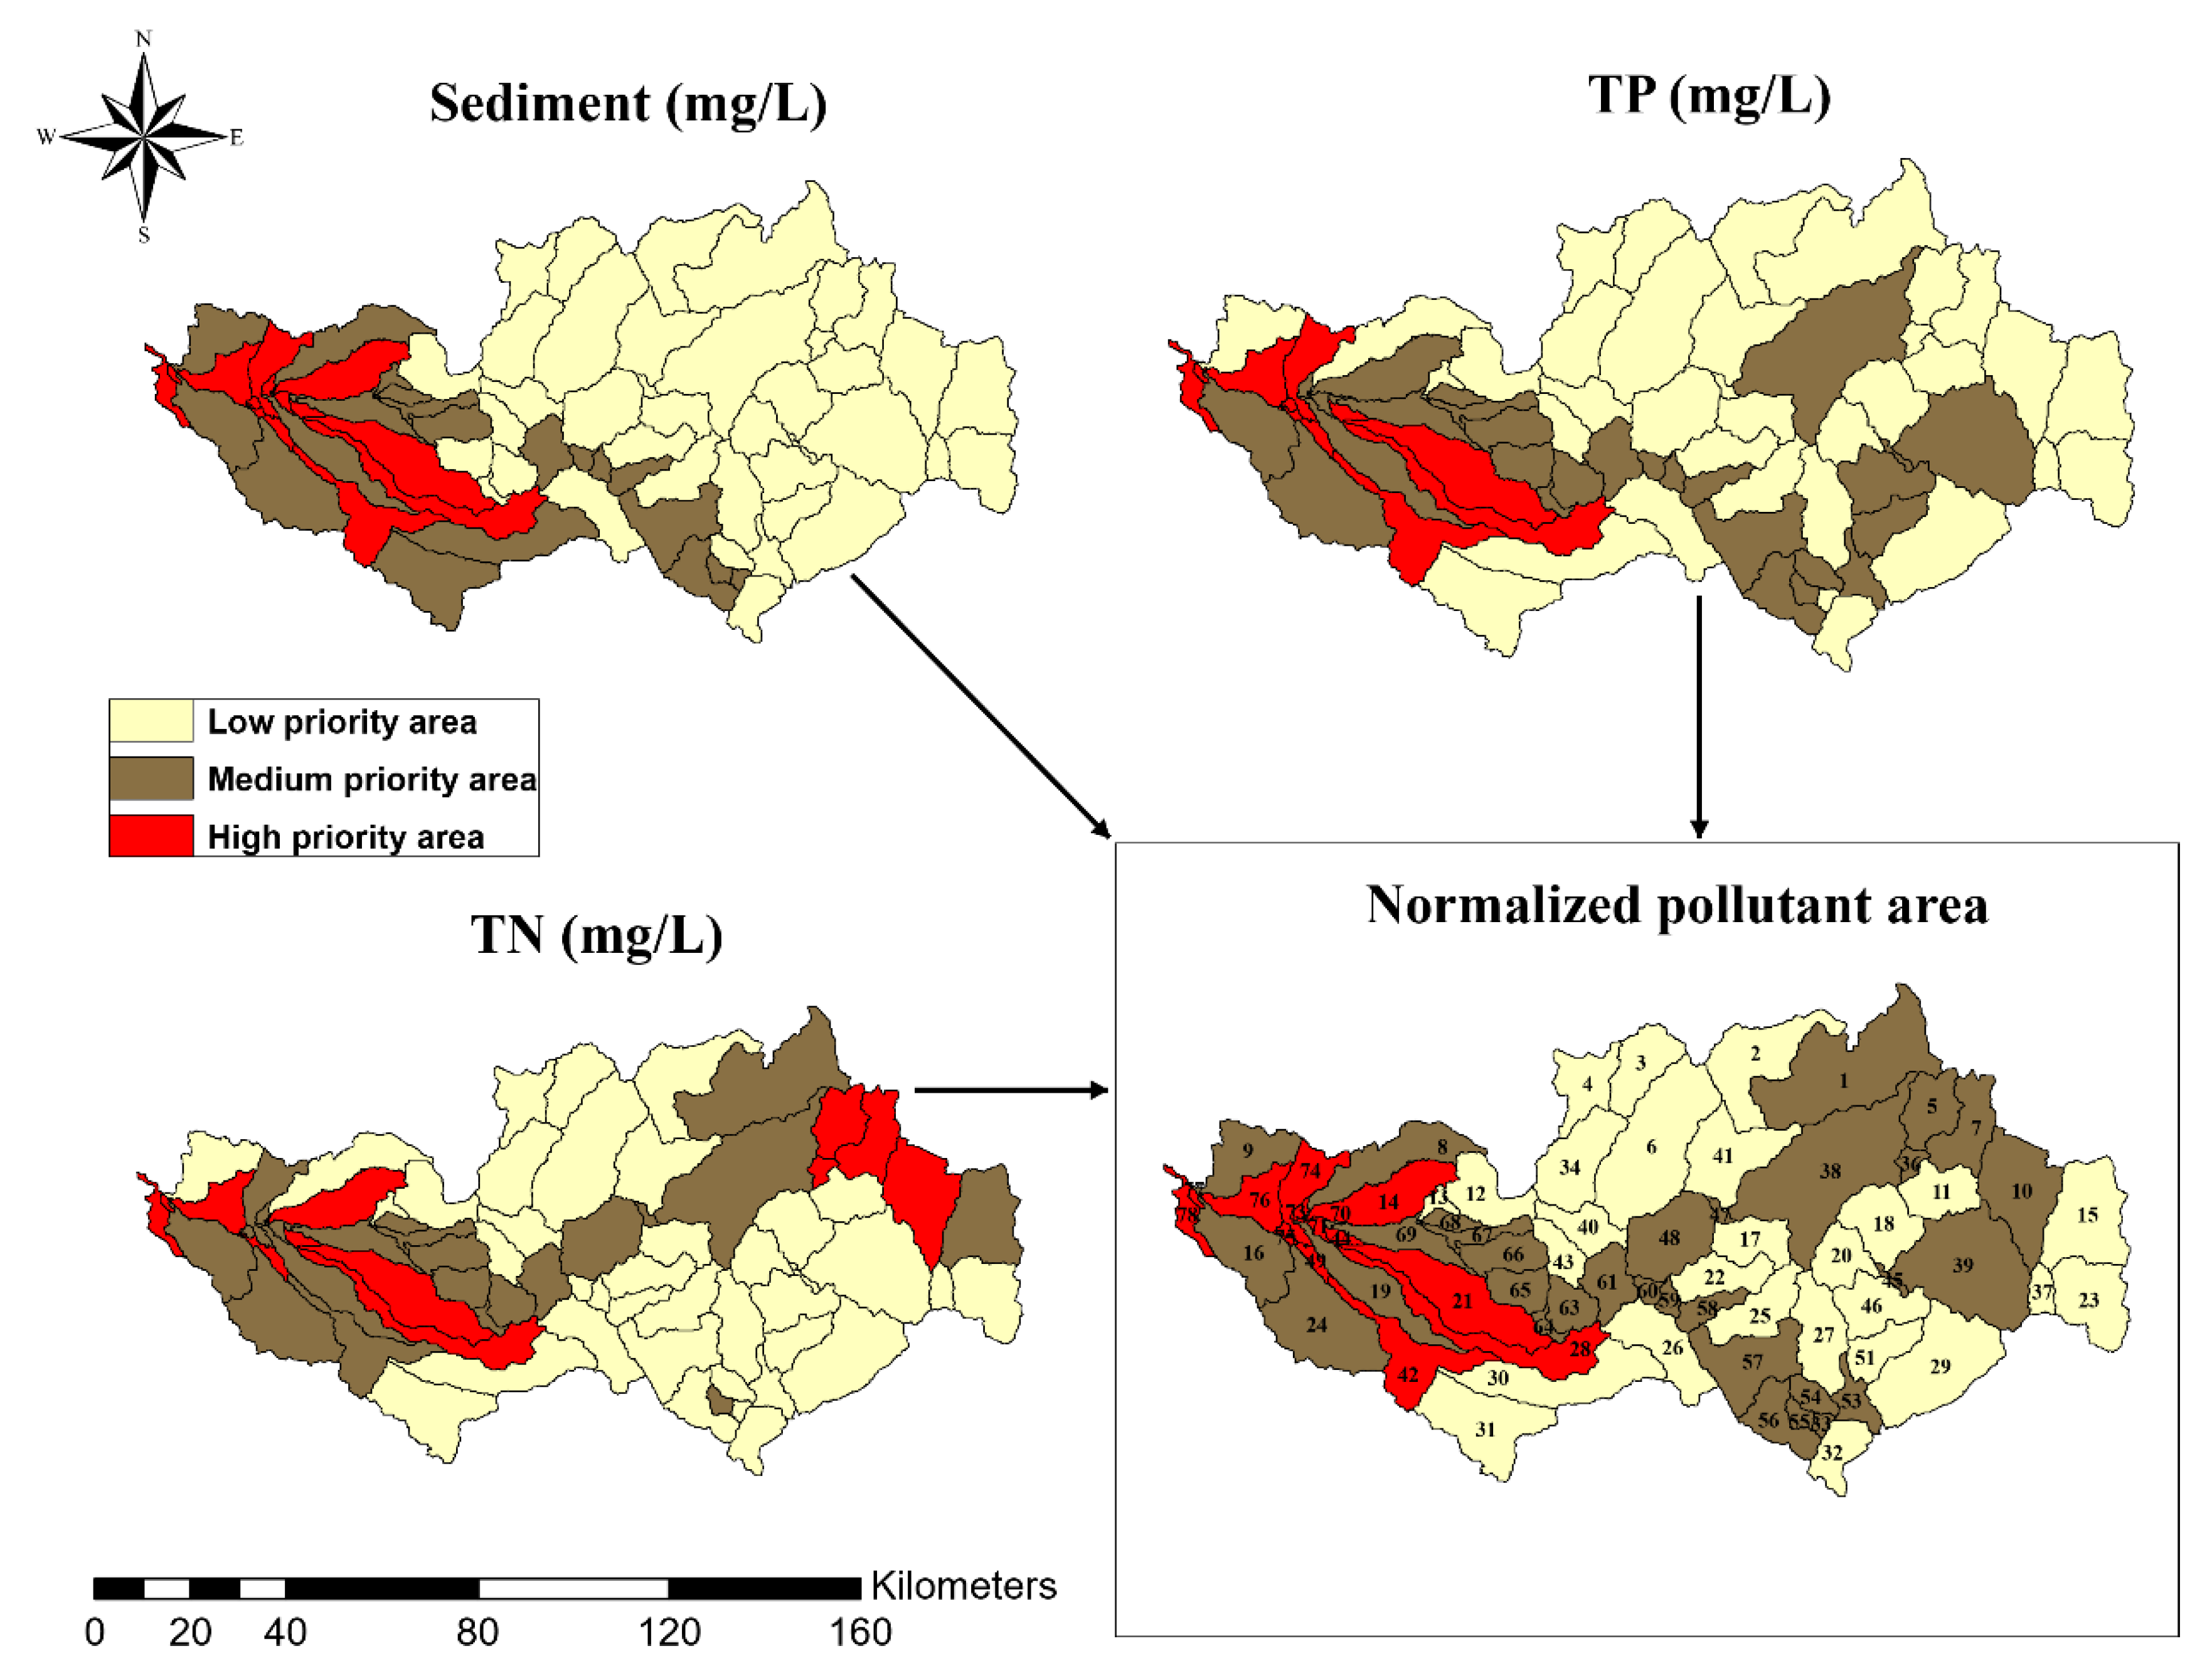
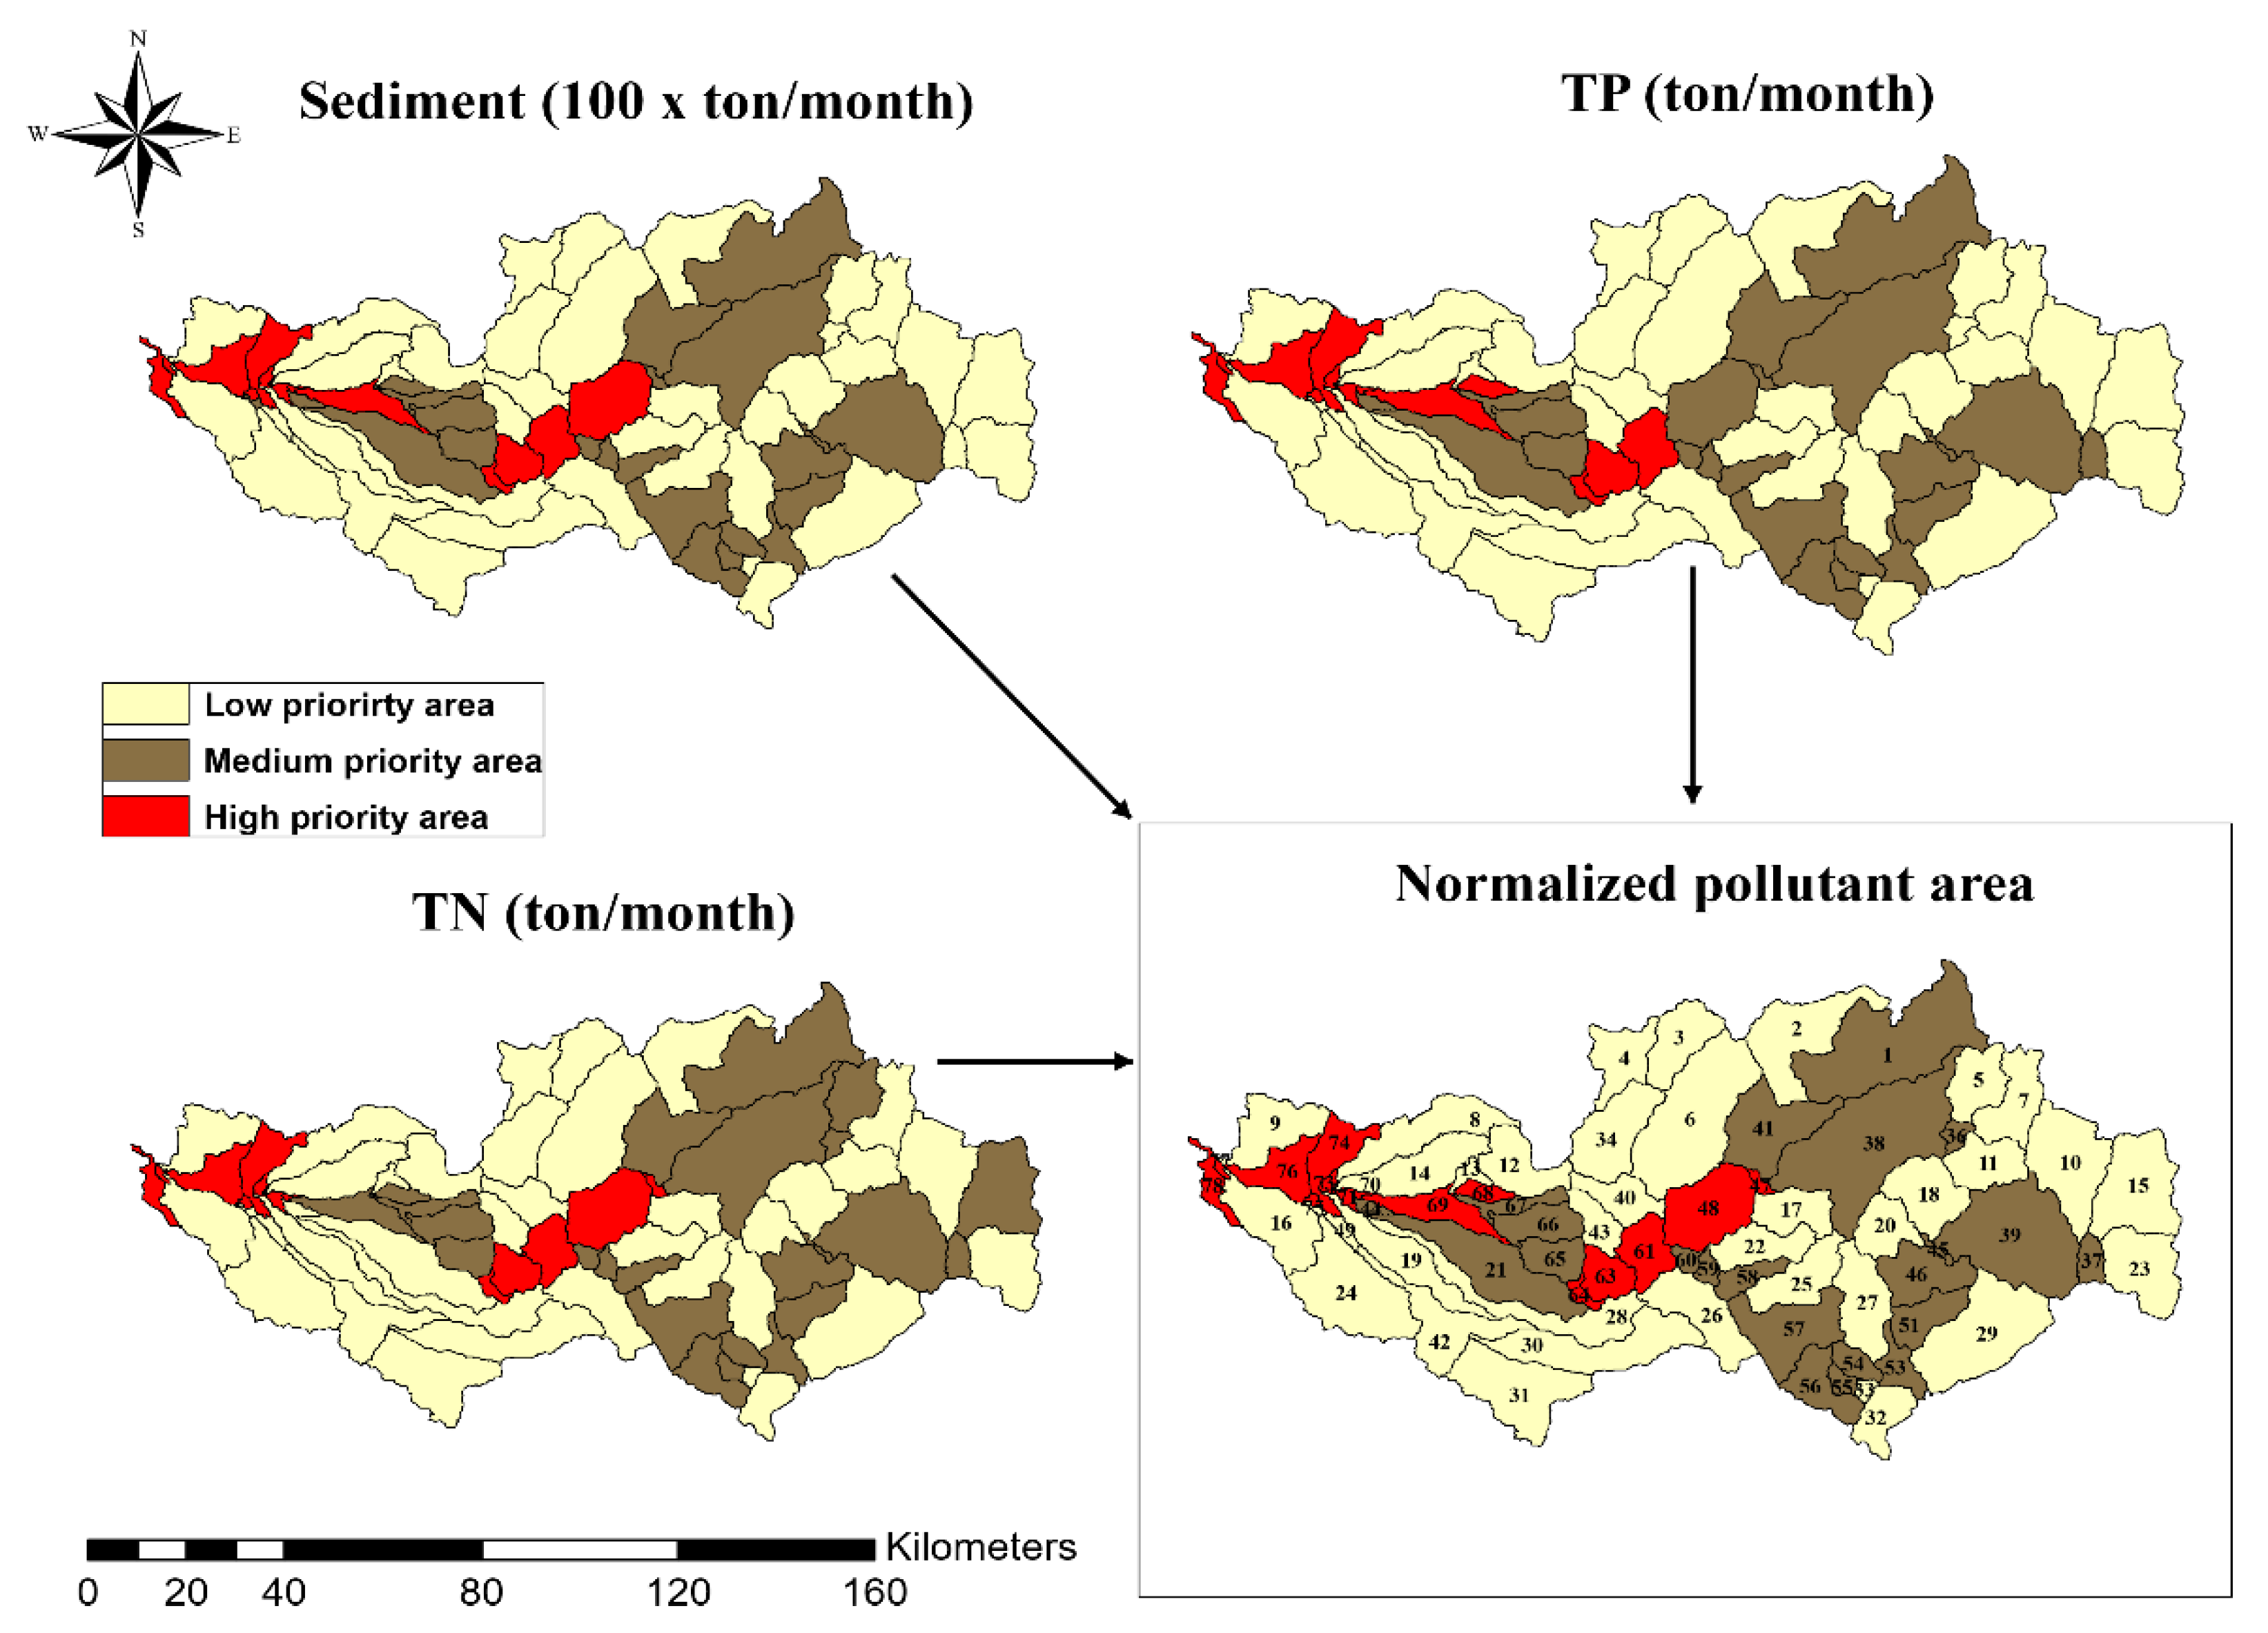
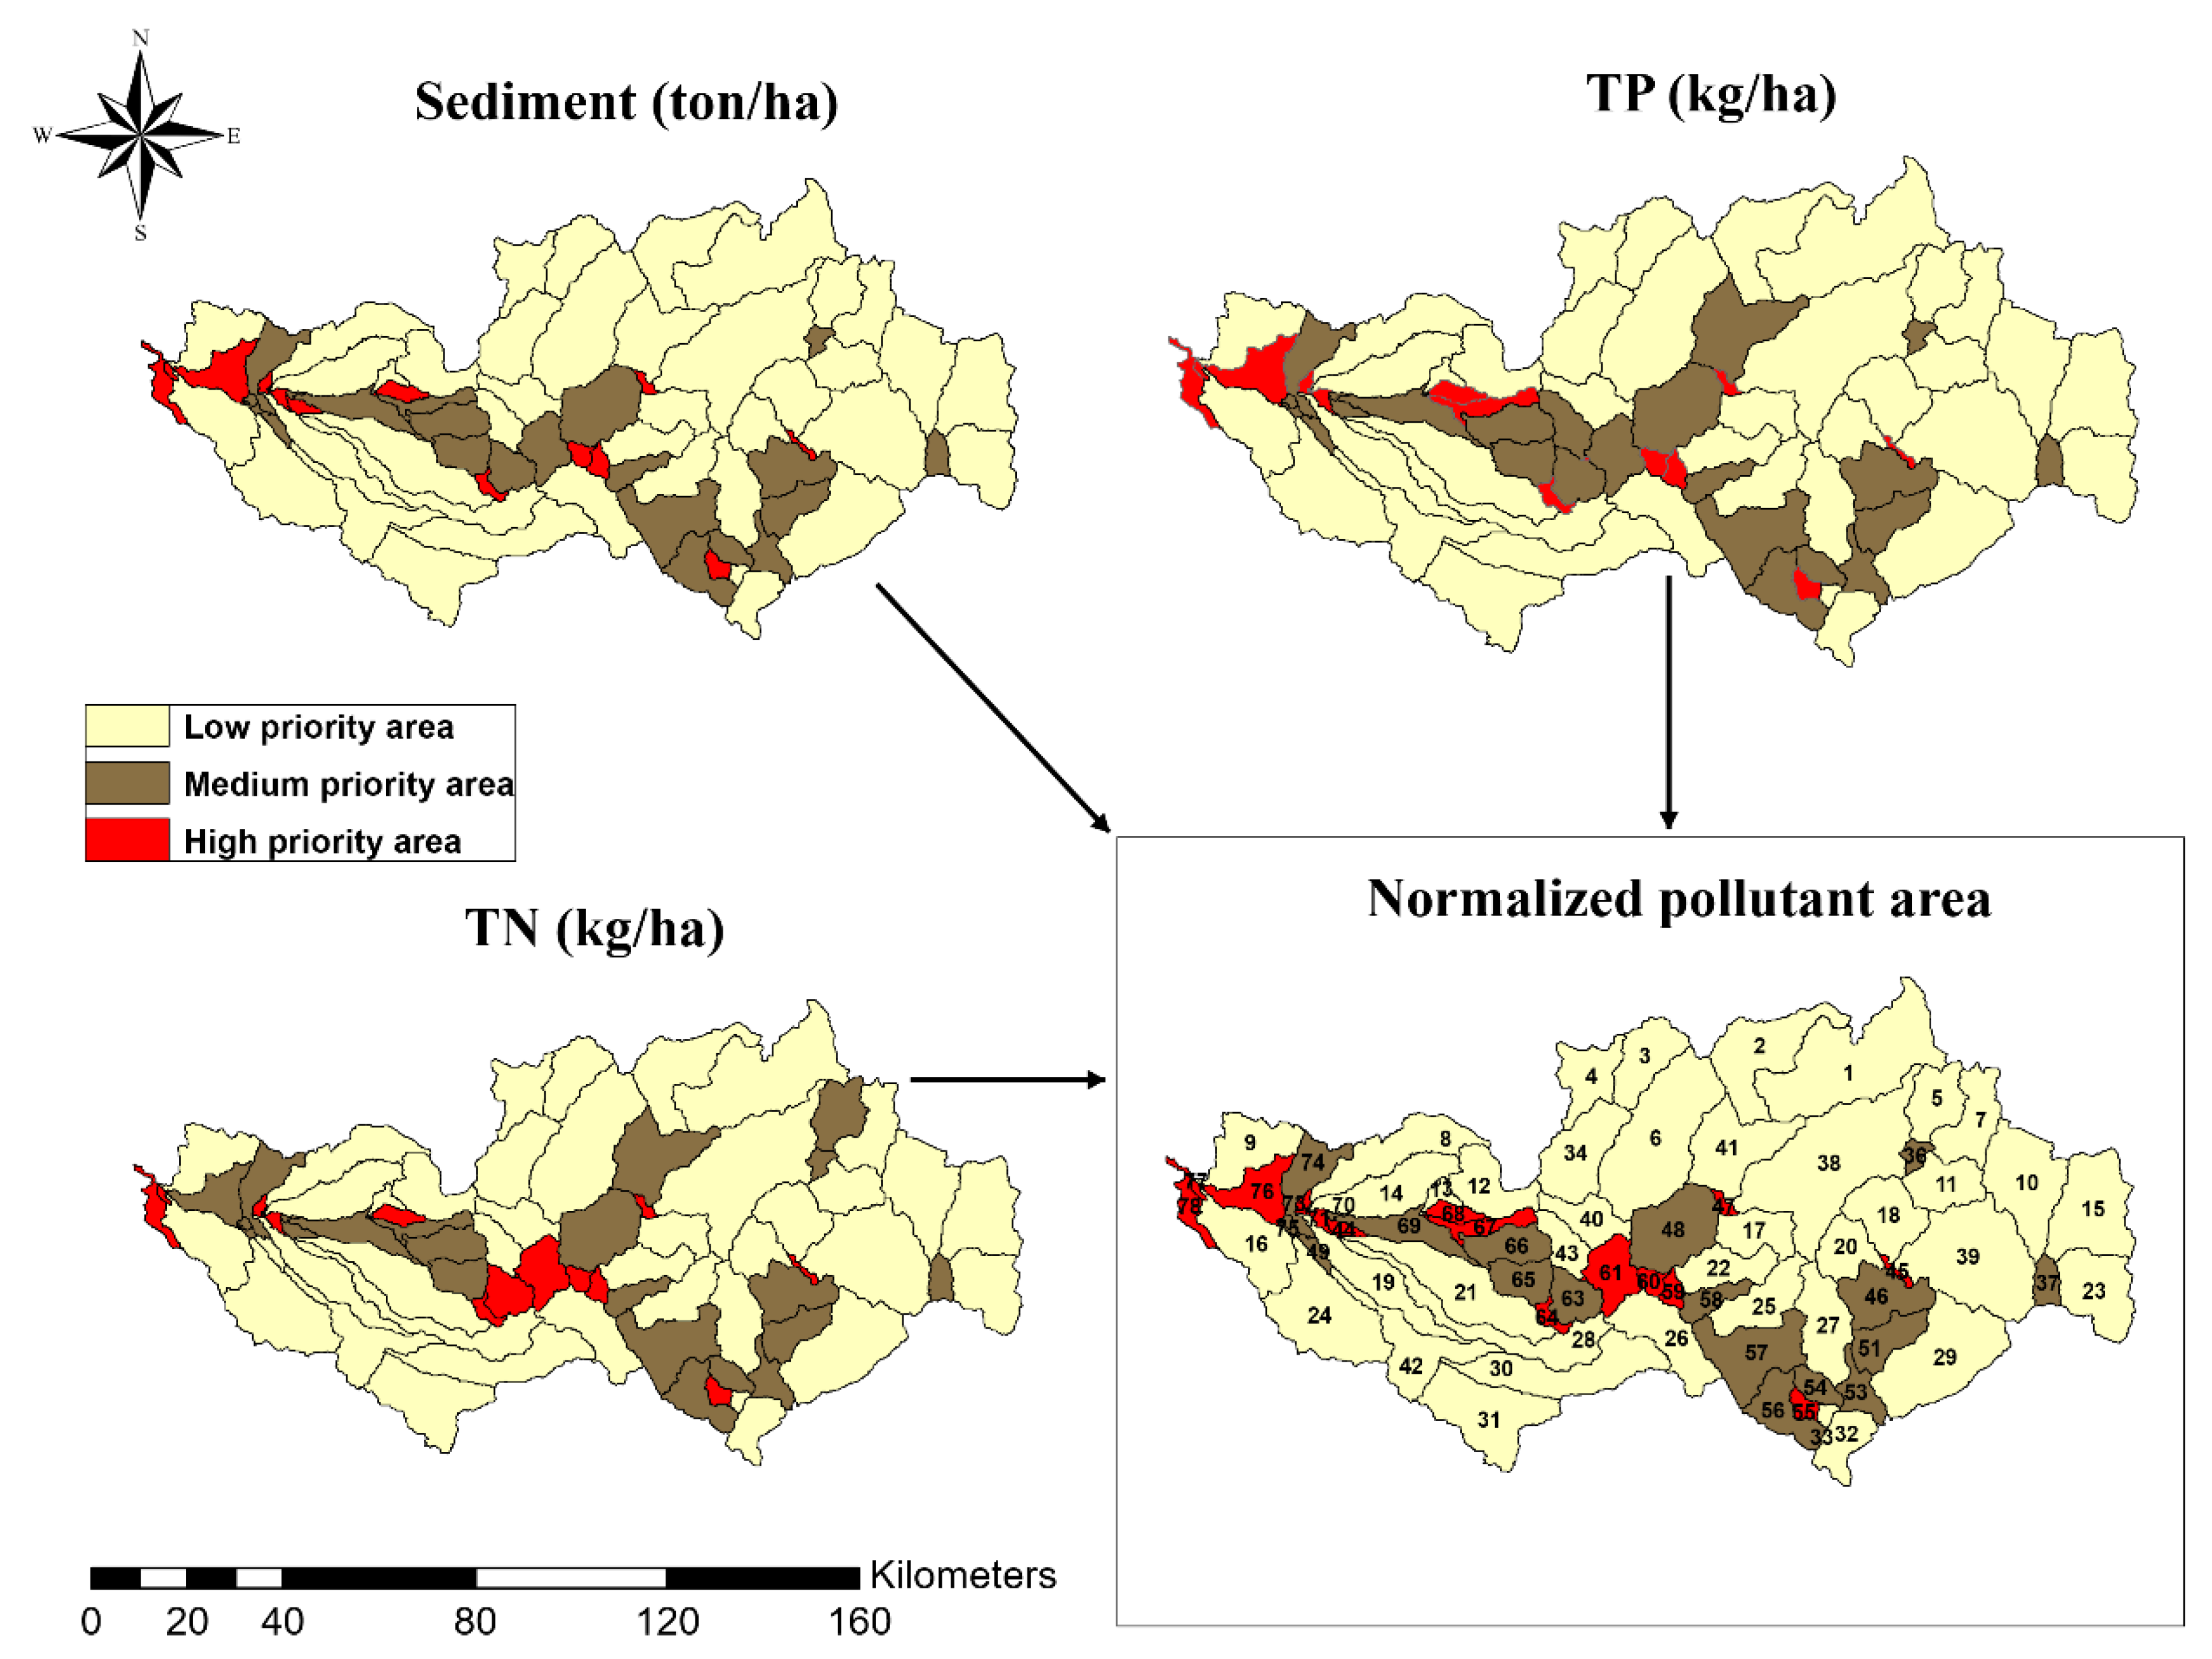
3.3. The Identified Critical Hotspots (CHSs)
3.4. The Suitable LID/BMP Choice for CHSs
3.5. Evaluation of LID/BMP Choice
4. Summary and Conclusions
Author Contributions
Funding
Conflicts of Interest
Appendix A
References
- US.EPA (United State Environmental Protection Agency). National Water Quality Inventory: Report to Congress: 2004 Reporting Cycle; US Environmental Protection Agency, Office of Water: Washington DC, USA, 2009.
- TNRCC. State of Texas 1998 Clean Water Act Section 303 (d) List and Schedule for Development of Total Maximum Daily Loads; Texas Natural Resource Conservation Commission(TNRCC): Austin, TX, USA, 1998.
- Dodds, W.K.; Bouska, W.W.; Eitzmann, J.L.; Pilger, T.J.; Pitts, K.L.; Riley, A.J.; Schloesser, J.T.; Thornbrugh, D.J.; Bouska, K. Eutrophication of U.S. Freshwaters: Analysis of Potential Economic Damages. Environ. Sci. Technol. 2009, 43, 12–19. [Google Scholar] [CrossRef] [PubMed] [Green Version]
- IPCC (Intergovernmental Panel on Climate Change). The Physical Science Basis: Contribution of Working Group I to the Fourth Assessment Report of the Intergovernmental Panel on Climate Change; Cambridge University Press: Cambridge, UK, 2007; pp. 337–383. [Google Scholar]
- IPCC (Intergovernmental Panel on Climate Change). Climate Change 2013: The Physical Science Basis. Contribution of Working Group I to the Fifth Assessment Report of the Intergovernmental Panel on Climate Change; Cambridge University Press: Cambridge, UK, 2013. [Google Scholar]
- Giri, S.; Nejadhashemi, A.P.; Woznicki, S.A. Evaluation of targeting methods for implementation of best management practices in the Saginaw River Watershed. J. Environ. Manag. 2012, 103, 24–40. [Google Scholar] [CrossRef] [PubMed]
- McKinney, D.C.; Cai, X.; Rosegrant, M.W.; Ringler, C.; Scott, C.A. Modeling Water Resources Management at the Basin Level: Review and Future Directions; International Water Management Institute (IWMI): Colombo, Sri Lanka, 1999; Volume ix, 59p. [Google Scholar] [CrossRef]
- Kaykhosravi, S.; Abogadil, K.; Khan, U.T.; Jadidi, M.A. The Low-Impact Development Demand Index: A New Approach to Identifying Locations for LID. Water 2019, 11, 2341. [Google Scholar] [CrossRef] [Green Version]
- Kolanuvada, S.R.; Ponpandian, K.L.; Sankar, S. Multi-criteria-based approach for optimal siting of artificial recharge structures through hydrological modeling. Arab. J. Geosci. 2019, 12, 190. [Google Scholar] [CrossRef]
- Ghebremichael, L.T.; Veith, T.L.; Watzin, M.C. Determination of Critical Source Areas for Phosphorus Loss: Lake Champlain Basin, Vermont. Trans. ASABE 2010, 53, 1595–1604. [Google Scholar] [CrossRef]
- Panagopoulos, Y.; Makropoulos, C.; Mimikou, M. Decision support for diffuse pollution management. Environ. Model. Softw. 2012, 30, 57–70. [Google Scholar] [CrossRef]
- Cai, X.; McKinney, D.C.; Lasdon, L. A framework for sustainability analysis in water resources management and application to the Syr Darya Basin. Water Resour. Res. 2002, 38, 21-1–21-14. [Google Scholar] [CrossRef]
- Li, F.; Liu, Y.; Engel, B.A.; Chen, J.; Sun, H. Green infrastructure practices simulation of the impacts of land use on surface runoff: Case study in Ecorse River watershed, Michigan. J. Environ. Manag. 2019, 233, 603–611. [Google Scholar] [CrossRef]
- Raei, E.; Alizadeh, M.R.; Nikoo, M.R.; Adamowski, J. Multi-objective decision-making for green infrastructure planning (LID-BMPs) in urban storm water management under uncertainty. J. Hydrol. 2019, 579, 124091. [Google Scholar] [CrossRef]
- Ryu, J.H.; Palmer, R.N.; Jeong, S.-M.; Lee, J.H.; Kim, Y.-O. Sustainable Water Resources Management in a Conflict Resolution Framework. JAWRA J. Am. Water Resour. Assoc. 2009, 45, 485–499. [Google Scholar] [CrossRef]
- Roy, B. A multicriteria analysis for trichotomic segmentation problems. Mult. Criteria Anal. Oper. Methods 1981, 8, 245–257. [Google Scholar]
- Calizaya, A.; Meixner, O.; Bengtsson, L.; Berndtsson, R. Multi-criteria Decision Analysis (MCDA) for Integrated Water Resources Management (IWRM) in the Lake Poopo Basin, Bolivia. Water Resour. Manag. 2010, 24, 2267–2289. [Google Scholar] [CrossRef]
- Dersseh, M.G.; Kibret, A.A.; Tilahun, S.A.; Worqlul, A.W.; Moges, M.A.; Dagnew, D.; Abebe, W.B.; Melesse, A.M. Potential of Water Hyacinth Infestation on Lake Tana, Ethiopia: A Prediction Using a GIS-Based Multi-Criteria Technique. Water 2019, 11, 1921. [Google Scholar] [CrossRef] [Green Version]
- Mutikanga, H.E.; Sharma, S.K.; Vairavamoorthy, K. Multi-criteria Decision Analysis: A Strategic Planning Tool for Water Loss Management. Water Resour. Manag. 2011, 25, 3947–3969. [Google Scholar] [CrossRef]
- Rahman, M.A.; Jaumann, L.; Lerche, N.; Renatus, F.; Buchs, A.K.; Gade, R.; Geldermann, J.; Sauter, M. Selection of the Best Inland Waterway Structure: A Multicriteria Decision Analysis Approach. Water Resour. Manag. 2015, 29, 2733–2749. [Google Scholar] [CrossRef]
- Ghorbanzadeh, O.; Feizizadeh, B.; Blaschke, T. An interval matrix method used to optimize the decision matrix in AHP technique for land subsidence susceptibility mapping. Environ. Earth Sci. 2018, 77, 584. [Google Scholar] [CrossRef]
- Bryan, B.A.; Crossman, N.D. Systematic regional planning for multiple objective natural resource management. J. Environ. Manag. 2008, 88, 1175–1189. [Google Scholar] [CrossRef]
- Santhi, C.; Arnold, J.G.; Williams, J.R.; Dugas, W.A.; Srinivasan, R.; Hauck, L.M. Validation of the Swat Model on A Large Rwer Basin with Point and Nonpoint Sources. JAWRA J. Am. Water Resour. Assoc. 2001, 37, 1169–1188. [Google Scholar] [CrossRef]
- Cho, J.H.; Sung, K.S.; Ha, S.R. A river water quality management model for optimizing regional wastewater treatment using a genetic algorithm. J. Environ. Manag. 2004, 73, 229–242. [Google Scholar] [CrossRef]
- Kim, J.; Ryu, J.H. Modeling Hydrological and Environmental Consequences of Climate Change and Urbanization in the Boise River Watershed, Idaho. JAWRA J. Am. Water Resour. Assoc. 2018, 55, 133–153. [Google Scholar] [CrossRef] [Green Version]
- Chung, E.-S.; Park, K.; Lee, K.S. The relative impacts of climate change and urbanization on the hydrological response of a Korean urban watershed. Hydrol. Process. 2010, 25, 544–560. [Google Scholar] [CrossRef]
- Jeon, J.-H.; Yoon, C.G.; Donigian, A.S.; Jung, K.-W. Development of the HSPF-Paddy model to estimate watershed pollutant loads in paddy farming regions. Agric. Water Manag. 2007, 90, 75–86. [Google Scholar] [CrossRef]
- Kim, J.; Ryu, J.H. Quantifying the Performances of the Semi-Distributed Hydrologic Model in Parallel Computing—A Case Study. Water 2019, 11, 823. [Google Scholar] [CrossRef] [Green Version]
- Mishra, A.; Kar, S.; Raghuwanshi, N.S. Modeling Nonpoint Source Pollutant Losses from a Small Watershed Using HSPF Model. J. Environ. Eng. 2009, 135, 92–100. [Google Scholar] [CrossRef]
- Yang, Y.; Wang, L. A Review of Modelling Tools for Implementation of the EU Water Framework Directive in Handling Diffuse Water Pollution. Water Resour. Manag. 2009, 24, 1819–1843. [Google Scholar] [CrossRef] [Green Version]
- Bicknell, B.; Imhoff, J.; Kittle, J., Jr.; Jobes, T.; Donigian, A., Jr. Hydrologic Simulation Program-Fortran (HSPF) User’s Manual for Version 12; US Environmental Protection Agency, National Exposure Research Laboratory: Athens, GA, USA, 2001.
- Oyj, V. Humidity Conversion Formulas; VAISALA: Helsinki, Finland, 2013. [Google Scholar]
- Allen, R.G.; Pereira, L.S.; Raes, D.; Smith, M. Crop Evapotranspiration-Guidelines for computing Crop Water Requirements-FAO Irrigation and Drainage Paper 56; FAO—Food and Agriculture Organization of the United Nations: Rome, Italy, 1998. [Google Scholar]
- USGS (United States Geological Survey). The National Map Download Client. 2015. Available online: https://viewer.nationalmap.gov/basic/ (accessed on 1 January 2018).
- US.EPA (United State Environmental Protection Agency). Better Assessment Science Integrating Point and Nonpoint Sources (BASINS) Modeling Framework; National Exposure Research Laboratory: Research Triangle Park, NC, USA, 2013. Available online: https://www.epa.gov/ceam/better-assessment-science-integrating-point-and-non-point-sources-basins (accessed on 2 August 2018).
- Sohl, T.L.; Sayler, K.L.; Bouchard, M.A.; Reker, R.R.; Friesz, A.M.; Bennett, S.L.; Sleeter, B.M.; Sleeter, R.R.; Wilson, T.S.; Soulard, C.; et al. Spatially explicit modeling of 1992–2100 land cover and forest stand age for the conterminous United States. Ecol. Appl. 2014, 24, 1015–1036. [Google Scholar] [CrossRef]
- Schreüder, W.A. Running BeoPEST. In Proceedings of the 1st PEST Conference, Potomac, MD, USA, 2–4 November 2009. [Google Scholar]
- Doherty, J.; Skahill, B.E. An advanced regularization methodology for use in watershed model calibration. J. Hydrol. 2006, 327, 564–577. [Google Scholar] [CrossRef]
- Tuppad, P.; Srinivasan, R. Bosque River Environmental Infrastructure Improvement Plan: Phase II BMP Modeling Report; Texas AgriLife Research; Texas A&M University: College Station, TX, USA, 2008. [Google Scholar]
- Saaty, T.L. The Analytic Hierarchy Processes; McGraw-Hill: New York, NY, USA, 1980. [Google Scholar]
- US.EPA (United State Environmental Protection Agency). HSPF Version 12.4. User’s Manual; National Exposure Research Laboratory: Research Triangle Park, NC, USA, 2014.
- Banai, R. Fuzziness in Geographical Information Systems: Contributions from the analytic hierarchy process†. Int. J. Geogr. Inf. Syst. 1993, 7, 315–329. [Google Scholar] [CrossRef]
- Zhu, X.; Dale, A. JavaAHP: A web-based decision analysis tool for natural resource and environmental management. Environ. Model. Softw. 2001, 16, 251–262. [Google Scholar] [CrossRef]
- Nagaraju, D.; Nassery, H.; Adinehvandi, R. Determine suitable sites for artificial recharge using hierarchical analysis process (AHP), remote sensing and geographical information system. Int. J. Earth Sci. Eng. 2012, 5, 1328–1335. [Google Scholar]
- Brown, W.; Schueler, T. The Economics of Stormwater BMPs in the Mid-Atlantic Region; Center for Watershed Protection: Silver Spring, MD, USA, 1997. [Google Scholar]
- County, F. National Pollutant Discharge Elimination System; Anne Arundel County Department of Public Works: Annapolis, MD, USA, 2014. [Google Scholar]
- Dhalla, S.; Zimmer, C. Low Impact Development Stormwater Management Planning and Design Guide, Version 1.0; Toronto and Region Conservation for the living city: Toronto, ON, Canada, 2010. [Google Scholar]
- NCDENR (North Carolina Department of Environment and Natural Resources). Stormwater BMP Costs; NCDENR: Raleigh, NC, USA, 2007.
- US.EPA (United State Environmental Protection Agency). Preliminary Data Summary of Urban Storm Water Best Management Practices; United States Environmental Protection Agency, Office of Water: Columbus, OH, USA, 1999. Available online: http://www.epa.gov/waterscience/guide/stormwater/#nsbd (accessed on 1 January 2019).
- Moriasi, D.N.; Arnold, J.G.; Van Liew, M.W.; Bingner, R.L.; Harmel, R.D.; Veith, T.L. Model Evaluation Guidelines for Systematic Quantification of Accuracy in Watershed Simulations. Trans. ASABE 2007, 50, 885–900. [Google Scholar] [CrossRef]
- Sadeghi, S.H.; Jalili, K.; Nikkami, D. Land use optimization in watershed scale. Land Use Policy 2009, 26, 186–193. [Google Scholar] [CrossRef]
- Nash, J.E.; Sutcliffe, J.V. River Flow forecasting through conceptual models-Part I: A discussion of principles. J. Hydrol. 1970, 10, 282–290. [Google Scholar] [CrossRef]
- LeGates, D.R.; McCabe, G. Evaluating the use of “goodness-of-fit” Measures in hydrologic and hydroclimatic model validation. Water Resour. Res. 1999, 35, 233–241. [Google Scholar] [CrossRef]
- Gupta, H.V.; Sorooshian, S.; Yapo, P.O. Status of Automatic Calibration for Hydrologic Models: Comparison with Multilevel Expert Calibration. J. Hydrol. Eng. 1999, 4, 135–143. [Google Scholar] [CrossRef]


| Parameter | Definition | Units | Initial Value | Possible Range of Values | Calibrated Value |
|---|---|---|---|---|---|
| AGWETP 1 | Fraction of remaining potential evapotranspiration from active groundwater | None | 0 | 0–1.0 | 0.003 |
| AGWRC 1 | Base groundwater recession rate | None | 0.98 | 0.82–0.999 | 0.96 |
| BASETP 1 | Fraction of potential evapotranspiration from baseflow | None | 0.02 | 0–1.0 | 0.14 |
| CEPSC 1 | Interception storage capacity | mm | 2.54 | 0.25–254 | 10.32 |
| DEEPFR 1 | Fraction of groundwater inflow to deep recharge | None | 0.1 | 0.0–1.0 | 0.41 |
| INFILT 1 | Infiltration rate | mm/h | 4.06 | 0.03–12.70 | 2.33 |
| INTFW 1 | Interflow inflow parameter | None | 2.0 | 1.0–10.0 | 0.46 |
| IRC 1 | Interflow recession parameter | 1/day | 0.5 | 0.1–0.9 | 0.81 |
| KVARY 1 | Variable groundwater recession flow | 1/mm | 0 | 0.0–127.0 | 0.62 |
| LZETP 1 | Lower zone evapotranspiration parameter | None | 0 | 0.1–0.9 | 0.41 |
| LSUR 1 | Length of the assumed overland flow | m | 152.4 | 30.48–304.8 | 103.79 |
| LZSN 1 | Lower zone nominal soil moisture storage | m | 152.4, 165.1 | 50.8–381.0 | 54.74, 125.18 |
| NSUR 1 | Manning’s roughness for overland flow | None | 0.2 | 0.01–1.0 | 0.29 |
| SLSUR 1 | Slope of overland flow plane | None | 0.001 | 0.0001–304.8 | 1.09 |
| UZSN 1 | Upper zone nominal soil moisture storage | m | 28.7 | 0.28–254.0 | 55.82 |
| INFEXP 1 | Exponent in infiltration equation | none | 2.0 | 1.0–3.0 | 1.83 |
| KNO320 2 | The nitrate denitrification rate at 20 °C | h−1 | 0.05 | 0.001–0.4 | 0.012 |
| REAK 2 | The empirical constant in the equation used to calculate the reaeration coefficient | h−1 | 1.0 | 0.2–2.0 | 0.2 |
| KBOD20 2 | The unit BOD decay rate at 20 °C | h−1 | 0.02 | 0.00004–0.05 | 0.044 |
| KODSET 2 | The rate of BOD setting | m/h | 0.0 | 0.00012–0.015 | 0.0052 |
| MALGR 2 | The maximum unit algal growth rate for phytoplankton | h−1 | 0.3 | 0.008–0.3 | 0.015 |
| PHYSET 2 | The rate of phytoplankton setting | m/h | 0.0 | 0.00031–0.17 | 0.005 |
| CFSAEX 2 | The correction factor for solar radiation | none | 0.5 | 0.001–2.0 | 0.55 |
| KATRAD 2 | The long-wave radiation coefficient | none | 6.5 | 1.0–20.0 | 3.5 |
| LULC Classification | 2011 LULC (km2) | 2100 LULC under A2 Scenario (km2) | Change (%) |
|---|---|---|---|
| Barren/Mining | 20 (0.19% *) | 470 (4.51%) | 4.31 |
| Agricultural land | 1276 (12.22%) | 1182 (11.32%) | −0.90 |
| Forest | 2992 (28.66%) | 2964 (28.40%) | −0.27 |
| Grassland | 2450 (23.47%) | 2002 (19.18%) | −4.29 |
| Shrubland | 3023 (28.96%) | 2874 (27.53%) | −1.43 |
| Urban | 564 (5.40%) | 829 (7.92%) | 2.54 |
| Water/Wetland | 115 (1.10%) | 119 (1.14%) | 0.04 |
| Total | 10,439 (100%) | - | |
| Decision Factor | Management Scheme (%) | |||
|---|---|---|---|---|
| Equal Weight Distribution Condition (EE) | Weight on Economic Feasibility (EFW) | Weight on Environmental Concern (EW) | ||
| Water quality (WQ) | Sediment | 11% | 5% | 24% |
| TN | 11% | 5% | 24% | |
| TP | 11% | 5% | 24% | |
| Operational cost (OC) | 33% | 70% | 14% | |
| Land feasibility (LF) | 33% | 15% | 14% | |
| Sum | 100% | 100% | 100% | |
| LID/BMP | Construction Cost ($/ha) | Annual Maintenance Cost (% of Construction Cost) |
|---|---|---|
| Bioretention | 151,200 | 6 |
| Detention Pond | 12,200 | 4 |
| Wetland | 15,500 | 4 |
| Grassed Swale | 9000 | 6 |
| Filter strip | 3400 | 3 |
| Performance Statistic | Sediment Load | TN Load | TP Load |
|---|---|---|---|
| R | 0.81 | 0.85 | 0.85 |
| NSE | 0.61 | 0.51 | 0.67 |
| RSR | 0.63 | 0.69 | 0.58 |
| PBIAS (%) | 15.32 | 10.73 | 8.86 |
| Component | Baseline | 2100 LULC (A2) | |||||
|---|---|---|---|---|---|---|---|
| F1 | F2 | F3 | Variation (%) | ||||
| F1 | F2 | F3 | |||||
| Streamflow (m3/s) | 31.77 | 24.10 | 28.10 | 32.08 | −24.14 | −11.19 | 0.98 |
| Sediment (100 × ton/month) | 23.04 | 25.31 | 30.02 | 34.40 | 9.87 | 30.30 | 49.30 |
| TN (ton/month) | 94.54 | 150.61 | 165.54 | 174.68 | 59.31 | 75.10 | 84.77 |
| TP (ton/month) | 11.25 | 11.84 | 12.99 | 13.63 | 5.23 | 15.43 | 21.16 |
| LID/BMPs | Bioretention | Detention Pond | Filter Strip | Grassed Swale | Wetland |
|---|---|---|---|---|---|
| Bioretention | 1.00 | 1.23 | 2.01 | 2.28 | 1.50 |
| Detention pond | 0.81 | 1.00 | 1.78 | 2.06 | 1.27 |
| Filter strip | 0.50 | 0.56 | 1.00 | 1.27 | 0.66 |
| Grassed swale | 0.44 | 0.49 | 0.79 | 1.00 | 0.56 |
| Wetland | 0.67 | 0.79 | 1.51 | 1.78 | 1.00 |
| λmax = 5.004, CI = 0.001, CR = 0.091%. | |||||
| Management Scheme | LID/BMP Types | The Selected CHSs at Sub-Basin Scales | ||
|---|---|---|---|---|
| CII | LII | LPSAI | ||
| Equal weight distribution condition (EE) | Grassed swale-LID | 13, 21, 42, 44, 76 | 70, 72, 75, 77 | 44, 45, 47, 59, 60 |
| Filter strip-BMP | 28, 49, 50, 52, 71, 73, 74, 75, 77, 78 | 47, 48, 61, 62, 63, 64, 69, 73, 74, 76, 78 | 55, 61, 62, 64, 68, 71, 72, 73, 76, 77, 78 | |
| Detention pond-LID | 72 | 68, 71 | 67 | |
| Weight on Economic feasibility (EFW) | Filter strip-BMP | 44, 45, 47, 55, 59, 60, 61, 62, 64, 67, 68, 71, 72, 73, 78, 77, 78 (all CHSs were selected) | ||
| Environmental concern (EW) | Detention pond-LID | 14, 21, 42, 44, 72 | 68, 70, 72, 75, 77 | 44, 45, 47, 59, 67 |
| Filter strip-BMP | - | - | 55, 60, 61, 62, 64, 68, 71, 72, 73, 76, 77, 78 | |
| Bioretention-LID | 28, 49, 50, 52, 71, 73, 74, 75, 76, 77, 78 | 47, 48, 61, 62, 63, 63, 69, 71, 73, 74, 76, 78 | - | |
| Management Scheme | Target Method | Load Reduction per Unit Area (kg/ha) | Total Cost per Unit Load Reduction(1000 $/kg) | ||||||
|---|---|---|---|---|---|---|---|---|---|
| Sediment | TN | TP | Mean | Sediment | TN | TP | Mean | ||
| Equal weight distribution condition (EE) | CII | 7.80 | 0.10 | 0.006 | 2.70 | 0.43 | 33.82 | 552.94 | 195.73 |
| LII | 8.20 | 0.06 | 0.004 | 2.76 | 0.42 | 53.68 | 916.65 | 323.58 | |
| LPSAI | 12.57 | 0.07 | 0.004 | 4.21 | 0.27 | 48.37 | 813.47 | 287.37 | |
| Weight on Economic feasibility (EFW) | CII | 10.66 | 0.15 | 0.012 | 3.61 | 6.84 | 496.15 | 6000.31 | 2167.77 |
| LII | 10.77 | 0.09 | 0.009 | 3.63 | 13.31 | 1537.08 | 15216.59 | 5588.99 | |
| LPSAI | 11.93 | 0.09 | 0.005 | 4.01 | 0.44 | 60.42 | 1053.50 | 371.45 | |
| Weight on Environmental concern (EW) | CII | 7.42 | 0.13 | 0.010 | 2.52 | 0.95 | 51.57 | 740.29 | 264.27 |
| LII | 8.44 | 0.07 | 0.004 | 2.84 | 0.50 | 60.16 | 1027.46 | 326.71 | |
| LPSAI | 11.16 | 0.12 | 0.008 | 3.76 | 0.46 | 44.99 | 658.76 | 234.74 | |
© 2020 by the authors. Licensee MDPI, Basel, Switzerland. This article is an open access article distributed under the terms and conditions of the Creative Commons Attribution (CC BY) license (http://creativecommons.org/licenses/by/4.0/).
Share and Cite
Kim, J.; Ryu, J.H. Decision-Making of LID-BMPs for Adaptive Water Management at the Boise River Watershed in a Changing Global Environment. Water 2020, 12, 2436. https://doi.org/10.3390/w12092436
Kim J, Ryu JH. Decision-Making of LID-BMPs for Adaptive Water Management at the Boise River Watershed in a Changing Global Environment. Water. 2020; 12(9):2436. https://doi.org/10.3390/w12092436
Chicago/Turabian StyleKim, JungJin, and Jae Hyeon Ryu. 2020. "Decision-Making of LID-BMPs for Adaptive Water Management at the Boise River Watershed in a Changing Global Environment" Water 12, no. 9: 2436. https://doi.org/10.3390/w12092436