Article

Performance Study of an Integrated Solar Water Supply System for Isolated Agricultural Areas in Thailand: A Case-Study of the Royal Initiative Project

1
School of Engineering and Technology, and Center of Excellence in Sustainable Disaster Management, Walailak University, Nakhon Si Thammarat 80161, Thailand
2
School of Engineering, The University of Warwick, Coventry CV4 7AL, UK
*
Authors to whom correspondence should be addressed.
Water 2020, 12(9), 2438; https://doi.org/10.3390/w12092438
Submission received: 29 July 2020 / Revised: 27 August 2020 / Accepted: 28 August 2020 / Published: 30 August 2020
(This article belongs to the Section Water Resources Management, Policy and Governance)

Abstract

:
This article presents a field-performance investigation on an Integrated Solar Water Supply System (SWSS) at two isolated agricultural areas in Thailand. The two case-study villages (Pongluek and Bangkloy) have experienced severe draughts in recent decades, and, therefore, water supply has become a major issue. A stand-alone 15.36 kW solar power and a 15 kW solar submersible pump were installed along with the input power generated by solar panels supported by four solar trackers. The aim is to lift water at the static head of 64 and 48 m via a piping length of 400 m for each village to be stored in 1000 and 1800 m3 reservoirs at an average of 300 and 400 m3 per day, respectively, for Pongluek and Bangkloy villages. The case study results show that the real costs of electricity generated by SWSS using solar photovoltaic (PV) systems intergraded with the solar tracking system yield better performance and are more advantageous compared with the non-tracking system. This study illustrates how system integration has been employed. System design and commercially available simulation predictions are elaborated. Construction, installation, and field tests for SWSS are discussed and highlighted. Performances of the SWSS in different weather conditions, such as sunny, cloudy, and rainy days, were analysed to make valuable suggestions for higher efficiency of the integrated solar water supply systems.

1. Introduction

Nowadays, climate change and greenhouse effects are increasingly affecting agricultural activities in several regions of South East Asia, especially in rural areas where no irrigation systems exist. To improve the life quality of people in rural areas, water pumping systems are widely used in Thailand to provide a sustainable water supply, which in turn is also in line with the United Nations’ Sustainable Development Goal no. 2 that aims to promote sustainable agriculture [1]. In the last few years, there has been an increasing water demand in such rural areas, particularly in the highland areas of the country that have been affected by severe draughts. In the highlands, pumping (and thus power) is generally needed to assist in water supply and distribution, both for storage and direct use. As electrical infrastructure is usually inexistent, diesel fuel is normally used for the pumping system, despite being environmentally unfriendly and a major source of air and noise pollution [2,3,4]. Moreover, if the high costs of transportation of diesel are considered, diesel-power water-pumping systems are not cost-effective in the long term [3]. In the last fifteen years, several studies have proven that the use of solar energy as an alternative energy source for water pumping is feasible in terms of economic value and environmental benefits [3,4,5,6,7,8,9,10,11,12,13,14,15,16,17,18].
Whilst solar energy is the most widely available and accessible renewable energy source, it is not yet fully exploited, possibly due to cost-effectiveness issues and technological hindrances. Previous research has explored ways to utilise solar radiation using conversion technologies to convert solar energy (in the form of electromagnetic radiation) into other useful forms of energy [19,20,21,22]. Electrical and thermal energies are the two primary forms of energy converted from solar energy using conversion technologies such as photovoltaic cells and thermal collectors, respectively. A photovoltaic (PV) cell converts sunlight directly into electricity. A number of cells can be connected to form a PV module to achieve the desired voltage and current outputs. For thermal energy, solar energy can be absorbed using high optical absorptivity materials then utilised via a heat transfer fluid (HTF) from a thermal collector [23,24,25]. Solar energy may also be transformed into electricity via thermal power systems (usually called heliostat field collectors) that channel solar radiation into a heating tower that produces high-temperature steam, which is then used to drive turbines for electricity production [26,27].
PV panels are widely used as the conversion technology to supply electricity for water-pumping systems, especially in areas without electrical infrastructure [12,18]. Whilst there is a wide range of other renewable energy resources with numerous industrial technologies that can be used to tap the resources (e.g., hydropower and biomass), solar resources have proven to be the most suitable one in terms of cost-effectiveness [12] and availability, where the latter is directly associated with the water demand. Water demand peaks during the summer period, just when the solar resource availability is also relatively high.
Several successful solar water supply systems (SWSS) have been reported in previous literature. Benghanem et al. [11] studied the performance of an SWSS with a different pumping head (50–80 m) at Madinah. The results were used to develop models for water flow rate prediction associated with two main parameters: the pumping head and the solar irradiation. Al-Smairan [12] analysed and compared the cost-effectiveness and the present value cost of solar and diesel power pumping systems for drinking water supply in Jordan. The results showed that solar power is the most cost-effective option among other resources considered in the study. Caton [8] compared the results of PV panel tracking systems (in three different ways) with a non-tracking one for use with water pumping systems. The comparison suggested that the single-axis tracking system with manually monthly tilted-angle reorientation had almost the same pumping performance as a two-axis tracking system. Therefore, the single-axis tracking system with manually monthly reorientation was the most attractive option when cost is a concern. Campana et al. [17] proposed an optimisation procedure (with several considered parameters) to obtain the minimum required area of PV panels needed for a given water demand, which can lead to a lower cost of the overall system. Other research and development activities continue to improve the SWSS systems to enhance their ability to meet future energy and water demands. However, to date, there is limited research focused on the performance of SWSS on different weather conditions, for example, sunny, cloudy, or rainy days in different seasons. New analysed performance parameters related to such conditions may provide additional opportunities for a more suitable technology selection and parameter adjustments to promote more sustainable ways of deploying SWSS around the world
This article presents a case study on the performance-based measurement on the development of an Integrated Solar Water Supply System (SWSS) for isolated highland agricultural areas in Thailand for different weather conditions in different seasons, which is a novel aspect of research. Section 2 sets the scene of current government policy and decision making towards the system for an isolated agricultural area in the highlands of Thailand. Section 3 deals with the details of the project and the location where the SWSS was installed. In Section 4, the design of SWSS is presented for a specific location in the project, and Section 5 reports the system’s performance as well as the prediction of daily flow and monthly flow for further planning policy of water usage. Section 6 summarises the findings and discusses the potential of SWSS as a water management system alternative for developing countries.

2. Government Policy and Decision Making

2.1. Government Policy and the Royal Initiative of His Majesty the King

In recent years and in addition to the Thai government projects, over 4000 projects have been carried out to provide sustainable development in deprived areas of Thailand under the Royal Initiative of His Majesty the King [28]. The highland minorities in Phetchaburi province are, in particular, one of the most underprivileged populations in Thailand. Water demand for agricultural purposes is one of the most significant challenges in the province. Accordingly, a preliminary study on alternative solutions for water supply was carried out in 2011–2012 during the first phase of the project [29]. At that point, diesel-driven pumps were extensively used to power the main water supply systems. The use of such pumps brought expenses such as fuel, parts, and maintenance, which the locals struggled to afford. Moreover, diesel pumps generated pollution and noise, which are known to affect the community [30].

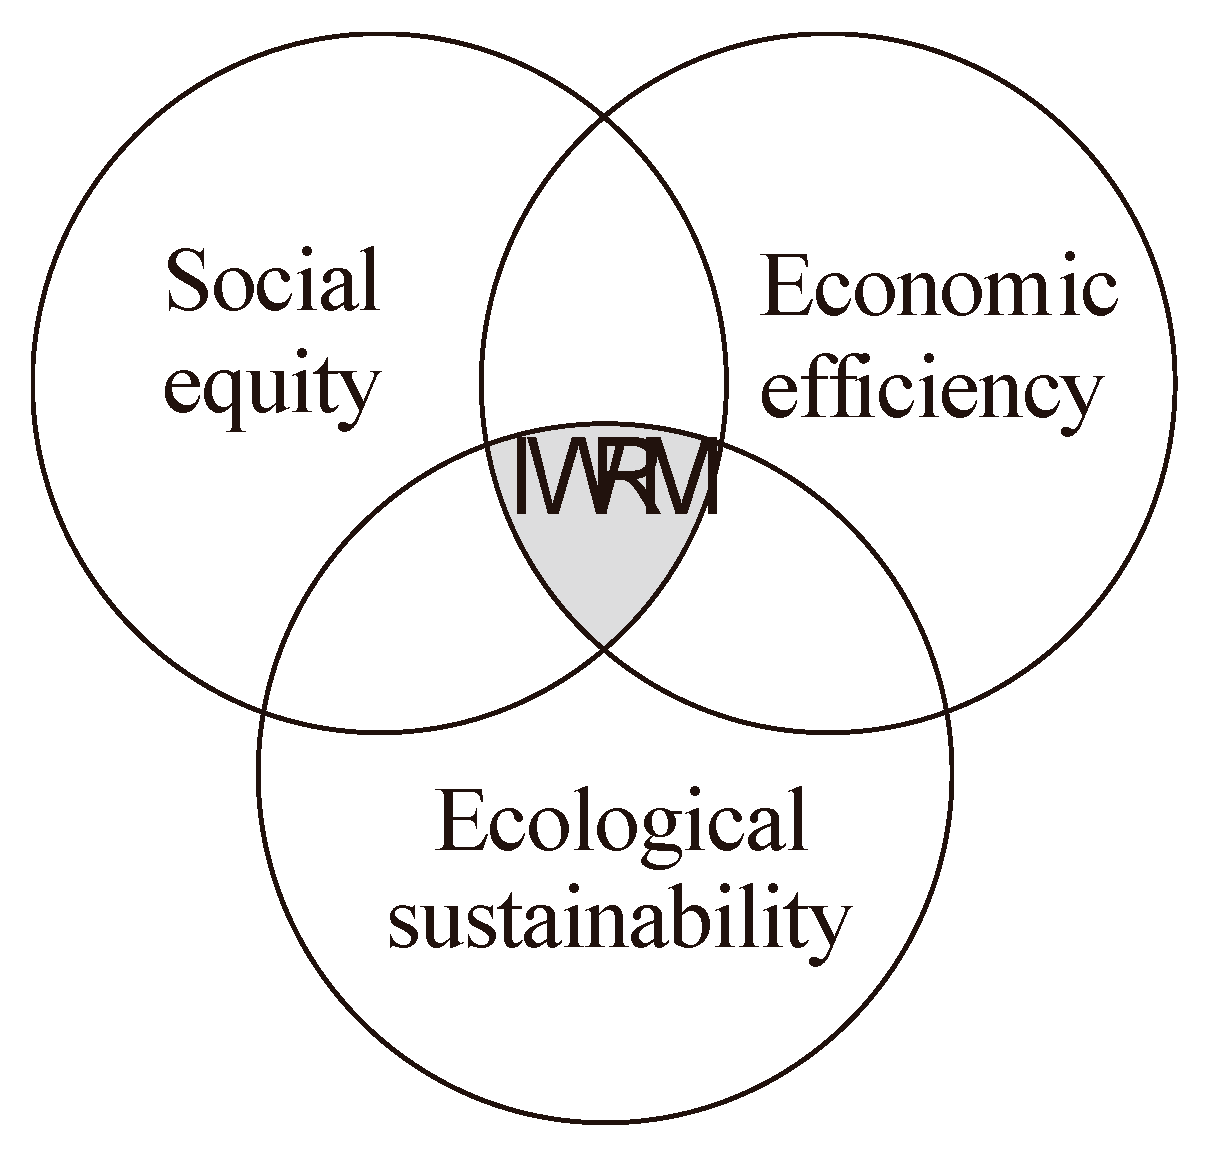
2.2. Decision Making and Integrated Water Management

In recent years, the cost of generating clean energy from renewable sources has dropped sharply. At the same time, governments around the world promote energy production from renewable sources. The drive to increase motor efficiency and reduce CO2 emissions has led to increasing energy production [27]. This is a trend that is set to continue, particularly in countries exposed to climate change. High-Efficiency Integrated Solar Water Supply Systems (SWSS) present a cost-effective, flexible and secure water supply solution using clean energy [31,32,33]. The use of solar power saves on energy and energy infrastructure costs, wherever the application is installed. The lifecycle costs of an SWSS are considerably lower than those of other water supply systems due to lower maintenance costs, thus proving as a suitable alternative source of energy for water solutions [2,29,31,34]. Nowadays, governments increasingly encourage investors to choose renewable energy in new installations, and there is a growing awareness of the low risk of such investments. This is because the installation does not depend on energy prices staying low to ensure a return on the investment [3,27,35].
Integrated Water Resources Management (IWRM) has been defined by the Global Water Partnership (GWP) as “a process which promotes the coordinated development and management of water, land and related resources, in order to maximise the resultant economic and social welfare in an equitable manner without compromising the sustainability of vital ecosystems”. The development of IWRM was particularly recommended in the final statement of the ministers at the International Conference on Water and the Environment in 1992 (so called the Dublin principles) [30]. This concept aims to promote changes in practices that are considered fundamental to improved water resources management. In the current definition, IWRM rests upon three principles that together act as the overall framework includes; (1) social equity, (2) economic efficiency, and (3) ecological sustainability (see Figure 1).
It is crucial to note that IWRM practices depend on the context. At the operational level, the challenge is to translate the agreed principles into concrete action. According to Table 1, energy production from all energy sources is due to experience a significant increase in response to the considerable energy demand increase in the 2012–2035 period. Energy production from most sources has increased rates in the reference set scenario. Although the energy production from most of the energy sources increases, the values of different energy sources from the world’s total energy production do not significantly increase in the 2012–2035 period, due to an increase in total energy production. Table 1 also illustrates the estimated shares of energy sources from total energy production in 2012 and 2035 based on the EIA’s reference scenario [36].

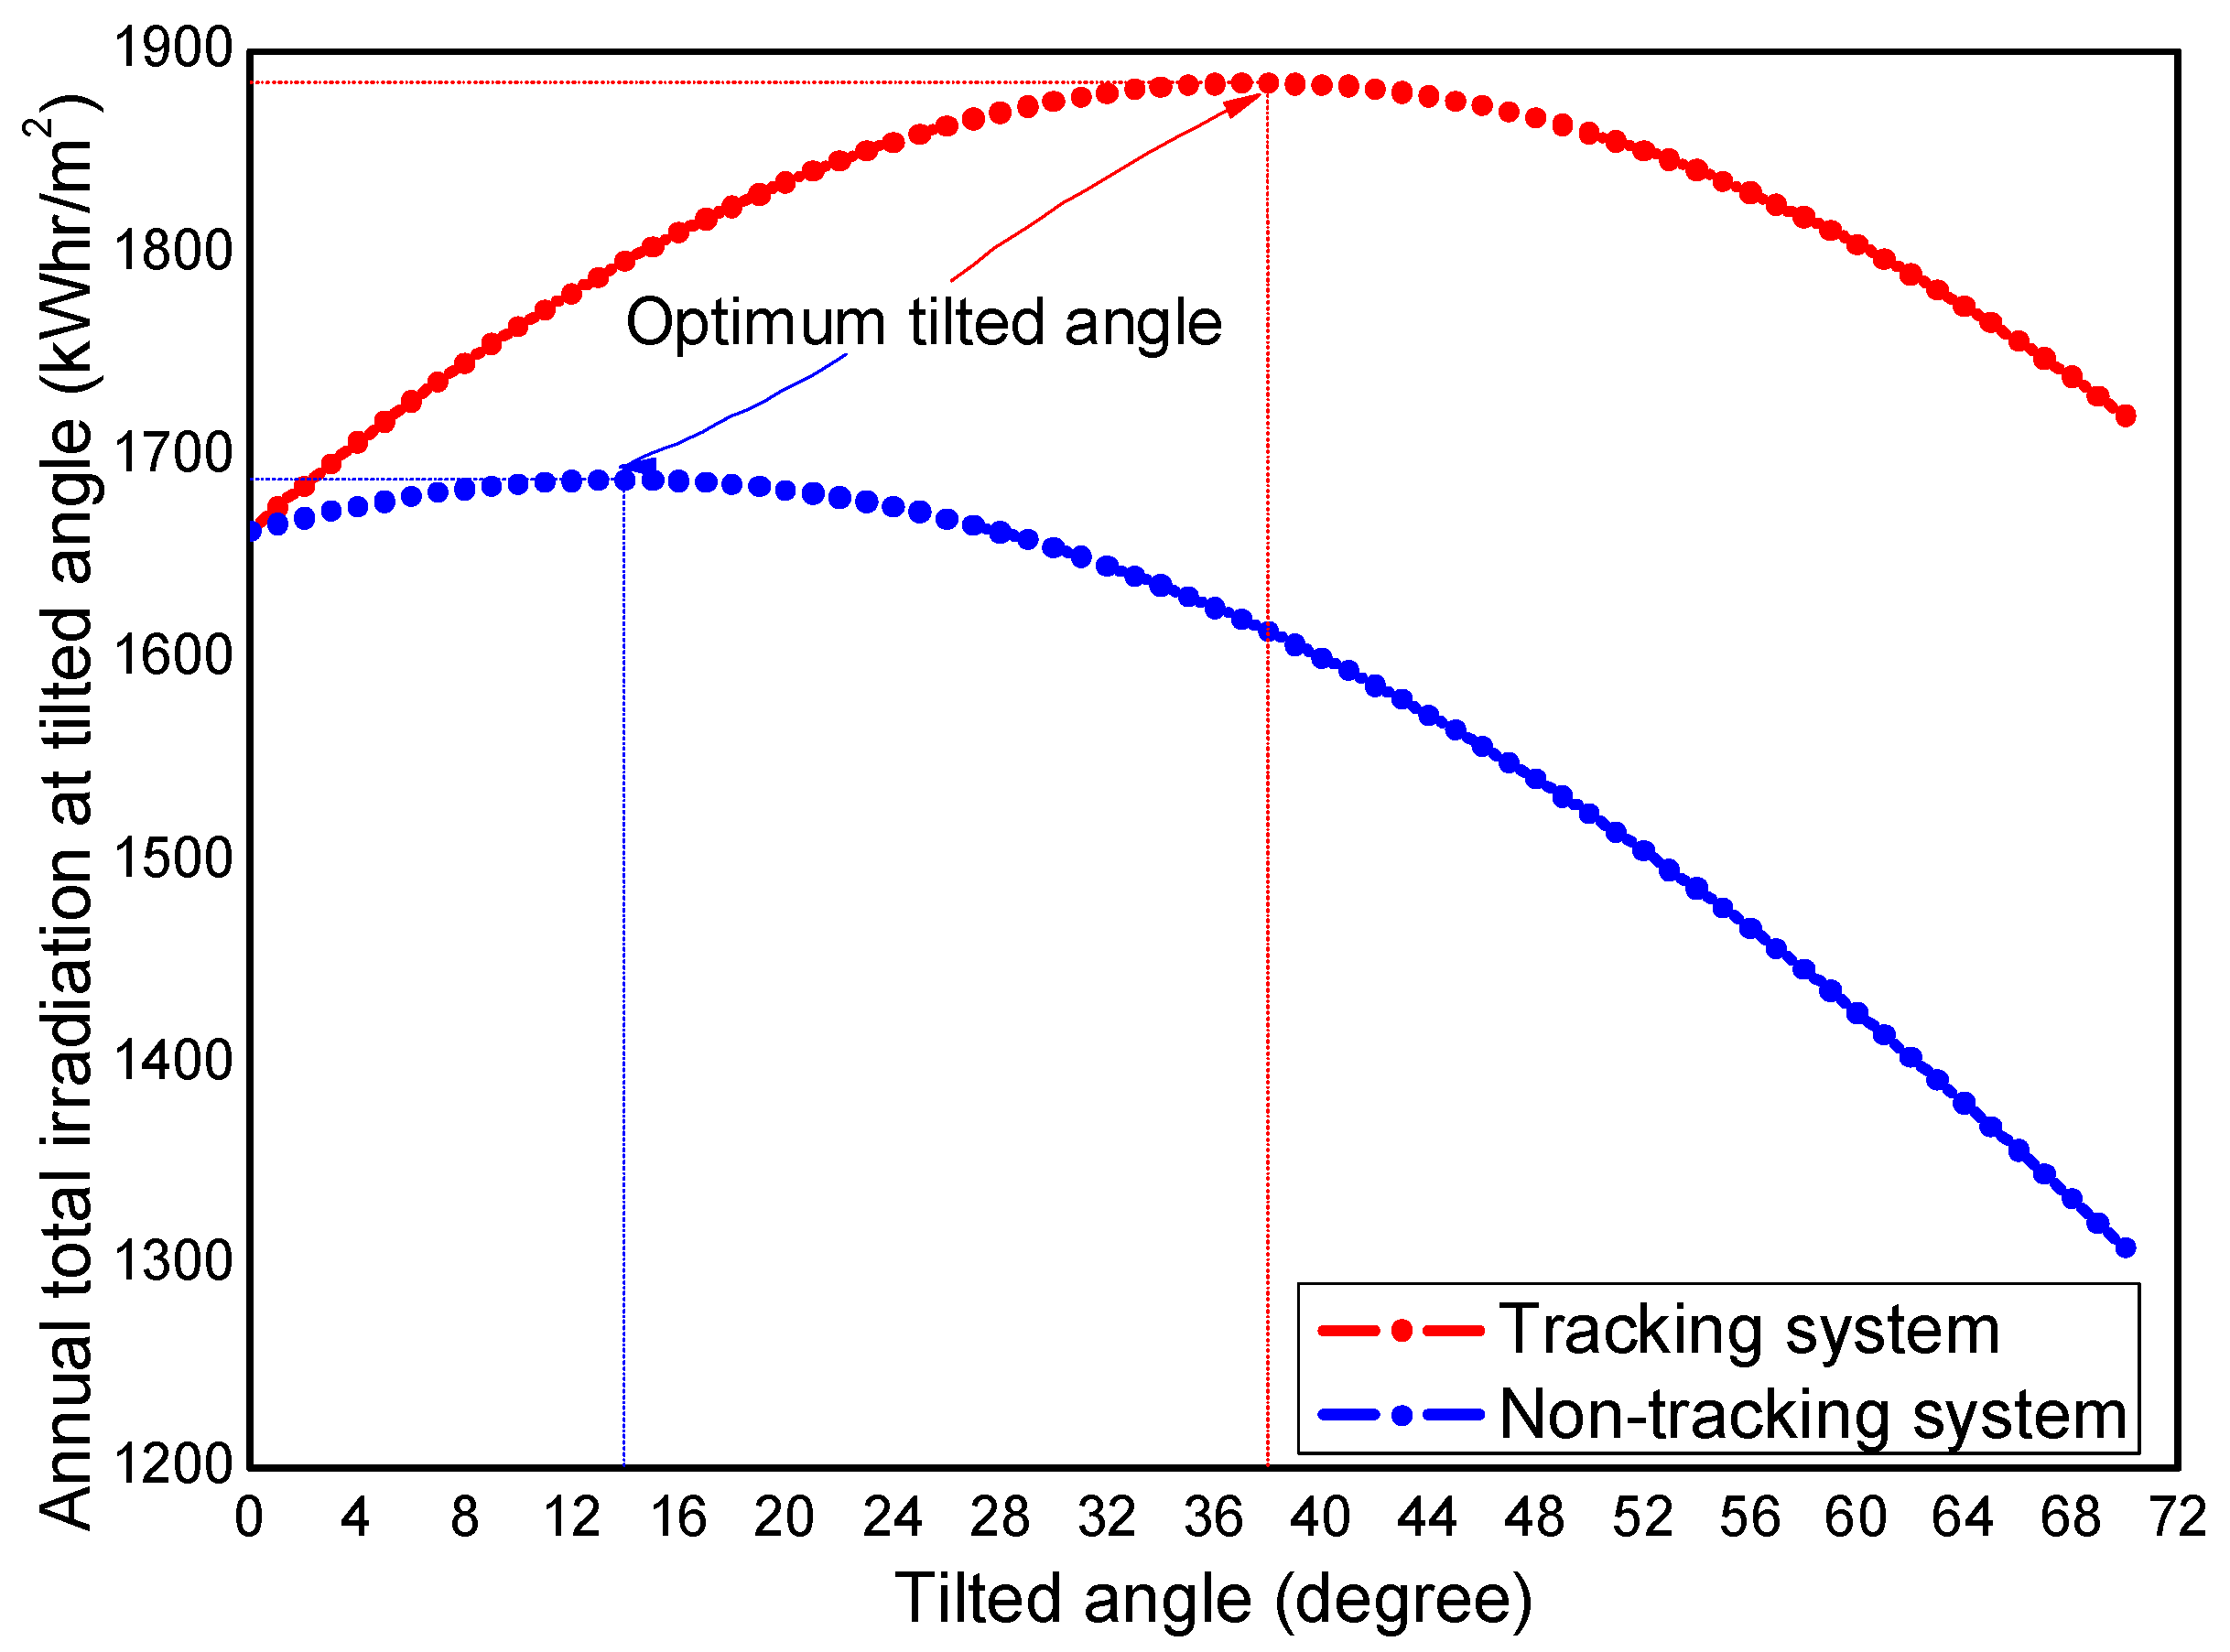
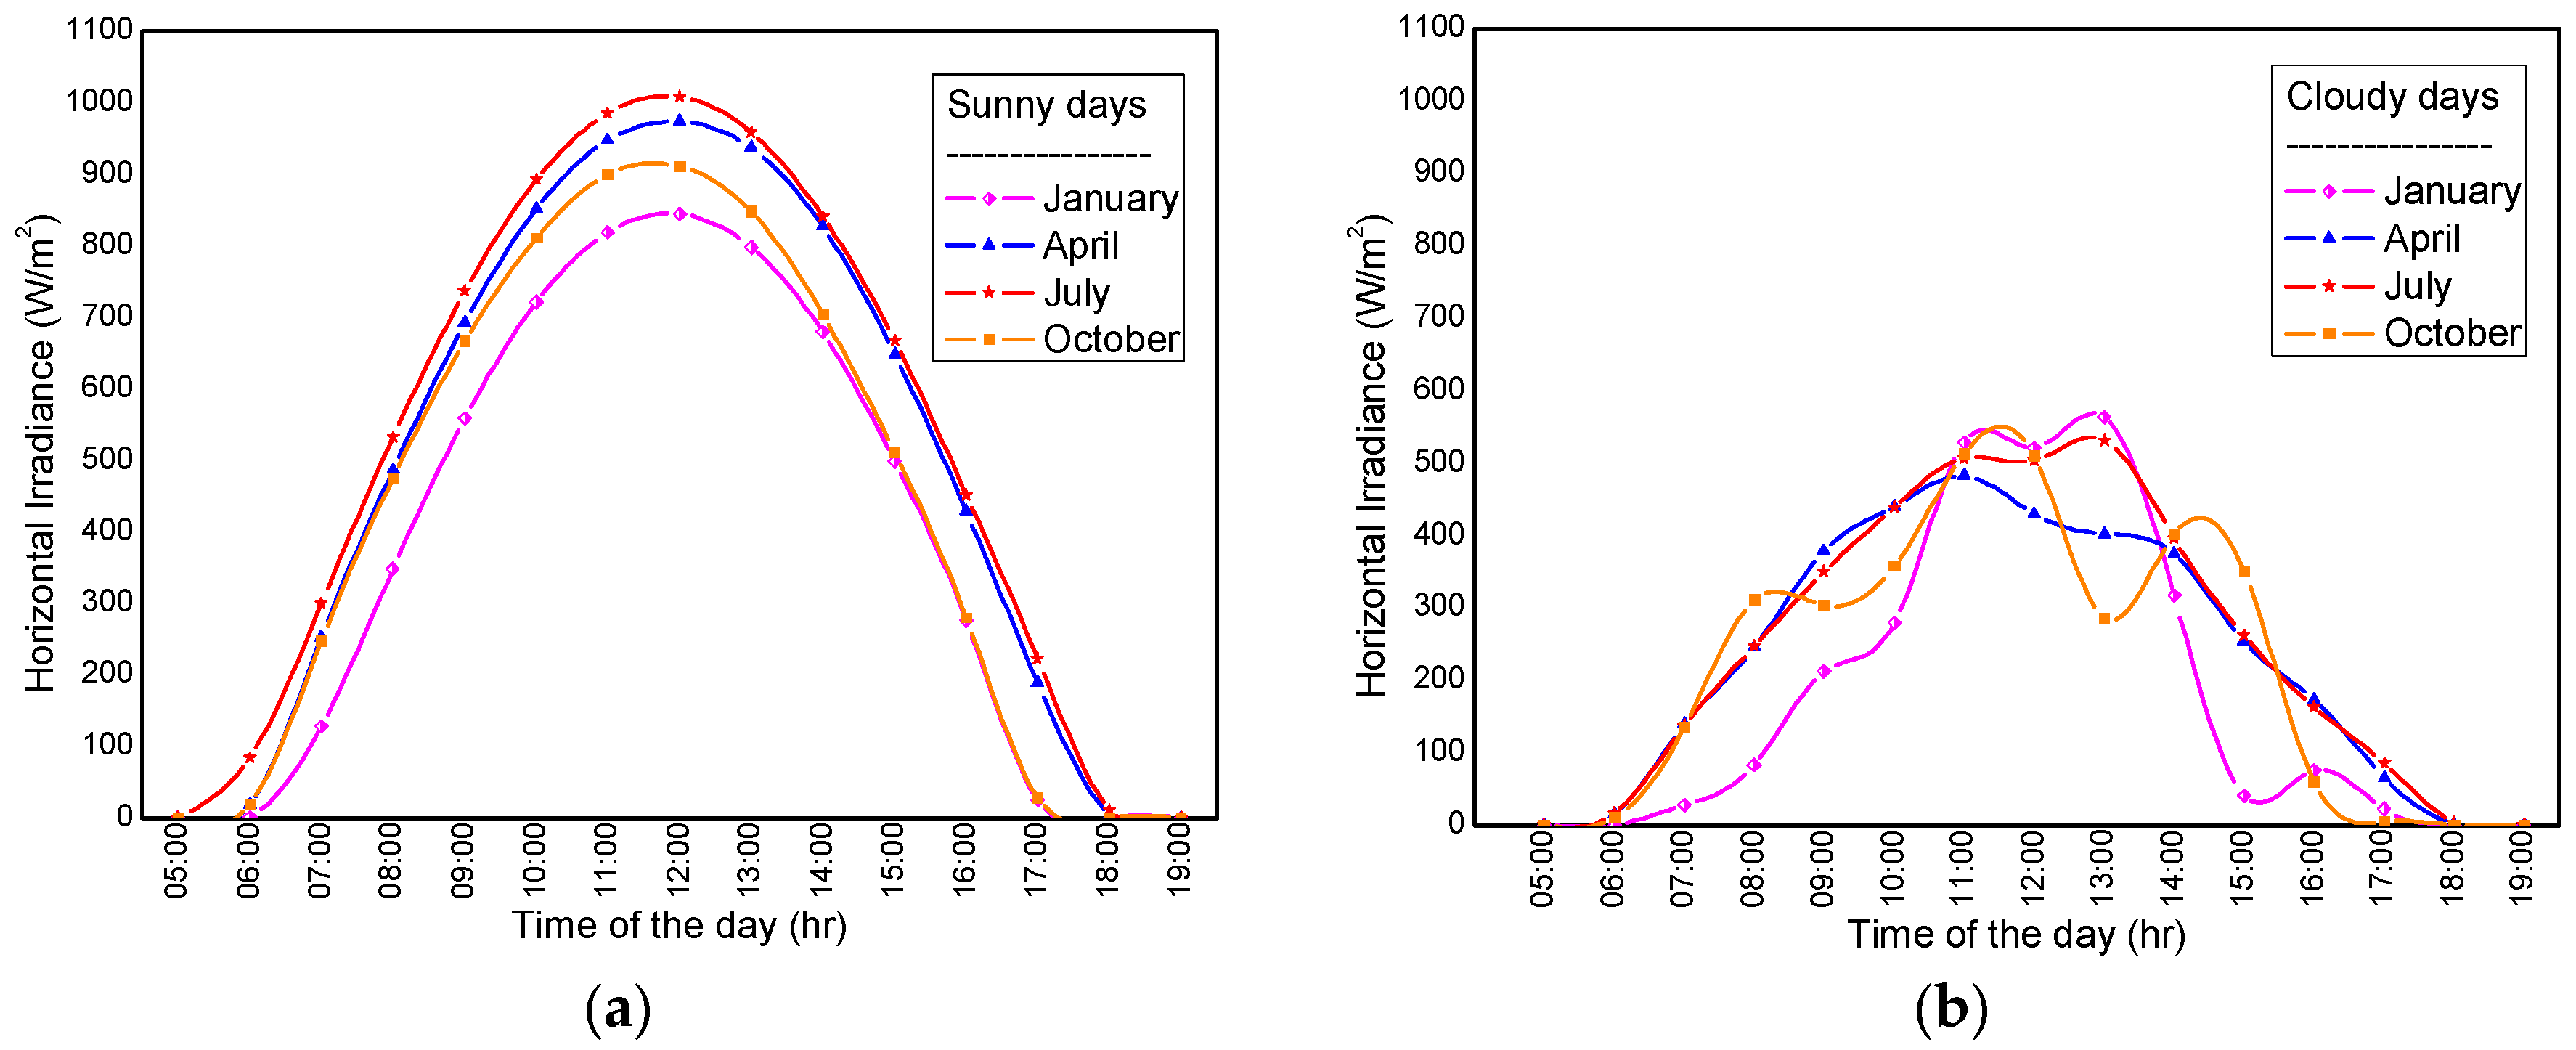
2.3. Horizontal Radiation in Thailand and Tilted Surface Irradiance

Thailand has an area of 500,000 km2 with a predominant equatorial climate. If solar energy is used only in 1% of the total area per year, it would produce energy equal to that produced by an equivalent of 700 million tons of oil. World demand for oil showed a continued increase, causing high energy cost and resource depletion.
The production of electricity from sunlight is an alternative way of solving the energy crisis in Thailand because there are no production costs. Figure 2 shows the horizontal solar radiation map of Thailand. As shown in the figure, the studied area at Pongluek and Bangkloy villages (Kaengkrajarn district located at Phetchaburi province) have the potential of generating an average output of approximately 1600–1700 kWh/m2 per year just from the sunlight.
In this study, a series of input parameters (horizontal solar irradiation, ambient temperature and wind speed) were collected from Kaeng Krachan dam, which is the closest weather station to the studied location. The horizontal solar irradiance was then transformed into the irradiance at the tilted surface following the mathematical models developed by Duffie and Beckman [38]. The PV surfaces for none-tracking and one-axis tracking systems were all installed facing south with a 10° tilted angle. The one-axis tracking system was controlled to make the surface azimuth angle follow the solar azimuth angle. The PV surface azimuth angle of the non-tracking system was fixed at zero degrees. The solar irradiance on the tilted surfaces for non-tracking and one-axis tracking systems were then used as an input of the PV power production calculation.

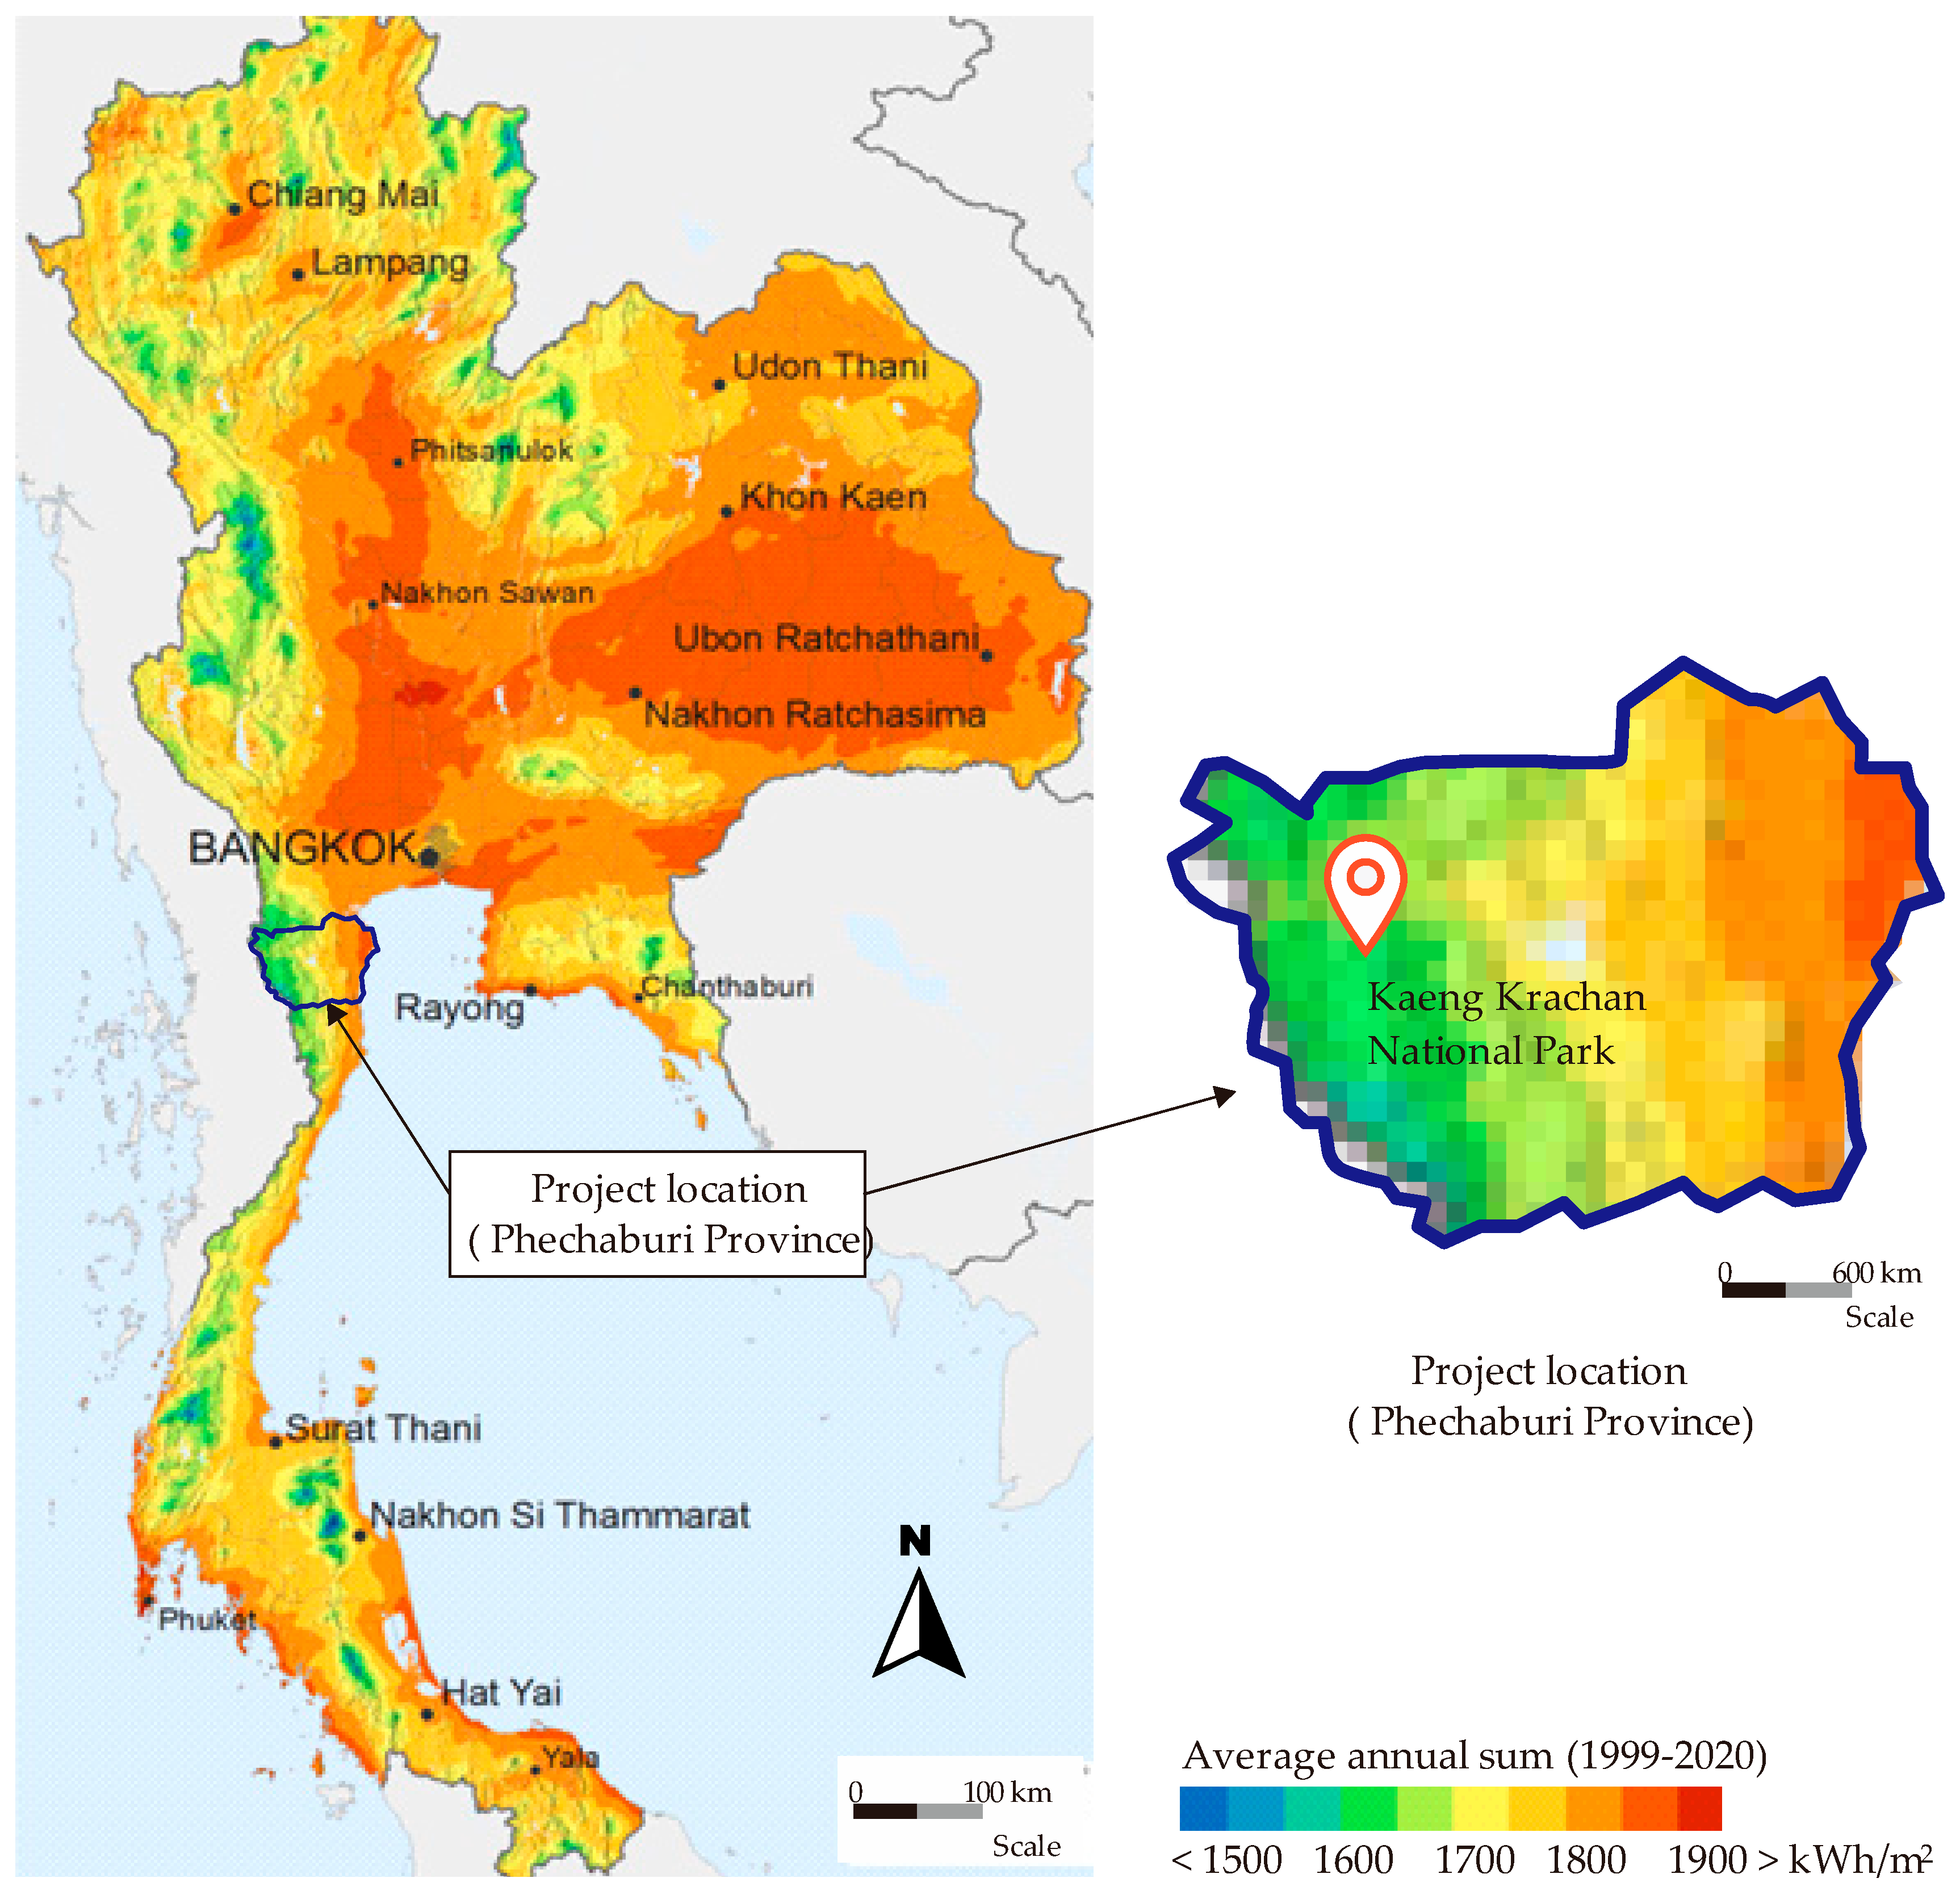
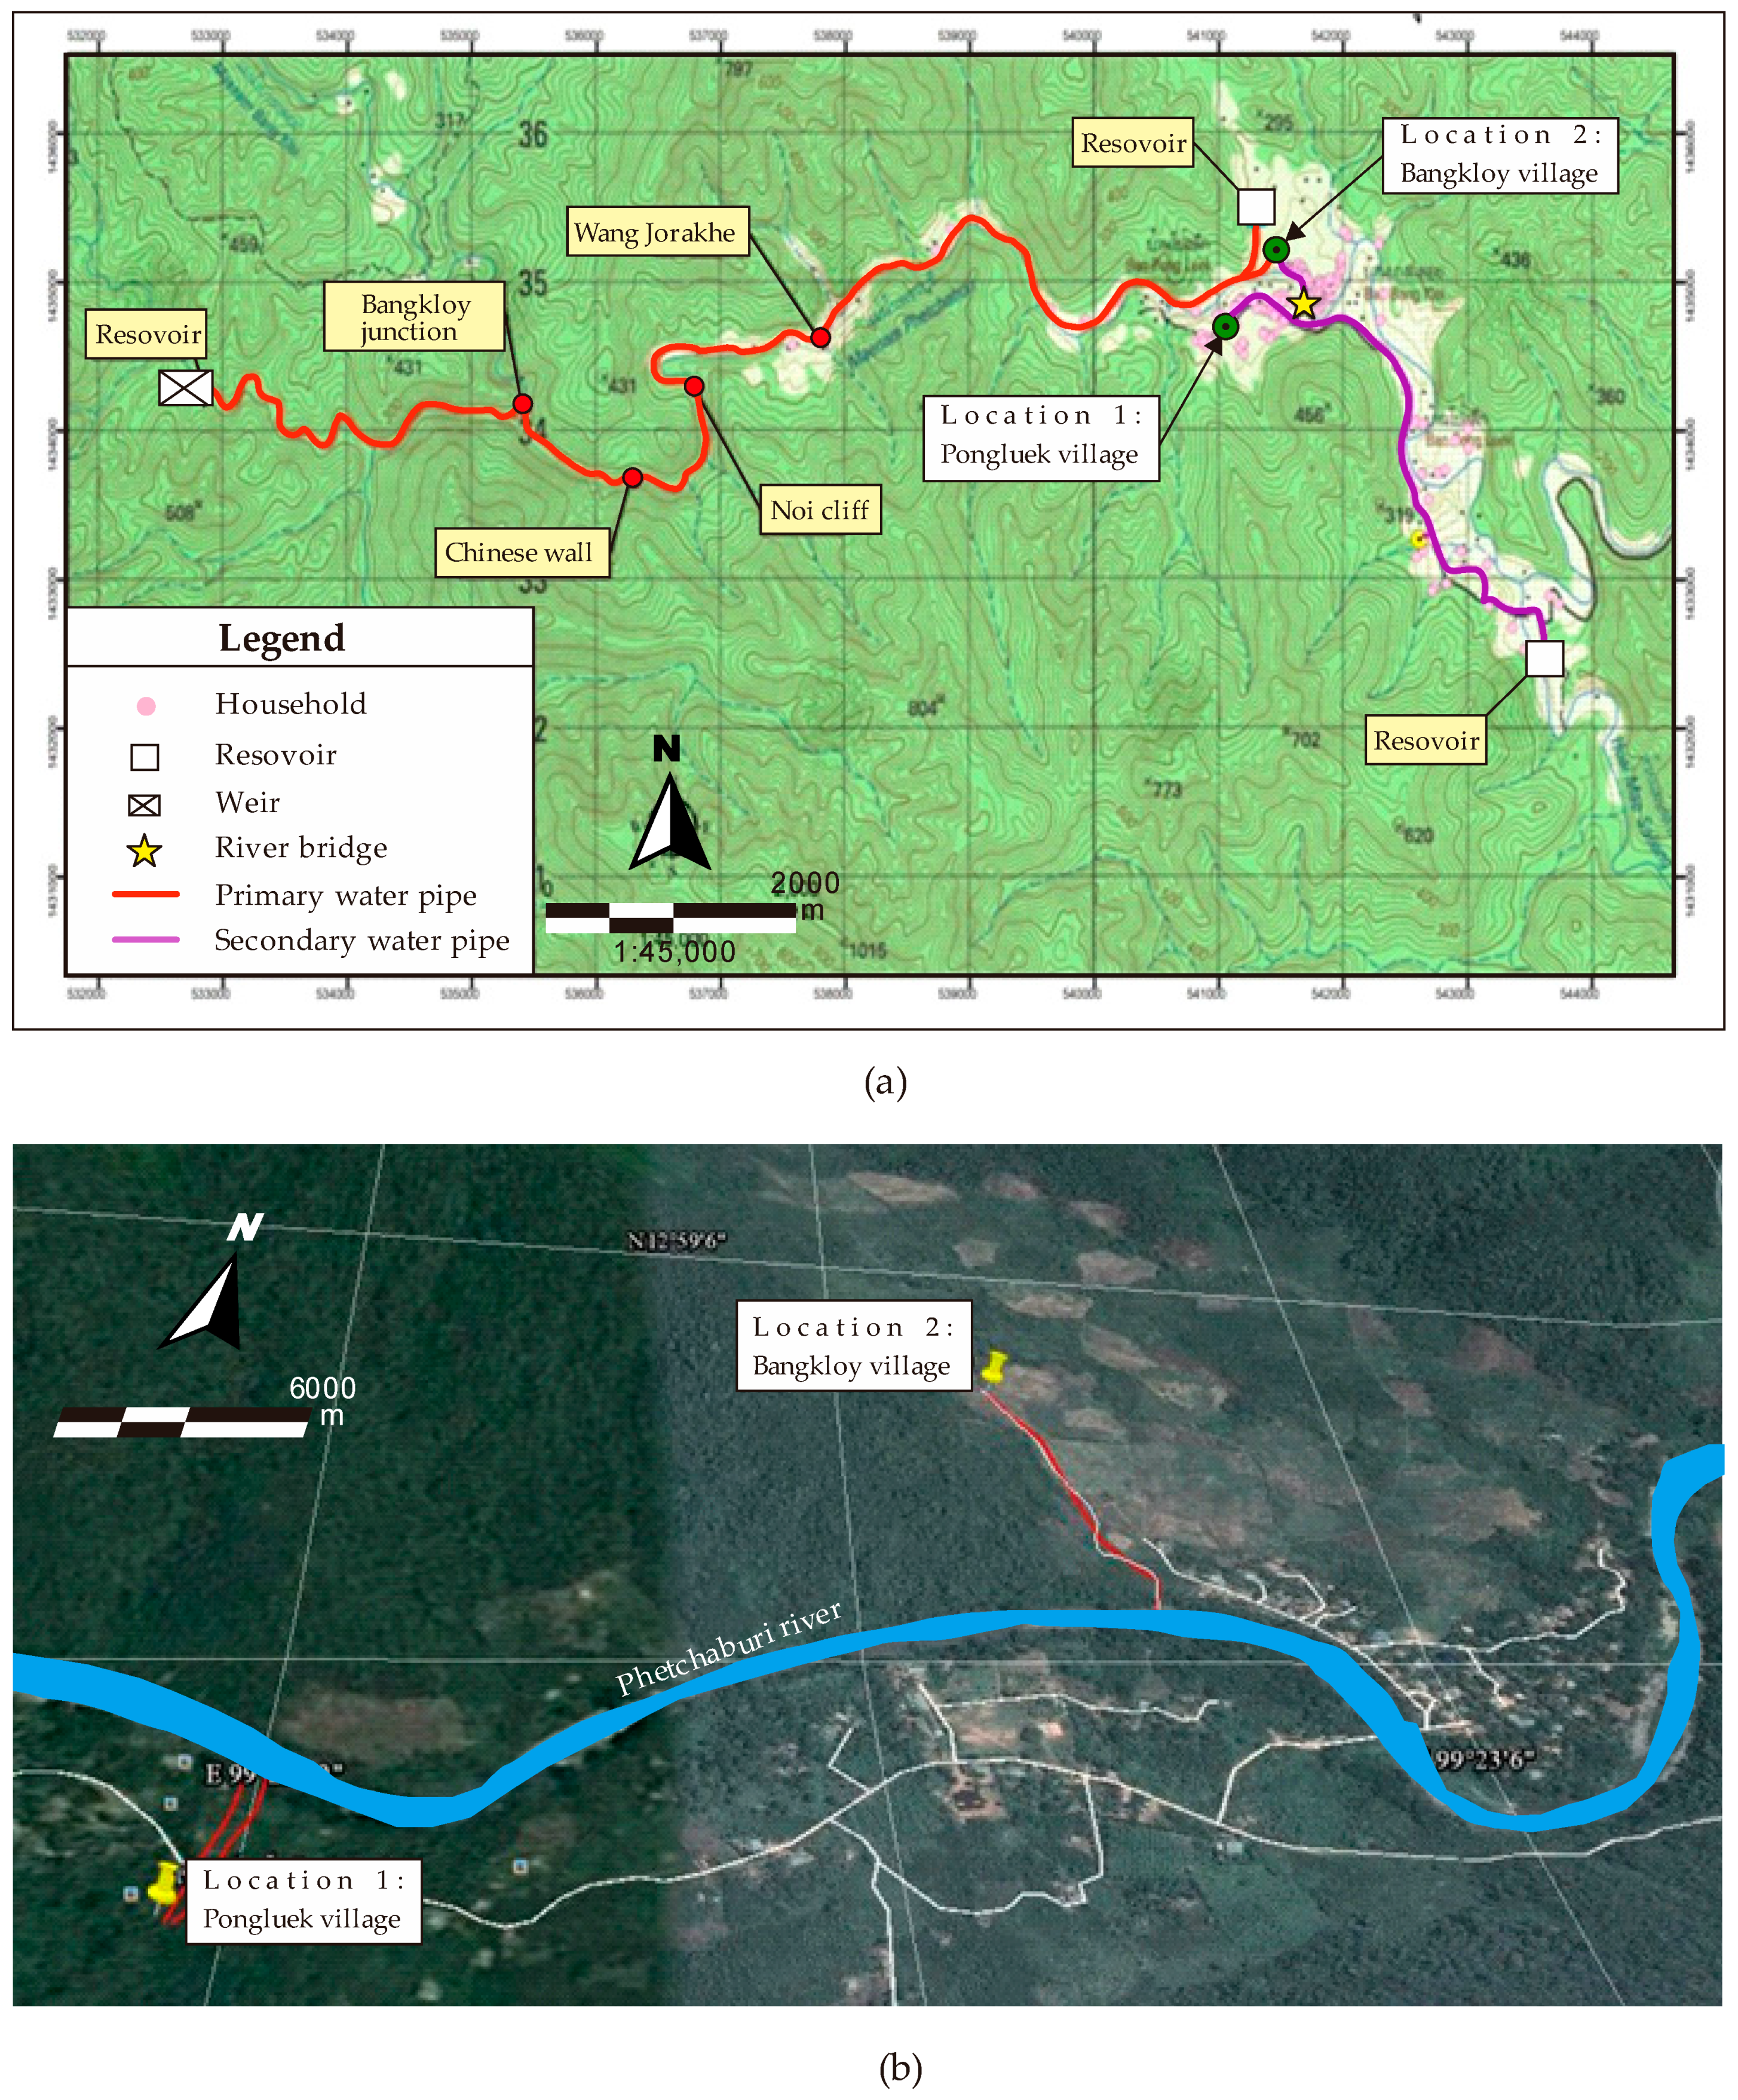
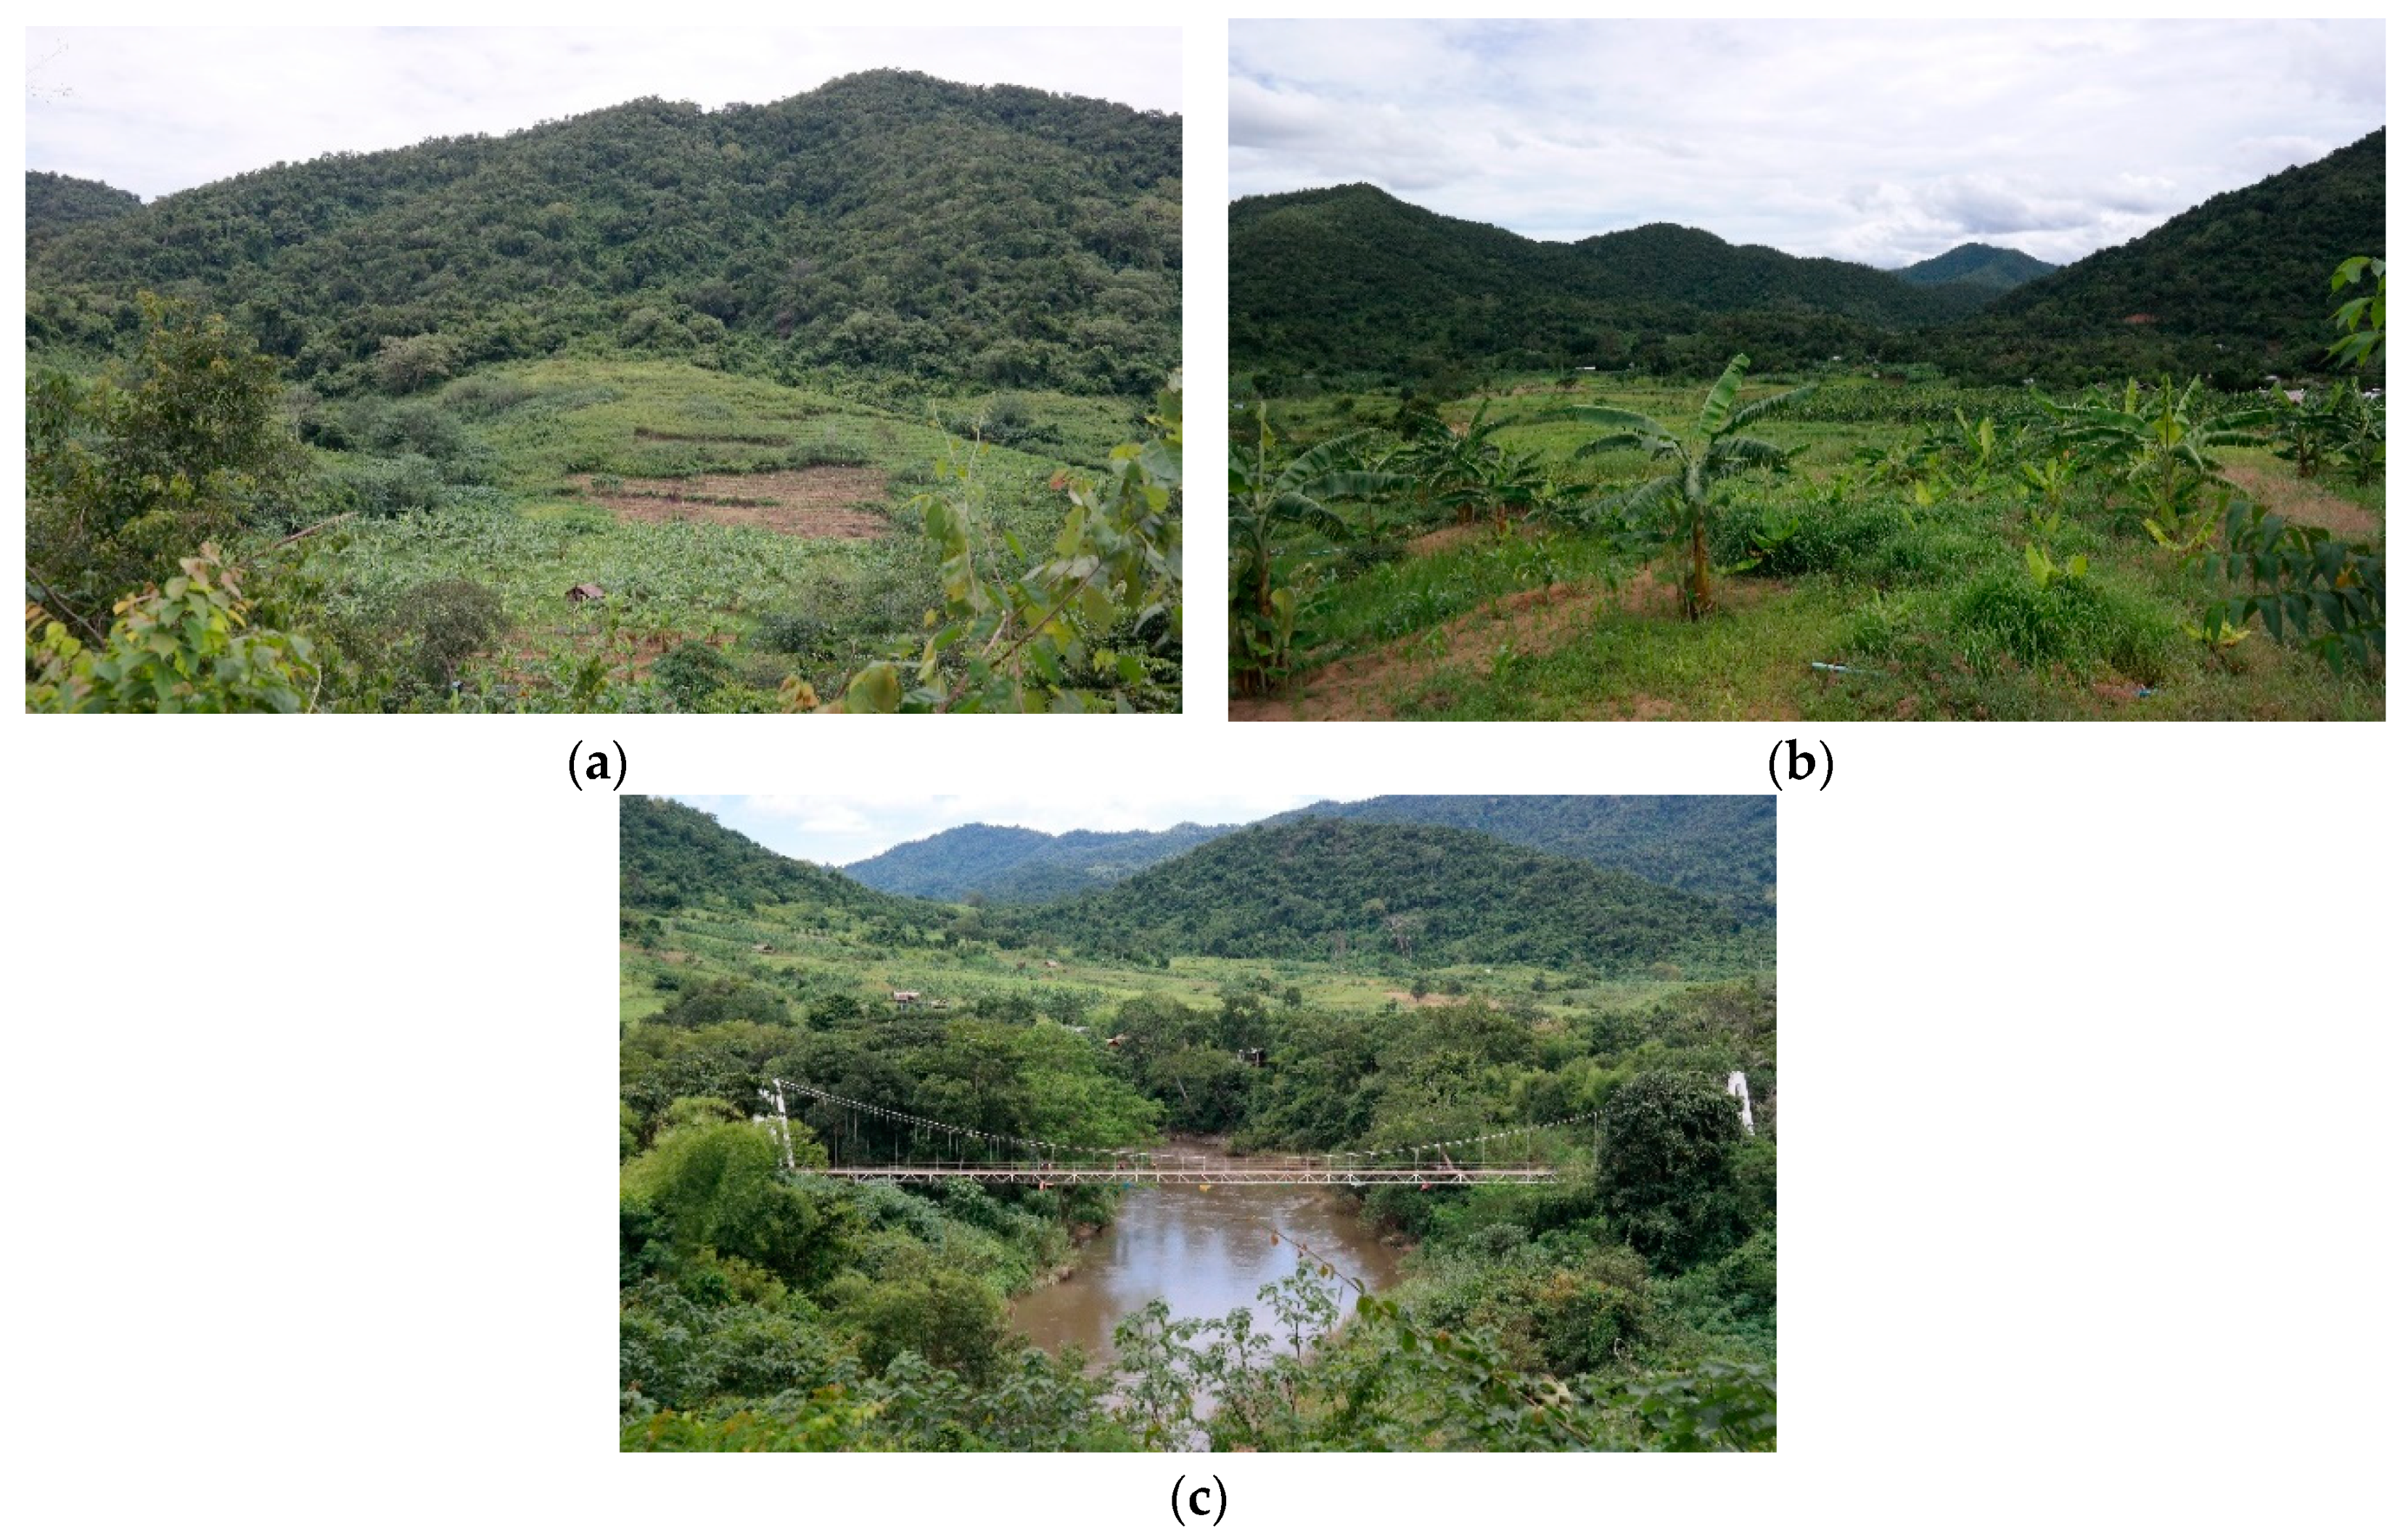
3. Project Background

Recurrent droughts negatively impact people’s lives in rural Thailand. Water shortages for agricultural use reduce crop production and push people to migrate to the cities. The installation of SWSS could mitigate the effects of drought and improve water management. SWSS is being used in areas of Thailand that experience recurrent droughts, mainly because SWSS is seen as a long-term cost-effective solution.
The SWSS system developed in this research was installed in two nearby villages, which allows comparisons. Location 1: Pongluek Village is located at latitude 12.58 N, longitude 99.22 E. Location 2: Bangkloy Village is located at latitude 12.98 N, longitude 99.38 E. Figure 3a–b shows the topography and locations of the two case-study villages.
The two villages are separated by the Phetchaburi River, whose water level is 135 m above mean sea level (MSL). For Pongluek village (Location 1), a 1000 m3 reservoir has been operating at full function for a number of years. This reservoir is located at 199 m above MSL, with a distance approximately 400 m from the pump house. The static head is at 64 m from the source of water (i.e., under the river bridge, as shown in Figure 4c). In this case, water requirement is 300 m3 per day. For Bangkloy village (Location 2), a 1800 m3 reservoir has also been built in advance. The reservoir is 183 m above MSL with the distance around 400 m away from the pump house. The static head is found to be 48 m. Water requirement is 400 m3/day. The main productive activities in the villages are linked to seasonal farming (Figure 4a) and banana crops (Figure 4b).
The Solar radiation at these two locations, as presented in Figure 2, shows an average of value around 4.5–5.5 kWh/m2/day. More information was also gathered from the Meteorological data [37] based on the longitude and latitude data, as shown in Table 2. The data in Table 2 show that the studied area has an average solar radiation is 4.6 kWh/m2/day. It is also interesting to note that the Relative Humidity (RH) is more than 80% between May and October, which indicates the possibility of a raining season (interval of low solar radiation). However, it has been found from the site work that there are occasionally sunny periods, even during the rainy season.

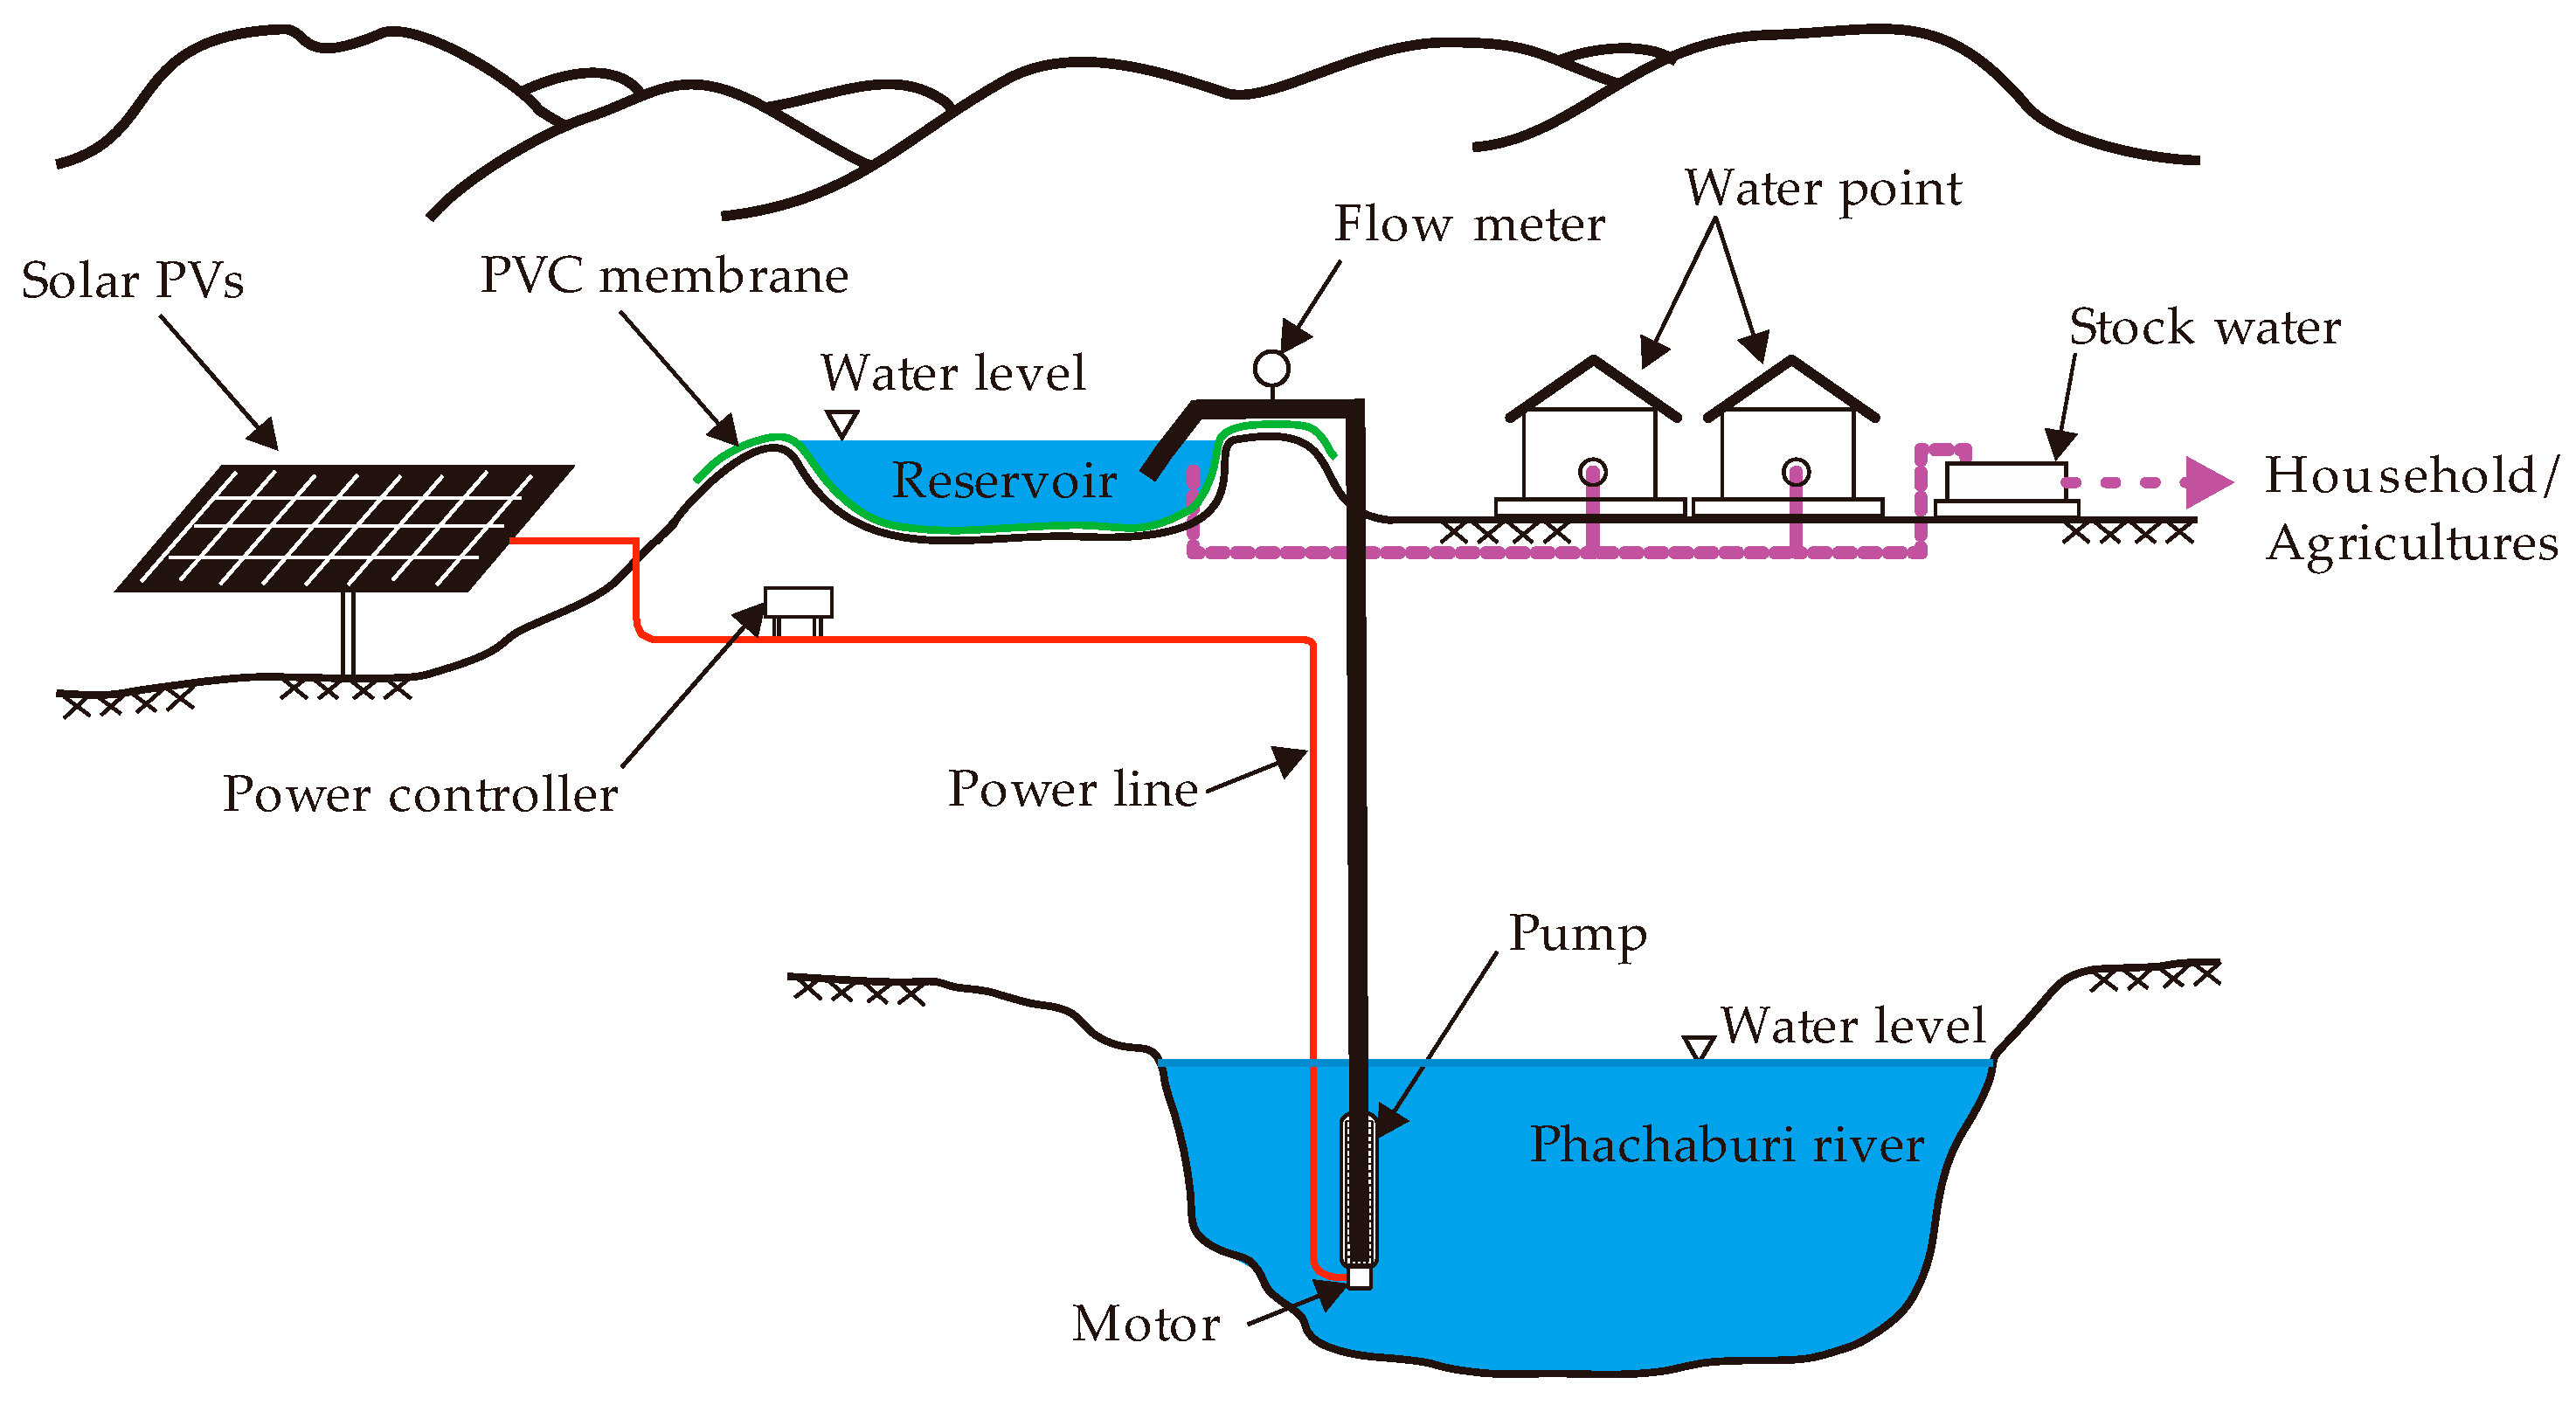
4. Integrated Solar Water Supply System (SWSS) Design

4.1. Design of SWSS for the Project Locations

One of the goals of the project is to investigate the economic feasibility of photovoltaic technology to supply the entire energy demands to off-grid irrigated-farming-based communities. A previous study showed that the electricity generation costs and the performance of the designed PV generator were comparable with an equivalent diesel generator [2]. It also found that the use of solar electricity was cheaper than that of an equivalent diesel generator. In this project therefore, the designed PV generator was implemented by SWSS, as shown in Figure 5. It consists of a solar photovoltaic (solar PV) array and a structure, a power conditioning set, a solar pump and pipework, and water storage. Construction work on isolated highland areas is different and more challenging than in urban areas. Accordingly, the designed SWSS was very carefully considered as transportation and installation were not straightforward. Based on the requirements, a holistic, integrated approach for water, energy, and environment is a strategic issue. As a result, the specific details of the developed SWSS are explained in the following subsections.

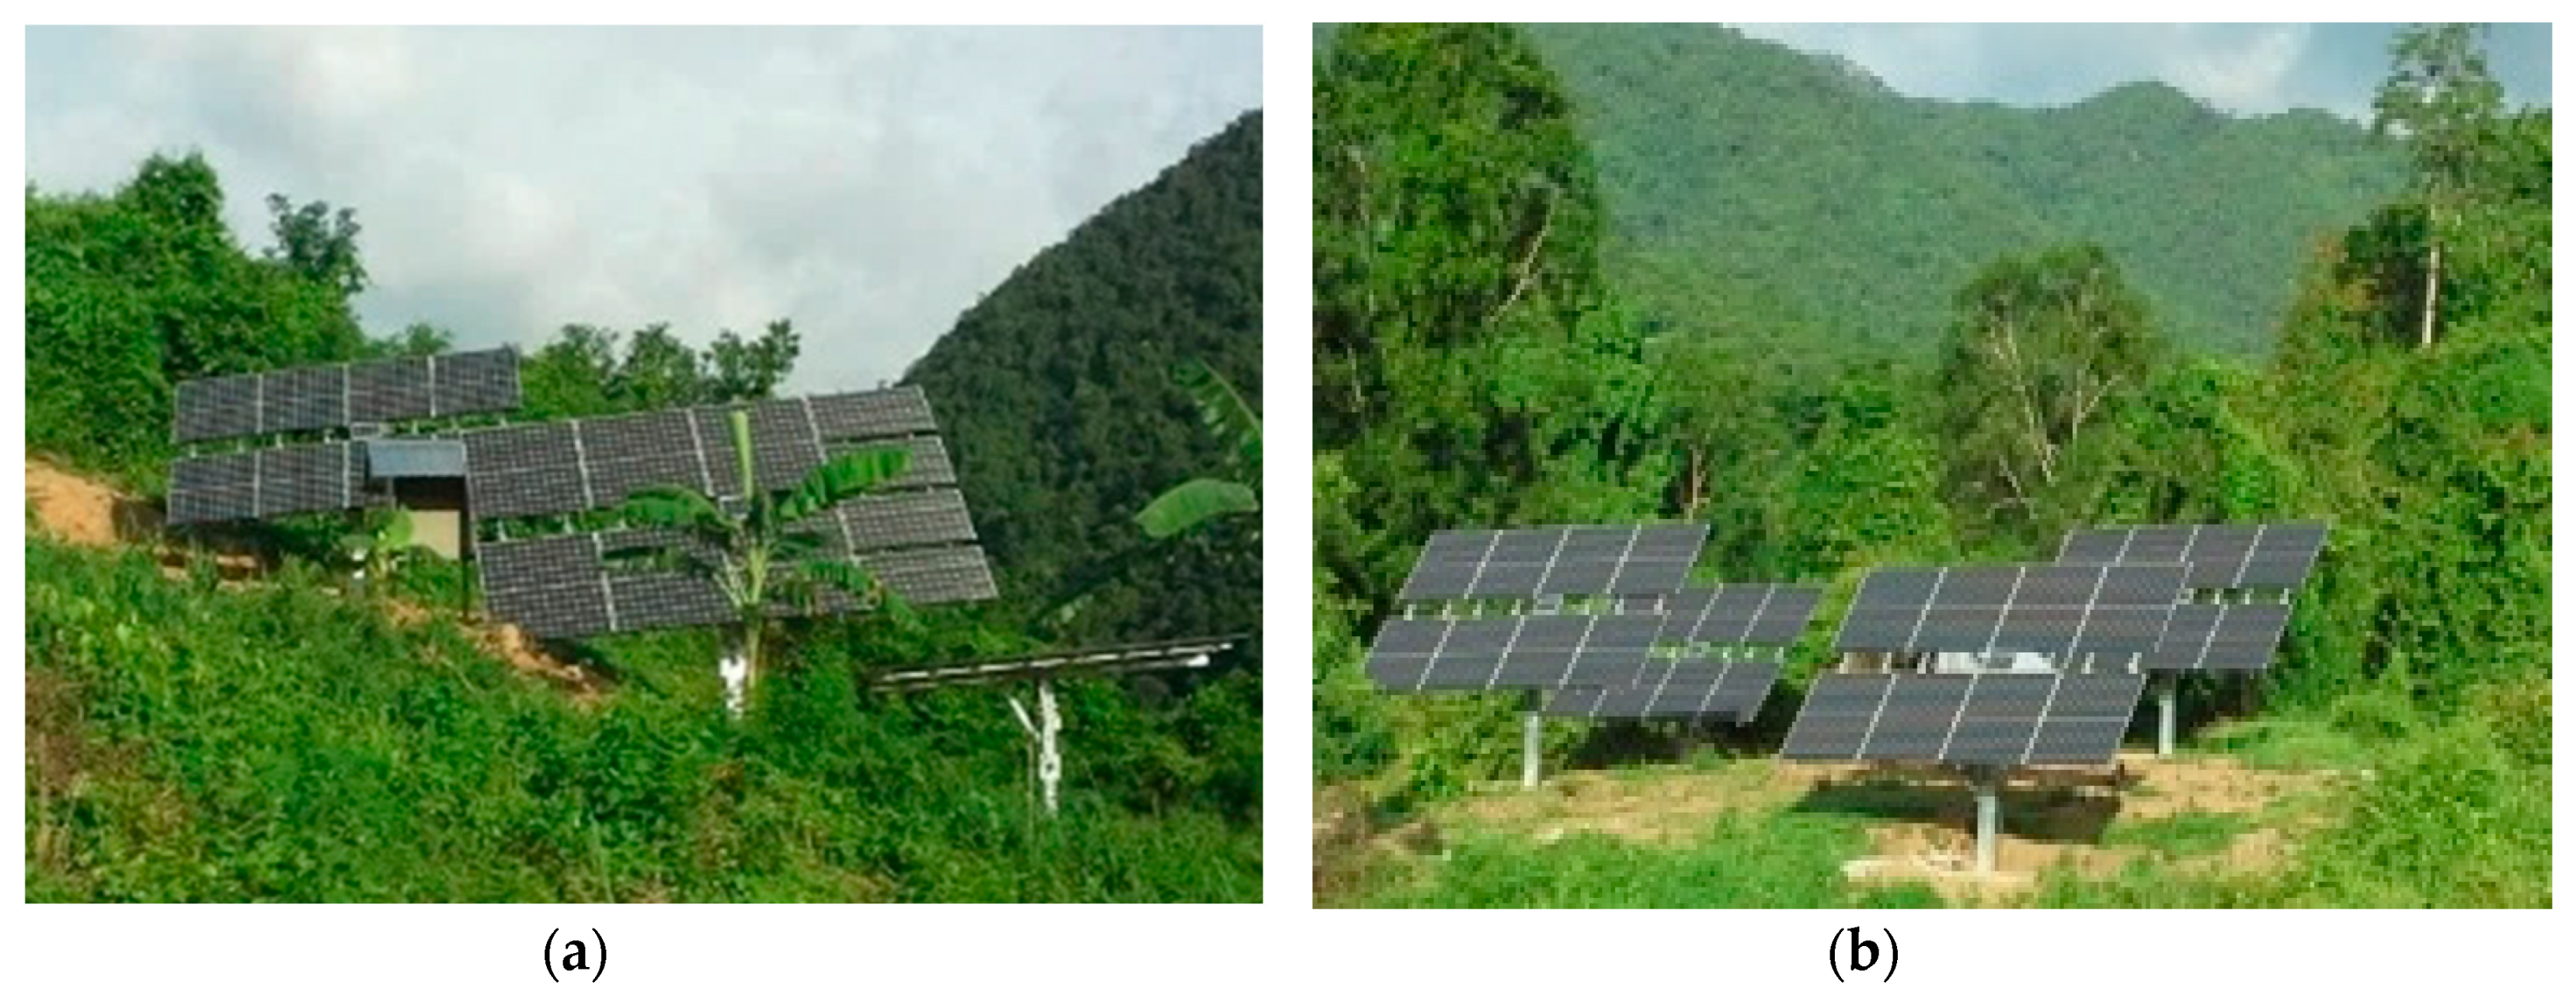
4.2. Solar PV and Solar Structure Specifications

Several materials and technologies in solar PVs [3,32] are available for SWSS. However, the construction conditions at the site were critical factors for design. Available space for installation was limited by the surrounding rainforest, which also constrained the design of the support structures. As a result, the number of solar PVs was also limited, which in turn affected the available power needed to supply the solar pump. Besides, the desired solar PVs had to match both the electrical requirements for the solar controller, as well as the solar PV supports. These constraints were met by choice of 240 watts solar PV units. The solar PVs were supported on an integrated single-axis tracking system (LORENTZ [39]). For this SWSS, there are 4 single-axis solar trackers with 16 monocrystalline-silicon PV panels per tracker for one village. Each PV panel has its maximum efficiency of 14.66% with the power output of 240 W at STC; therefore, the peak power of 15.36 kW may be achieved at STC at each location. Other PV panel’s characteristics are presented in Table 3 for reference purpose. Figure 6 and Figure 7 show the solar PVs with solar trackers installed at the two case-study villages.

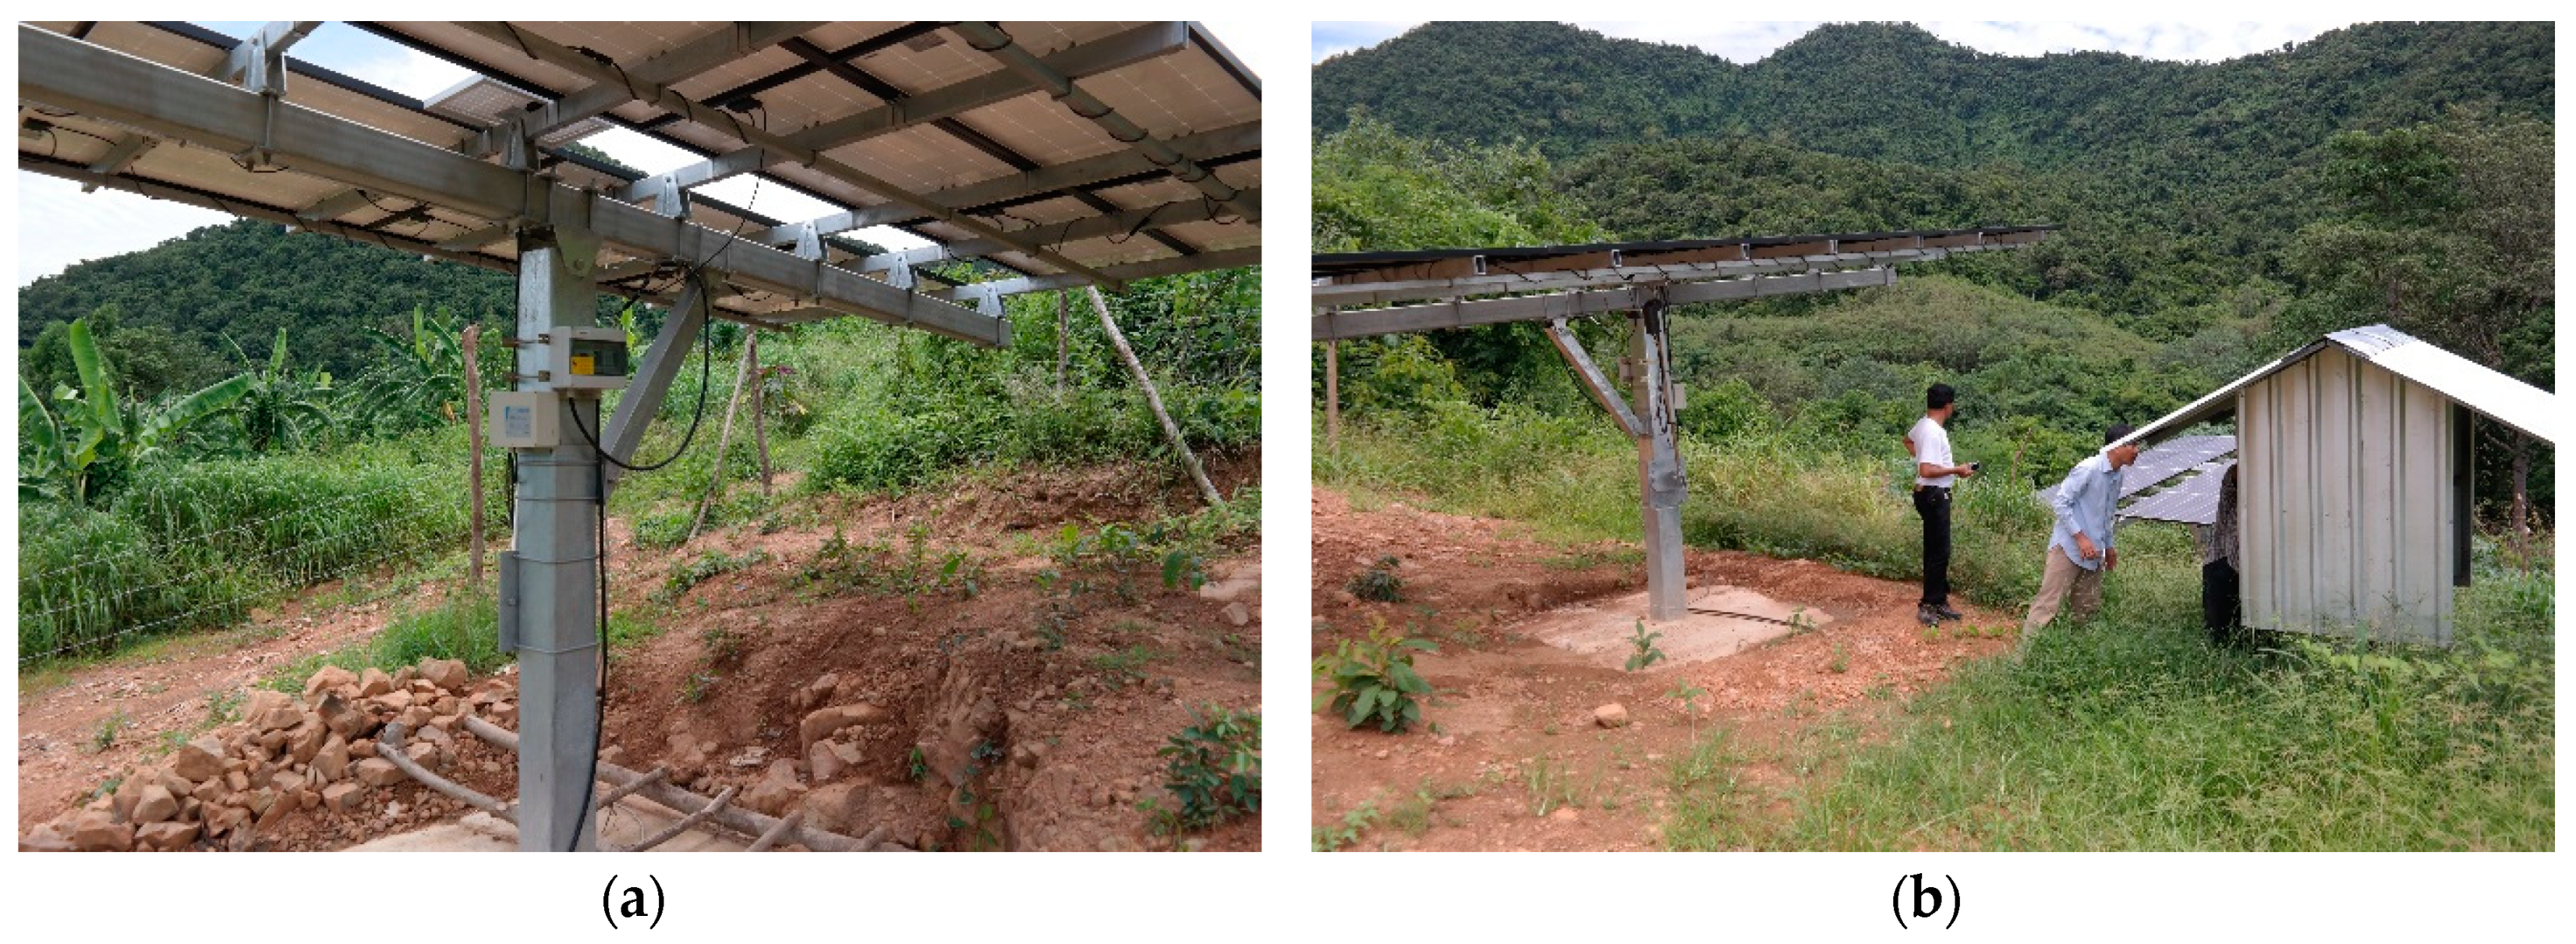
4.3. Design of the Power Conditioning Unit and Control Station

The solar trackers installed under the PV units are shown in Figure 7a, whereas the power conditioning unit installed in the control station is shown in Figure 7b. The conditioning unit contains two crucial components, which are the maximum power point tracker (MPPT) controller and the DC-AC inverter. The MPPT controller is used to harvest the maximum output power from the PV panel at different irradiance from different weather conditions by tracking its output voltage and current to obtain the Vmp and Imp corresponding to the maximum power, thus ensuring the maximum water flow. The most suitable solar pump for installation was an AC-submersible type pump. Based upon the solar input power and the geographic information, the solar water pump was a LORENTZ model PS21K2 C-SJ42-10 [39]. For the solar pumping controller, the allowable maximum DC voltage input from the solar PVs is as high as 850 volts. This DC input is converted into 3-phase 380 volts AC using the DC-AC convertor with its maximum efficiency of 98%. The solar pump can lift water at a total dynamic head between 40 metres and 90 metres. The flow is 60 and 36 m3/h accordingly.

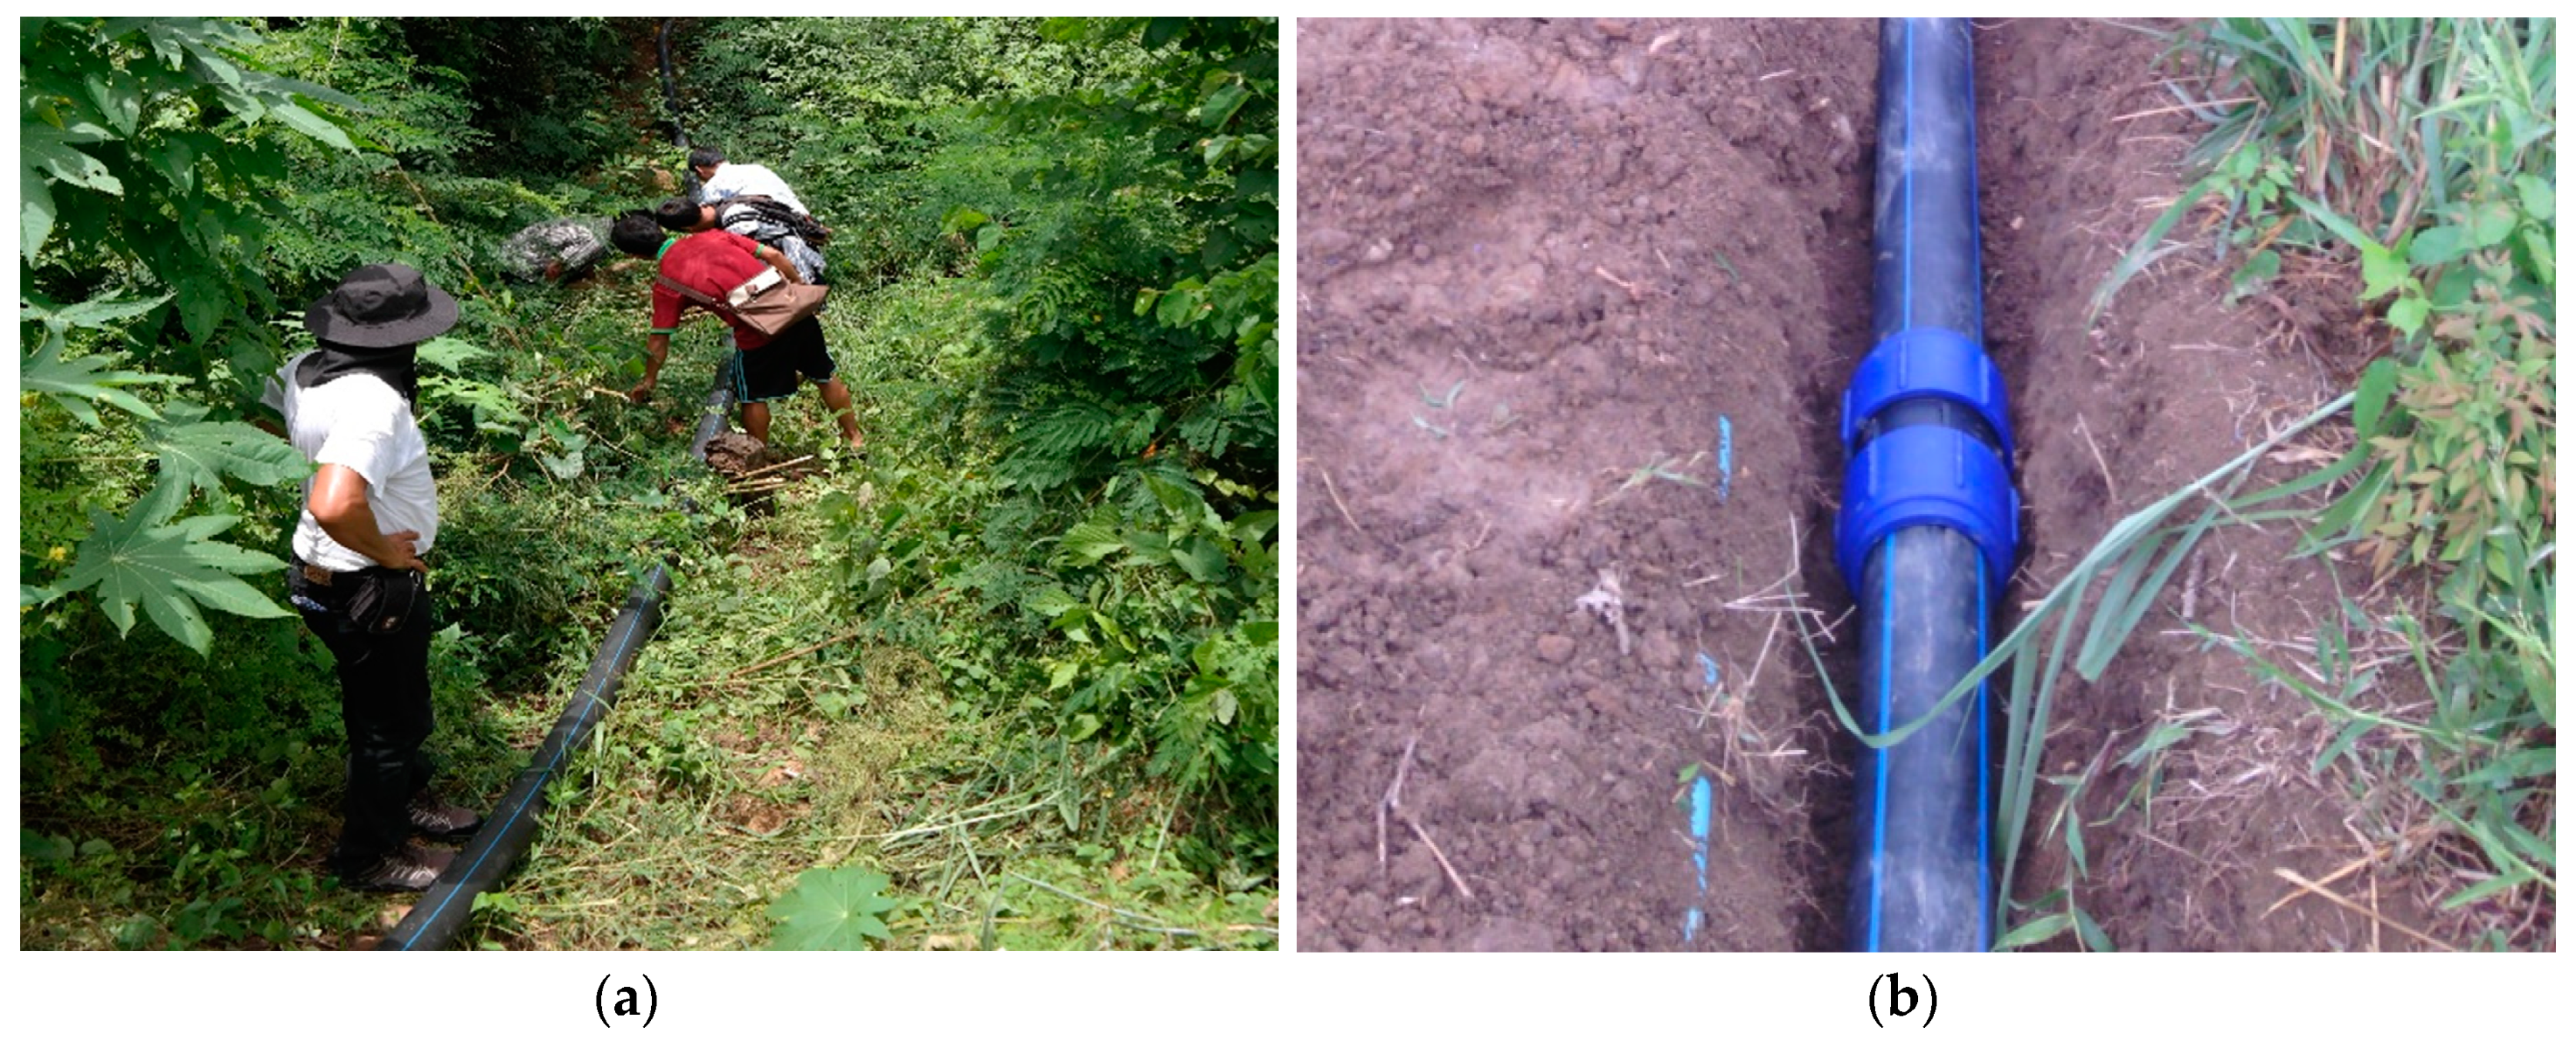
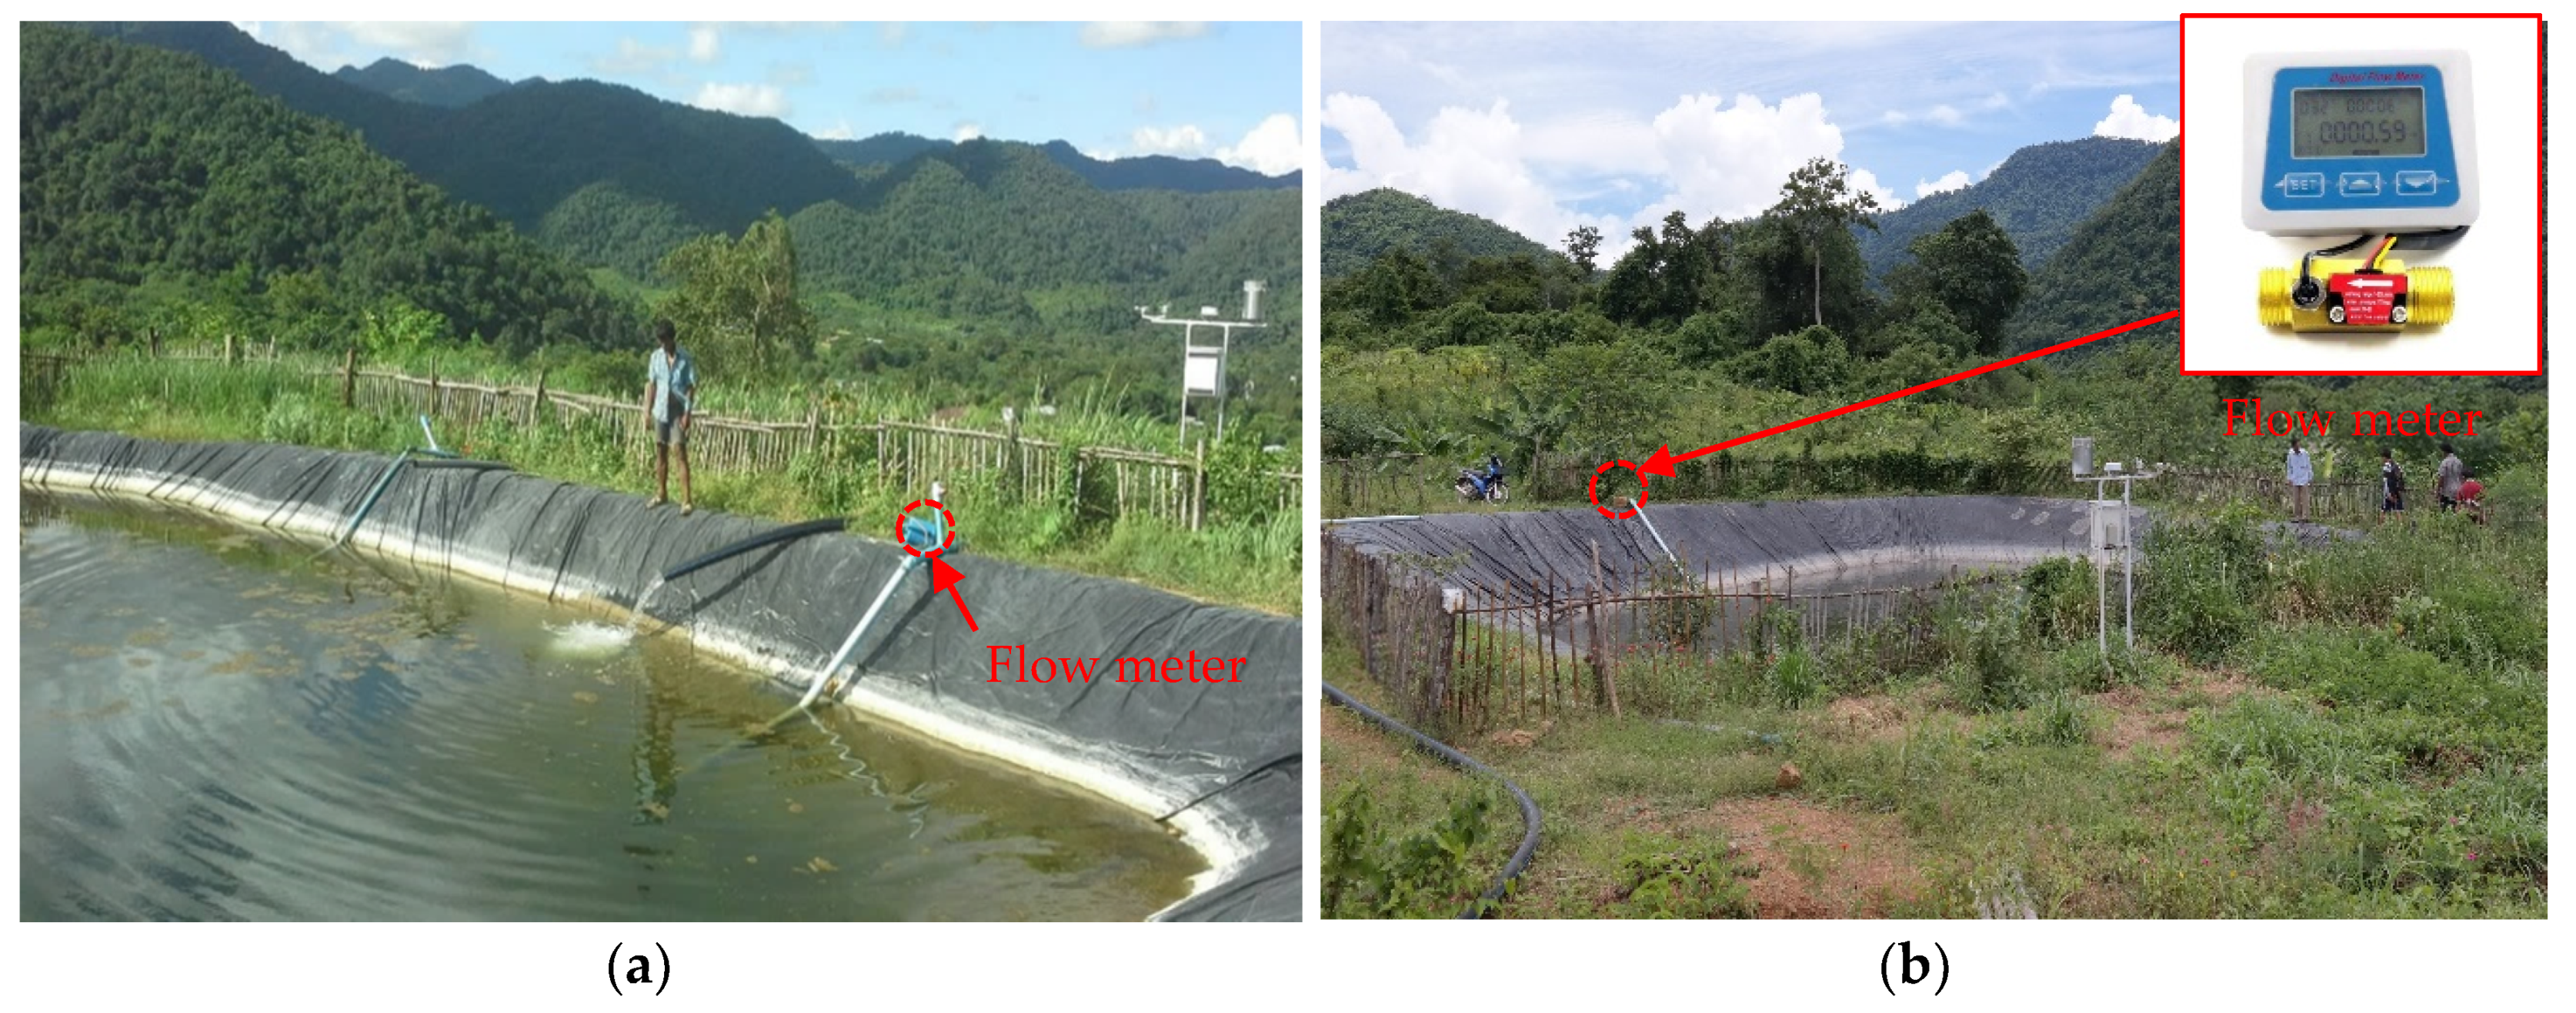
4.4. Analysis of Water Flow and Design of Piping Alignment

In this project, the flow of fluid (water) through a pipe was modelled using the computer software EPaNet v.2.0 [40], which enables the calculation of pressure drops, flow rates, size of the internal diameters of piping system, and pipe length. The flow of fluid through a pipe is characterised by the viscous shear stresses within the liquid and the turbulence that occurs along the pipe’s internal walls, created by the roughness of the pipe material. Such resistance is usually known as pipe friction and is measured by feet or metres head of the fluid, and thus the term head loss (hf) is also used to express the resistance to flow [40]. In this project, the head and friction losses were concerned and Equation (1) was adopted in the analysis. The resistance through various valves and fittings also contributes to the overall head loss. In this project, the losses in the system were designed to minimise and optimise with the piping alignment. However, the resistance through valves and fittings were deemed to have a minor effect on the overall head loss, and, therefore, it was neglected in the design [40,41].
h f = f ( L D ) · ( V 2 2 g )
where hf is the head loss, f is the friction factor, L is the length of pipework, d is the inner diameter of pipework, v is the velocity of the fluid, and g is the acceleration due to gravity.
In this Royal Initiative project, high-density polyethylene (HDPE) material was used as the main water supply pipes. The main advantages of HDPE pipes include easiness of bending, rolling, and welding (either by heat welding or by coupling). In this work, HDPE pipes with an external diameter of 110 mm and with a pressure tolerance of 10 bars (around 100 m) at a distance of 400 m were employed. Moreover, the pipe size made construction simpler as the pipes could be rolled up (100 m), thus facilitating their transportation. Figure 8a,b show a typical pipeline during and installation.
Figure 9 shows field measurements of the water flow at the 1000 m3 Pongluek reservoir and the 1800 m3 Pongluek reservoir. The water flow was measured using the digital flow meter (flow ranges from 1–25 L/min and water pressure resistance > 1.75 MPa) installed at the tip of the pipe before the flow outlet to the reservoirs. All flow data have been recorded automatically, transferred the data logger, and saved on the hard disk in the control house.

4.5. Pump Performance Corresponding to Intermittent Solar Irradiance

Essentially, pumps are designed to perform their best at an specific input power called rated power. Pumps also require different input power thresholds at particular heads in order to perform work. However, in a solar water pumping system, input power is supplied by intermittent solar energy; therefore, solar irradiance has to be more than a specific value to initiate the pump, and the rated input power should be supplied to perform their best performance. As solar irradiance varies depending on the time of the year, weather conditions and climatic pattern, understanding pumps’ performance associated with different solar input conditions is essential to select a suitable installation component for future solar water projects, e.g., PV panels and pumps, for their optimum overall system performances.
The PV power production (which is used as the pump input power) was calculated based on a one-diode model because of its high accuracy and simple equations, as presented in Equation (2) to Equation (7), where I is the PV output current, I H P is the photo current, I D is the diode current, I H S is the shunt current, N p is the number of PV cells in a PV panel in parallel, I S C is the short circuit current, K i is the temperature coefficient, T v p is the PV cell temperature, T v p _ C T S is the PV cell temperature at standard test condition (STC), G is the irradiance, I s is the saturation current, q is the electron charge, k is the Boltzmann’s constant, n is the ideal factor, N s is the number of PV cells in a PV panel in series, R s is the series resistance of the module, I S R is the reverse saturation current, R H S is the module’s shunt resistance, E g is the band-gap energy of the semiconductor used in the PV cell, V c o is the opened circuit voltage, and V t is the thermal voltage of the module [19,42]. The PV cells’ temperature ( T p v ) was obtained from Equation (8) when irradiance ( G T ), ambient temperature ( T a ) and free-stream wind speed ( V f ) were not at STC [43]. All other PV module’s parameters are given in its datasheet, as presented in Table 3. With the installed MPPT controller, the power output from the solar arrays can be calculated using Equation (9).
I = I H P I D I H S
I H P = N p [ I C S + K i ( T v p T v p _ C T S ) ] G G C T S
I D =   N p I s { p x e ( q k T v p n ( V N s + I R s N p ) ) 1 }
I H S = N p V + N S I S R N S R H S
I S = I S R ( T v p T v p _ C T S ) 3 × p x e ( q E g n k ( 1 T v p _ C T S + 1 T v p ) )
I S R = I C S p x e ( V c o N s n V t ) 1
T p v =   T a + ( 0.32 8.91 + 2.0 V f ) G T ;   ( V f > 0   m / s )
P p v _ o u t   =   I m p · V m p η M P P T
The annual performance of the solar water pumping system may be acquired by analysing the solar irradiance and other weather parameters during a year corresponding to the pump parameters. However, doing such calculation during a year is tedious in terms of computational time. Therefore, this study selects three representative days of each month (1 = a sunny day, 2 = a partly cloudy day, and 3 = a rainy day) for the calculation and analyses of long-term historical data. This is then used to determine the number of the day of each representative condition on each month to perform an annual performance of the integrated system. The method proposed in this study could save a considerable amount of computational time. With the intermittent power output from the PV array in each studied day, the pump performance can be accurately predicted, and the precise annual performance of the solar water pumping could be revealed.

5. Results and Discussion

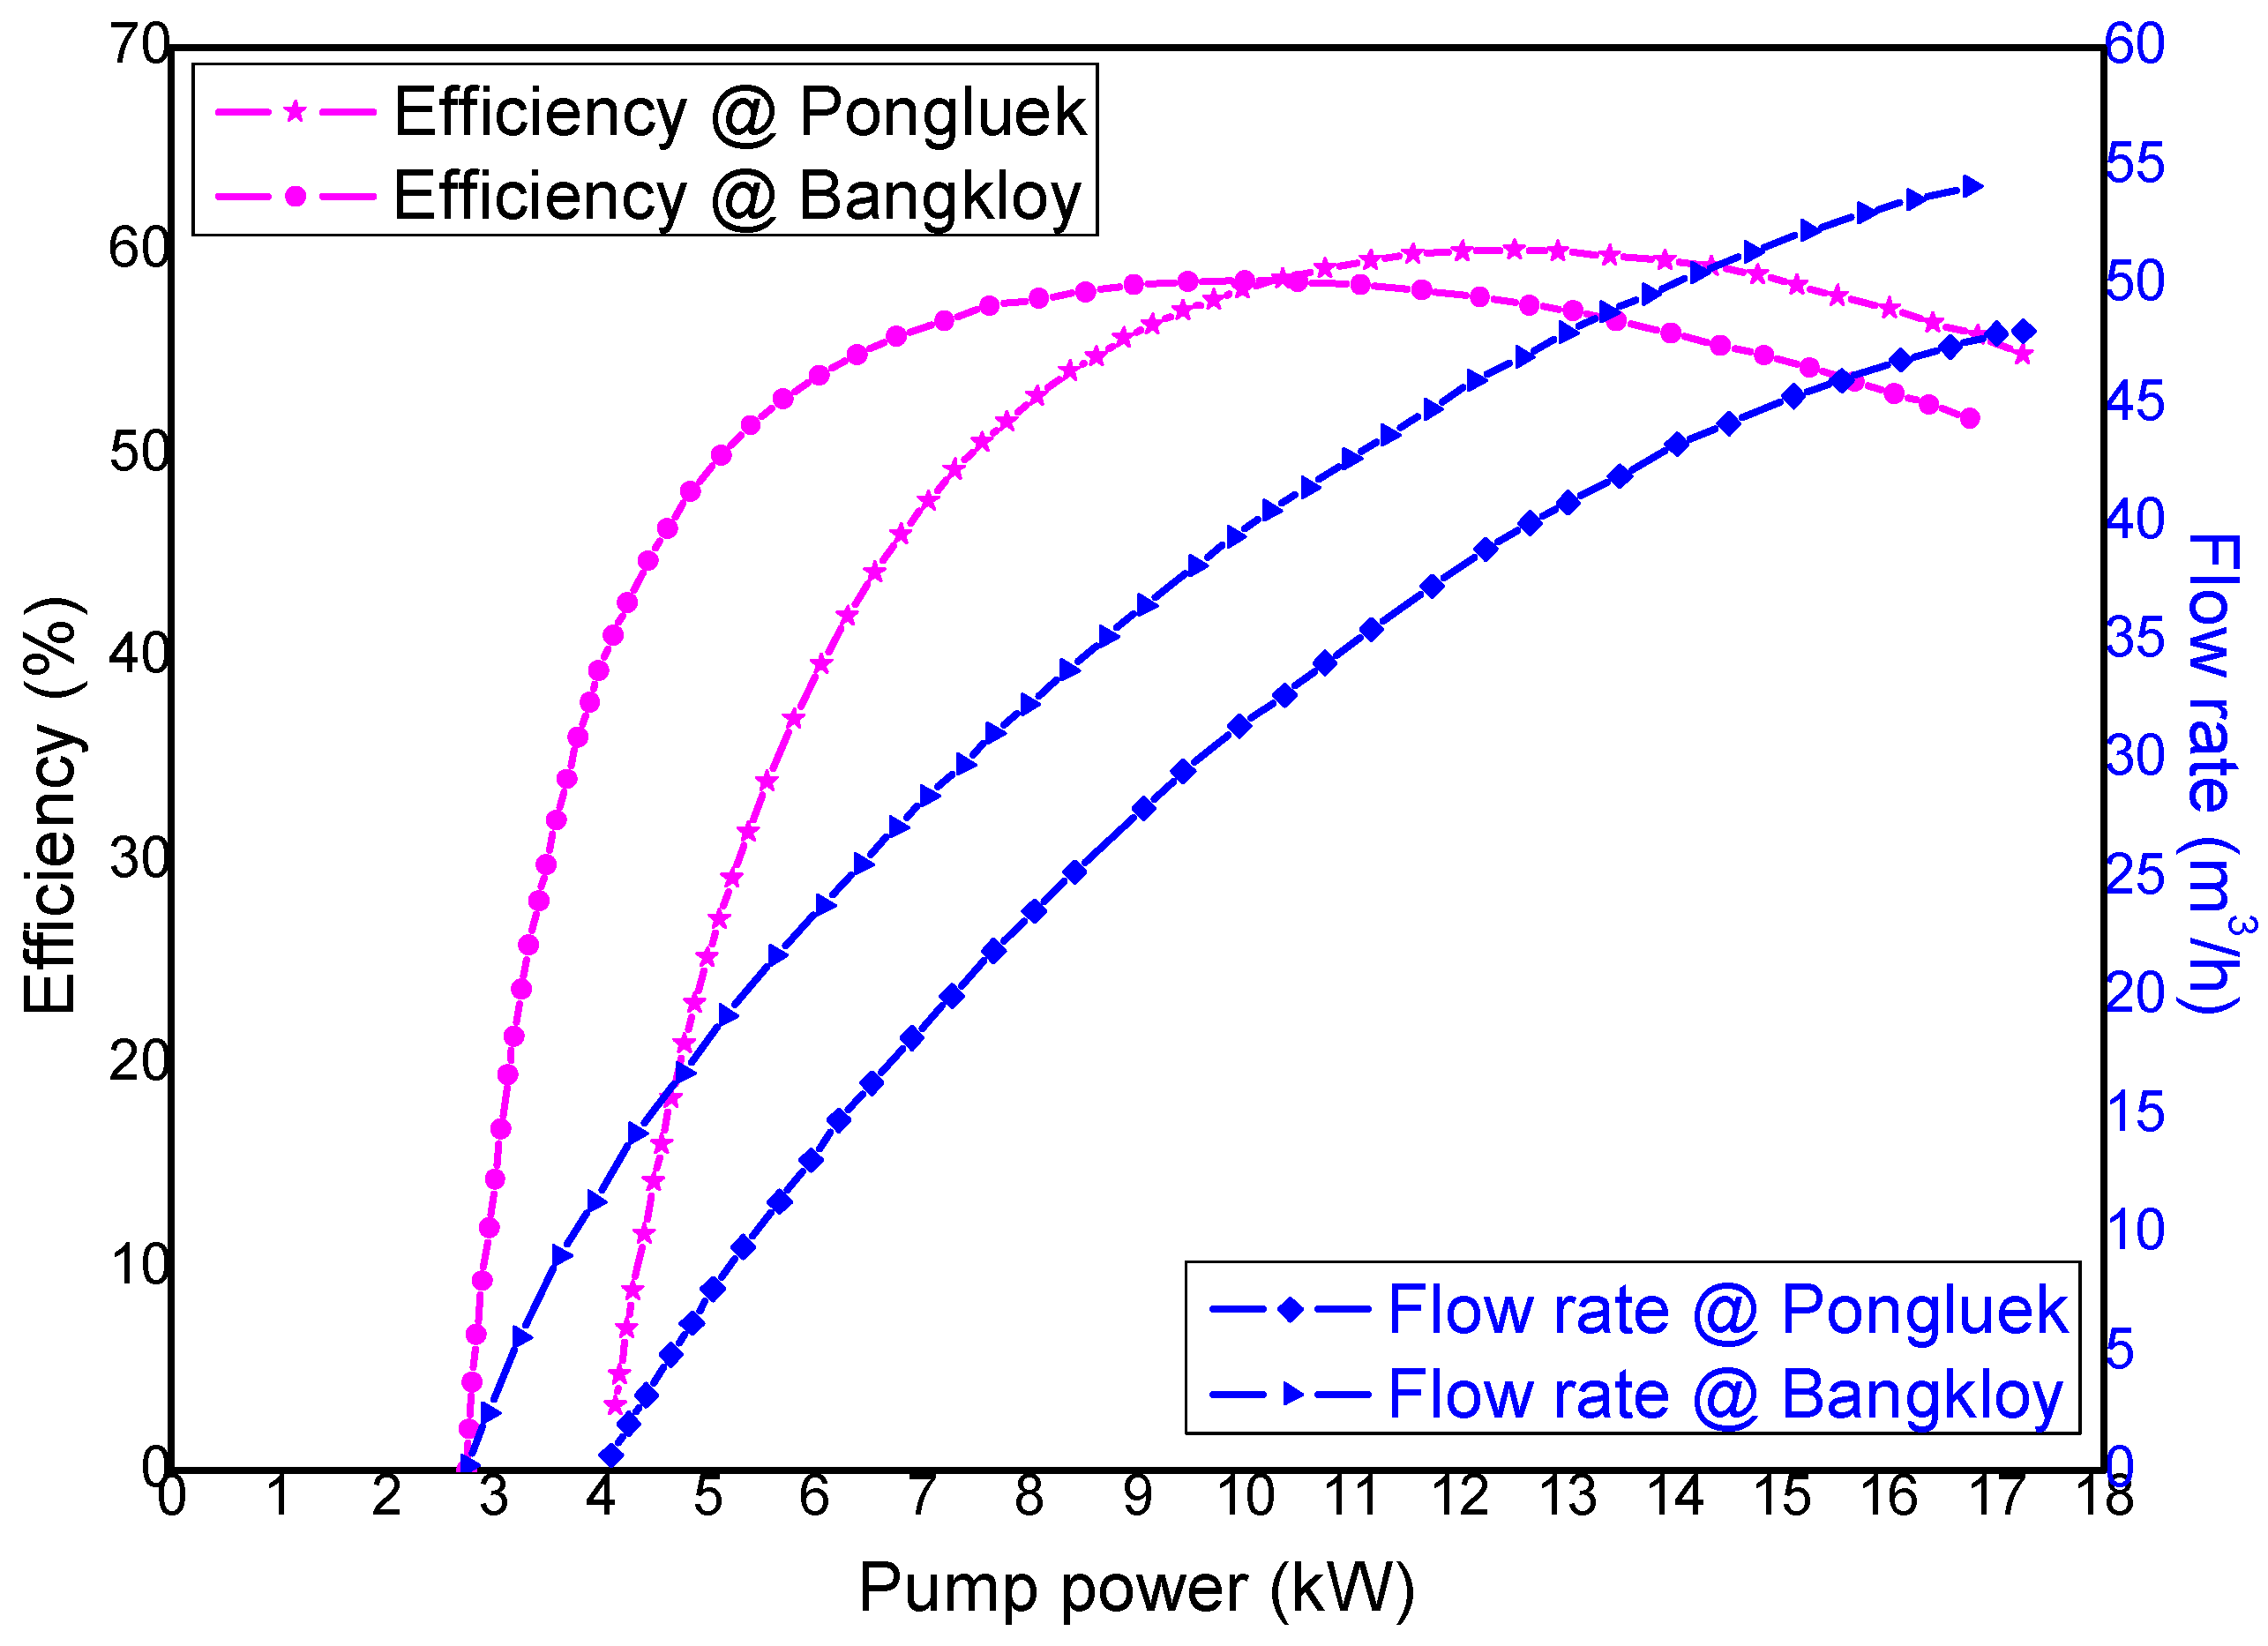
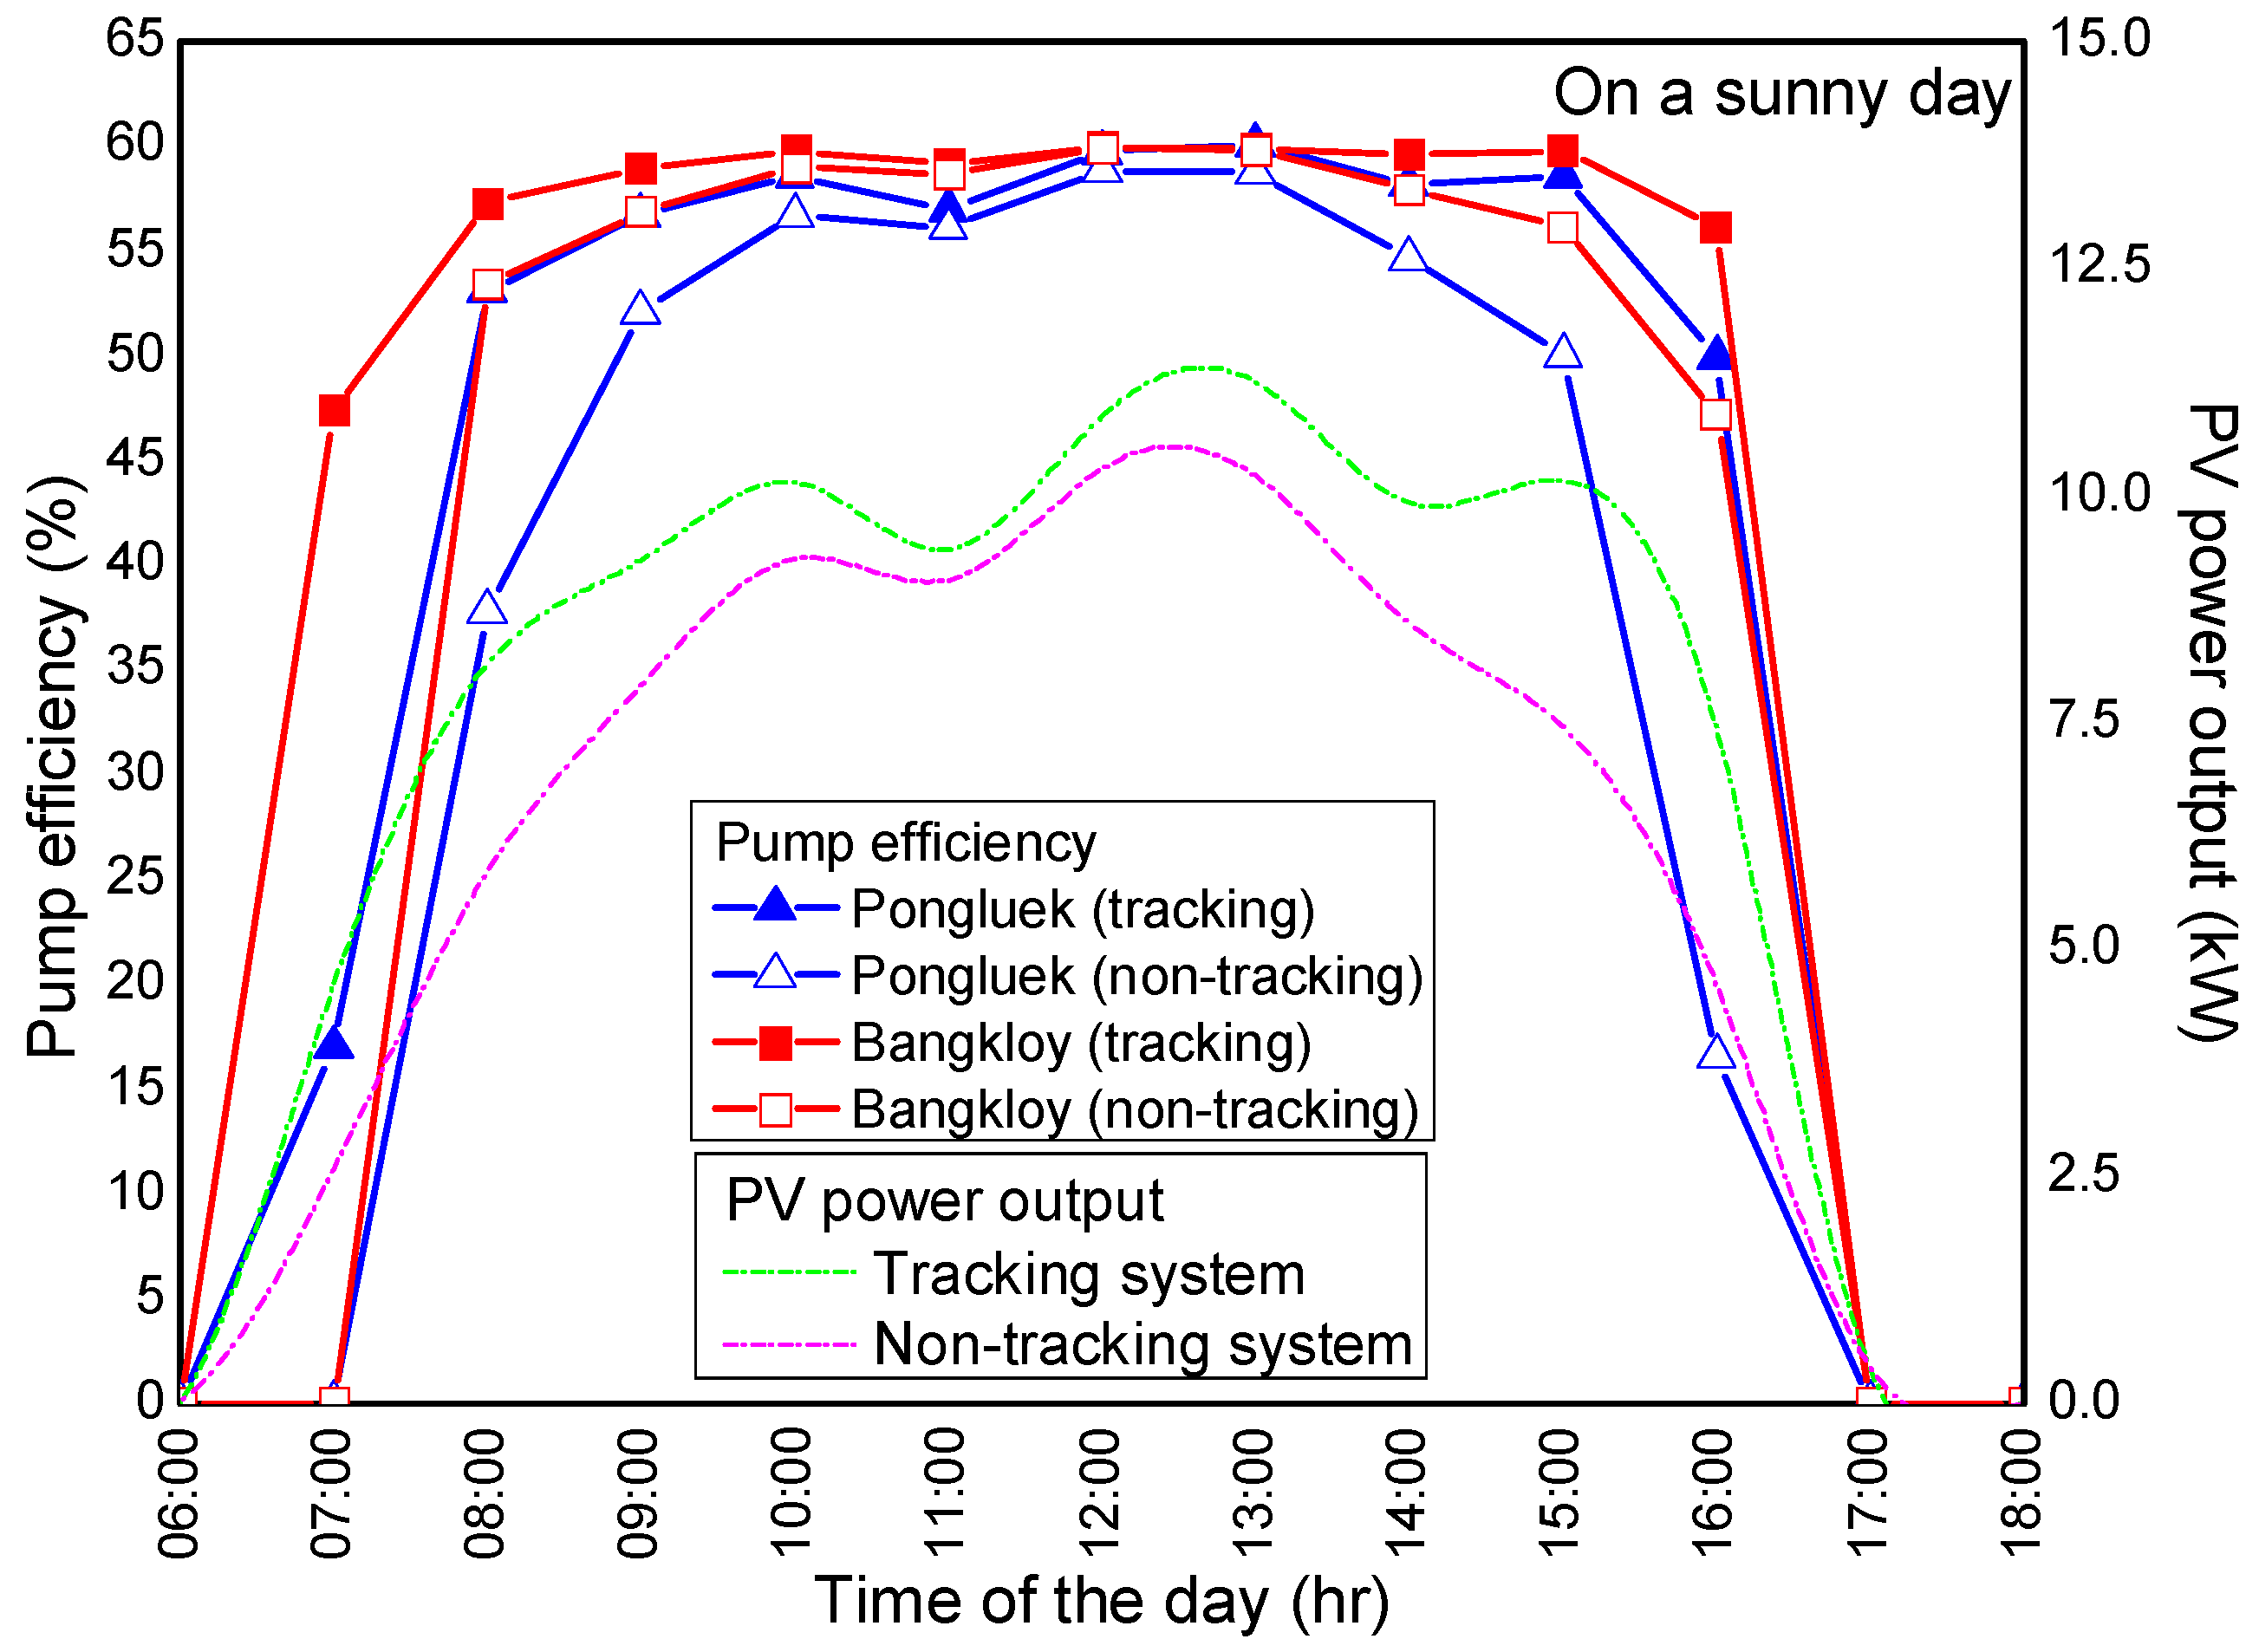
5.1. Manufactured Pump Performance

Figure 10 illustrates the results of the software from LORENTZ [39] used to predict the pump performance curves. The results are useful for system engineers looking for the relations among the electrical power input and output, the output water flow, and other significant engineering data that will be used as input parameters for modeling the water flow in the EPaNet program. There are three columns used for analysis when solar radiations are different: minimum, actual, and maximum points.

5.2. Electrical Power Output From Non-Tracked and Tracked PV Arrays

The annual irradiation of the horizontal surface (at 0° tilted angle), non-tracking surface, and tracking surface are presented in Figure 11. The optimum tilted angles are 14° and 38° for the non-tracking system and the single-axis tracking system, respectively. The optimum tilted angles are applied in the case-study villages. Considering the horizontal solar irradiance in specific weather conditions (sunny and cloudy) in different seasons in January (winter), April (summer), July (rainy) and October (rainy) presented in Figure 12, it can be seen that the solar irradiance is at its peak in July in the rainy season. However, based on the horizontal daily solar radiation presented in Table 2, the average irradiation in July is close to its lowest value. Therefore, the number of days in every month of a year for different weather conditions were proposed in this article for monthly water flow rate prediction, as shown in Table 4, according to the historical data of the solar irradiance at the case-study villages. For cloudy days in every season, the solar irradiance is approximately the same. For rainy days, according to the measurement data, the diffused irradiance is not intense enough for the pumps at both locations to operate, which is favorable, as, on rainy days, water is already sufficient from the rain.

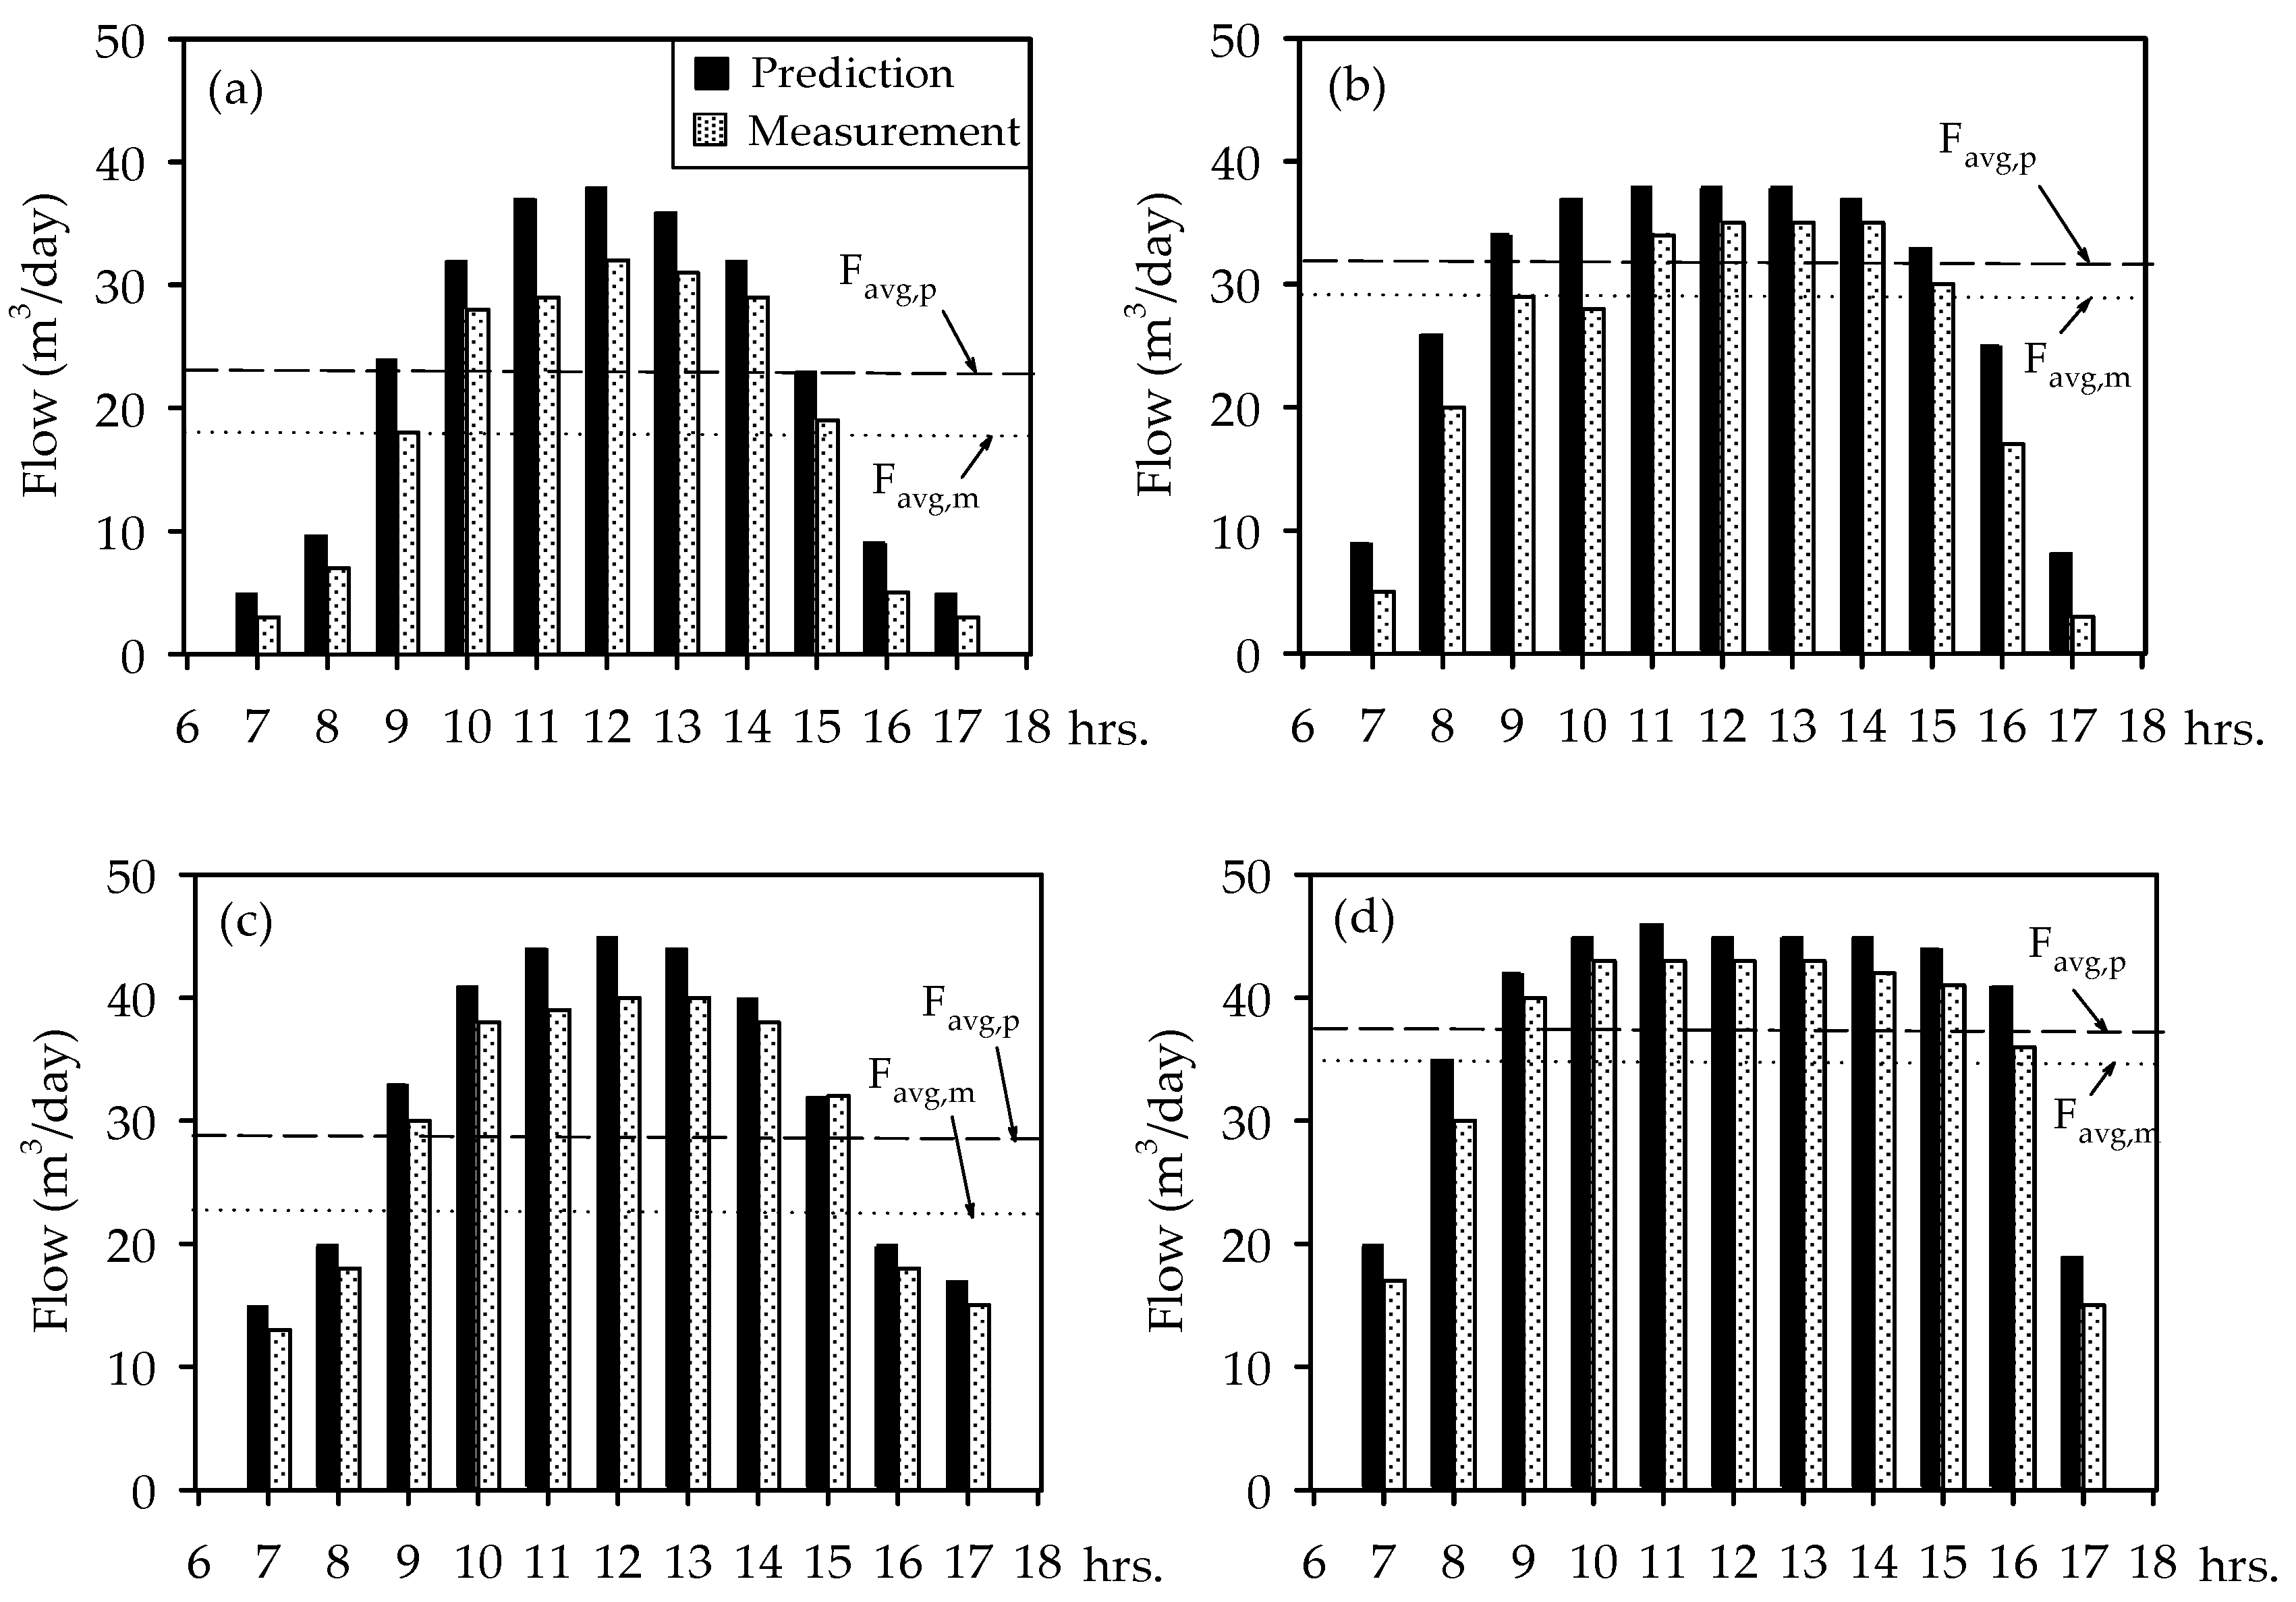
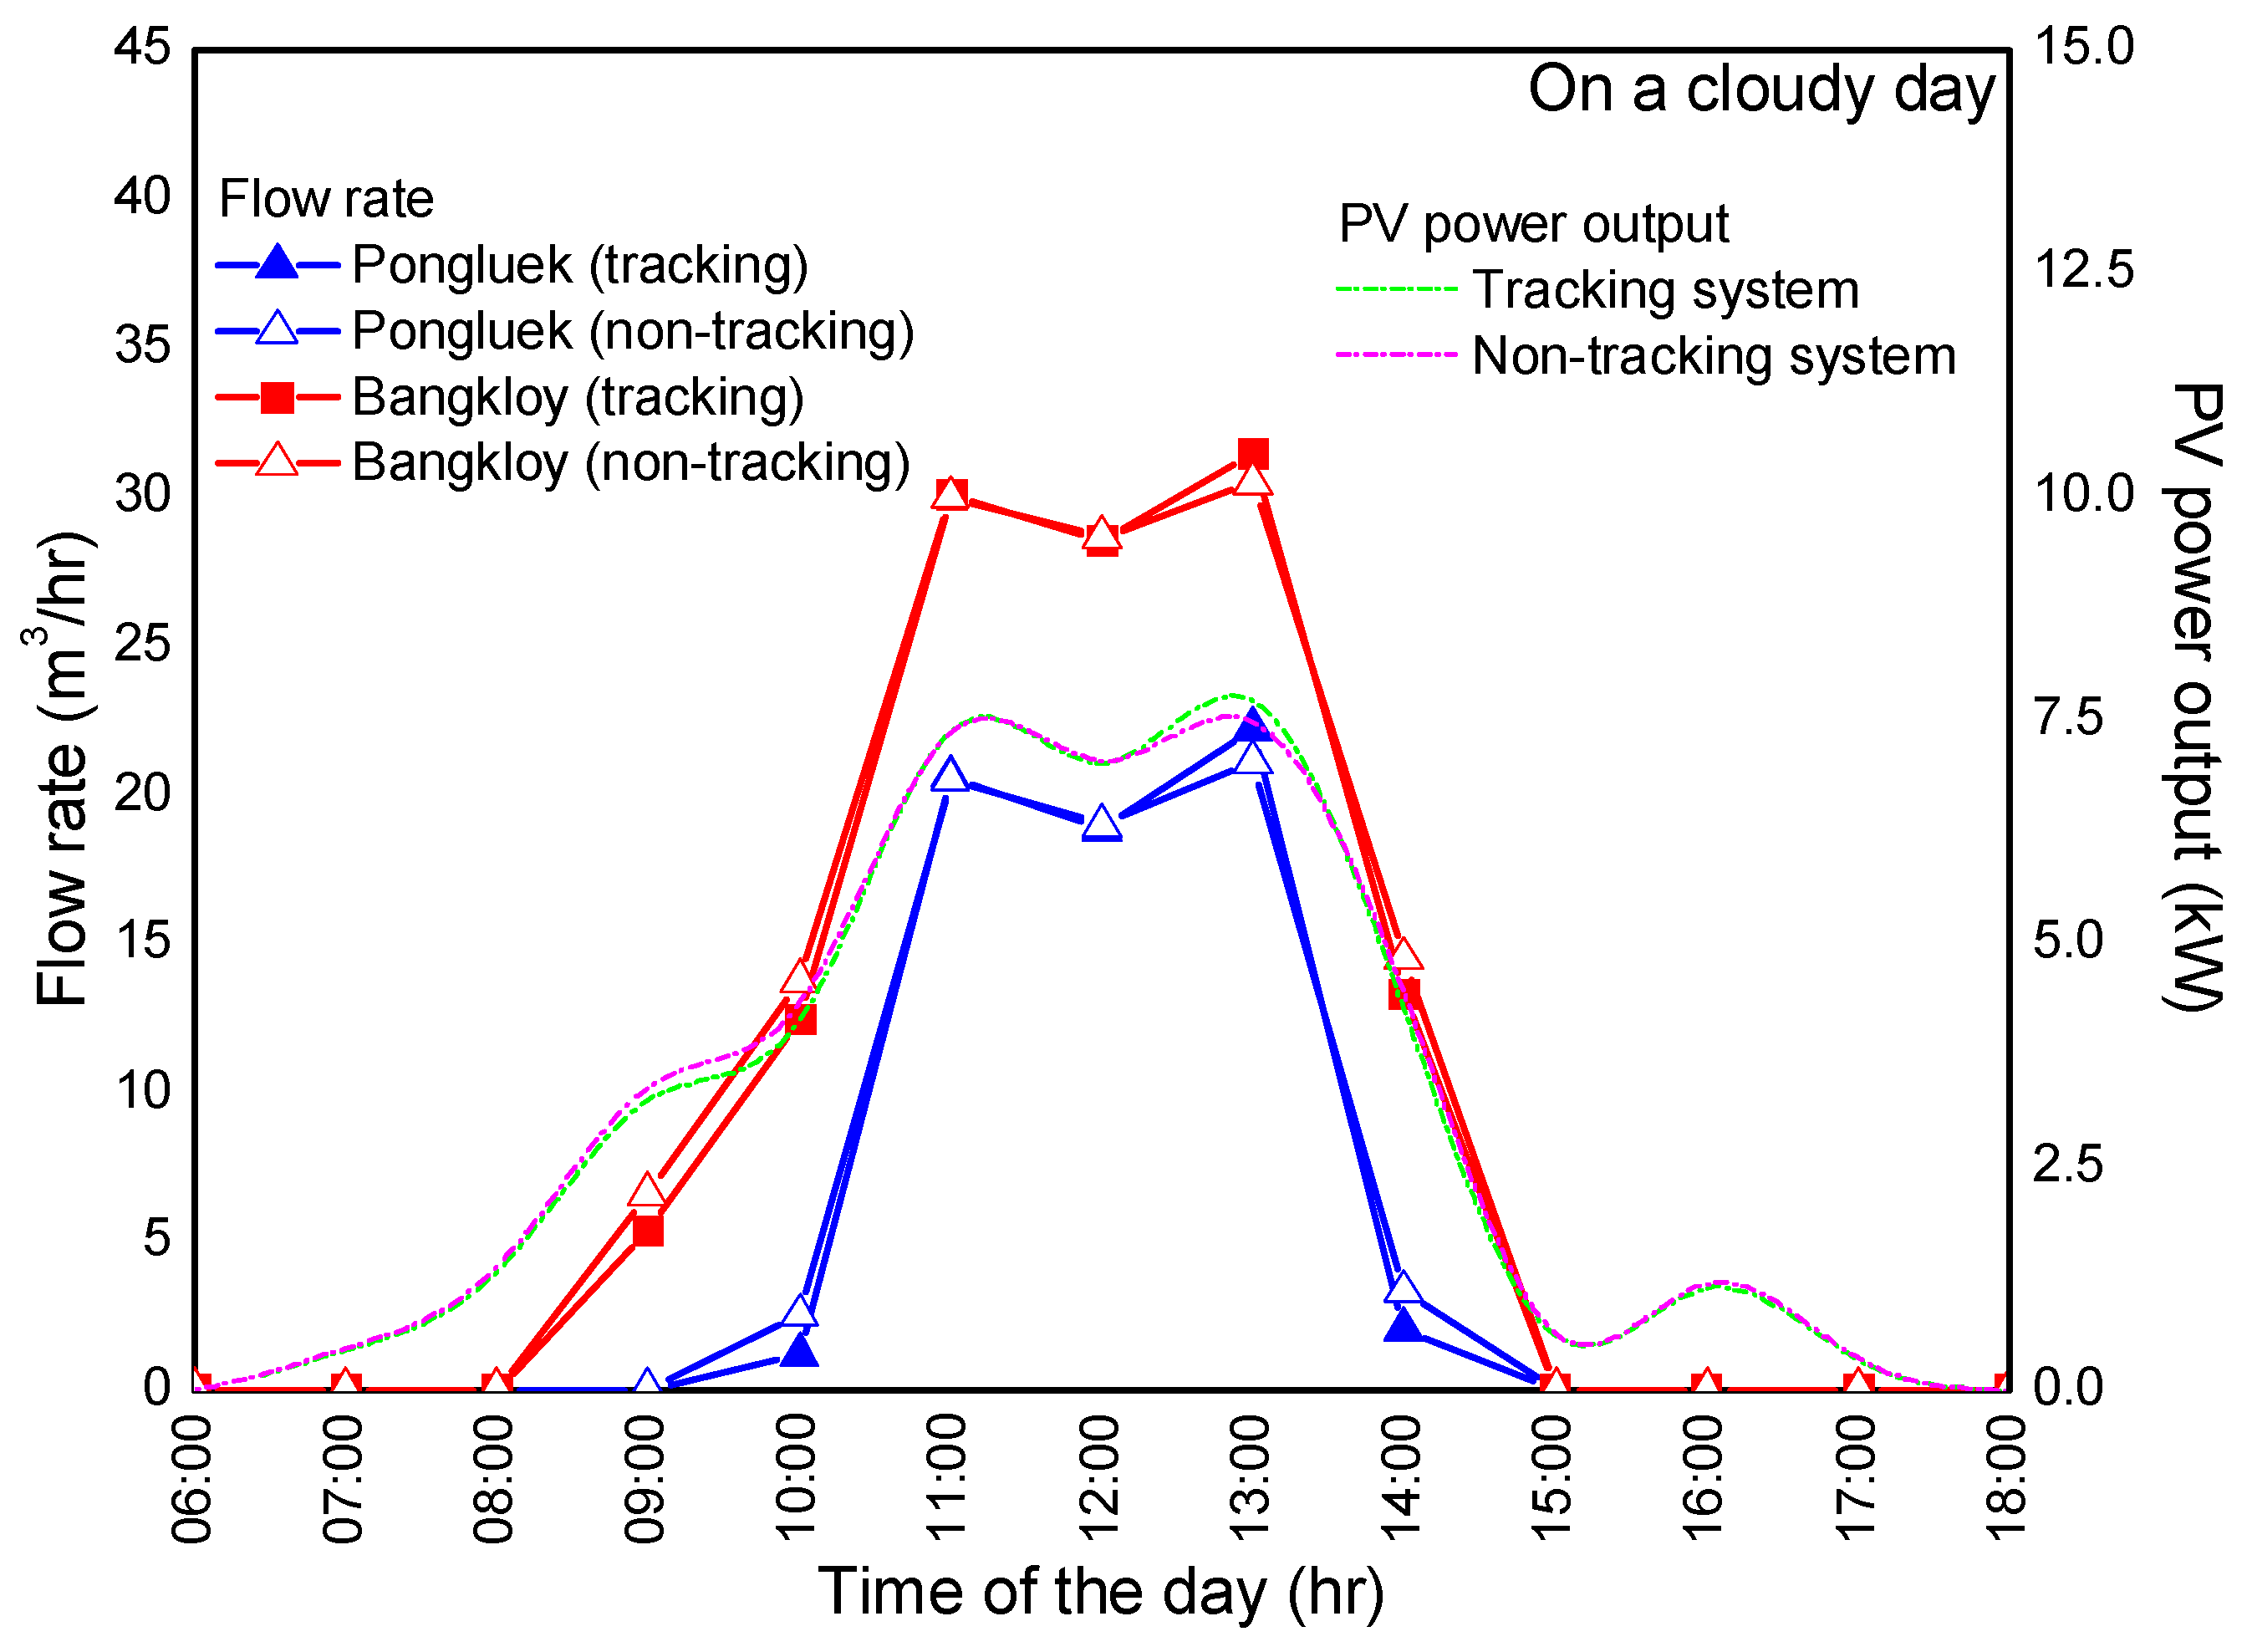
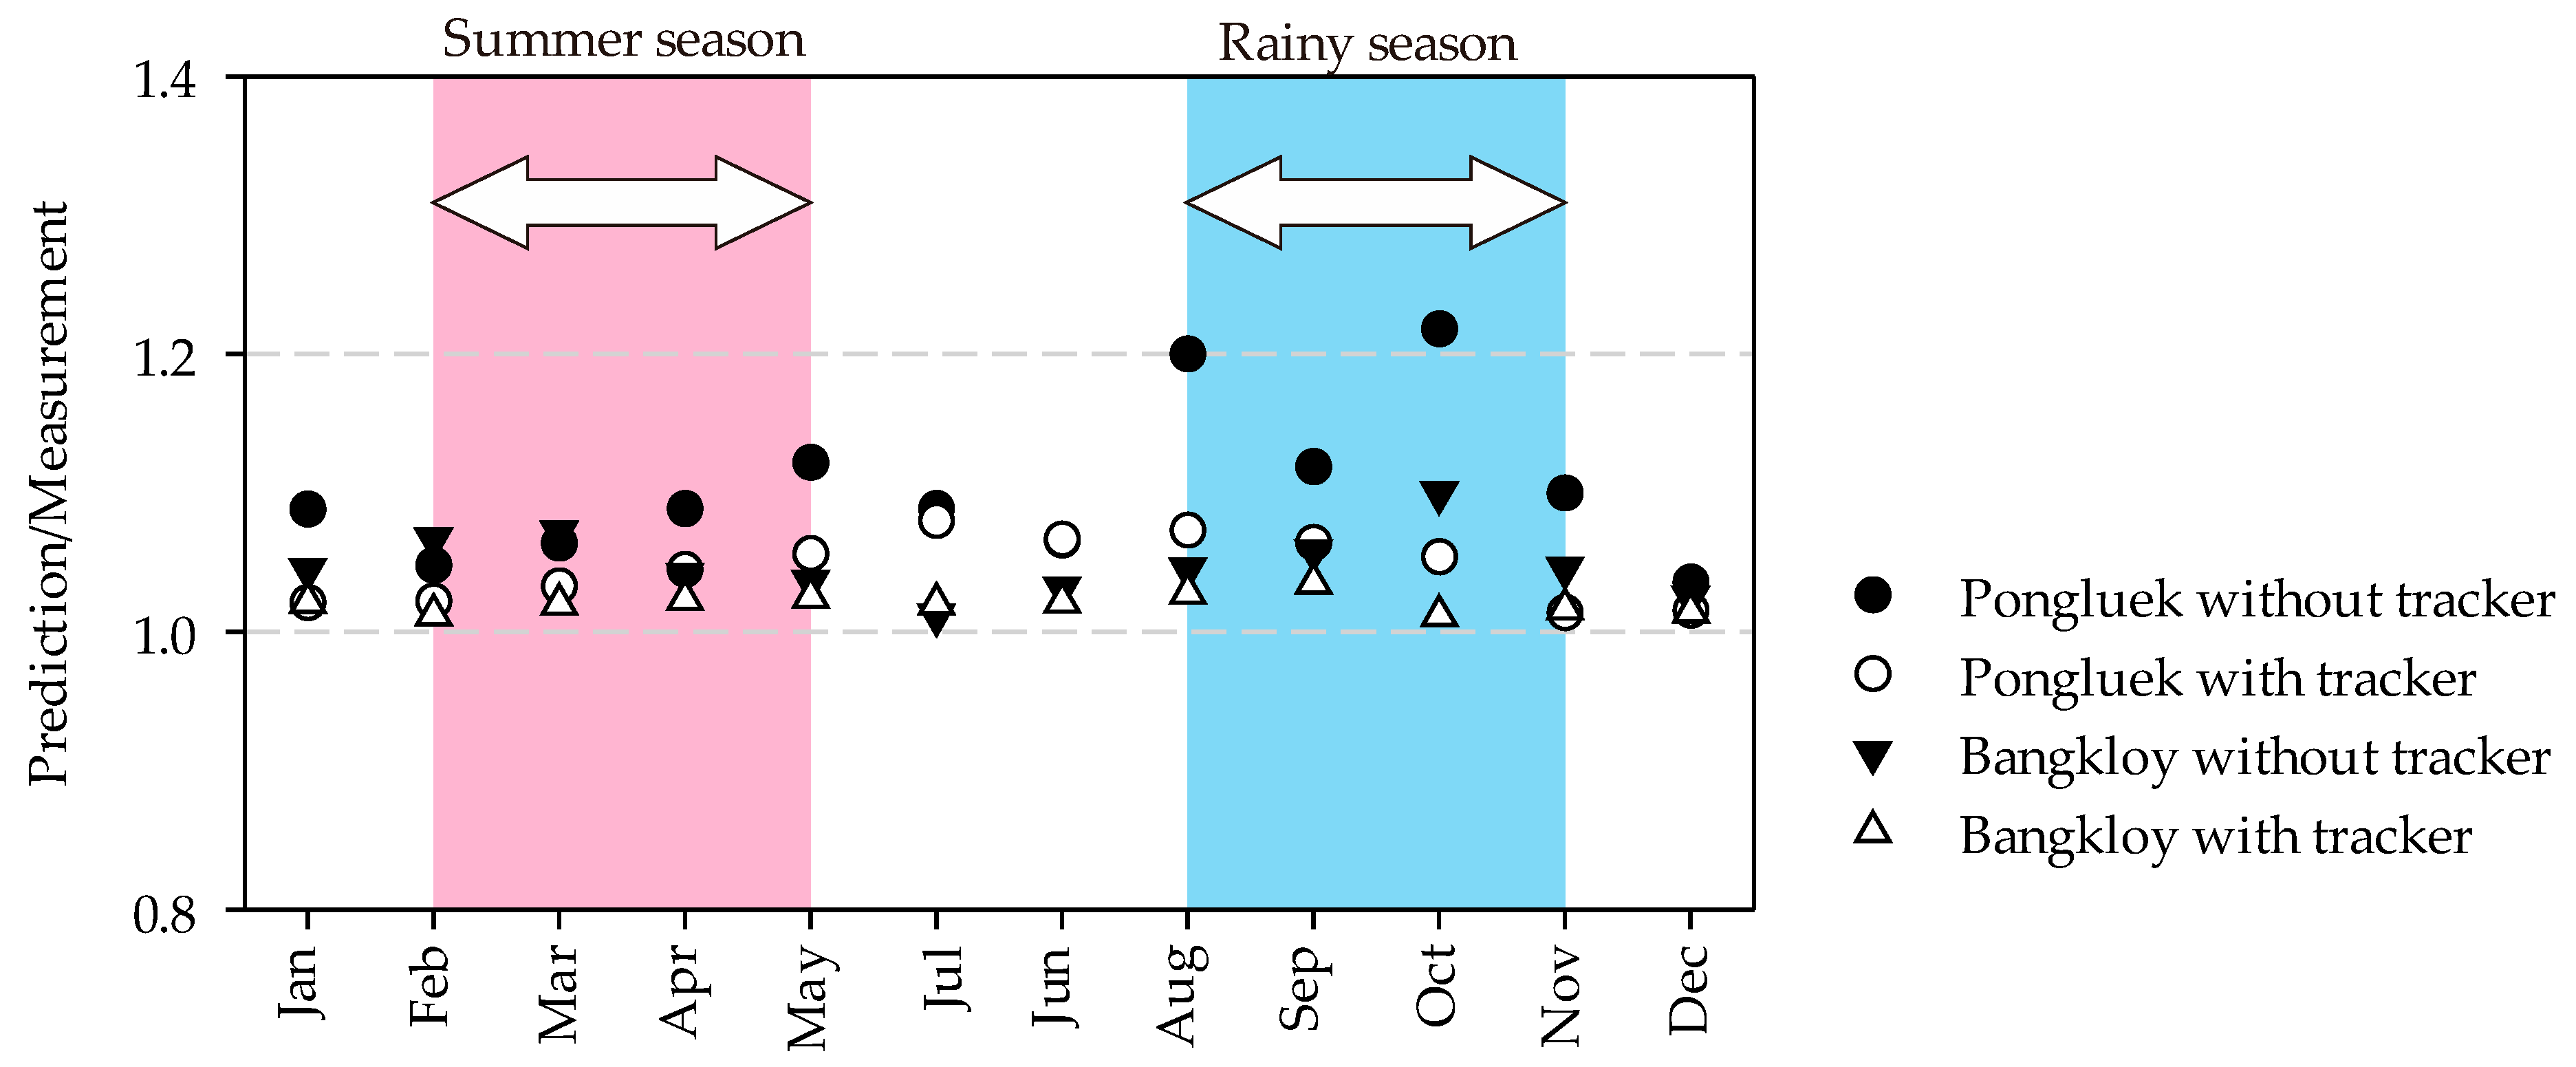
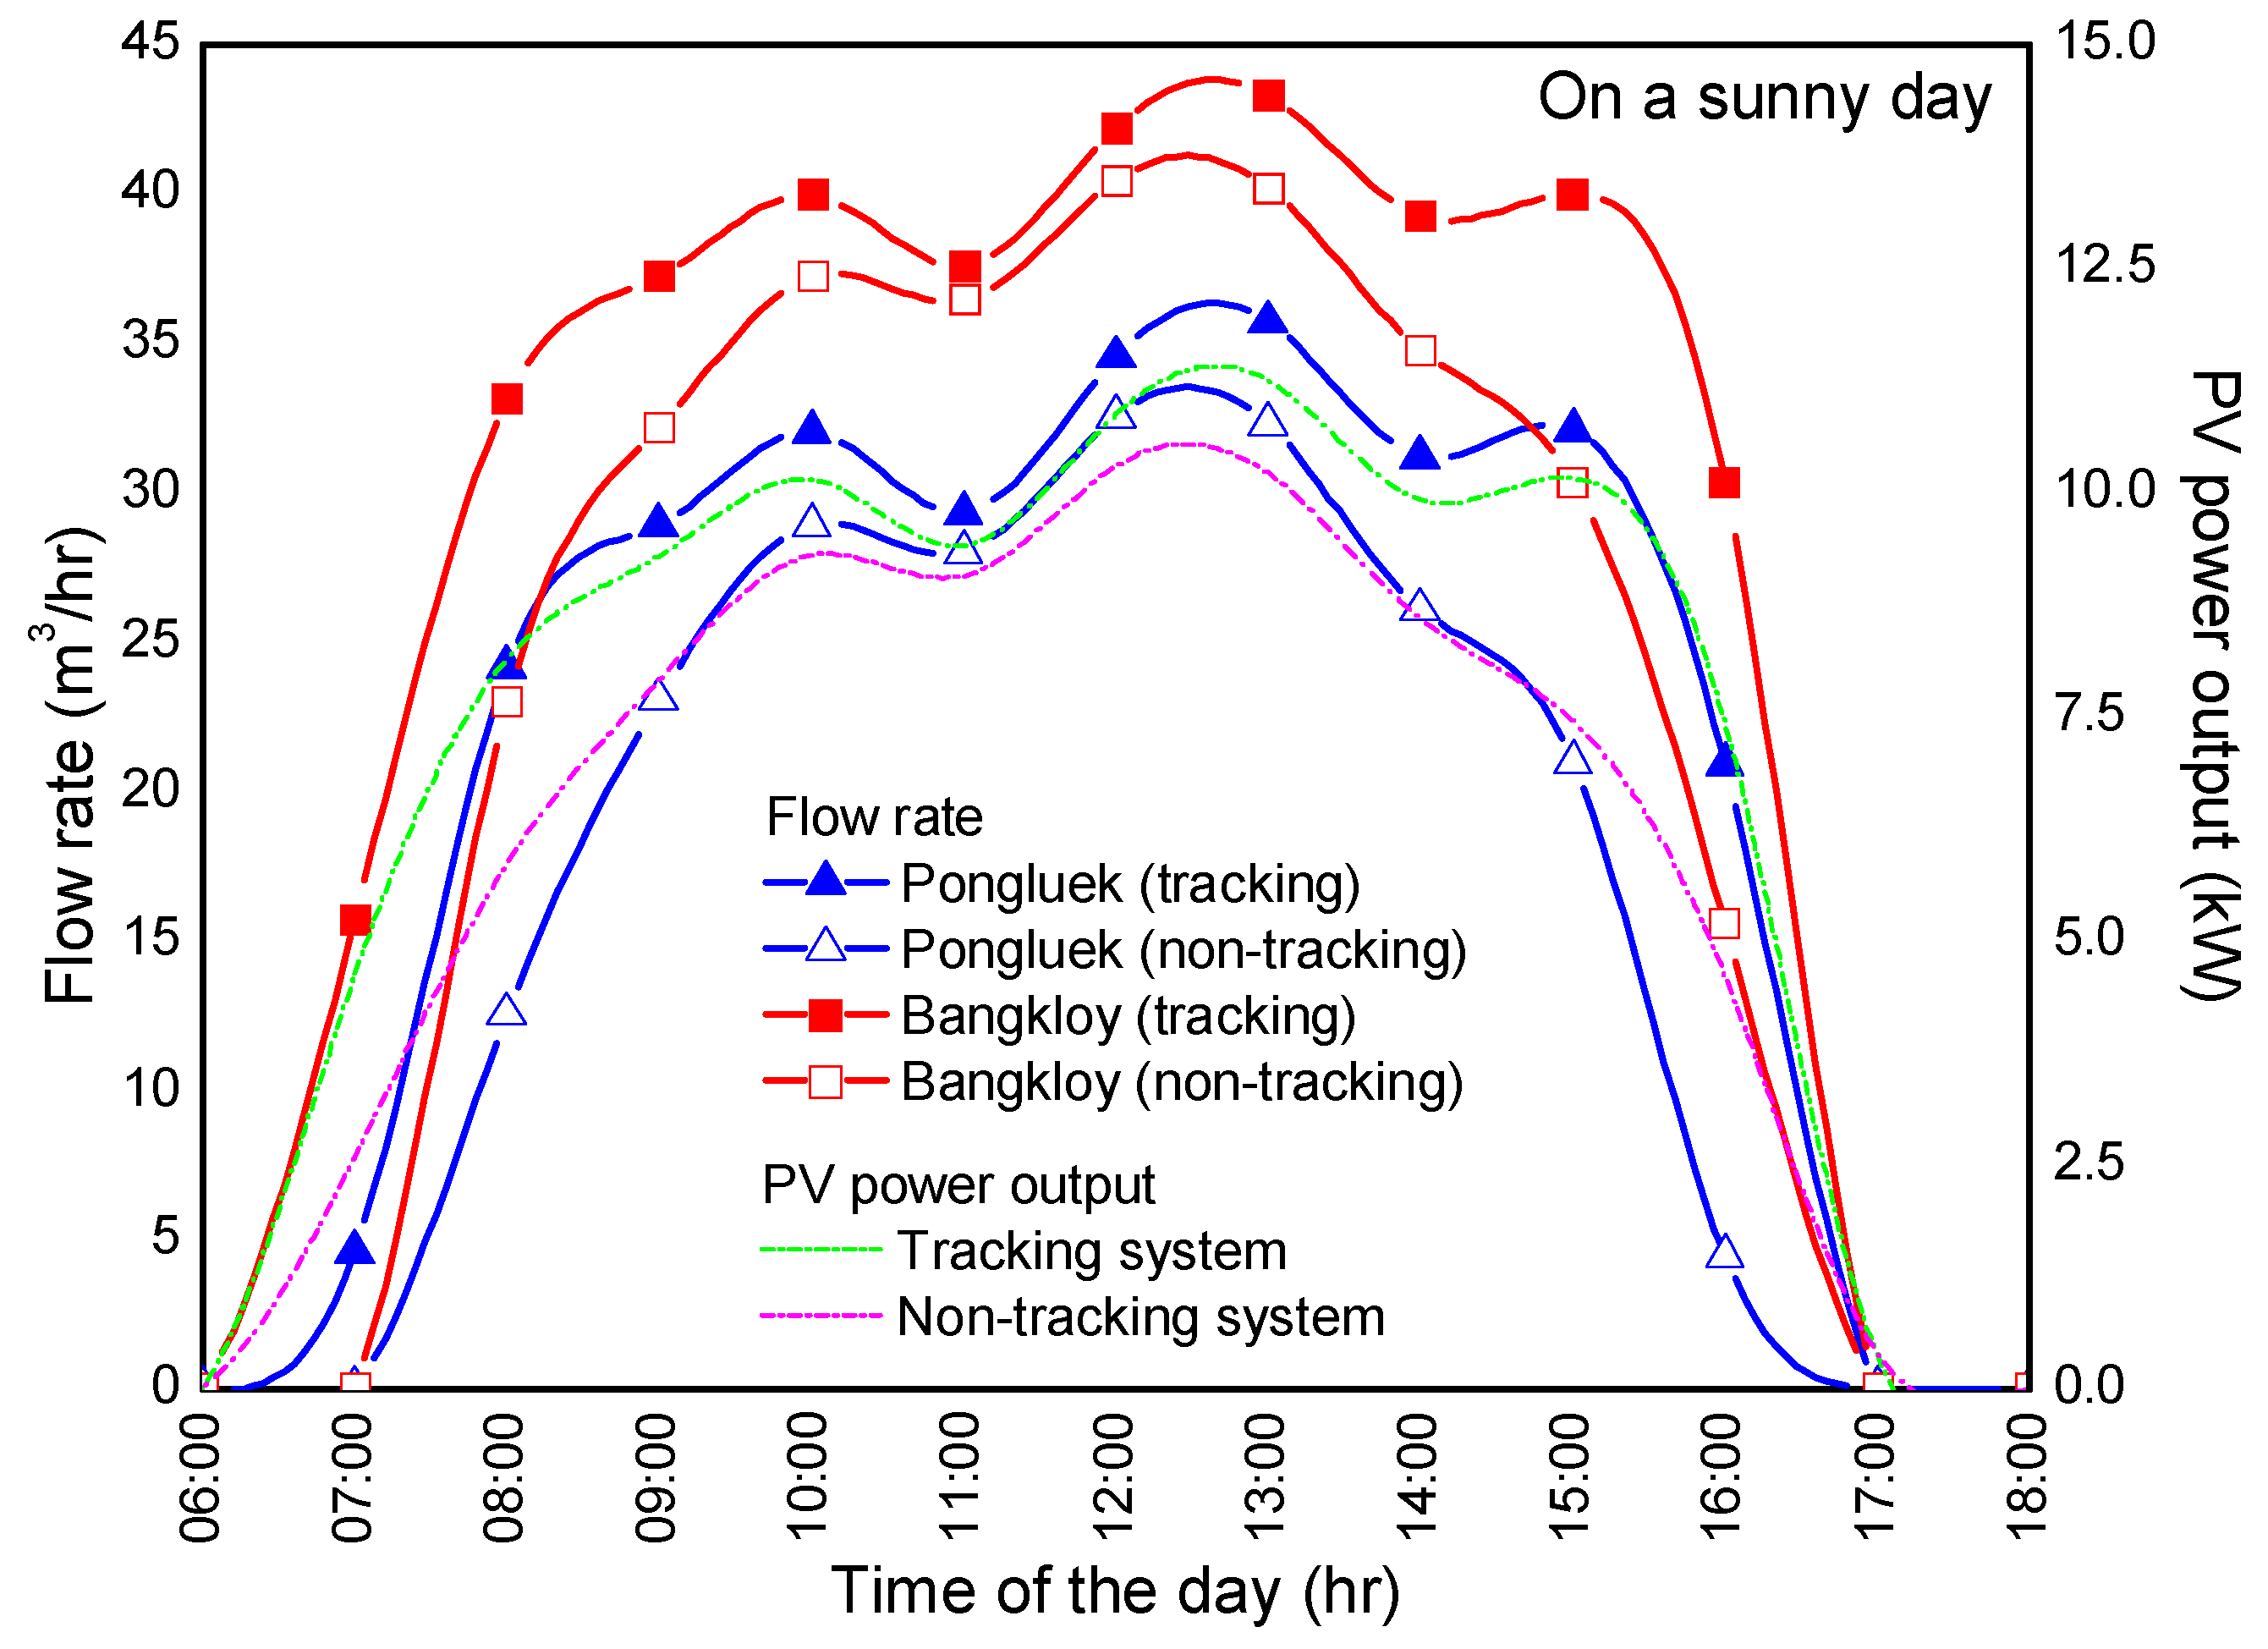
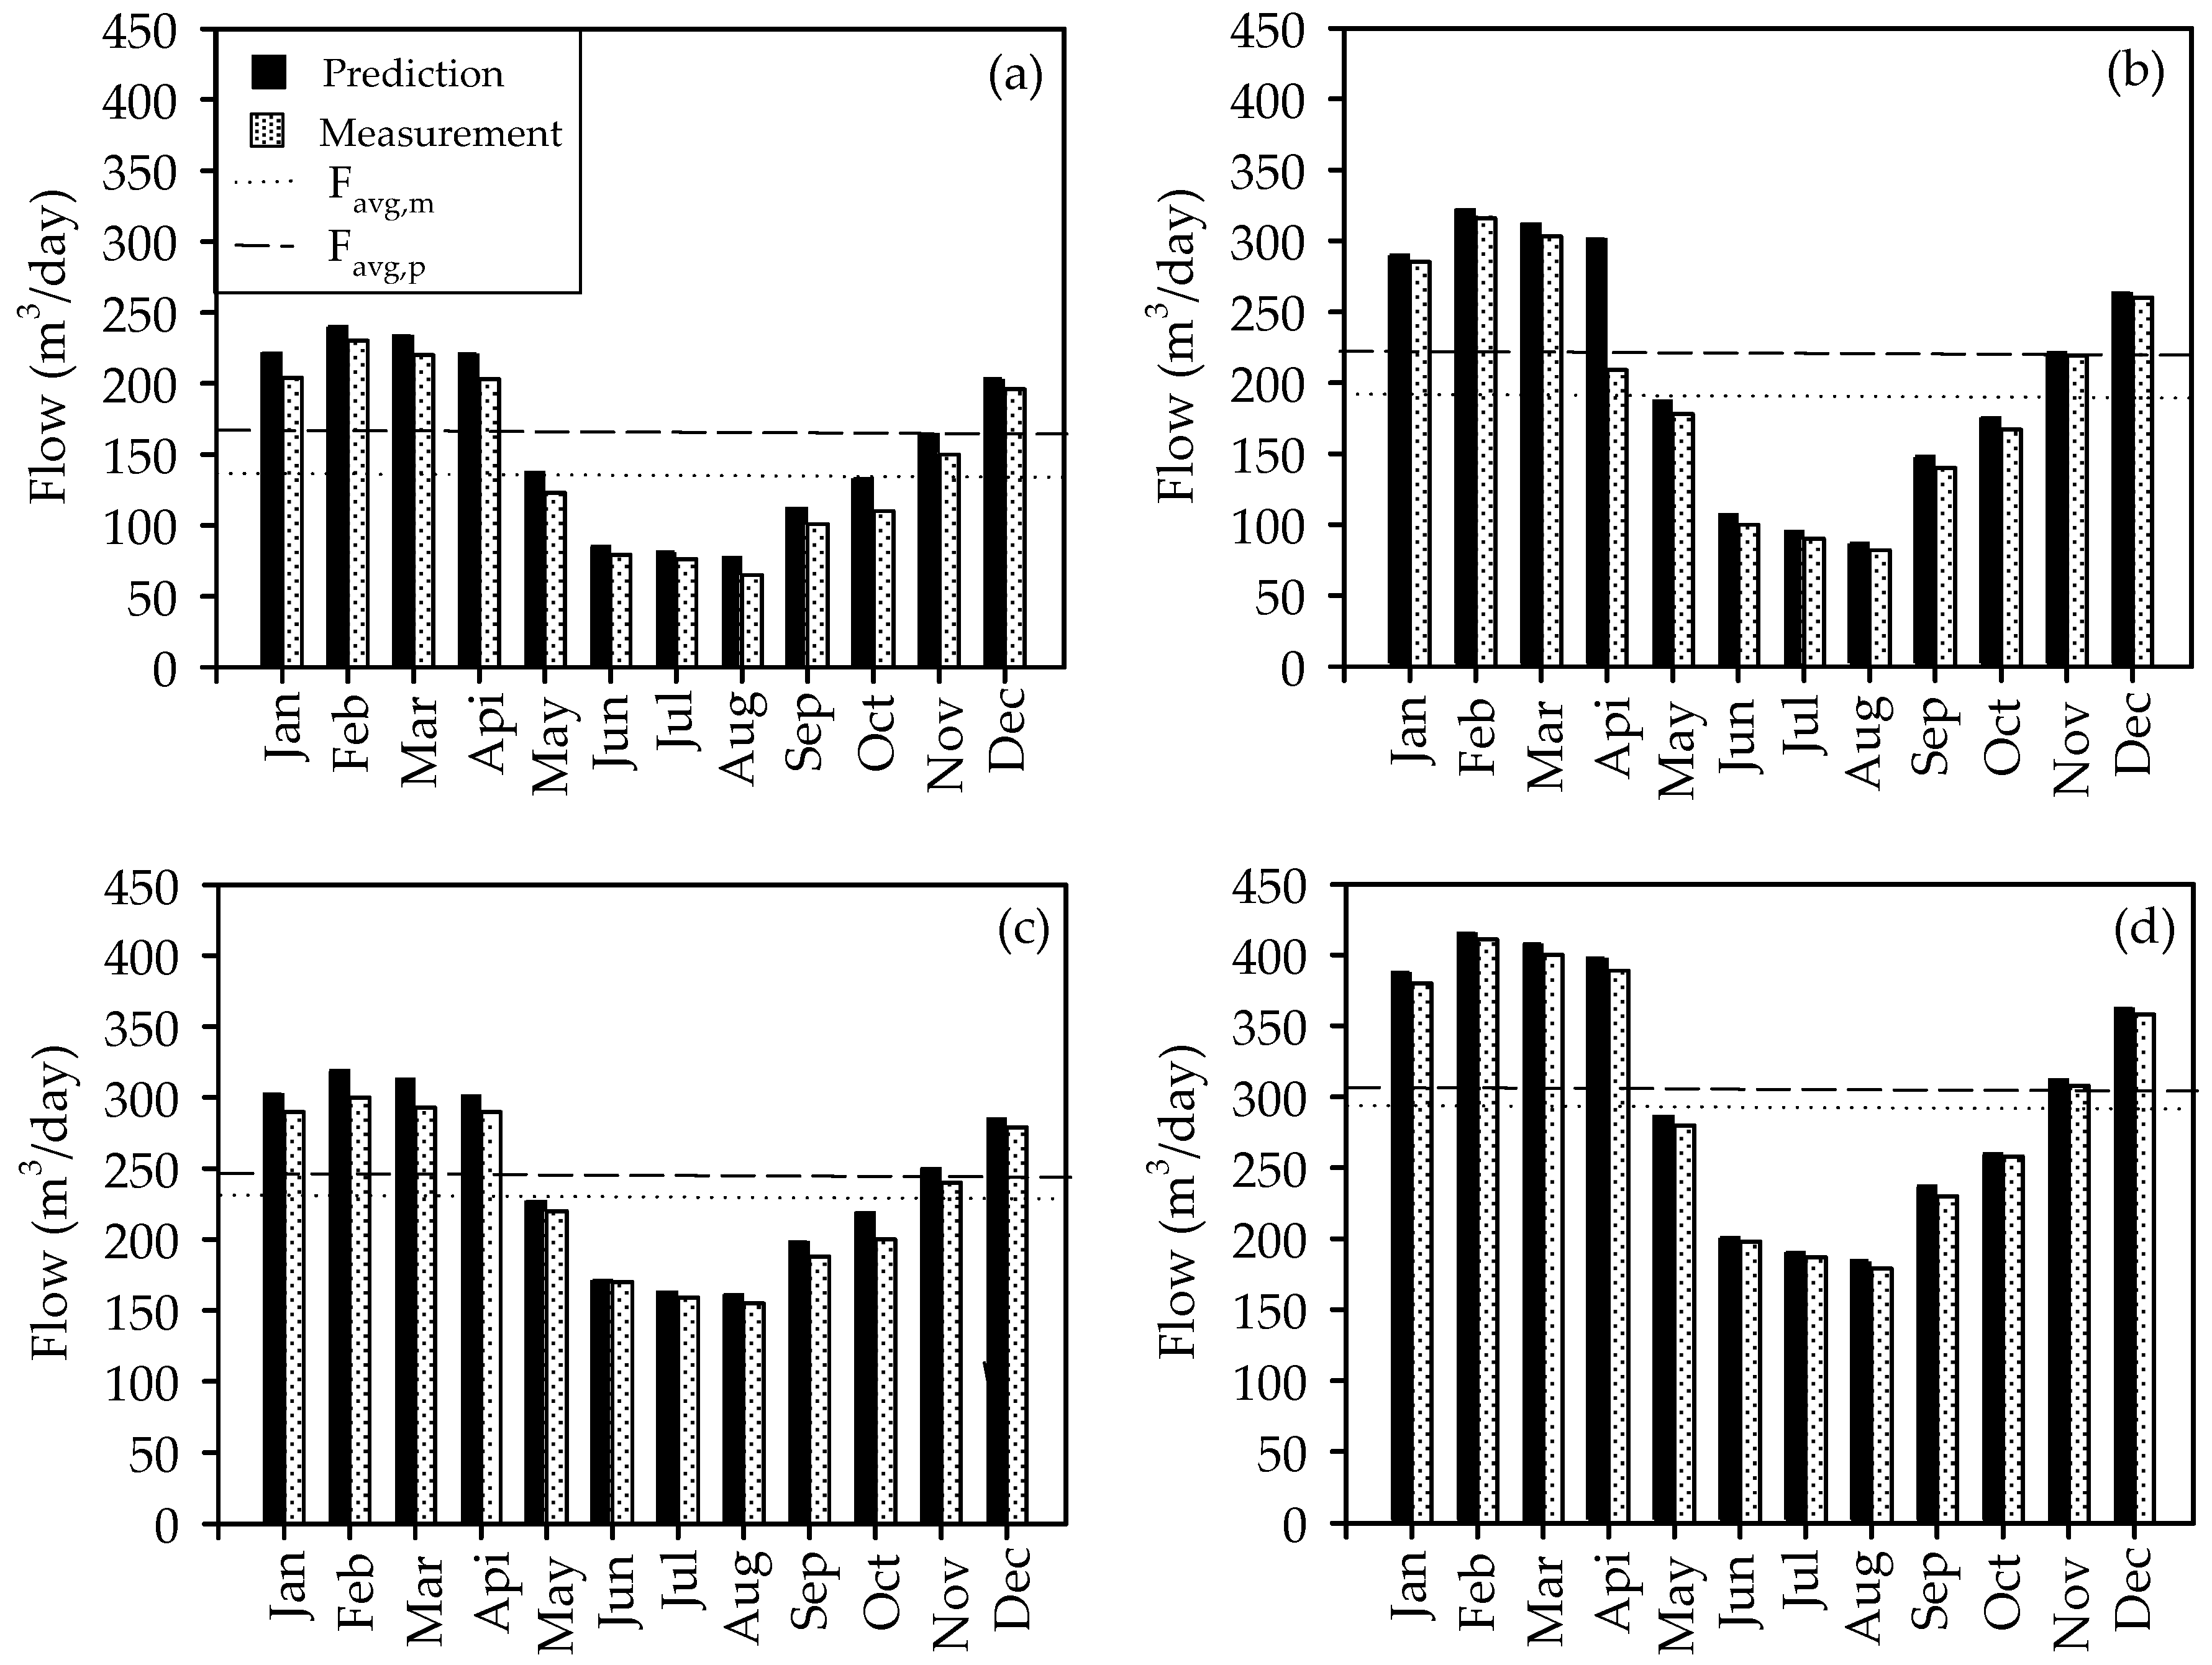
5.3. Prediction of Water Flow vs. Annual Forecast

In this section, actual flow data collected after two years of installation were used to assess the performance of the predictions and the effectiveness of the solar tracking system. Figure 13 compares the prediction of the daily water flow with and without solar trackers for both villages. The results indicate that the use of solar trackers makes it possible to provide the required water flow. As seen in the figure, the predicted flow values are always higher than the measurements due to several factors, such as pump efficiency, losses, variations in actual altitudes of installed equipment, unusual cloudy days, etc. The predicted average water flow (Favg,p) is approximately 10–15% greater than the measured water flow (Favg,m), and the different margins were reduced to 5–8% when the solar tracking system was used. This demonstrates that the performance of the SWSS was significantly improved by using an integrated solar tracking system. However, the cost of this additional accessory can become an issue when the investment budget is limited.
With the validated prediction model of the water flow rate, the comparisons of the flow rates for the non-tracking and tracking systems at the case-study villages are presented in Figure 14. On a sunny day, the PV panels start to power the pumps at around 6:00 am with the tracking and non-tracking power outputs, as shown in Figure 14. The tracking system produces significantly more power output than the non-tracking system, especially in the morning and late afternoon when the solar azimuth angle is high, leading to a much higher flow rate from the tracking system than the non-tracking system during that time. With the non-tracking system, the SWSS was able to work at 7:00 am, i.e., 1 h later than the tracking system counterpart in both villages. Figure 14 also indicates that the peak power of the PV array is approximately 11 kW from both sites (i.e., 4 kW lower than the expected power output), which results from the PV cells’ temperature being higher than the STC temperature when operational. Therefore, the number of PV should be increased to keep the power output from the PV array close to the optimum working power of the pump (by around 30% more PV area). Although the incoming solar irradiance is a smooth curve, as presented in Figure 12, the power outputs from the PV arrays dropped at some points as shown in Figure 14. This can be attributed to ambient conditions such as stagnation wind with high ambient temperature leading to a higher cells’ temperature than normal condition, thus resulting in the lower conversion efficiency of the PV cells.
Comparing the water flow rate of the two case-study villages, Bangkloy has a considerably higher water flow rate because of its lower head at the location. However, the pump efficiency of both villages is almost the same around noon regardless of the different heads, as shown in Figure 15 (except for the non-tracking system at Pongleuk, which has significantly lower performance than other cases). The results in Figure 15 suggest that at Pongleuk, where the pumping head is quite high, the tracking system should be implemented in order to maintain high pump efficiency.
When the water flow rate and pump efficiency of a cloudy day is considered as shown in Figure 16 and Figure 17, respectively, it can be seen that the PV power outputs from the tracking and non-tracking systems are almost identical. This is because, on a cloudy day, the diffuse irradiance is the main component of the total irradiance, which is inconsiderably dependent on the tilted angle. The results on a cloudy day show that about 7.5 kW peak power is obtained, which is only half of the installation peak power of the PV panels.
Figure 18 compares the monthly predicted and measured water flow for both villages without a tracker installed and with a tracker. The results show that the water flow generated by the solar PVs integrated with the solar tracking system are conservative in general and hence provide a suitable starting point for the long-term water management in the two villages from 2012 onwards. The predicted monthly water flow (Favg,p) is approximately 12–18% greater than the measured water flow (Favg,m), and the different margins were reduced to 10–8% when the solar tracking system was used. Moreover, the effectiveness of the solar tracking for the two case-study villages reflected a better agreement between prediction and field measurement by having the mean prediction/experiment P/E = 1.08 and standard deviation SD = 0.12 for Pongluek, and P/E = 1.02 and SD = 0.01 for Bangkloy. The tracking works exceptionally well in the summer season (February to May), and the disagreement between the predicted values can be attributed to less solar radiation during the rainy season (August to November). As seen in Figure 19, although these predictions still appear to be higher than the field records, this may be attributed to the fact that the losses due to valves and fittings have been ignored in the Equation (1).

6. Summary

In this article, the solar water supply systems (SWSS) in two isolated rural locations of Thailand were analysed. The employment of PV technology integrated with a solar tracking system was compared with the system without a solar tracker to gain an understanding of the performances from both systems in different weather conditions, such as sunny, cloudy, or rainy days, during a year in different seasons. The study presented in this article is one of the + 4000 projects carried out to provide sustainable development in deprived areas of Thailand under the Royal Initiative of His Majesty the King. The purpose is to supply energy to off-grid remote, isolated agricultural areas in Thailand where the consumption of energy in water supply systems is a concern, which is increasingly inducing project managers for seeking optimal solutions for the improvement of energy efficiency of the SWSS.
The conducted case studies have shown that the real costs of electricity generated by SWSS using a solar PV system integrated with a solar tracking system yield better performance and are more advantageous than those generated by a system without a solar tracking system. With the tracking system, the incoming solar energy input was not only acquired but also the higher pump efficiency was achieved compared to the non-tracking system, thus leading to a smaller required PV area in a project. Taking energy efficiency as the critical goal in the annual performance calculation is a complex task as multi-criterion optimisation models may be required. Therefore, the article proposed to consider the number of sunny, cloudy, and rainy days of each month of a year such that fast calculations with very good predicted results were possible. The predicted monthly water flow (Favg,p) is approximately 12–18% greater than the measured water flow (Favg,m), and the different margins were reduced to 10–8% when the solar tracking system was used. Moreover, the effectiveness of the solar tracking for two locations reflected a better agreement between prediction and field measurement by having the mean prediction/experiment P/E = 1.08 and standard deviation SD = 0.12 for Pongluek, and P/E = 1.02 and SD = 0.01 for Bangkloy.

7. Practical Implications

The first practical implication is that the solar water supply system with the solar tracker is an economical, competitive option for isolated areas with several advantages. For example, the tracking system performs well during the morning and late afternoon time on sunny days when water demand for irrigation is high. The use of renewable solar energy is preferred, as the effect of global warming from excessive consumption of fossil fuels is a concern. Moreover, the solar PV panel generating electricity for the pumps does not produce air and noise pollution. Therefore, the application of SWSS solutions based on renewable energy sources is an ideal solution for reducing the dependence on fossil fuels.
The second practical implication is based on long-term performance monitoring, which suggests that a single-axis tracking system is preferred to get a high efficiency in integrated solar water supply systems for isolated agricultural areas in Thailand. The other axis tracking is unnecessary, as local operators can manually adjust the tilted angle monthly.
A third practical implication is related to efficiency improvement: approximately 30% more PV installation peak power should be added in order for the submersible pumps to closely work at their peak efficiency. This is because, in real operating conditions, the PV cells’ temperature is usually higher than the nominal operating temperature, thus leading to the considerably lower conversion efficiency of PV panels.

Author Contributions

Conceptualization, T.I. and W.W.; methodology, T.I., K.T., M.S.,W.W.; analysis, T.I., K.T., M.S. and W.W.; investigation, T.I., and M.S.; writing—original draft preparation, T.I., K.T, M.S. and R.G.; writing—review and editing, R.G. and P.D.; supervision, P.D. All authors have read and agreed to the published version of the manuscript.

Funding

The APC was funded by the Science and Technology Research Grant, 2019. This research was partially supported by the new strategic research (P2P) project and the Center of Excellence in Sustainable Disaster Management, Walailak University, Thailand.

Acknowledgments

This research was part of a project on the development of High Efficiency Integrated Solar Water Supply System (SWSS) for the isolated highland agricultural areas at Pongluek and Bangkloy villages, Tambon Huey-Mae-Priang Local administration, Phetchaburi province, Royal Irrigation Department, Thailand under the Royal Initiative of His Majesty the King. Permission granted by the Bluesky Power Co., Ltd. (Chartchai Noisuwan) for the field test data is gratefully acknowledged. Special thanks also go to Poj Ancharoen for field data collection.

Conflicts of Interest

The authors declare no conflict of interest.

References

  1. Goal 2. Department of Economic and Social Affairs. Available online: https://sdgs.un.org/goals/goal2 (accessed on 29 July 2020).
  2. Qoaider, L.; Steinbrecht, D. Photovoltaic systems: A cost competitive option to supply energy to off-grid agricultural communities in arid regions. Appl. Energy 2010, 87, 427–435. [Google Scholar] [CrossRef]
  3. Chandel, S.S.; Naik, M.N.; Chandel, R. Review of solar photovoltaic water pumping system technology for irrigation and community drinking water supplies. Renew. Sustain. Energy Rev. 2015, 49, 1084–1099. [Google Scholar] [CrossRef]
  4. Meah, K.; Fletcher, S.; Ula, S. Solar photovoltaic water pumping for remote locations. Renew. Sustain. Energy Rev. 2008, 12, 472–487. [Google Scholar] [CrossRef]
  5. Solarbuzz. Annual World PV Market Review, Solar-Buzz; Solarbuzz: Port Washington, NY, USA, 2011. [Google Scholar]
  6. Aliyu, M.; Hassan, G.; Said, S.A.; Siddiqui, M.U.; Alawami, A.T.; Elamin, I.M. A review of solar-powered water pumping systems. Renew. Sustain. Energy Rev. 2018, 87, 61–76. [Google Scholar] [CrossRef]
  7. Li, G.; Jin, Y.; Akram, M.W.; Chen, X. Research and current status of the solar photovoltaic water pumping system—A review. Renew. Sustain. Energy Rev. 2017, 79, 440–458. [Google Scholar] [CrossRef]
  8. Caton, P. Design of rural photovoltaic water pumping systems and the potential of manual array tracking for a West-African village. Sol. Energy 2014, 103, 288–302. [Google Scholar] [CrossRef]
  9. Sontake, V.C.; Kalamkar, V.R. Solar photovoltaic water pumping system—A comprehensive review. Renew. Sustain. Energy Rev. 2016, 59, 1038–1067. [Google Scholar] [CrossRef]
  10. Korpale, V.S.; Kokate, D.H.; Deshmukh, S.P. Performance Assessment of Solar Agricultural Water Pumping System. Energy Procedia 2016, 90, 518–524. [Google Scholar] [CrossRef]
  11. Benghanem, M.; Daffallah, K.O.; Alamri, S.N.; Joraid, A.A. Effect of pumping head on solar water pumping system. Energy Convers. Manag. 2014, 77, 334–339. [Google Scholar] [CrossRef]
  12. Al-Smairan, M. Application of photovoltaic array for pumping water as an alternative to diesel engines in Jordan Badia, Tall Hassan station: Case study. Renew. Sustain. Energy Rev. 2012, 16, 4500–4507. [Google Scholar] [CrossRef]
  13. Meah, K.; Ula, S.; Barrett, S. Solar photovoltaic water pumping-opportunities and challenges. Renew. Sustain. Energy Rev. 2008, 12, 1162–1175. [Google Scholar] [CrossRef]
  14. Campana, P.E.; Li, H.; Yan, J. Dynamic modelling of a PV pumping system with special consideration on water demand. Appl. Energy 2013, 112, 635–645. [Google Scholar] [CrossRef] [Green Version]
  15. Gopal, C.; Mohanraj, M.; Chandramohan, P.; Chandrasekar, P. Renewable energy source water pumping systems—A literature review. Renew. Sustain. Energy Rev. 2013, 25, 351–370. [Google Scholar] [CrossRef]
  16. Belgacem, B.G. Performance of submersible PV water pumping systems in Tunisia. Energy Sustain. Dev. 2012, 16, 415–420. [Google Scholar] [CrossRef]
  17. Campana, P.E.; Li, H.; Zhang, J.; Zhang, R.; Liu, J.; Yan, J. Economic optimization of photovoltaic water pumping systems for irrigation. Energy Convers. Manag. 2015, 95, 32–41. [Google Scholar] [CrossRef] [Green Version]
  18. Periasamy, P.; Jain, N.K.; Singh, I.P. A review on development of photovoltaic water pumping system. Renew. Sustain. Energy Rev. 2015, 43, 918–925. [Google Scholar] [CrossRef]
  19. Thinsurat, K.; Bao, H.; Ma, Z.; Roskilly, A.P. Performance study of solar photovoltaic-thermal collector for domestic hot water use and thermochemical sorption seasonal storage. Energy Convers. Manag. 2019, 180, 1068–1084. [Google Scholar] [CrossRef] [Green Version]
  20. Fan, K.C.; Chang, K.C.; Chung, K.M. The impact of water quality on the use of solar water heaters in remote Islands of Taiwan. Water 2016, 8, 530. [Google Scholar] [CrossRef] [Green Version]
  21. Rohit, K.B.; Karve, G.; Khatri, M. Solar water pumping system. Int. J. Emerg. Technol. Adv. Eng. 2013, 3, 225–259. [Google Scholar]
  22. Chakchak, J.; Cetin, N.S. Application of Rural Photovoltaic Water Pumping System Using Immersed Pump and DC Motor. Int. J. Energy Appl. 2017, 4, 164–173. [Google Scholar]
  23. Qiu, S.; Ruth, M.; Ghosh, S. Evacuated tube collectors: A notable driver behind the solar water heater industry in China. Renew. Sustain. Energy Rev. 2015, 47, 580–588. [Google Scholar] [CrossRef]
  24. Ma, Z.; Bao, H.; Roskilly, A.P. Feasibility study of seasonal solar thermal energy storage in domestic dwellings in the UK. Sol. Energy. 2018, 162, 489–499. [Google Scholar] [CrossRef]
  25. Faizal, M.; Saidur, R.; Mekhilef, S.; Alim, M.A. Energy, economic and environmental analysis of metal oxides nanofluid for flat-plate solar collector. Energy Convers. Manag. 2013, 76, 162–168. [Google Scholar] [CrossRef]
  26. Ehrhart, B.; Gill, D. Evaluation of Annual Efficiencies of High Temperature Central Receiver Concentrated Solar Power Plants with Thermal Energy Storage. Energy Procedia 2013, 49, 752–761. [Google Scholar] [CrossRef] [Green Version]
  27. Hearps, P.; McConnell, D. Renewable Energy Technology Cost Review; Melbourne Energy Institute: Melbourne, Australia, 2011. [Google Scholar]
  28. Blake, D.J. King Bhumibol: The symbolic ‘father of water resources management’ and hydraulic development discourse in Thailand. Asian Stud. Rev. 2015, 39, 649–668. [Google Scholar] [CrossRef]
  29. Imjai, T.; Voravarangkurl, N.; Noisuwan, C.; Locatelli, A. High Efficiency Integrated Solar-Water Supply System for Isolated Agricultural Areas in Thailand: Renewable Energy Development. In Proceedings of the 1st Advances in Civil Engineering for Sustainable Development (ACESD 2014), Nakhon Ratchasima, Thailand, 27–29 August 2014; pp. 1–7. [Google Scholar]
  30. Philibert, C. Interactions of Policies for Renewable Energy and Climate; Interactions Energy Agency: Paris, France, 2011. [Google Scholar]
  31. Mekhilef, S.; Faramarzi, S.Z.; Saidur, R.; Salam, Z. The application of solar technologies for sustainable development of agricultural sector. Renew. Sustain. Energy Rev. 2013, 18, 583–594. [Google Scholar] [CrossRef]
  32. Tyagi, V.V. Progress in Solar PV technology: Research and Achievement. Renew. Sustain. Energy Rev. 2013, 20, 443–461. [Google Scholar] [CrossRef]
  33. Rahaman, M.M.; Varis, O. Integrated water resources management: Evolution, prospects and future challenges. Sustain. Sci. Pract. Policy 2005, 1, 15–21. [Google Scholar] [CrossRef]
  34. Suri, R.K.; Al-Marafie, A.M.R.; Al-Homoud, A.A.; Maheshwari, G.P. Cost-effectiveness of solar water production. Desalination 1989, 71, 165–175. [Google Scholar] [CrossRef]
  35. Bhattacharyya, S.C. Energy access programmes and sustainable development: A critical review and analysis. Energy Sustain. Dev. 2012, 16, 260–271. [Google Scholar] [CrossRef]
  36. Maxwell, E.L.; Renne, D.S. Measures of Renewable Energy; NREL/MP-463-6254; National Renewable Energy Laboratory: Golden, CO, USA, 1994.
  37. Solaris. Horizontal Solar Radiation Map of Thailand; Solaris Green Energy: Krabi, Thailand, 2013. [Google Scholar]
  38. Duffie, J.A.; Beckman, W.A. Solar Engineering of Thermal Processes, 4th ed.; Wiley: New York, NY, USA, 2013. [Google Scholar]
  39. LORENTZ. 2014. Available online: www.lorentz.de/en/products/submersible-solar-pumps/psk2.html (accessed on 20 May 2020).
  40. Arunkumar, M.; Mariappan, V.N. Water demand analysis of municipal water supply using epanet software. Int. J. Appl. Bioeng. 2011, 5, 9–16. [Google Scholar]
  41. Hamidat, A.; Benyoucef, B. Mathematic models of photovoltaic motor-pump systems. Renew. Energy 2008, 33, 933–942. [Google Scholar] [CrossRef]
  42. Tsai, H.F.; Tsai, H.L. Implementation and verification of integrated thermal and electrical models for commercial PV modules. Sol. Energy 2012, 86, 654–665. [Google Scholar] [CrossRef]
  43. Skoplaki, E.; Boudouvis, A.G.; Palyvos, J.A. A simple correlation for the operating temperature of photovoltaic modules of arbitrary mounting. Sol. Energy Mater. Sol. Cells 2008, 92, 1393–1402. [Google Scholar] [CrossRef]
Figure 1. Integrated water resource management principle (adopted from Imjai et al. [29]).
Water 12 02438 g001
Figure 2. Horizontal solar radiation map of Thailand and Phechaburi province [37].
Water 12 02438 g002
Figure 3. Selected locations of two case-study villages in this study: (a) The topographic map of studied locations; (b) the topographic map showing latitude and longitude of the studied locations.
Water 12 02438 g003
Figure 4. Some details from the two case-study villages (photos by the authors): (a) farming on the highland; (b) banana crops; (c) river bridge (source of water).
Water 12 02438 g004
Figure 5. Schematic design of a Solar Water Supply System (SWSS) for the agricultural areas in this project.
Water 12 02438 g005
Figure 6. Solar photovoltaic (PV) panels integrated with the solar trackers installed at two site locations: (a) Location 1: Pongluek village; (b) Location 2: Bangkloy village.
Water 12 02438 g006
Figure 7. Closed-up view of the solar trackers installed under the PV panels (photos by the authors): (a) the automatic solar tracking system; (b) the control house.
Water 12 02438 g007
Figure 8. Installation of pipelines (a) and coupling system for the high-density polyethylene (HDPE) pipe connection (b) (photos by the authors): (a) installation of pipeline work; (b) coupling system for HDPE pipeline.
Water 12 02438 g008
Figure 9. Water flows into the reservoir (photos by the authors): (a) Pongluek village; (b) Bangkloy village.
Water 12 02438 g009
Figure 10. Submersible pump efficiency and flow rate corresponding to its power input in two installed locations with different heads: a 64-m head at Pongluek and a 48-m head at Bangkloy.
Water 12 02438 g010
Figure 11. Annual total irradiation at different tilted angles for tracked and non-tracked systems.
Water 12 02438 g011
Figure 12. Global horizontal irradiance in different months of a year at case-study villages (a) on sunny days; (b) on cloudy days. Note that both locations (Bangkloy and Pongluek) are close to each other.
Water 12 02438 g012
Figure 13. Daily predicted and measured water flow for Pongluek village without a tracker installed (a) and with a tracker (b) and Bangkloy village without a tracker installed (c) and with a tracker (d).
Water 12 02438 g013
Figure 14. Water flow rate of the pumps at Pongluek and Bangkloy according to the PV power output on a sunny day for tracking and non-tracking SWSS.
Water 12 02438 g014
Figure 15. Pump efficiency at Pongluek and Bangkloy according to the PV power output on a sunny day for tracking and non-tracking SWSS.
Water 12 02438 g015
Figure 16. Water flow rate of the pumps at Pongluek and Bangkloy according to the PV power output on a cloudy day for tracking and non-tracking SWSS.
Water 12 02438 g016
Figure 17. Pump efficiency at Pongluek and Bangkloy according to the PV power output on a cloudy day for tracking and non-tracking SWSS.
Water 12 02438 g017
Figure 18. Monthly Predicted and measured water flow for Pongluek village without a tracker installed (a) and with a tracker (b) and Bangkloy village without a tracker installed (c) and with a tracker (d).
Water 12 02438 g018
Figure 19. Water flow for two villages with/without a solar tracking system.
Water 12 02438 g019
Table 1. Energy sources in the world’s total energy supply [36].
Energy SourcesYear 2012Year 2035
Solar0.3%0.7%
Wind1.8%3.2%
Geothermal0.1%0.1%
Hydro7.6%8.8%
Nuclear5.5%6.7%
Biofuel0.8%1.2%
Coal27.9%27.2%
Natural gas22.2%22.7%
Conventional31.3%25.8%
Non-conventional1.1%2.2%
Other1.4%1.4%
Table 2. Meteorological data at the case study area [11].
Month
(2012–2013)
Air
Temperature
Relative
Humidity
Daily Solar Radiation-Horizontal
°C%kWh/m2/d
January25.765.1%5.12
February26.366.4%5.68
March26.870.6%5.83
April27.276.2%5.86
May27.081.8%4.59
June26.683.1%3.73
July26.482.4%3.70
August26.382.6%3.48
September26.083.7%3.85
October25.783.2%4.09
November25.276.0%4.46
December25.065.5%4.87
Average26.276.4%4.61
Table 3. Characteristics of the monocrystalline silicon PV panel JKM240M-60 (240 W).
ParameterValue
STC Power Rating240 W
STC Power per unit of area146.6 W/m2
Peak efficiency14.66%
Number of cells60
Imp7.95 A
Vmp30.2 V
Isc8.45 A
Voc37.3 V
NOCT (Nominal Operating Cell Temperature)45 °C
Temp. coefficient of Isc0.05%/K
Temp. coefficient of Power−0.41%/K
Temp. coefficient of Voltage−0.112 V/K
Panel area1.64 m2
Table 4. Analysed numbers of days in every month of a year for different weather conditions.
MonthNo. of Sunny DaysNo. of Partly Cloudy DaysNo. of Rainy Days
January19102
February1981
March19102
April17103
May10138
June9147
July9157
August9139
September9147
October9148
November15114
December2272

