Abstract
In 2014, the Paraíba do Sul River Basin Integration Committee (CEIVAP) established its Pilot Program of Payments for Ecosystem Services (PES), focusing on water resources. The projects from this program share the same goal: to disseminate the use of PES as a tool for land management in watersheds. Contemplating 11 municipalities, including 84 landowners, conserving 718.63 ha and restoring 188.58 ha, this program was concluded in April 2020. Reviewing its historical and contextualizing features, we have observed that the outcomes from this program extend beyond these numbers. Here, we propose an evaluation methodology comparing the efficiency, performance, and impact of the PES projects. Based on new indicators that are easy to measure, we have identified key elements that have asymmetrically affected the projects. The complexity of the project scope and the execution of high-cost, and risky interventions on rural properties, have resulted in expensive projects with little tangible outputs. Our results support the upgrade of public policy for investment in ecosystem services by CEIVAP in the Paraíba do Sul watershed. In addition, our results can be more successful by improving the decision-making processes for similar projects in other watersheds.
1. Introduction
The concept of ecosystem services (ES) highlights the interdependence between ecosystem function and human well-being [1,2]. Since the publication of the Millennium Ecosystem Assessment [3], ES have been conceptualized as the benefits that people obtain from ecosystems, organized into four groups: supporting, provisioning, regulating, and cultural. From international initiatives on ES, such as The Economics of Ecosystems and Biodiversity (TEEB), Intergovernmental Science-Policy Platform on Biodiversity and Ecosystem Services (IPBES), and Ecosystem Service Partnership (ESP), the concept has become the key to discussions on global environmental change and decision-making for natural resource management [4].
The valuation of ecosystem services is a strategy for natural resource conservation and the policies of Payments for Ecosystem Services (PES), defined as “a transfer of resources between social actors, which aims to create incentives to align individual and/or collective land use decisions with the social interest in the management of natural resources” [5]. PES has become an engaging policy and economic tool for many landowners, environmental managers, and public managers, as it provides an incentive-based approach to internalize the positive externalities of land use decisions [6,7,8,9,10]. They are also considered more efficient and more easily applicable than command and control policies [11,12].
The PES programs have become widespread in Latin America [13], addressing four main ecosystem services: biodiversity conservation, watershed services, carbon sequestration, and scenic beauty [14]. In Brazil, the evolution of PES programs is increasing [15]. In a report released by Forest Trends, 200 PES projects were accounted, most of them in the Atlantic Forest biome [16]. Most of these programs are related to water resources conservation through Payments for Watershed Services (PWS) [17]. The PWS programs are often designed to mobilize resources contributed by downstream actors to compensate upstream actors for managing landscapes [18]. In the Brazilian Atlantic Forest, all PWS programs pay rural landowners, usually by legal agreements [19].
The Brazilian National Water Resources Policy (Law. No. 9.433/1997), inserted the concept of water resources user-payer and the Watershed Committees (CBH in the Portuguese acronym) as the entities of water governance in the watersheds [20]. The adoption of PWS programs by these committees is part of a strategy that recognizes the role of the ES water conservationist, encouraging the increase of the offer of these services by the “conservator-recipients”. This is a key mechanism for integrating water resources management into land management (Figure 1), by reasoning that if upstream users receive no incentive from downstream users, the former may have no motive for considering the interests of the latter in their land-use decision making [21]. This mechanism helps to facilitate the necessary cooperation and negotiation that enable PWS programs, helping landholders realize and benefit from those values [22].

Figure 1.
River Basin Committee (CBH) operation when formulating policies to recognize the role of the “conservator/provider” of ecosystem services for the water resources management in the watershed.
The Committee for the Integration of the Paraíba do Sul River Basin (CEIVAP, in the Portuguese acronym) acts as the water resources management in one of the most important watersheds in Brazil, since it supplies the metropolitan regions of São Paulo and Rio de Janeiro. In 2014, CEIVAP created the Pilot Program of PWS, with the goal of promoting the use of PWS in the land management of municipal watersheds. From this program, the CEIVAP financed conservation actions of forest remnants of the Atlantic Forest and forest restoration of degraded areas on rural properties located in the priority microbasins for water management.
Assessment of PWS programs or projects should not be restricted to the quality-quantitative handover of the contracted ecosystem service, but should address the entire arrangement, through stakeholder engagement, the effectiveness of contractual instruments, social externalities generated by the implementation of the PWS, and the effectiveness of this mechanism itself for forest conservation/recovery. The evaluation of PWS programs does not aim only to produce numbers, but to improve of public policies and guide decision-makers [23]. In the universe of 42 PES programs and projects underway in Brazil, 71% use indicators related to forest cover, and that less than 30% use multiple indicators that contemplate both the delivery of services and socio-environmental aspects [24].
Indicators must be based on four criteria: relevance (importance of the indicator for evaluation), feasibility (obtaining the measure of the indicators), clarity (ability to communicate the indicator), and sensitivity (ability to detect change) [25]. In addition, indicators should comprise four aspects: program costs, additionality, leakage, and spillovers, and actual provision of environmental services [26]. Although this is extremely necessary, the Pilot Program of PWS by CEIVAP, completed in April 2020, lacked a comprehensive assessment methodology and no support for continuous improvement of this public policy.
In this paper, we aim to overcome this gap, to contribute to a critical analysis of the outcomes achieved, and to support the upgrading of investments in nature-based solutions for water supply. This strengthens the connection between science and practice by highlighting the evidence from both areas [27]. Therefore, we regard that the assessment of a program requires the joint use of indicators of the costs of using resources to implement it (efficiency), the achievement of the proposed objectives (performance), and the extent of impact or social changes promoted by it (impact) [28]. From a case study of the Pilot Program of PWS by CEIVAP, we proposed a set of new indicators to evaluate PWS projects, regarding the dimensions of efficiency, performance, and impact. Furthermore, we suggested a strategic planning methodology to be used by decision makers in the process of continuous improvement of the policy of investment of public resources in ecosystem services in the Brazilian Atlantic Forest.
2. Material and Methods
2.1. Case Study and Context
The Paraíba do Sul river basin (BHRPS) has a drainage area of 62,185 km2, with territories belonging to the states of São Paulo, Rio de Janeiro, and Minas Gerais (Figure 2) [29]. BHRPS is in one of the most developed regions of the country, with more than 6000 industries, responsible for approximately 11% of the national GDP [30] and has more than 8.5 million inhabitants [31]. The BHRPS region preserves less than 20.0% of the original coverage of its Atlantic Forest biome, recognized as a global biodiversity hotspot [32,33].
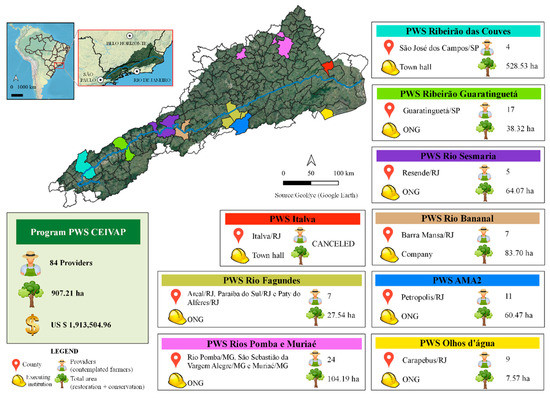
Figure 2.
Basin of Paraíba do Sul river’s region and the distribution of Payments for Watershed Services (PWS) projects of the Paraíba do Sul River Basin Integration Committee (CEIVAP) Pilot Program in the Paraíba do Sul river basin.
At BHRPS, two important aspects for the water resources management stand out: the two water transposition systems for the public supply of the two biggest Brazilian metropolises. Through the Guandu System, two thirds of the volume flow of the Paraíba do Sul river is deviated to the Guandu river basin, which supplies 80% of the metropolitan region of Rio de Janeiro [34]. Recently, through the transposition of the Jaguari reservoir to the Atibainha reservoir, the BHRPS waters supply the metropolitan region of São Paulo [35]. Besides supplying the municipalities, industries, and agriculture, which causes a lot of pressure on water resources, the waters of the basin also serve the hydraulic power use in at least 120 small, medium, or large hydroelectric stations [30]. This indicates the need to strengthen the instruments for the conservation of ecosystems and to provide ecosystem services.
2.2. Pilot Program of PWS by CEIVAP
The Pilot Program of PWS by CEIVAP was established in 2014, when nine municipal projects were selected to finance its implementation (Figure 2). All projects aimed at implementing PWS demonstration units, while financing forest conservation and restoration actions on rural properties, with payments profits of up to $30.00 ha−1·year−1 to the landowners. The projects are financed with the resources raised from the users-payers by the charging mechanism for the use of water resources in the BHRPS, and alternatively co-financed by the municipality concerned. The execution of the projects is the responsibility of the municipal government or a contracted executing institution (NGO or private company). All projects followed the same scope defined by the Association for Pro-Management of Waters of the Paraíba do Sul river basin (AGEVAP) [36] and the same institutional arrangement represented in Figure 3. The effective Management Board (UGP) had a main role for projects development, since in this institutional arrangement all stakeholders have been participated in several steps for projects implementation and follow-up. It was a space for the alignment of stakeholders’ efforts in avoiding degradation agents to excel in maintenance efforts in areas with low forest restoration performance (Figure 3).
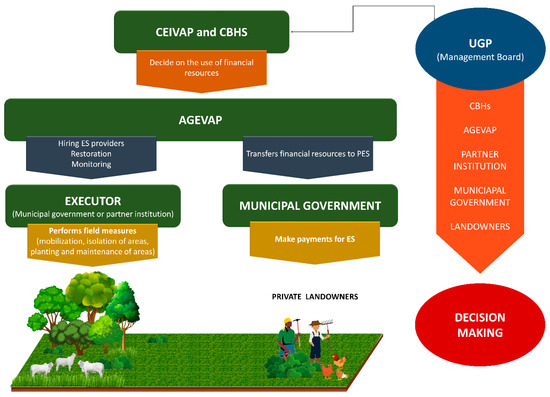
Figure 3.
Institutional arrangement of Pilot Program of PWS of CEIVAP.
Implemented in 2015 and planned to be concluded in April 2020, only the PWS project of Italva/RJ was suspended. Of all the projects that continued, only for the municipality of Muriaé/MG were no actions were carried out on rural properties. Table 1 presents the goals obtained in the PWS projects of CEIVAP.

Table 1.
Project description of the Pilot Program of PWS by CEIVAP for the Paraíba do Sul river basin.
2.3. Data Collection
This study was conducted by exploratory research [37]. Part of the data collection was performed during our previous research about this Pilot Program of PWS [38]. Three main techniques were used: participant observation [39,40], field observation [41], and documentary analysis [42]. Participant observation is an appropriate technique for qualitative research, especially when it requires field research. The method is distinct because the researcher addresses participants in their own environment, rather than making them come to the researcher [43]. The participant observer participates in daily situations common to people belonging to the research environment while collecting information about what is observed [44]. For this study, the participating observation technique proved to be adequate, since the first author is a member of the PWS project management team, enabling the analysis process in the field of observation and participation in the activities [43].
Documental analysis technique refers to the analysis of documents that contain information about the “phenomenon” we want to study [42]. We reviewed more than 400 documents produced and published from 21 July 2000 to 31 December 2019; presented as reports and technical notes, minutes of meetings, measurement bulletins of works in PWS projects, schedules, and budgets. All documents are public data, available for open access at the Association for Pro-Management of Waters of the Paraíba do Sul river basin (AGEVAP) (www.agevap.org.br), CEIVAP (https://www.ceivap.org.br/) and the portal of the Geographic and Geoenvironmental Information System of the Paraíba do Sul river basin (SIGA/CEIVAP) (www.sigaceivap.org.br) (more details in Supplementary Materials).
Additionally, the first author participated in the first and second workshop of the Pilot Program of PWS by CEIVAP, held at the AGEVAP headquarters, on the 8th of March and the 23th of May, 2018, respectively. In these workshops, stakeholders met to discuss the challenges, goals, results expected, and past accomplishments in PWS projects. Here, we conducted informal discussions focused on opinions on PWS project management, such as individual experiences and views on the scope and rules of the current PWS project. The field observation was through technical visits to rural proprieties, all by using a field notebook and photographic records.
2.4. Data Analysis
We used a set of indicators to assess PWS projects under three dimensions of management process evaluation: efficiency, performance, and impact [23]. Five indicators were proposed per dimension (Table 2, Table 3 and Table 4). For comparative analysis, the indicators were standardized by score ranging from 0 to 1. From the standardized values of the indicators, partial scores were determined for the dimensions Efficiency (SEfficiency, Equation (1)), Performance (SPerformance, Equation (2)), and Impact (SImpact, Equation (3)). The final score (SFinal) was obtained by Equation (4), which assumes that the Pilot Program of PWS aimed: (i) to install PWS demonstration units, and (ii) to disseminate the PWS strategy as a municipal environmental management tool. Therefore, equation (4) associates a higher degree to the impact scores (multiplication factor equal to 3), than to the performance scores (multiplication factor equal to 2) and to the efficiency scores (multiplication factor equal to 1). Finally, a principal component analysis (PCA) was performed to correlate the scores of each indicator in the three dimensions analyzed using the CANOCO statistical package [45].
where EMob = social mobilization; EPlan = planning; EIso = land area isolation; Eplanting = seedling planting; EMaint = project maintenance; PGoal = goals reached; PRem = remaining providers; PPrev = prevent land degradation; PSurv = seedling survival; PRest = forest restoration; IPaym = payments of PWS installments; IEng = joint engagement; ILeg = legal framework; IPub = knowledge generation and dissemination; and IPar = network partnerships.
Table 2.
Characterization and description of the indicators for “efficiency dimension”.
Table 3.
Characterization and description of the indicators for “performance dimension”.
Table 4.
Characterization and description of the indicators for “impact dimension”.
3. Results
3.1. Efficiency
The indicators of mobilization (EMob) and planning (Eplan) were directly related to the preliminary activities (structuring component) of the projects, which include the stages of stakeholder’s mobilization and conception of executive projects (PERs). The indicators of isolation (Eiso), planting (Eplanting) and maintenance (Emaint) are related to final activities in the field (structural component). The main distinction between the components is the complexity and high cost of structural activities compared to structuring activities, while the latter requires greater competence for institutional interlocution. By associating these two components in the same project scope, the PWS program of CEIVAP required from project implementers multidisciplinary expertise and financial prudence.
All our project efficiency indicators correlate the financial investment with the obtained goals (hired providers, projects executed, seedlings planted, and maintenance performed). The highest efficiency is obtained when the great goal is executed with lower cost. The reduction of physical targets by maintaining a high cost with a multidisciplinary technical team characterized the low efficiency (SEfficiency) of PW5, PW6, PWS2, and PWS8 (Table 5) projects. For these projects, the achievement of the targets would favor the reallocation of expenses for the multidisciplinary technical team from “fixed costs” to “variable costs” during the initial planning.
Table 5.
Efficiency indicator values of each project of the PWS pilot program of CEIVAP.
The PWS1 and PWS7 projects were the only ones to meet their respective original targets fully. In these projects, the greater control also required a higher investment of financial resources which, when compared to lower cost projects and similar targets, resulted in lower efficiency on the EMob, Eplan, Eiso, Eplanting and Emanint indicators for the PWS1 and PWS7 projects. The best efficiency was obtained by the projects that: (i) presented low cost of the technical team to manage the project, (ii) contracted isolation, planting and maintenance services for a lower price, and (iii) did not significantly reduce isolation, planting, and maintenance targets.
3.2. Performance
The proposed indicators for evaluating project performance aimed to focus on quality-quantitative results as a direct benefit of the activities carried out in the projects. These results include the achievement of quantitative goals (providers assisted in relation to the total number of hired providers, fences built, seedlings planted, area conserved in relation to the total planned) (PGoal), the permanence of the providers after being contemplated (PRem), the degradation of the areas contemplated (PPrev), the success of planting activities for forest restoration with survival of seedlings in the post-planting (PSurv), and the progress of forest restoration of the areas (PRest).
As we showed, the PWS7 project presented the highest cost of mobilization (alignment with the municipal government, dissemination of the project to the local community, selection of providers, field visits, etc.), as well as significant costs in planning, planting, and maintenance, consequently resulting in the lowest efficiency (SEfficiency). However, this project was also the one with the highest performance (SPerformance), as shown in Table 6. In other words, the highest investment was compensated with effective results for the actions undertaken in the project.
Table 6.
Performance indicator values of each project of the PWS pilot program of CEIVAP.
It is possible that the mobilization strategy adopted in PWS7 (e.g., use of booklets, video documentation, and other means of dissemination of information) ensured greater engagement of providers with the implementation phases of the project and consequently lower rates of occurrence of degrading events. The engineering solutions and the technical quality control of the outsourced services resulted in the outstanding survival performance of the post-plant seedlings and the progress of forest restoration. The latter measured based on the forest restoration evaluation protocol adopted by the program.
The control of the target plan was also effective in PWS1 and PWS4 projects. For the PWS1, it highlighted the importance of the providers’ maintenance and the low occurrence of degradations to the areas contemplated. However, PWS1 encountered difficulties in the response of the forest restoration process, demonstrating that the engineering solutions were not sufficient for the rapid recovery of the contemplated areas. Conversely, PWS4 succeeded in the process of restoration, but registered the withdrawal of providers and largest number of occurrences of degrading events (e.g., access and permanence of cattle in the areas intended for forest restoration).
The PWS3 project, which achieved the highest level of efficiency, significantly increased the forest conservation goal, and served all hired providers. However, it registered the withdrawal of some providers, occurrences of cattle access in delimited areas and, mainly, presented a low quality in forest restoration efforts, with a high rate of post-plant mortality. We relate these results to the low quality of the services contracted in the public bidding process, although they were less costly.
For the PWS8, PWS6, PWS5, and PWS2 projects, besides the reduction of targets, providers’ withdrawal, and reports of occurrence of degradation agents, the contracted services were not accompanied by the effective quality control, resulting in losses of seedlings after planting and delays in the forest restoration process of the areas. In many of these projects, the significant reduction of the target plan and the low quality of the interventions carried out on rural properties may justify the lack of perception of tangible results of these projects for the stakeholders. In the absence of project monitoring methodologies, the identification and communication of results is hindered or even appropriated by agents who oppose investment in programs of this nature.
3.3. Impact
The indicators of this dimension evaluated the changes in the external environment mediated by the implementation of the program under analysis. The fulfilment of payments to service providers (IPaym) represents the creation of an administrative mechanism that can be used by new municipal projects. The engagement of stakeholders in meetings for decision-making (IEng) that bring together new partners (IPar) to form a collective with the potential to continue the programs, as well as the legal framework (ILeg) and the production of scientific knowledge (IPub), are legacies of the PWS projects of CEIVAP.
Our results indicate that the PWS3 project obtained the highest level of impact, achieving the highest score in all indicators of this evaluation dimension (Table 7). The PWS3 and PWS7 were the only projects to pay all the installments agreed upon with the ecosystem services providers hired, contemplated, and maintained in the project. For all projects, payment was made by the municipal governments—since the payment contracts involved only the municipal government and the providers—with funds transferred by CEIVAP, respecting the maximum amount of US $30.00 ha−1·year−1.
Table 7.
Impact indicator values of each project of the PWS pilot program of CEIVAP.
Fiscal irregularities of the municipalities and slowness of the public administrative process prevented the payment of one or more installments in almost all other projects. For the PWS2 project, none of the entitled installments were paid to hire providers due to the lack of fiscal regularity of the municipality of Carapebus/RJ to receive resource transfers from CEIVAP. However, the failure to make full payments did not result in providers giving up on any of the projects. It is possible that the other benefits received by the providers, such as the maps of the properties, the support for the Rural Environmental Cadastre (CAR) [46], the isolation of the areas, and the planting for the restoration of Permanent Preservation Areas [46], have been perceived by the providers as direct benefits obtained from participation in the projects. We have identified that the scientific investigation of this perception by the stakeholders is complementary to our study.
The PWS3 project obtained the highest score for the IEng and IParc indicators given the institution and operation of an active Management Board (UGP, in the Portuguese acronym) which, in addition to making decisions, acted as a center of gravity in the aggregation of newly formalized and active partners such as the Technological Institute of Aeronautics (ITA), São Paulo State University (UNESP), Sanitation Company of the State of São Paulo (SABESP), Boticario Group Foundation, The Nature Conservancy (TNC), and the municipal ecosystem services fund itself. Other PWS projects have registered one-off partnerships. We can highlight the partnership of PWS1, PWS5, and PWS7 with the project “Replantando Vidas” of the Rio de Janeiro State Company of Water and Sewage (CEDAE), which donated native Atlantic Forest seedlings for complementary restoration actions in the contemplated areas.
Another important legacy of PWS projects is the constitution of a legal framework (ILeg) for municipalities to operate their PWS projects and programs. We observed that, in most of the municipalities contemplated, the legal procedures were modified and in others were created, as in PWS3, to meet the criteria of Notice 004/2014/AGEVAP (Table 8). With this, we observed the impact on public policies of municipalities.
Table 8.
Legal procedures created or modified due to the criteria of the notice of selection for the PWS projects of CEIVAP.
The amount of technical/scientific studies published (EPub) for PWS is also an important legacy of the PWS pilot program of CEIVAP. The PWS3 project was also the one that most inspired the scientific production, resulting directly from the partnerships established by the project. The exchange of technical information between the project’s partner institutions and the aggregation of research institutions to the project have made the pilot project a field of exploration of science in different areas of knowledge. It is also important to highlight the promotion and encouragement of science production by the State Environment Agency (INEA), a partner institution of the PWS pilot program of CEIVAP, which organized a special issue of the technical-scientific journal linked to the institution, with the publication of works developed in projects PWS1, PWS2, PWS5, PWS6, and PWS7.
3.4. Overview and Comparative Outcomes
The principal component analysis (PCA) provided interesting information on the distribution of scores achieved by the indicators. The principal component 1 (PC1) explained 44.66% of the total variance and the principal component 2 (PC2) explained 22.36%. Together, they explained 67.02% of the variation in the original data (Figure 4). The PCA shows that the restoration and survival rate indicators were strongly associated with PWS7, PWS1, PWS2, and PWS5, i.e., these indicators were determinant for the results of these projects in the overall comparative evaluation. Inversely related were the permanence and isolation indicators for PWS6 and PWS8. Conversely, all other indicators were more associated with the results of PWS4 and PWS3.
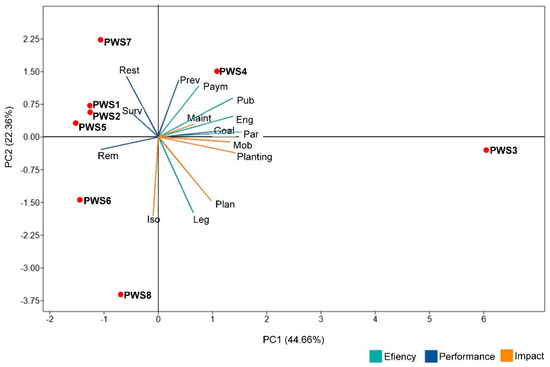
Figure 4.
Principal component analysis (PCA) for all scores in three dimensions.
Our proposed indicators for the comparative evaluation of projects have made it possible to characterize successful experiences, such as the PWS3 project, the only project in which the municipality is also the executor (Table 9). It is worth noting that in PWS3 strategic partnerships were consolidated, forming an active collective for decision making and overcoming conflicts. The project worked as a mobilizer of the “Programa Municipal São José Mais Água”, stimulating a municipal public policy planned to continue acting from its network of partners and funders.
Table 9.
Final score for the comparative evaluation of the efficiency, performance, and impact dimensions of the projects that integrate the PWS pilot program of CEIVAP.
The experiences of the PWS7 and PWS4 projects are also noteworthy. The implementation of the PWS7 project represented an unprecedented experience in the municipality of Resende/RJ, which from a group of stakeholders engaged by nature-based solutions, obtained the best performance in field interventions. The PWS4 project overcame the difficulties by consolidating partnerships with the municipality of Guaratinguetá/SP, which already had skills in the management of payments for watershed services projects.
The PWS1 fully met the proposed goals of serving the hired providers, isolation, and planting of the areas. However, the selection of areas with a high degradation degree was not accompanied by effective recovery solutions. The PWS8, PWS5, PWS6, and PWS2 projects reduced targets to achieve results in service to hired providers, isolation, planting, and maintenance of areas.
4. Discussion
4.1. Lessons from PWS of CEIVAP
In general, the complex scope, the lack of planning for mobilization in the sub-watershed, the complexity of forest restoration actions, the reduction of executive targets, the program’s target plan, and the absence of a monitoring methodology can be pointed out as key elements that weakened the projects and the PWS program of CEIVAP itself. All of the PWS projects followed the same scope defined in the AGEVAP [36]. The projects had in common the installation of PWS demonstration units in the municipality within 48 months after the signature of contracts was obtained from the institutions serving as executors. The mobilization and engagement of stakeholders and the promotion of municipal territorial management policies, as well as forest restoration interventions, proved to be incompatible with the pre-established schedule for project implementation.
We identified that both the PWS object and the scope of the projects that brought together structuring activities (mobilization, institutional arrangement, selection, and design) and structural activities (isolation of areas, planting and maintenance for forest restoration), required unprecedented multidisciplinary expertise from most of the institutions involved in implementing the program, as a process of “learning by doing” [47]. This knowledge is one of the great legacies of the program that we seek to measure with the IPub indicator. We have shown that systematic experiences in the form of technical/scientific publications are still incipient when compared with the quantity and diversity of results of regular evaluations of the program that are fragmented in the form of technical reports, financial follow-up spreadsheets, technical notes, surveys, and meeting reports [38].
In the execution of the structuring component, we identified failures in the process of mobilizing ecosystem services providers. We observed that, in most projects, the mobilization of providers did not follow a strategic planning that considered, for example, the hydrographic area in the municipal territory, the formation of a bank of areas with non-hired providers, and further mobilization actions. This planning would increase the efficiency of mobilization (EMob) and action planning (EPlan), selecting areas with greater potential for forest restoration in the short term that would reflect in increased efficiency (Eplanting and Emaint) and performance of restoration actions (PSurv and PRest).
Our results showed that failures in the mobilization process may have compromised the greater participation of ecosystem services providers in preventative actions for degrading agents (PPrev), permanence (PRem), and engagement (IEng) in the projects. In addition, by not considering hydrographic area in the mobilization planning, the actions were fragmented in the territory making it impossible to apply hydrological monitoring methodologies that could contribute to more tangible results, attracting new partners to the project (IPar).
4.2. Local Transformations, Actions, and Challenges
Only the PWS3 project had a planning for mobilization based on the hydrographic area of the municipality’s territory in order to concentrate the interventions in a strategic stretch of a micro watershed. Therefore, it was also the only project to carry out hydrological monitoring throughout the period of its implementation. We observed that hydrological monitoring is a key element in the PWS3 project for partnerships (IPar) and stakeholder engagement (IEng). In an assessment of water quality of the Ribeirão das Couves river (PWS3), the authors concluded that the water quality does not meet the limits for classification as the best-quality water by the Sanitation Company of the State of São Paulo, since there is a concentration of thermotolerant coliforms, such as Escherichia coli, in the water [48]. The results presented by Fiore et al. [48] indicate that these interventions carried out on rural properties included in the PWS3 project should be complemented with rural sanitation works to enhance the provision of environmental services effectively.
In another case study also conducted in the Brazilian Atlantic Forest, Hamel et al. [18] suggests that the hydrological information should be coded by those who will use this information, such as investors or project managers who may use the information and landowner who ideally are part of the planning process. Both qualitative and quantitative water (hydrological) monitoring should be performed in an integrated manner [19]. According to Taffarello et al. [19] the hydrological monitoring is essential to validate implemented land management actions as generators of water services, proving the effectiveness of PWS projects in providing these services. It is an important tool to convince water users (companies of water supply and hydroelectricity) to support the project, ensure its financial sustainability, and to provide funding for impact evaluations [49,50].
In PWS of CEIVAP, only quantitative targets of areas to be restored and conserved were described, with only field interventions for isolation of areas, planting, and maintenance for forest restoration being contemplated. From the forecast of restoring 395.15 ha of degraded areas and conserving 452.23 ha of forests, the PWS projects reached 188,58 ha of areas in the process of forest restoration (47.72%) and 718.63 ha of forest conservation areas (150% more than the initial target). If we consider the total area of the sub-watershed where the projects were implemented, the intervention achieved by the program (total restoration and conservation areas) accounts for less than 0.05% of the territory.
Two PES projects in the Brazilian Atlantic Forest (“Conservador de Águas” e “Produtor de Água e Floresta”) showed gains in forest cover, of 5.6% and 2.8% respectively, over 5 years [51]. The potential increase in forest cover achieved with the PWS program of CEIVAP has a smaller gain when compared to these projects. We can still highlight the fragmentation of these shares, making the results of the projects even less tangible. Successful forest restoration actions become a tool for institutional communication and efficient social mobilization. There is evidence in most projects of new landowners showing interest in joining the projects after field actions have been taken. This passive mobilization is another important legacy of the projects and demonstrates the importance of creating area banks with partners to ensure the continuity of the projects.
We observed that the execution of forest restoration actions and the structural component of the projects as a whole, proved to be a challenge due to the technical complexity of the field activities and the higher cost of the activities when compared to the structuring component. As the transfer of financial resources from CEIVAP is only executed by providing the service, the execution of the structural component by implementing institutions, almost all non-profit entities with limited working capital, functioned as a significant bottleneck for the projects [38].
One of the alternatives found by the implementing institutions was the outsourcing of the services of the structural stage. One of the problems with outsourcing activities is that companies offer the service at low cost and, potentially, with low quality [52]. Another characteristic of this type of contracting is the constant rotation of the outsourcers preventing them from engaging with the project objectives [53]. The outsourcing of forest restoration services has generated instability in the provision of forest restoration services, which has consequently had an impact on the increase in costs of maintaining the areas. Poor quality planting severely compromises the flow of the restoration process in the areas, given the delay effect on the speed of growth and development of the seedlings planted [54], demonstrated by the PRest indicator. Our results suggest that the lack of operational training of the hired labor is related to the increase in post-plant mortality rates and loss of maintenance efficiency, characterized by the PSurv and EMaint indicators.
In addition, the scope pre-defined that forest restoration actions would use no-till planting techniques, forest enrichment, or implementation of Agroforestry Systems (SAFs). No-till increases the cost range per hectare from $3.72 to $10.16/ha [55]. Although it has the predication of generating revenue in a forest ecosystem, SAFs were not adopted in any of the projects [56,57]. The EIso, EPlanting, and EMaint indicators could indicate the cost of the different techniques adopted, but as in almost all projects where full planting was adopted, the variation in efficiency reflects the variation in local input costs and project management strategy. In our study, we observed that the projects with the highest cost were also those with the highest percentage of areas in the forest restoration modality (PWS1, PWS4, and PWS8) with no-till planting at 3.0 × 2.0 m spacing.
During field visits, we observed technical solutions in some projects capable of optimizing forest restoration processes (PRest), as well as minimizing costs (EMaint), such as the combined use of soil preparation techniques with animal traction following the contour lines of the terrain, the compatibility of species to the forest site, the control of exotic grass population through chemical weeding, and periodic maintenance activities [55,58], which resulted in the distinctive performance of the forest restoration process in the PWS4 and PWS7 projects. We highlight that for PWS3 and PWS4, the UGP meetings were used as a space for alignment of stakeholders’ efforts in avoiding degradation agents to excel in maintenance efforts in areas with low forest restoration performance. Especially for the PWS4 project, stakeholders’ engagement through UGP meetings (IEng) avoided even worse project performance in occurrence of area degradation (PPrev) and withdrawals (PRem).
4.3. The Role of Environmental Planning in Local Issues
Restoration actions are more expensive, complex, and dependent on the seasonality of the climate than the conservation actions [59,60,61]. The failure to achieve full restoration targets in some of the projects could have been accompanied by an increase in the conservation areas among the properties in the projects. The PWS2 project is an example of low performance in meeting targets (PGoal) for the need to reduce forest restoration targets. However, for this project, no efforts were made to increase the conservation areas, as was done in PSW3. In the latter, the reduction of restoration targets was accompanied by an increase in conservation areas with the incorporation of large areas of Private Natural Heritage Reserves (RPPN, in the Portuguese acronym) [62].
We also observed the need for investment in complementary practices such as the readjustment of rural roads, soil erosion control, conservationist management in livestock production, and rural sanitation, given the situation of areas located inside the properties contemplated by the program (Figure 5). We highlighted that soil conservation practices could increase baseflow and decrease direct runoff in a short period of time [63]. These interventions, besides potentializing the provision of water ecosystem services, may contribute to the perception of direct results of the projects [33,64], but all of this depends on field monitoring. However, in practical terms, the costs of monitoring are an obstacle for its implementation [49].
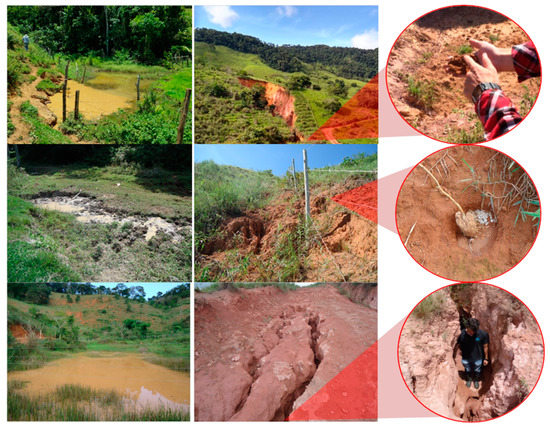
Figure 5.
Examples of degraded areas located in rural properties covered by the PWS projects of the CEIVAP pilot program.
Since the territorial management is a central objective of the PWS of CEIVAP, our results showed that most of the projects failed to promote effective transformations such as the creation of a legal framework (ILeg), knowledge production (IPub), and even payment for ecosystem services (IPaym). The absence of a general evaluation methodology of this project compromised the establishment of partnerships and engagement of the stakeholders and, in fact, compromised the appropriation of this type of project as an instrument of territorial management by the municipalities.
4.4. Beyond the Economic Benefits
The specialized scientific literature reports a discrepancy between the conceptual model of PES arrangements and the practical establishment of these arrangements [65,66,67]. In fact, none of the projects obtained a PES arrangement that achieved functional autonomy. Even for the projects that achieved the best results in the indicator that measures the amount of PES installments paid (IPaym), there is uncertainty about the maintenance of these arrangements after the suspension of CEIVAP investments. By December 2019, only the municipalities of Resende/RJ and São José dos Campos/SP had executed the payment of all the PES installments foreseen in the PWS7 and PWS3 project, respectively. In the remaining projects, only half of the installments were paid and in 4 of the 11 municipalities (36.36%) the PES payments were not executed.
The failure to make payments exposed the PWS2, PWS6, and PWS8 projects to the failure to achieve their main objectives. However, we do not see withdrawals motivated by the failure to achieve the PES payment. This indicates that the providers may be satisfied with the interventions carried out on the rural property, especially the environmental adequacy of the rural property. However, the discontinuity is a common element to PES initiatives in Brazil [68].
Our results indicate that the PWS projects implemented in municipalities that already have a municipal PWS program, with its own investment fund, such as in the municipalities of Guaratinguetá/SP (PWS4) and São José dos Campos (PWS3), fostered the improvement of the municipality’s legal framework and the production of knowledge. For municipalities that did not have this type of program, the projects provided the opportunity to implement this new conservation policy. Nevertheless, the PWS required changes in land use practices that are associated with social and cultural factors, based on the individual and collective values of the landowners [69,70].
Regarding the legal factor, we highlight the guidelines of the Native Vegetation Protection Law (LPVN or “Forest Cod”, Law No. 12,651/2012), and the Atlantic Forest Law (Law No. 11,428/2006). After a property is reforested, Brazilian law requires special authorization for new land use conversion, especially in the Atlantic Forest [71]. Thus, PWS payments to those landowners who have designated areas for reforestation need to be large enough to offset the opportunity cost of future alternative land uses [55]. On the other hand, Richards et al. [69] suggest addressing the perceived risks of non-compliance with legislation to win more available providers for reforestation. In any case, this instrumental aspect of PWS projects shows that, in addition to the restoration goals for the Atlantic Forest being large, there are also major challenges that will require investments from various sources and under more diversified conditions [72]. The targeting of these actions based on the provision of ES can provide major gains in the impacts of PES and PWS [73].
The benefits to PWS project registrants may go beyond compliance with the law. Impacts on the forest may include ecological benefits, such as greater forest connectivity, but also socioeconomic benefits such as the generation of “green jobs”, improved institutional capacity, and local governance, as presented by Fiorini et al. [55] in an evaluation of the PES project “Produtores de Água e Floresta”, also in the Atlantic Forest in the state of Rio de Janeiro. In the review by Bremer et al. [70], they found that the influence of the PWS projects on local governance systems was sometimes due to collective rights and responsibilities to take care of the land. In our study, we found similar results regarding the prevention of degradation agents (cattle, fire, and soil erosion). Prevention actions are understood in the PWS projects of CEIVAP as a collective responsibility. Therefore, the more engaged, the more favorable the conduct of the provider in the care, follow-up, and monitoring of the areas contemplated.
The amount paid in the form of PES was also not reported as a reason for withdrawing the projects. For PWS projects in the Atlantic Forest, payment amounts range from $5 annually to $272 per hectare monthly [74]. For example, in “Oasis Project”, in Apucarana, Santa Catarina, south of Brazil, the average value would be approximately $6/ha/month [49]. In the PWS of CEIVAP, the maximum amount is $30.00 ha−1·year−1, based on the average cost for leasing pasture for livestock production in BHRPS [29]. On average, it is a higher value than presented by Fiorini et al. [55], in which values varied between $5 and $29 ha−1·year−1. In the research of Ramos et al. [75], the providers of this program consider the value irrelevant, and are interested in joining the project due to the perception of the need for conservation and forest recovery.
5. Limitations of Research and Future Perspectives
The limitations of this research are in the field of data collection. Several researchers have noted the limitations involved with using observations as a tool for data collection [43]. Furthermore, according to Kawulich [43], the researcher must understand how their conceptions can affect observation, analysis, and interpretation. Regarding the methodology application, the major limiting factor was data access in the documental analysis. The Pilot Program of PWS by CEIVAP did not present a cohesive organization of monitoring data. There were many types of secondary sources (reports and technical notes, minutes of meetings, measurement bulletins of works in PWS projects, schedules, and budgets) that we had to carefully analyze for a robust documental analysis process. However, we have shown that it is possible to use the proposed indicators in other programs is perfectly achievable once the required data are presented as “inputs”.
Continuing the policy of PWS by CEIVAP, the program “Mananciais” [76] was planned aiming to “protect, maintain, recover, expand, and/or ensure the provision of ecosystem services that contribute to the maintenance of quality and regulation of water availability of strategic springs for the affluent of the Paraíba do Sul river in an inclusive and participatory way, ensuring human well-being, water security, and health of ecosystems associated with water in the medium and long term”. Thus, the elements identified from this case study should be addressed in the scope of the “Mananciais” program, in order to enhance successful solutions and remove or mitigate inadequate measures. Hence, we understand that Brazilian PES programs should have a more robust plan to guarantee its assessment and reports for investors, partners, and users [63].
Future studies should be encouraged to analyze the social dimension of the impacts of the PWS projects of CEIVAP, since encouraging pro-environmental behavior requires consideration of all barriers to action faced by the target population [77]. These studies should support a water-energy-food nexus approach for enhancing environmental planning in watersheds, beyond the public water supply [78]. After all, PES or PWS projects should no longer be seen strictly as market transactions [5].
6. Concluding Remarks
The implementation of this Pilot Program represents a conceptual framework for water resources management in the Paraíba do Sul River Basin. By encouraging the use of PES as a tool for territorial management, CEIVAP contemplates from ecological economy to environmental democratization [79,80]. It evokes the “conservative-recipient” principle as a key instrument in the implementation of the National Water Resources Policy in one of the most important watersheds in Brazil.
Our methodological proposal allowed a comparative analysis of the PWS projects of CEIVAP based on easily measured indicators. We characterized the projects with the best effectiveness and projects that showed commitment to performance by the prevalence of key elements that weaken the implementation process. We presented the performance of the projects due to the prevalence of key elements that weaken the implementation process. The excessive reduction of targets and, consequently, the increase in project costs characterize the projects with the worst effectiveness. On the other hand, the consolidation of partners, the maintenance of the collective of engaged stakeholders, and the engineering solutions that allowed effectiveness of field actions can be pointed out as the elements that helped the projects to overcome innate weaknesses (of scope) and obtain a good performance compared to other projects.
In this process of continuous improvement of its investment tools, CEIVAP consolidates an investment policy in ES that presents synergy with the Sustainable Development Goals [81], Brazil’s national commitment to the Paris Climate Agreement [82], and to the environmental regularization of rural properties, as provided in the LPVN [46]. Combining water resources management with environmental and territorial management optimizes the application of public financial resources, increasing the effectiveness of public policies for solutions based on nature. We emphasize that the PWS program performance assessment is an important opportunity to improve our understanding of the linkages between land management practices and ecosystem services in watersheds, also making ecosystem services more resilient to climatic variables [50,63,83]. PWS programs can be mechanisms to encourage the provision of ecosystem services for human wellbeing and nature conservation. They are schemes that can change regional landscapes and achieve global sustainability goals.
Supplementary Materials
The following are available online at https://www.mdpi.com/2073-4441/12/9/2441/s1.
Author Contributions
This paper is a joint effort by several authors. F.A.M.d.S. and M.G.C.-J. conceptualized the idea, obtained funding, performed the data analysis, and drafted the manuscript. J.C.C. assisted data analysis, editing, and translating the manuscript. A.L.d.P.M. contributed to the validation and data curation. V.M.B. and E.M.R.d.S. provided critical feedback and provided edits. All authors have read and agreed to the published version of the manuscript.
Funding
This study was financed in part by the Coordenação de Aperfeiçoamento de Pessoal de Nível Superior—Brasil (CAPES)-Finance Code 001.
Acknowledgments
The authors would like to thank the stakeholders of Associação Pró-Gestão das Águas da Bacia Hidrográfica do Rio Paraíba do Sul (AGEVAP), the Comitê de Integração da Bacia Hidrográfica do Rio Paraíba do Sul (CEIVAP) for supporting the study’s publication, the Empresa Brasileira de Pesquisa Agropecuária (EMBRAPA), and the Graduate Program in Environmental and Forest Sciences at Federal Rural University of Rio de Janeiro.
Conflicts of Interest
The authors declare no conflict of interest.
References
- Constanza, R.; D’Arge, R.; de Groot, R.; Farberll, S.; Grassot, M.; Hannon, B.; Limburg, K.; Naeem, S.; O’Neilltt, R.V.; Paruello, J.; et al. The value of the world’s ecosystem services and natural capital. Nature 1997, 387, 253–260. [Google Scholar] [CrossRef]
- De Groot, R.S.; Wilson, M.A.; Boumans, R.M.J. A typology for the classification, description and valuation of ecosystem functions, goods and services. Ecol. Econ. 2002, 41, 393–408. [Google Scholar] [CrossRef]
- Millennium Ecosystem Assessment. Ecosystems and human well-being: A framework for assessment. In Millennium Ecosystem Assessment; Island Press: Washington, DC, USA, 2003. [Google Scholar]
- Grima, N.; Singh, S.J.; Smetschka, B.; Ringhofer, L. Payment for Ecosystem Services (PES) in Latin America: Analysing the performance of 40 case studies. Ecosyst. Serv. 2016, 17, 24–32. [Google Scholar] [CrossRef]
- Muradian, R.; Corbera, E.; Pascual, U.; Kosoy, N.; May, P.H. Reconciling theory and practice: An alternative conceptual framework for understanding payments for environmental services. Ecol. Econ. 2010, 69, 1202–1208. [Google Scholar] [CrossRef]
- Ottaviani, D.; Scialabba, N.E.H. Payments for Ecosystem Services and Food Security; Food and Agriculture Organization of the United Nations: Rome, Italy, 2011. [Google Scholar]
- Pirard, R. Payments for environmental services (PES) in the public policy landscape: Mandatory spices in the Indonesian recipe. For. Policy Econ. 2012, 18, 23–29. [Google Scholar] [CrossRef]
- Muradian, R.; Arsel, M.; Pellegrini, L.; Adaman, F.; Aguilar, B.; Agarwal, B.; Corbera, E.; de Blas, D.E.; Farley, J.; Froger, G.; et al. Payments for ecosystem services and the fatal attraction of win-win solutions. Conserv. Lett. 2013, 6, 274–279. [Google Scholar] [CrossRef]
- Wegner, G.I. Payments for ecosystem services (PES): A flexible, participatory, and integrated approach for improved conservation and equity outcomes. Environ. Dev. Sustain. 2016, 18, 617–644. [Google Scholar] [CrossRef]
- Haile, K.K.; Tirivayi, N.; Tesfaye, W. Farmers’ willingness to accept payments for ecosystem services on agricultural land: The case of climate-smart agroforestry in Ethiopia. Ecosyst. Serv. 2019, 39, 100964. [Google Scholar] [CrossRef]
- Martin-Ortega, J.; Ojea, E.; Roux, C. Payments for water ecosystem services in Latin America: A literature review and conceptual model. Ecosyst. Serv. 2013, 6, 122–132. [Google Scholar] [CrossRef]
- Zanella, M.A.; Schleyer, C.; Speelman, S. Why do farmers join Payments for Ecosystem Services (PES) schemes? An Assessment of PES water scheme participation in Brazil. Ecol. Econ. 2014, 105, 166–176. [Google Scholar] [CrossRef]
- Balvanera, P.; Uriarte, M.; Almeida-Leñero, L.; Altesor, A.; DeClerck, F.; Gardner, T.; Hall, J.; Lara, A.; Laterra, P.; Peña-Claros, M.; et al. Ecosystem services research in Latin America: The state of the art. Ecosyst. Serv. 2012, 2, 56–70. [Google Scholar] [CrossRef]
- Arriagada, R.A.; Sills, E.O.; Ferraro, P.J.; Pattanayak, S.K. Do payments pay off? Evidence from participation in Costa rica’s PES program. PLoS ONE 2015, 10, e0131544. [Google Scholar] [CrossRef]
- Pagiola, S.; von Glehn, H.C.; Taffarello, D. Brazil’s Experience with Payments for Environmental Services. In PES Learning Paper; World Bank: Washington, DC, USA, 2013. [Google Scholar]
- Bennett, G.; Carroll, N. Gaining Depth: State of Watershed Investment 2014; Forest Trends: Washington, DC, USA, 2014; Available online: https://www.foresttrends.org/publications/gaining-depth-2/ (accessed on 13 March 2020).
- Guedes, F.B.; Seehusen, S.E. (Eds.) O PSA na Mata Atlântica—Situação Atual, Desafios e Recomendações; Ministério do Meio Ambiente: Brasília, Brazil, 2011. [Google Scholar]
- Hamel, P.; Bremer, L.L.; Ponette-González, A.G.; Acosta, E.; Fisher, J.R.; Steele, B.; Cavassani, A.T.; Klemz, C.; Blainski, E.; Brauman, K.A. The value of hydrologic information for watershed management programs: The case of Camboriú, Brazil. Sci. Total Environ. 2020, 705, 135871. [Google Scholar] [CrossRef]
- Taffarello, D.; do Carmo, C.M.; Viani, R.A.G.; Marengo, J.A.; Mendiondo, E.M. Hydrological services in the Atlantic Forest, Brazil: An ecosystem-based adaptation using ecohydrological monitoring. Clim. Serv. 2017, 8, 1–16. [Google Scholar] [CrossRef]
- Brasil Lei nº 9.433, de 8 de Janeiro de 1997. Institui a Política Nacional de Recursos Hídricos, Cria o Sistema Nacional de Gerenciamento de Recursos Hídricos, Regulamenta o Inciso XIX do Art. 21 da Constituição Federal, e Altera o art. 1º da Lei nº 8.001, de 13 de Março de 1990, que Modificou a Lei nº 7.990, de 28 de dezembro de 1989. 1997. Available online: http://www.planalto.gov.br/ccivil_03/leis/l9433.htm (accessed on 6 February 2020).
- Bösch, M.; Elsasser, P.; Wunder, S. Why do payments for watershed services emerge? A cross-country analysis of adoption contexts. World Dev. 2019, 119, 111–119. [Google Scholar] [CrossRef]
- Vogl, A.L.; Goldstein, J.H.; Daily, G.C.; Vira, B.; Bremer, L.; McDonald, R.I.; Schemie, D.; Tellman, B.; Cassin, J. Mainstreaming investments in watershed services to enhance water security: Barriers and opportunities. Environ. Sci. Policy 2017, 75, 19–27. [Google Scholar] [CrossRef]
- Costa, F.L.; Castanhar, J.C. Avaliação de programas públicos: Desafios conceituais e metodológicos. Rev. Adm. Púb. 2003, 37, 969–992. [Google Scholar]
- Novaes, R.M.L. Monitoramento em programas e políticas de pagamentos por serviços ambientais em atividade no Brasil. Estud. Soc. Agric. 2014, 22, 408–431. [Google Scholar]
- Turetta, A.P.D.; Prado, R.B.; Fidalgo, E.C.C.; Schuler, A.E.; Coutinho, H.L.C. Seleção de indicadores para o monitoramento de PSA hídricos. In Manual para Pagamento por Serviços Ambientais Hídricos: Seleção de Áreas e Monitoramento; Embrapa: Brasília, Brazil, 2017. [Google Scholar]
- Börner, J.; Baylis, K.; Corbera, E.; Ezzine-de-Blas, D.; Honey-Rosés, J.; Persson, U.M.; Wunder, S. The effectiveness of payments for environmental services. World Dev. 2017, 96, 359–374. [Google Scholar] [CrossRef]
- Campanhão, L.M.B.; Ranieri, V.E.L. Guideline framework for effective targeting of payments for watershed services. Forest Policy Econ. 2019, 104, 93–109. [Google Scholar] [CrossRef]
- Sano, H.; Montenegro-Filho, M.J.F. As técnicas de avaliação da eficiência, eficácia e efetividade na gestão pública e sua relevância para o desenvolvimento social e das ações públicas. In Desenvolvimento em Questão; Editora Unijuí: Ijuí, Brazil, 2013. [Google Scholar]
- Andrade, M.P.; Ribeiro, C.B.M.; Lima, R.N.S. Avaliação do uso e ocupação do solo na bacia hidrográfica do rio Paraíba do Sul na primeira década do século XXI a partir de imagens MODIS—Land Cover. In Anais. In Proceedings of the XVII Simpósio Brasileiro de Sensoriamento Remoto—SBSR, João Pessoa, Brazil, 25–29 April 2015. [Google Scholar]
- Ioris, A.A.R. Os limites políticos de uma reforma incompleta: A implementação da Lei dos Recursos Hídricos na Bacia do Paraíba do Sul. Rev. Bras. Est. Urb. Reg. 2008, 10, 61–85. [Google Scholar] [CrossRef]
- Instituto Brasileiro de Geografia e Estatística (IBGE). Censo Demográfico de 2010. Available online: http://mapasinterativos.ibge.gov.br/atlas_ge/brasil1por1.html (accessed on 10 February 2020).
- Mittermeier, G.P.R.; Hoffmann, M.; Pilgrin, J.; Brocks, T.; Mittermeier, C.G.; Lamoures, J.; Fonseca, G.A.B. Hotspots Revisited. In Earth Biologically Richest and Most Endangered Terrestrial Ecorregions; University of Chicago Press: Boston, MA, USA, 2005. [Google Scholar]
- Motta, R.S.; Ortiz, R.A. Costs and Perceptions Conditioning Willingness to Accept Payments for Ecosystem Services in a Brazilian Case. Ecol. Econ. 2018, 147, 333–342. [Google Scholar] [CrossRef]
- Acselrad, M.V.; Azevedo, J.P.S.; Johnsson, R.M.F. Cobrança pelo uso da água no Estado do Rio de Janeiro, Brasil (2004–2013): Histórico e desafios atuais. Eng. Sanit. Ambient. 2015, 20, 199–208. [Google Scholar] [CrossRef]
- Carmo, R.L.; Anazawa, T.M. Hidromegalópole São Paulo-Rio de Janeiro: Escassez hídrica, sobreposição de espacialidades e conflitos. Bol. Reg. Urb. Amb. 2017, 1, 61–68. [Google Scholar]
- Associação Pró-gestão das Águas da Bacia Hidrográfica do Rio Paraíba do Sul (AGEVAP). Programa de Pagamento por Serviços Ambientais com foco em Recursos Hídricos do CEIVAP. 2014. Available online: http://ceivap.org.br/conteudo/edital-psa-hidrico-programa.pdf (accessed on 12 April 2019).
- Stebbins, R.A. Exploratory Research in the Social Sciences; Sage: Thousand Oaks, CA, USA, 2001. [Google Scholar]
- Santos, F.A.M.; Marques, A.L.P.; Assis, M.M.C.; Costa, A.C.; Côrtes, R.T. CEIVAP e a construção de uma política de integração para a Bacia do Paraíba do Sul. Rev. Ineana 2019, 7, 45–63. [Google Scholar]
- Combessie, J.C. Método em Sociologia; Edições Loyola: São Paulo, Brazil, 2004. [Google Scholar]
- Creswell, J.W. Research Design: Qualitative and Mixed Methods Approaches; Sage: Thousand Oaks, CA, USA, 2009. [Google Scholar]
- Mack, N.; Woodsong, C.; MacQueen, K.M.; Guest, G.; Namey, E. Qualitative Research Methods: A Data Collector’s Field Guide; Family Health International: Durham, NC, USA, 2005. [Google Scholar]
- Ahmed, J.U. Documentary Research Method: New Dimensions. Indus J. Manag. Soc. Sci. 2010, 4, 1–14. [Google Scholar]
- Kawulich, B.B. Participant Observation as a Data Collection Method. Forum Qual. Soc. Res. 2005, 6, 43. Available online: http://nbnresolving.de/urn:nbn:de:0114-fqs0502430 (accessed on 11 October 2019).
- Jorgensen, D.L. Participant Observation. In Emerging Trends in the Social and Behavioral Sciences: An Interdisciplinary, Searchable, and Linkable Resource; John Wiley & Sons: New York, NY, USA, 2015. [Google Scholar]
- Ter Braak, C.J.; Smilauer, P. CANOCO Reference Manual and CanoDraw for Windows User’s Guide: Software for Canonical Community Ordination (Version 4.5); Wageninen University and Research: Wageninen, The Netherlands, 2002. [Google Scholar]
- Brasil Lei nº 12.651, de 25 de Maio de 2012. Dispõe sobre a Proteção da Vegetação Nativa; Altera as Leis nº 6.938, de 31 de Agosto de 1981, 9.393, de 19 de Dezembro de 1996, e 11.428, de 22 de Dezembro de 2006; Revoga as Leis nº 4.771, de 15 de Setembro de 1965, e 7.754, de 14 de Abril de 1989, e a Medida Provisória nº 2.166-67, de 24 de Agosto de 2001; e dá Outras Providências. Available online: http://www.planalto.gov.br/ccivil_03/_ato2011-2014/2012/lei/l12651.htm (accessed on 6 February 2020).
- DuFour, R.; DuFour, R.; Eaker, R.; Many, T. Learning by Doing: A Handbook for Professional Learning Communities at Work TM; Solution Tree: Bloomington, IL, USA, 2006. [Google Scholar]
- Fiore, F.A.; Bardini, V.S.S.; Novaes, R.C. Monitoramento da qualidade de águas em programas de pagamento por serviços ambientais hídricos: Estudo de caso no município de São José dos Campos/SP. Eng. Sanit. Amb. 2017, 22, 1141–1150. [Google Scholar] [CrossRef]
- Young, C.E.F.; de Bakker, L.B. Payments for ecosystem services from watershed protection: A methodological assessment of the Oasis Project in Brazil. Nat. Conserv. 2014, 12, 71–78. [Google Scholar] [CrossRef]
- Brownson, K.; Fowler, L. Evaluating how we evaluate success: Monitoring, evaluation and adaptive management in Payments for Watershed Services programs. Land Use Policy 2020, 94, 104505. [Google Scholar] [CrossRef]
- Ruggiero, P.G.; Metzger, J.P.; Tambosi, L.R.; Nichols, E. Payment for ecosystem services programs in the Brazilian Atlantic Forest: Effective but not enough. Land Use Policy 2019, 82, 283–291. [Google Scholar] [CrossRef]
- Valença, M.C.D.A.; Barbosa, A.C.Q. A terceirização e seus impactos: Um estudo em grandes organizações de Minas Gerais. Rev. Adm. Contemp. 2002, 6, 163–185. [Google Scholar] [CrossRef]
- Pochmann, M. A Transnacionalização da Terceirização na Contratação do Trabalho; Idéias: Campinas, Brazil, 2008. [Google Scholar]
- Resende, A.S.; Leles, P.S.S. Controle de Plantas Daninhas em Restauração Florestal; Embrapa: Brasília, Brazil, 2017. [Google Scholar]
- Fiorini, A.C.O.; Mullally, C.; Swisher, M.; Putz, F.E. Forest cover effects of payments for ecosystem services: Evidence from an impact evaluation in Brazil. Ecol. Econ. 2020, 169, 106522. [Google Scholar] [CrossRef]
- Kay, S.; Graves, A.; Palma, J.H.; Moreno, G.; Roces-Díaz, J.V.; Aviron, S.; Chouvardas, D.; Crous-Duran, J.; Ferreiro-Domínguez, N.; Jalón, S.G.; et al. Agroforestry is paying off—Economic evaluation of ecosystem services in European landscapes with and without agroforestry systems. Ecosyst. Serv. 2019, 36, 100896. [Google Scholar] [CrossRef]
- Martinelli, G.C.; Schlindwein, M.M.; Padovan, M.P.; Gimenes, R.M.T. Decreasing uncertainties and reversing paradigms on the economic performance of agroforestry systems in Brazil. Land Use Policy 2019, 80, 274–286. [Google Scholar] [CrossRef]
- Nave, A.G.; Brancalion, P.H.S.; Coutinho, E.; Cesar, R.G. Descrição das ações operacionais de restauração. In Pacto pela Restauração da Mata Atlântica: Referencial dos Conceitos e Ações de Restauração Florestal; LERF/ESALQ: São Paulo, Brazil, 2009. [Google Scholar]
- Brancalion, P.H.S.; Schweizer, D.; Gaudare, U.; Mangueira, J.R.; Lamonato, F.; Farah, F.T.; Nave, A.G.; Rodrigues, R.R. Balancing economic costs and ecological outcomes of passive and active restoration in agricultural landscapes: The case of Brazil. Biotropica 2016, 48, 856–867. [Google Scholar] [CrossRef]
- Brancalion, P.H.; Meli, P.; Tymus, J.R.; Lenti, F.E.; Benini, R.M.; Silva, A.P.M.; Isernhagen, I.; Holl, K.D. What makes ecosystem restoration expensive? A systematic cost assessment of projects in Brazil. Biol. Conserv. 2019, 240, 108274. [Google Scholar] [CrossRef]
- Strassburg, B.B.N.; Beyer, H.L.; Crouzeilles, R.; Iribarrem, A.; Barros, F.; Siqueira, M.F.; Sánchez-Tapia, A.; Balmford, A.; Sansevero, J.B.B.; Brancalion, P.H.S.; et al. Strategic approaches to restoring ecosystems can triple conservation gains and halve costs. Nat. Ecol. Evol. 2019, 3, 62–70. [Google Scholar] [CrossRef]
- Brasil Lei nº 9.985, de 18 de Julho de 2000. Regulamenta o Art. 225, §1o, Incisos I, II, III e VII da Constituição Federal, Institui o Sistema Nacional de Unidades de Conservação da Natureza e dá Outras Providências. 2000. Available online: http://www.planalto.gov.br/ccivil_03/leis/l9985.htm (accessed on 6 February 2020).
- Sone, J.S.; Gesualdo, G.C.; Zamboni, P.A.; Vieira, N.O.; Mattos, T.S.; Carvalho, G.A.; Rodrigues, D.B.B.; Sobrinho, T.A.; Oliveira, P.T.S. Water provisioning improvement through payment for ecosystem services. Sci. Total Environ. 2019, 655, 1197–1206. [Google Scholar] [CrossRef]
- Trevisan, A.C.D.; Schimitt-Filho, A.L.; Farley, J.; Fantini, A.C.; Longo, C. Farmer perceptions, policy and reforestation in Santa Catarina, Brazil. Ecol. Econ. 2016, 130, 53–63. [Google Scholar] [CrossRef]
- Andrade, D.C.; Simões, M. Limitações da abordagem coaseana à definição do instrumento de Pagamento por Serviços Ambientais (PSA). Sustent. Debate 2013, 4, 59–78. [Google Scholar]
- Simões, M.S.; Andrade, D.C. Revisitando a teoria e compreendendo a prática: Análise de casos de pagamento por serviços ambientais. Rev. Pol. Púb. 2016, 20, 903–926. [Google Scholar] [CrossRef][Green Version]
- Santos, D.G.E.; Sena, R.F.M. O Programa Produtor de Água: Histórico e Implementação. In A Experiência do Projeto Produtor de Água na Bacia Hidrográfica do Ribeirão Pipiripau; ANA: Brasília, Brazil, 2018. [Google Scholar]
- Prado, R.B.; Costa, M.; Lima, A.P.M.; Schuler, A.E.; Guimaraes, J.; Fidalgo, E.C.C.; Turetta, A.P.; Monteiro, J.M.G.; Martins, A.L.S.; Oliveira, A.P.; et al. Evolução das iniciativas de pagamentos por serviços ambientais hídricos no Brasil. Cad. Ciênc. Tecn. 2019, 36, 1–13. [Google Scholar] [CrossRef][Green Version]
- Richards, R.C.; Kennedy, C.J.; Lovejoy, T.E.; Brancalion, P.H. Considering farmer land use decisions in efforts to ‘scale up’ Payments for Watershed Services. Ecosyst. Serv. 2017, 23, 238–247. [Google Scholar] [CrossRef]
- Bremer, L.L.; Brauman, K.A.; Nelson, S.; Prado, K.M.; Wilburn, E.; Fiorini, A.C.O. Relational values in evaluations of upstream social outcomes of watershed Payment for Ecosystem Services: A review. Curr. Opin. Envi. Sust. 2018, 35, 116–123. [Google Scholar] [CrossRef]
- Brasil Lei nº 11.428, de 22 de Dezembro de 2006. Dispõe sobre a Utilização e Proteção da Vegetação Nativa do Bioma Mata Atlântica, e dá Outras Providências. 2006. Available online: http://www.planalto.gov.br/ccivil_03/_Ato2004-2006/2006/Lei/L11428.htm (accessed on 6 February 2020).
- Pinto, S.R.; Melo, F.; Tabarelli, M.; Padovezi, A.; Mesquita, C.A.; Scaramuzza, C.A.M.; Castro, P.; Corrascosa, H.; Calmon, M.; Rodrigues, R.; et al. Governing and Delivering a Biome-Wide Restoration Initiative: The Case of Atlantic Forest Restoration Pact in Brazil. Forests 2014, 5, 2212–2229. [Google Scholar] [CrossRef]
- Lundberg, L.; Persson, U.M.; Alpizar, F.; Lindgren, K. Context matters: Exploring the cost-effectiveness of fixed payments and procurement auctions for PES. Ecol. Econ. 2018, 146, 347–358. [Google Scholar] [CrossRef]
- Rodríguez-Osuna, V.; Börner, J.; Nehren, U.; Prado, R.B.; Gaese, H.; Heinrich, J. Priority areas for watershed service conservation in the Guapi-Macacu region of Rio de Janeiro, Atlantic Forest, Brazil. Ecol. Process. 2014, 3, 1–21. [Google Scholar] [CrossRef]
- Ramos, D.A.L.; Aguiar, F.R.; Vilela, L.E. O projeto Produtores de Água e Floresta em Rio Claro-RJ: Uma análise da governança no projeto sob a ótica da gestão social. Soc. Quest. 2016, 36, 177–196. [Google Scholar]
- Associação Pró-Gestão das Águas da Bacia Hidrográfica do Rio Paraíba Do Sul—AGEVAP. Programa de Investimento em Serviços Ambientais para a Conservação e Recuperação de Mananciais. 2019. Available online: http://54.94.199.16:8080/publicacoesArquivos/ceivap/arq_pubMidia_Processo_607_2019_Programa_Investimento_em_Servicos_Ambientais_Conservacao_Recuperacao_de_mananciais.pdf (accessed on 20 January 2020).
- Richards, R.C.; Petrie, R.; Christ, J.B.; Ditt, E.; Kennedy, C.J. Farmer preferences for reforestation contracts in Brazil’s Atlantic Forest. For. Policy Econ. 2020, 118, 102235. [Google Scholar] [CrossRef]
- Melloni, G.; Turetta, A.P.D.; Bonatti, M.; Sieber, S. A Stakeholder Analysis for a Water-Energy-Food Nexus Evaluation in an Atlantic Forest Area: Implications for an Integrated Assessment and a Participatory Approach. Water 2020, 12, 1977. [Google Scholar] [CrossRef]
- Fell, E.T.; Treméa, E.M. O princípio do Protetor-Recebedor e o Proambiente: Limites e Possibilidade da Compensação Financeira; Âmbito Jurídico: São Paulo, Brazil, 2008. [Google Scholar]
- Altmann, A. Princípio do preservador-recebedor: Contribuições para a consolidação de um novo princípio de direito ambiental a partir do sistema de pagamento por serviços ambientais. In Princípios do Direito Ambiental: Atualidades; Educs: Caxias do Sul, Brazil, 2012. [Google Scholar]
- United Nations (UN). Transforming Our World: The 2030 Agenda for Sustainable Development; Resolution A/70/1; UN: New York, NY, USA, 2015.
- The Guardian. Brazil Ratifies Paris Agreement with Pledge to Sharply Reduce Emissions; The Guardian: London, UK, 2016; Available online: https://www.theguardian.com/environment/2016/sep/13/brazil-ratifies-paris-agreement-with-pledge-to-sharply-reduce-emissions (accessed on 16 April 2020).
- Bremer, L.L.; Auerbach, D.A.; Goldstein, J.H.; Vogl, A.L.; Shemie, D.; Kroeger, T.; Nelson, J.L.; Benitez, S.P.; Calvache, A.; Guimaraes, J.; et al. One size does not fit all: Natural infrastructure investments within the Latin American water funds partnership. Ecosyst. Serv. 2016, 17, 217–236. [Google Scholar] [CrossRef]


© 2020 by the authors. Licensee MDPI, Basel, Switzerland. This article is an open access article distributed under the terms and conditions of the Creative Commons Attribution (CC BY) license (http://creativecommons.org/licenses/by/4.0/).