Abstract
Deionized and tap water were saturated with molecular oxygen either prior to (WST), or after (WTS), treatment with low-temperature, low-pressure glow plasma of low frequency (LPGP) for 0, 5, 15, 30, 60, 90, and 120 min. Physical and physicochemical properties of the resulting liquids were characterized, involving pH, conductivity, density, dissolved molecular oxygen, active oxygen content, differential scanning calorimetry (DSC), ultraviolet-visible (UV-VIS), Fourier transformation infrared-attenuated total reflectance (FTIR-ATR), electronic spin resonance (ESR), and Raman spectroscopies. Tap WST treated with LPGP for 30 min contained the highest level of dissolved molecular oxygen, compared to original non-treated tap water (23 and 15 mg/L, respectively). Essential differences in all investigated properties of LPGP treated tap and deionized WST, compared to those for corresponding WTS, pointed to the indispensable role of dissolved oxygen molecules in building water macrostructure. In the case of tap WST, formation of niches and/or caverns hosting anions (HCO3−, SO4=) was accompanied by cations less enveloped by hydroxyl groups of water. The WST water contained niches of larger size, hosting molecules of oxygen interacting with the environment in various manners. In WTS there was a priority for single donor, single hydrogen bonded water, and free water in building the macrostructure. Such macrostructures host molecular oxygen which, depending on the LPGP treatment time, took either a singlet of triplet state.
1. Introduction
Recently, a series of papers have been published on changing the macrostructure of water with low-temperature, low pressure glow plasma of low frequency (LPGP). The exposition of water to LPGP was performed either in the air [1], under oxygen-free nitrogen [2], methane [3], or carbon dioxide [4]. Physical, physicochemical, and chemical properties of so treated water depended not only on the selected gaseous environment but also on the treatment time. In this paper physical, physicochemical, and chemical properties of water treated with LPGP under molecular oxygen are presented.
It was assumed that for its functional properties such water could be competitive to other known oxygenated waters. The latter were available either by saturation of water with molecular oxygen also under elevated pressure [5,6], saturation of water with oxygen supplemented by ozone [7], admixture of stabilized by polyvinylpyrrolidone hydrogen peroxide to water [8], or electrolysis of halide ion-free water in an electrolytic cell. In that procedure electrodes were separated by a gas-tight membrane. The oxygen-enriched water was collected from the anode compartment of the electrolytic cell [9].
For its reactivity, molecular oxygen is indispensable for aerobic forms of life. In several sources the benefits of using water enriched in oxygen were reported, in the case of human prophylaxis and therapy, [10,11] and animal breeding [12]. However, some precautions in this respect are also reported [13,14,15]. Simultaneously, molecular oxygen is either mortal for anaerobic forms of life or at least controls their development.
Due to its hydrophobicity, molecular oxygen is poorly water soluble [16]. The solubility of oxygen in water is, obviously, temperature-dependent and decreases with an increase in temperature [16]. At 25 °C and 101.3 kPa, freshwater contains about 6.04 mL/L of oxygen [17,18]. Mineral salts in water decrease solubility of oxygen and, for instance, at 25 °C and 101.3 kPa seawater contains about 4.95 mL/L molecular oxygen [19]. In its aqueous solutions oxygen resides in (H2O)20 clathrates [20]. Owing to the lowest energy, triplet oxygen is the basic form of this molecule. In isolated molecules its transition into singlet oxygen is forbidden but, for instance, it may turn into singlet oxygen under near-infrared irradiation in solution [21].
The treatment of water with LPGP declusterized the water macrostructure [1,2,3,4,22,23]. Therefore, one could assume that LPGP treatment of water saturated with molecular oxygen would increase its aqueous solubility. Declusterized fragments of the LPGP treated water better penetrated cell walls becoming a good vectors for transporting components of those aqueous solutions into the tissue cells. For that reason, such water would dispose with beneficial functional properties, interesting for plant and animal breeding, as well as for human prophylaxis and therapy [5,6,7,8,9,24].
2. Materials and Methods
2.1. Materials
2.1.1. Water
Commercially available deionized water contained, in total, 20.04 mg minerals/L (0.25 mg Ca2+/L, 0.12 mg Mg2+/L, 0.08 mg Na+/L, 18.30 mg HCO3=/L, 1.28 mg SO4=/L, 0.01 mg Cl−/L).
Tap water: municipal water from the Częstochowa supply system containing, in total, 672.28 mg minerals/L (193.27 mg Ca2+/L, 46.21 mg Mg2+/L, 23.18 mg Na+/L, 5.27 mg K+/L, 351.90 mg HCO3−/L, 51.20 mg SO4=/L, 6.52 mg Cl−/L, 40μg Fe/L).
2.1.2. Oxygen
Oxygen of 99.5% purity was manufactured by Air Products, Warsaw, Poland.
2.2. Methods
2.2.1. Treating Water with LPGP
2.2.1.1. Treating Plain Water
Deionized water (200 mL) in a glass flask was placed in the chamber of the reactor [25] and exposed to interaction with plasma for 5, 15, 30, 45, 60, and 90 min. Plasma of 38 °C was generated at 5 × 10⁻³ mbar, 600 V, 50 mA, and 10 kHz frequency. Through so treated water, a stream of pure (100%) O2 was bubbled for 15 min at the rate of 10 mL/min. The produced water was stored at ambient temperature in 100 mL closed Teflon containers.
2.2.1.2. Treating Water Saturated with Oxygen with LPGP
Deionized water (200 mL) in a glass flask was placed in the chamber of the reactor [25]. Through the deionized water a stream of pure (100%) O2 was bubbled in the same manner as described under Section 2.2.1.1, and exposed to interaction with plasma for 5, 15, 30, 45, 60, and 90 min. Plasma of 38 °C was generated at 5 × 10⁻³ mbar, 600 V, 50 mA, and 10 kHz frequency. The produced water was stored at ambient temperature in 100 mL closed Teflon containers.
2.2.2. Physicochemical Properties of LPGP Treated Water
2.2.2.1. pH
pH was measured using a laboratory multifunction meter, Cx-505 (Elmetron, Zabrze, Poland), equipped with a combined calomel-glass electrode. Resolution of the instrument was 0.01 pH. Measurements were performed at 25 °C. The estimations were run in triplicates.
2.2.2.2. Conductivity
Estimations were performed at 25 °C with an ELMETRON CPC-505 instrument (Zabrze, Poland) equipped in an ELMETRON EC-60 sensor. The measurements were triplicated.
2.2.2.3. Density
Density was estimated at 20 °C, employing an analytical balance RADWAG XA 52.4Y.A (Radom Poland) equipped with a system for determination of density of solids and liquids (KIT 85). The estimations were run in triplicates.
2.2.2.4. Dissolved Oxygen Content
The estimation at 20 °C was performed with a multifunctional Elmetron (Zabrze, Poland) instrument. The estimation with the ±0.1 mg/L was run in triplicates.
2.2.2.5. Active Oxygen
Saturated aq. solution of KI (2 mL) was added to a GP treated water sample (100 mL). After 30 min 1% aq. soluble starch gel (2 mL) was added to turn the colour of the solution into pink. The sample was then titrated with 0.01 M aq. Na2S2O3 solution until the color of the solution completely ceased. Milliequivalents of active oxygen (AO) [meqO2] were calculated from the Equation (1):
where V was a volume of consumed 0.01 M Na2S2O3 solution.
AO = V × 0.01 × 1000/100 = 0.1 × V [meq O2/kg]
2.2.2.6. Differential Scanning Calorimetry (DSC)
A differential scanning calorimeter DSC 204F1 Phoenix (Netzsch, Germany) was used. Multipoint calibration (Hg, In, Sn, Bi, Zn, CsCl) was involved, and 14 mg samples were analyzed in hermetically closed, then punctured, pans. They were heated from 40 to 140 °C at the rate of 10 °C/min. Points of transitions (Tonset, Tmid, Tend, and ΔH) were determined with Proteus Analysis (Netzsch, Germany) software. Peak abruption was calculated as (Tmax – Tonset)−1.
2.2.2.7. Fourier Transformation Infrared—Attenuated Total Reflectance (FTIR-ATR) spectra
The FTIR-ATR spectra of the film were recorded in the range of 4000–700 cm−1 at a resolution of 4 cm−1 using a Mattson 3000 FT-IR (Madison, WI, USA) spectrophotometer. That instrument was equipped with a 30SPEC 30° reflectance adapter, fitted with the MIRacle ATR accessory from PIKE Technologies Inc., Madison, WI, USA.
2.2.2.8. Determination of Ozone
Determination was performed based on interpretation of FTIR-ATR spectra (Section 2.2.2.7) of the samples. Following the paper by McCaa and Shaw [26], attention was paid to the region around 1050 and 2400 cm−1 of those spectra, where peaks of high and medium intensity, respectively, typical for ozone should be observed.
2.2.2.9. Electron Spin Resonance (ESR) Spectra
The spectra were recorded at room temperature, employing an instrument constructed at Wroclaw Technical University. The range of the X-band (ν = 9.5 GHz, λ = 3.158 cm) was employed at the 20–25 dB attenuation and 2048 s swiping time. An EPR controller software, designed for taking the ESR spectra, was applied, and recorded in the form of first derivative. Measurements were performed at room temperature involving 5 cm × 3 mm quartz capillaries. The precision of the measurement of the magnetic field was +1 Gauss, and 2,2-diphenyl-1-picrylhydrazyl radical (DPPH) was used as the standard for g-factor.
2.2.2.10. Ultraviolet/Visible (UV-VIS) Spectra
The spectra were recorded with a Thermo Scientific Evolution 220 (Waltham, MA, USA) spectrophotometer in the wavelength range of 190–1100 nm in a quartz gas tight cell of 10 mm path length
2.2.2.11. Raman Spectra
The spectra were taken with a Perkin-Elmer MPF44A Fluorescence Spectrophotometer (Waltham, MA, USA) equipped with a xenon lamp and 4 mL quartz cell. The sample was excited at 330 ± 1 nm and both slits were set on 2 nm.
3. Results and Discussion
In this study, deionized and tap water was treated with LPGP either after saturation with molecular oxygen (WST) or prior to such saturation (WTS). In the first case bulk water interacted with oxygen by pairwise and non-pairwise cooperative interactions. According to Keutsch et al. [27] the later interactions were responsible for 25% of the total energy of the system. In case of tap water the macrostructure of bulk water was modified by dissolved mineral compounds. Dissolved molecular oxygen reduced enthalpy and entropy of the solution. Building clathrates hosting molecules of oxygen involving weak hydrogen bonds to water was postulated. The formation of O=O···H-OH hydrogen bonds might be observed [22]. The LPGP treatment declusterized deionized and tap water prior to the saturation [1,2,3,4]. The triplet–singlet transition in the oxygen molecule was forbidden, but solely in isolated molecules [21,28]. In solutions, such transition might occur at λ = 1264 nm, i.e., in the near-infrared region. The triplet –singlet transition was postulated also on the LPGP treatment of water in contact with the air [1]. The slightly acidic reaction (pH25 = 6.214) of deionized water used in this study resulted from its mineral impurities. The saturation of that water with molecular oxygen only slightly increased pH (see Table 1). However, already the 5 min treatment with LPGP made that water slightly basic. The pH rose against the treatment time, reaching maximum after the 30 min treatment, and after that time it slowly declined. Thus, one might assume that after the 30 min treatment, the macrostructure contained the highest number of hydrogen bonds. The LPGP treatment of deionized WTS maintained pH of that water slightly below 7, regarding the treatment time. The highest pH was also observed after the 30 min treatment. These data pointed to the formation of niches and/or caverns hosting anions (HCO3−, SO4=), whereas less enveloped cations were accompanied by hydroxyl groups of water. Neutralization of anions, by protons released from water, might not be excluded. Longer LPGP treatment led to enveloping cations resulting in a slow decrease in pH. In the reversed procedure (WTS) all changes fitted limits of the experimental accuracy. This suggested the indispensable role of dissolved oxygen in the water structuring.

Table 1.
pH values a of water treated under oxygen with LPGP.
Original tap water was very slightly basic (pH25 = 7.050). Its saturation with molecular oxygen resulted in an increase in basicity. It rose fairly monotonously against the treatment time reaching the highest value after 120 min lasting treatment.
Saturation of LPGP treated water increased its basicity water reaching maximum already after 30 min (Table 1). The way of the LPGP treatment influenced also water conductivity (Table 2).
Table 2.
Conductivity (mS/cm) a of water treated under oxygen with low pressure glow plasma of low frequency (LPGP).
Deionized water showed originally a residual conductivity (~1% of tap water) which, on saturation with molecular oxygen, initially decreased in order to increase against the treatment time, reaching the highest value after the 60 min treatment. Extended treatment resulted in a considerable decrease in the conductivity. The treatment of deionized water prior to its saturation caused a certain increase in conductivity. It reached maximum after the 30 min treatment. Saturation of tap water with molecular oxygen already increased its conductivity, prior to the LPGP treatment (Table 2). Initially such treatment elevated the conductivity in order to decline it after 30 min. It was elevated again to maximum after 60 min and then declined again on the 120 min treatment. Conductivity of tap WTS appeared to be less sensitive to the saturation (Table 2). It slightly rose against the treatment time up to 30 and 60 min, in order to decline on its extended treatment. Thus, in deionized WST, as the LPGP treatment time was extended, initially existing ion hydrates expanded their size and pulled ions out of their envelopes. That process resulted in an increase in conductivity. Subsequently, new envelopes fitted in their size to the developed macrostructure were formed. They arrested ions, limiting their mobility in the electric field. Hence, the conductivity of investigated solutions repeatedly decreased. Tap WST behaved similarly. Concentration of dissolved mineral salts was ~100 times higher than in deionized water, therefore, observed changes were not so substantial. In the reversed, WTS, procedure, the effect of the treatment practically did not appear, supporting former the statement on the indispensable role of dissolved oxygen in structuring water involving niches and/or caverns, regarding the type of water.
The way of saturation of deionized as well as tap water with molecular oxygen was also reflected by changes of the density of produced samples (Table 3). Generally, these changes were subtle and non-linear against the treatment time in the series of WTS and WST. In both series, maximum density was achieved after the 30 min treatment, and only in the case of tap WST the relevant maximum was reached after the 60 min treatment. Data presented in Table 3 demonstrated that deionized WST formed a more compact structure than that in original, non-treated water, and even tap WST. That compactness could result from building two types of niches, i.e., larger, ball-like objects and smaller units, filling the space between larger niches. Prolonged treatment uniformed the size of niches, which resulted in worse packing and, hence, decreasing water density. In the case of WTS, the effect of the prolonged treatment upon the density was negligible, because oxygen, indispensable for building compact macrostructure, was absent.
Table 3.
Density (g/dm3) a of water treated under oxygen with LPGP.
Table 4 shows the solubility of molecular oxygen in particular water samples. Clearly it strongly depended on the selected water and the mode of the sample preparation.
Table 4.
Molecular oxygen content (mg/L) a of water treated under oxygen with LPGP.
It was interesting that the aqueous solubility of molecular oxygen in tap water exceeded that in deionized water. Moreover, that solubility in WST was higher than in WTS. The solubility of molecular oxygen always irregularly increased against the treatment time. In tap WST the amount of dissolved oxygen increased by 82% after treatment for 30 min, in respect to the amount noted for the saturated but not treated water. Saturation of LPGP treated water was less beneficial. Maximum solubility was found for WTS treated for 60 min. It increased hardly by 6.2% in respect to that in non-treated water, as well as in water treated for 5 min. This suggested that in the LPGP treatment, niches were incompletely filled with oxygen. Its concentration around niches decreased, that is, its solubility increased resulting in the formation of subsequent niches hosting oxygen. In WTS the treatment introduced only negligible changes. This supported again the indispensable role of oxygen in the formation of niches.
Tests for the content of active oxygen showed a residual amount solely in deionized and tap WST. In deionized and tap WTS active oxygen was practically absent (Table 5). Neither ozone nor hydrogen peroxide could be found in the samples, regardless of the manner of their preparation. Thus, the activity of oxygen in WST samples could originate from triplet oxygen. In deionized and tap WTS all oxygen molecules could reside chiefly in the excited singlet state. Only in deionized and tap WST, and WTS treated for 30 min, some residual triplet oxygen could be noted (see ESR spectra below). An alternative interpretation assumed a transformation of anions of acids, closed inside niches, into corresponding anions of peracids (HCO4−, HS2O9=) induced by active oxygen. The latter might be relatively stable, and oxidize iodides into iodine. Analytical procedure could not distinguish between potential oxidants, however, the pattern of the changes of active oxidant against the time suggested the saturating type of the curve. It could correspond to gradual consumption of the oxidant, chiefly HCO3-, present in deionized, as well as tap, water.
Table 5.
Active oxygen content (meqO2/kg) in deionized and tap water a.
A higher solubility of molecular oxygen in tap than in deionized water reflected the influence of the macrostructure in trapping oxygen molecules. Definitely, the macrostructure of deionized water was better organized. Hence, inclusion of the molecules of oxygen in any possible manner (see above) was less likely. Ions present in tap water produced a certain disorder of the macrostructure. It was more readily modified by LPGP, providing more efficient oxygen hosting.
Furthermore, ESR spectra might throw a light on the role of LPGP upon modifications of the water macrostructure. In our recent studies [1], a residual free radical signal could be observed in the spectrum of non-treated water containing dissolved air. This signal was assigned to triplet oxygen. That signal ceased already after the 5 min LPGP treatment, and did not develop anymore in the treatment for up to 120 min. The ceasing of the signal of the free radical was interpreted as a consequence of the triplet–singlet transition in the oxygen molecules. The molecules of the singlet oxygen were assumed to be stabilized by building aqueous clathrates enveloping these excited hosts. The formation of such clathrates was confirmed by Raman spectra.
In this study the presence of triplet oxygen in original deionized water, prior to saturation and LPGP treatment, was confirmed (Figure 1a). In that deionized water, saturation with molecular oxygen fully eliminated that residual signal. However, in the ESR spectrum of WTS a free radical signal developed in the sample treated for 15 min (Figure 1b). No signal appeared in the spectra of WTS treated for 5 and 30, to 120 min.
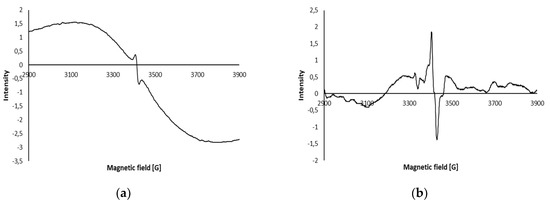
Figure 1.
Electronic spin resonance (ESR) spectrum of original deionized, non-treated water containing dissolved air (a) and WTS (b) after the 15 min treatment.
The presented spectra demonstrated that, apart from a large number of structures of diverse size, natural water contained some number of niches hosting magnetic triplet oxygen. In the spectrum of WTS that tide packing was represented by a sharp, narrow resonance signal. An intensive, wide signal overlapping with the narrow signal was assigned to the result of stochastic distribution of the remaining niches of diverse size. The spectrum of WTS (Figure 1b) shows that stochastically dispersed oxygen readily, either acted as the oxidant, or transformed into singlet molecules incorporated into suitably fitted niches.
In the case of deionized WST, ESR signals appeared after the 15 and 30 min treatments (Figure 2).
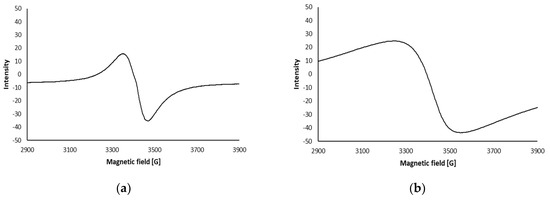
Figure 2.
ESR spectra of deionized WST after the 15 (a) and 30 (b) min treatment.
The deionized WST water contained niches of larger size, hosting molecules of oxygen interacting with environment in various manners. That differentiation was reflected by broad resonance signals. Extended treatment time favoured an increase in the size of niches and further broadening of the signal.
In the case of tap WST free radical signals appeared in samples treated for 30 and 60 min (Figure 3).
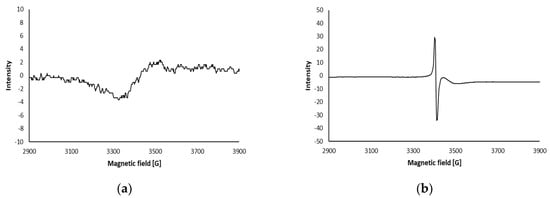
Figure 3.
ESR spectra of tap WST after 30 (a) and 60 (b) min treatment.
Tap water contained less paramagnetic oxygen than deionized water as shown by a residual signal in the spectrum presented in Figure 3a. Prolonged LPGP treatment favoured inclusion of that oxygen in smaller niches, which was reflected just by a narrow resonance signal.
Analysis of ultraviolet-visible (UV-VIS) absorption spectra of LPGP treated water (Figure 4) provided further information on the influence of the treatment upon the water macrostructure.
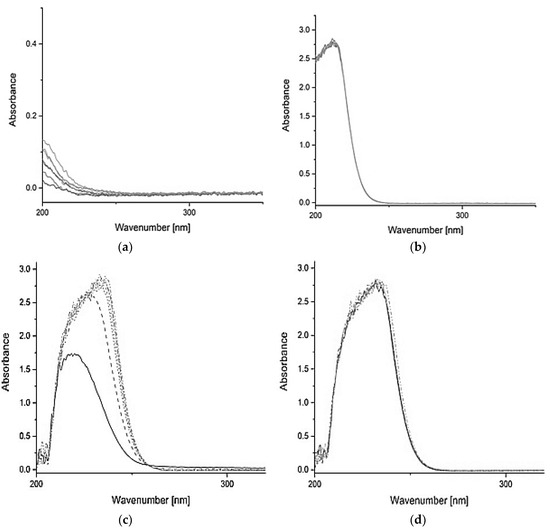
Figure 4.
UV-VIS spectra of deionized WST (a), deionized WTS (c), tap WST (b), and tap WTS (d). In spectrum (c) and (d) 0D and 0K stand for non-treated and not saturated deionized and tap water, respectively.
In the spectrum of deionized WST only a shoulder located at 195 nm could be seen, and it was in accord with the literature data [29]. The intensity of that shoulder nonlinearly depended on the LPGP treatment time. It rose in the sequence of 0 < 5 < 30 = 15 < 90 = 120 < 60 min treatment, demonstrating a specificity of the macrostructure of water treated for 60 min. The spectra of WTS showed that the LPGP had no influence upon the system confirming again that the dissolved oxygen was indispensable for building water macrostructure. In the WTS procedure the solution was enriched in molecular oxygen, providing development of the oxygen band in the relevant spectra. Such a band, observed in the spectrum of deionized water, could be interpreted as that related to the 3Σg− ―› 3Πu− [30].
The spectrum of non-treated tap water contained a strong absorption, near 200 nm, evoked by anions from the dissociation of mineral compounds dissolved in that water. Original non-saturated and non-treated tap water was used as a standard. As the LPGP treatment progressed, the band associated with the oxygen absorption intensified as it also took place in the spectra of deionized water. However, some bathochromic shift of that band was observed. It suggested an involvement of oxygen complexes with calcium and magnesium salts. In the spectra of WTS no results of the treatment could be noted. Thus, that treatment did not influence the water structure in any considerable manner. The FTIR-ATR spectra of deionized and tap WTS and WST are presented in Figure 5.
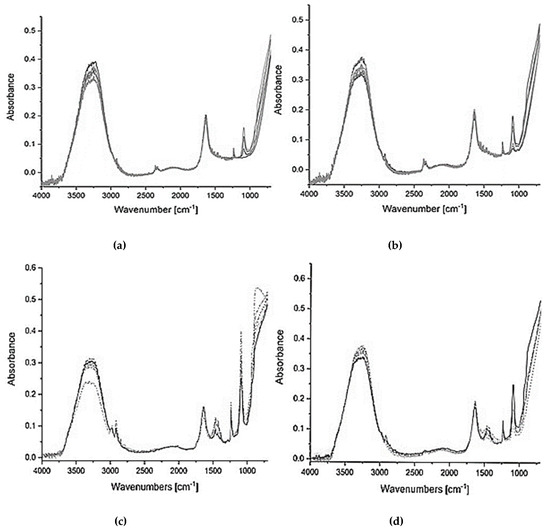
Figure 5.
FTIR-AT spectra of deionized WST (a), deionized WTS (c), tap WST (b), and tap WTS (d).
The spectra in the presented wavenumber region consisted of the bands at around 3250, 1600, 1200, and 1000 cm−1. The band at ~3250 cm−1 was, in fact, an overlapped band belonging to asymmetric and symmetric stretching vibrations of the O-H groups of water (νOH). The broad weak band around 2000 cm−1 was assigned to a combination band.
The band at ~1600 cm−1 reflects the O-H scissor modes and bands at ~1200 and ~1000 cm−1 might reflect libration modes, and at lower values the absorption along the whole hydrogen bond oscillations [30]. The band at ~1200 cm−1 could alternatively be assigned to the oxygen band O2 A3ν+n [30]. However, that band as well as the band at ~1000 cm−1 could also be observed as very weak bands in the FTIR-ATR spectra of deionized water LPGP treated for 90 min in air [1], under nitrogen treated for 60 and 90 min [2], and as well-developed bands in the spectra of water treated under methane [3] and carbon dioxide [4]. Moreover, it should be kept in mind that the content of oxygen dissolved under atmospheric pressure was well below the sensitivity of the spectrophotometer. Therefore, both these bands should be linked to building macrostructure water–water interactions, for example, as presented in Figure 6.
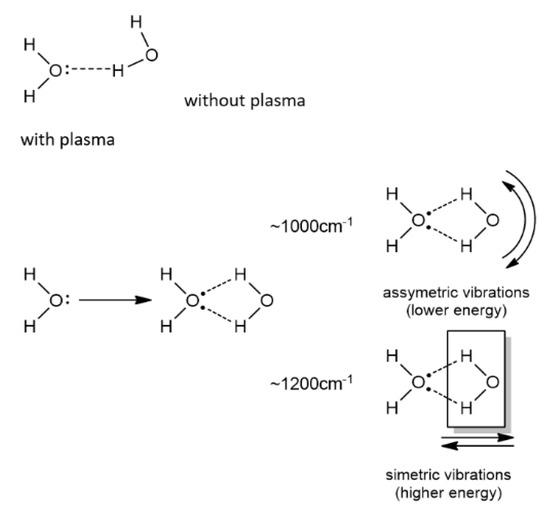
Figure 6.
Proposed building macrostructure water–water interactions responsible for developing ~1200 and ~1000 cm−1 FTIR-ATR bands.
Following that approach, interaction of LPGP with a lone electron pair of the water oxygen atom turned it from the singlet into the triplet state. The latter was immediately hydrated by the second, non-excited water molecule, building the 1,3-dioxa-2,4-dihydroethane ring. That ring, contained two hydrogen bonds. Vibrations of that ring could be either symmetric, requiring higher energy, or asymmetric, requiring relatively lower energy. Such geminal hydrogen bonds were, as yet, not taken under consideration. However, the spectral pattern well fitted the proposed structure, including two bent hydrogen bonds with lower force constants. Doubled values placed these bonds in the observed spectral region.
Weak bands at ~2950, 2400, and 1400 cm−1 should be assigned to artefacts resulting from imprecise subtraction of the background formed by residual signals from steam and atmospheric CO2.
The intensity of particular bands fairly chimerically changed with the LPGP treatment time (Table 6). In deionized WST the stretching and scissor bands always decreased with the treatment time, whereas the 1200 and 1000 cm-1 bands initially decreased in order to reach a maximum intensity in water treated for 60 min. In the spectra of tap WST, with some exceptions, all bands reached maximum intensity in the spectra of samples treated for 60 min. The intensity of relevant bands for deionized and tap WTS was, generally, lower and less sensitive to the treatment time.
Table 6.
Band intensity [a.u] in Fourier transformation infrared-attenuated total reflectance (FTIR-ATR) spectra of control (C), deionized (D) and tap (T) WST and WTS a,b.
The Gaussian distribution of the νOH band (Figure 7) in the spectra of investigated samples of water are presented in Table 7.
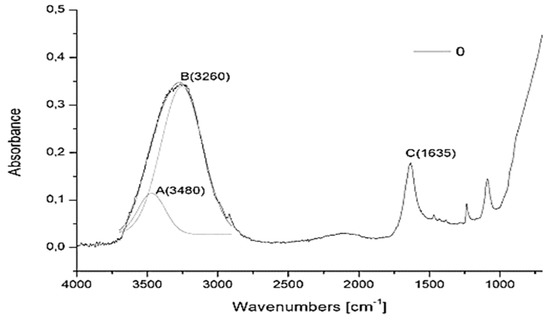
Figure 7.
Mode of Gaussian distribution of the FTIR-ATR spectra of water saturated with molecular oxygen.
Table 7.
Results of the Gaussian distribution of FTIR-ATR spectra of deionized (D) and tap (T) WST and WTS.
The Gaussian distribution of the 3260 cm−1 band isolated the 3480 cm−1 band. The latter band reflected asymmetric stretching vibrations of the hydroxyl groups of (i) free water and (ii) water surrounded with (i) two oxygen atoms of neighboring water molecules, and (ii) one hydrogen atom surrounded by one hydrogen atom of neighbouring water molecule and, simultaneously, by one hydrogen atom of the second neighbouring water molecule. They were trigonal, single donor, SD, systems. The 3260 cm−1 band corresponded to symmetric stretching vibrations in the water molecules, involved in the formation of tetrahedral, TH, structures, employing independently both lone electron pairs of its oxygen atoms.
Results were interpreted in terms of the A/(A + B) ratio. That approach made results independent, to a considerable extent, of the thickness of the sample and measurement cells.
In deionized WST, the initial deal of trigonal structures (19.42%) declined to 14.35%, that is by 26%, as the treatment progressed to 30 min. Further treatment maintained these values on a low level, pointing to the formation of tetragonal structures required for building clathrates. A similar effect took place in case of deionized WTS. The initial deal of trigonal structures declined after the 90 min LPGP treatment, from 38.61% to 19.45%, that is almost by half. It suggested the formation of tetragonal structures that are also a possibility for building clathrates. These results also showed that for these changes oxygen molecules were dispensable and even non-beneficial.
In tap WST, initial low concentration of trigonal structure (15.22%) slowly increased by 7% to 16.38% after the 60 min LPGP treatment. Prolonged treatment declined that concentration to 13.69% after 120 min. This spoke in favor of a two-step process. Initially, up to 60 min the deal of trigonal structures increased in order to favor the building of tetragonal structures on prolonged treatment. A similar course of transformations was observed in the case of tap WTS. Initially, that water contained 16% trigonal structures. Their number after the 15 min treatment increased to 31.11%, in order to decline by 30% to 21.59% on prolonged treatment. Since oxygen molecules did not participate in these transformations, the observed structural changes were favored by the absence of oxygen. The same effect was observed in the case of deionized WTS. Analogues conclusions could be drawn on analysing data grouped in the A/C and B/C columns of Table 7.
The intensity of the ~1600 cm−1 band nonlinearly changed against the treatment time. In the spectra of deionized, as well as tap, WST it was fairly stable, reaching about 0.2 a.u. In the case of deionized WTS, the intensity of that band, independently of the treatment time, reached approximately 0.16 a.u., except for a decrease of the intensity to about 0.13 a.u. in the spectrum of water treated for 60 min. In the spectra of tap WTS, the intensity of that band increased to about 0.185 a.u., slightly and nonlinearly varying against the treatment time.
Differential scanning calorimetry (DSC) (Figure 8 and Figure 9 for deionized and tap water, respectively) informed about the role of the macrostructure of particular water samples upon their boiling points (Table 8) and thermodynamic parameters (Table 9).
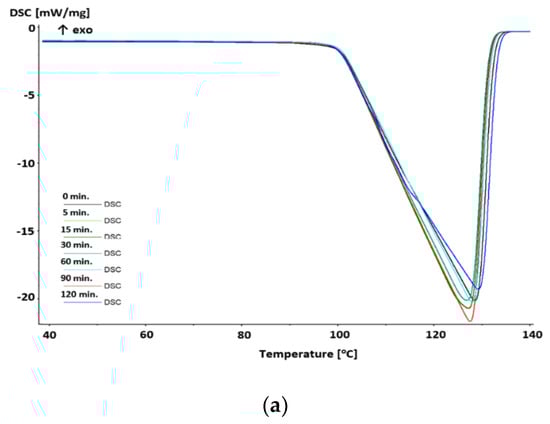
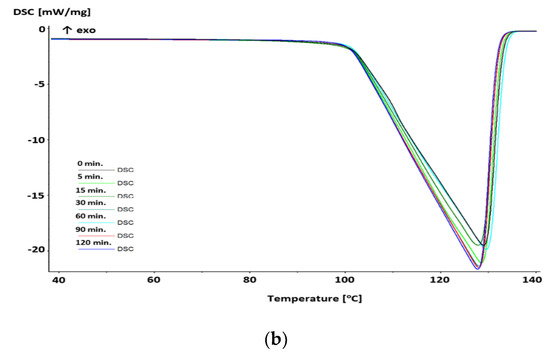
Figure 8.
Differential scanning calorimetry (DSC) diagrams for deionized water treated with LPGP for 0–120 min. (a) Diagrams for water saturated with molecular oxygen the treated with LPGP (WST); (b) diagrams for water treated with LPGP then saturated with molecular oxygen (WTS).
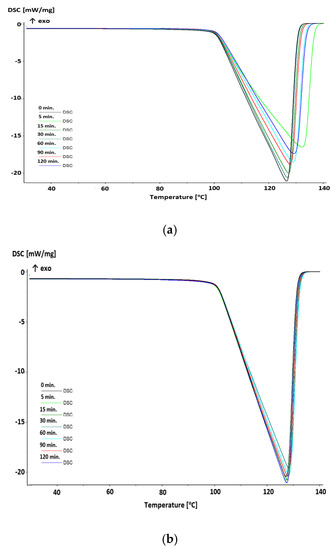
Figure 9.
Differential scanning calorimetry (DSC) diagrams for tap water treated with LPGP for 0–120 min. (a) Diagrams for water saturated with molecular oxygen the treated with LPGP (WST); (b) diagrams for water treated with LPGP then saturated with molecular oxygen (WTS).
Table 8.
DSC characteristics of deionized and tap water treated with LPGP a.
Table 9.
Thermodynamic data of deionized (D) and tap (T) water treated with LPGP a related to water mass and water molecular mass.
Regardless of the time of treatment, all onset and peak temperatures taken for deionized WST differed from one another by no more than 0.5 and 1.3°C (0.5 and 1.04%), respectively. Additionally, the taken peak abruption and maximum of heat flow values appeared fairly insensitive to the treatment time. The differences reached 0.0015 1/°C and 1.7 W/g (3.35 and 8.8%), respectively. For tap WST, these differences in corresponding parameter were 0.6 and 3.6oC for onset and peak temperature, respectively, and 0.046 1/°C and 3.6 W/g for peak abruption and maximum of heat flow, respectively. It meant that tap water macrostructure responded slightly better to the intervention of LPGP. It could be noted particularly for water treated for 5, 90, and 120 min. In the case of deionized WTS, dependent on the treatment time, differences in onset and peak temperatures reached 0.6 and 1.1°C, respectively. The sample treated for 15 min brought the most essential contribution to those values. That sample also most considerably contributed to differences in peak abruption and maximum of heat flow (0.0012 1/°C and 1.4 W/g, respectively). Corresponding differences in the relevant values for samples of tap WTS were almost negligible. They were 0.4 and 0.7 °C for onset and peak temperatures, and 0.0006 1/°C and 0.7 W/g, for peak abruption and maximum of heat flow, respectively.
The LPGP treatment had more considerable influence upon the thermodynamic values of resulting samples (Table 9). Values of specific heat, Cp, of all samples of WST were 40–50% higher than those for relevant samples of WTS. For the samples from both series the highest Cp values were found for those treated for 30 min. In the case of both relevant series of tap water Cp values were lower than those for the series of deionized water. The highest Cp value in the series of WST samples was found for water treated for 30 min, but in the series of WTS samples Cp value for the sample treated for 15 min was the highest.
Enthalpy, H values for the relevant samples of deionized WTS were always more negative than these for the WST series. In both series the most negative values were found for non-treated samples. In both relevant series of tap water, H values for the WST samples were slightly more negative than the values for the WTS samples. The most negative H values were noted for the samples treated for 15 and 120 min.
Entropy, ΔS, values for the samples of deionized WST were slightly lower than those for relevant samples from the WTS series. In both series, the highest ΔS values were found for samples treated for 120 min. In both series of tap water that dependence was opposite. Entropy values of the WST samples were slightly higher than those for relevant samples from the WTS series. The highest ΔS values were found for the samples treated for 0 and 120 min, respectively.
An increase in evaporation entropy delivered evidence for a higher ordering in the liquid state, that is, for a higher number of organized nanostructures. An increase in evaporation enthalpy should be understood in the same manner.
Raman spectra of deionized and tap WST excited at 330 ± 1 nm, taken depending on the treatment time (Figure 10), were presented by bell−shaped curves with their maxima around 371 nm (3349 cm−1 Raman shift), suggesting a dominant role for single donor arrangements in building macrostructure [31]. The bell-shaped curves formed two sets of the spectra, which differed from one another in the band intensities. The intensities of the set of spectra for tap water were at least 1.5 times higher than these for the set of the spectra of deionized water. Intensities of particular samples of deionized, as well as tap water, were non−linear against the treatment time. In the set of curves for tap water, their intensity decreased in the order: 60 > 120 > 0 > 90 > 30 > 5 > 15, whereas in the set of deionized water they declined in the order: 120 > 60 > 90 > 15 > 30 > 5 > 0.
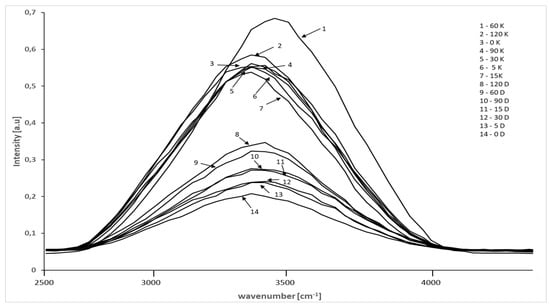
Figure 10.
Raman spectra of deionized and tap WST.
Raman spectra of deionized and tap WTS, taken depending on the treatment time (Figure 11), showed more complex patterns. Their maxima located between 372 and 377 nm (Raman shift 3421 and 3778 cm−1 respectively) were preceded by a long shoulder, representing tetrahedral and deformed tetrahedral arrangement. That shoulder for the sample treated for 120 min even developed a clear maximum of lower intensity at 367 nm (3055 cm−1) from deformed tetrahedral structures [31]. The spectral pattern provided evidence for a priority for single donor, single hydrogen bonded water and free water in building the macrostructure.
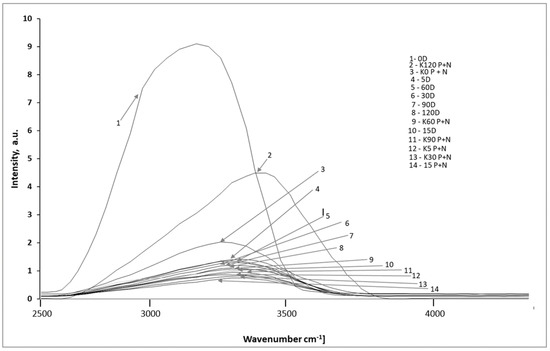
Figure 11.
Raman spectra of deionized and tap WTS.
In our former papers on the LPGP treatment of water in contact with the air [1], saturated with oxygen−free nitrogen [2] and ammonia [32,33], based on the pattern of Raman spectra, formation of aqueous clathrates hosting either oxygen, nitrogen, or ammonia, respectively, was postulated. In those spectra, under 385 nm excitation, an intensive shoulder at around 440 nm (3247 cm−1 Raman shift) was formed on the beginning of the treatment. As the treatment time was extended that shoulder turned into an intensive, broad peak centred around 440 nm. In our studies on water treated under methane [3] and carbon dioxide [4] no such bands were observed in the relevant Raman spectra, because the excitation wavelength was changed from 385 to 330 nm. This means, that in our former studies, formation of clathrates hosting molecules of gaseous environment could not be excluded.
The estimations of the molecular oxygen content in all designed water samples showed that the tap WST, after the 30 min treatment, contained exceptionally high oxygen content (Table 4). The exceptional character of that sample might be also seen in terms of the highest content of active oxygen (Table 5) and ESR spectrum demonstrating free radical signal (Figure 3a). Moreover, that sample showed the lowest intensity of the 3250 and 1600 cm−1 band in the FTIR−ATR spectra (Table 6), as well as the lowest value of the B/C ratio after the Gaussian distribution (Table 7), and the highest Cp value (Table 9).
4. Conclusions
Treatment of water in the presence of molecular oxygen with low−temperature, low−pressure glow plasma of low frequency, offers a simple and environmentally benign way to produce water with an enhanced content of molecular oxygen. The saturation of water with oxygen prior to its treatment with glow plasma is more beneficial than the saturation of already plasma-treated water. It points to an indispensable role of oxygen in building water macrostructure capable hosting oxygen in niches and/or caverns. Tap water dissolved oxygen to a better extent than deionized water. The time of treatment of water is also essential for the final result. Tap water saturated with oxygen, then treated with plasma for 30 min, provided a product containing 23 mg/L dissolved oxygen, whereas water prior to saturation and treatment dissolved only 15 mg/L of oxygen.
Author Contributions
J.C. run Raman spectra, W.C. run ESR spectra, K.K. run UV-VIS and Infrared Spectra, H.K. study Raman spectra, D.K. run pH, conductivity measurements, Z.O. equipped a research team in nanowater, P.T. invented the project, coordinated study and designed the text of this report, J.A.S. run substantial remarks and discussion of the subject, M.W. thermogravimetry measurements. All authors jointly participated in interpretation of all data and in writing report. All authors have read and agreed to the published version of the manuscript.
Funding
This research did not receive any specific grant from funding agencies in the public, commercial, or not-for-profit sectors
Conflicts of Interest
No conflict of interest is known to the authors.
References
- Białopiotrowicz, T.; Ciesielski, W.; Domański, J.; Doskocz, M.; Fiedorowicz, M.; Grąż, K.; Khachatryan, K.; Kołoczek, H.; Kozak, A.; Oszczęda, Z.; et al. Structure and physicochemical properties of water treated with low-temperature low-frequency plasma. Curr. Phys. Chem. 2016, 6, 312–320. [Google Scholar] [CrossRef]
- Chwastowski, J.; Ciesielska, K.; Ciesielski, W.; Khachatryan, K.; Kołoczek, H.; Kulawik, D.; Oszczeda, Z.; Tomasik, P.; Witczak, M. Structure and physicochemical properties of water treated under nitrogen with low-temperature glow plasma of low frequency. Water 2020, 12, 1314. [Google Scholar] [CrossRef]
- Ciesielska, A.; Ciesielski, W.; Khachatryan, K.; Kołoczek, H.; Kulawik, D.; Oszczęda, Z.; Soroka, J.A.; Tomasik, P. Structure and physicochemical properties of water treated under methane with low-temperature glow plasma of low frequency. Water 2020, 12, 1638. [Google Scholar] [CrossRef]
- Ciesielski, W.; Ciesielska, A.; Khachatryan, K.; Kołoczek, H.; Kulawik, D.; Oszczęda, Z.; Soroka, J.A.; Tomasik, P. Structure and physicochemical properties of water treated under carbon dioxide with low-temperature low-pressure glow plasma of low frequency. Water 2020, 12, 1920. [Google Scholar] [CrossRef]
- Zelenak, Z.M.; Berzsenyi, L.; Abramoff, F. Oxygen Enriched Liquids, Method and Apparatus for Making, and Applications Thereof. U.S. Patent 581422A, 29 September 1998. [Google Scholar]
- Messer Americas, FARMOX ™ Drop-in Oxygenation Apparatus. New, Easy-to-Deploy, Highly Efficient Solution for Oxygenation of Water. Available online: https://cdn2.hubspot.net/hubfs/189660/Messer%20US%20Website_2019/Resources/MESS-3024_FARMOX_Dropln_datasheet.pdf (accessed on 25 June 2020).
- Donsbach, K.W.; Cazares, R. Process for Making Highly Oxygenated Drinking Water and Drinking Water Made by the Process. U.S. Patent 5587191A, 24 December 1996. [Google Scholar]
- DeWald, J.J. Method and Apparatus for Adding Oxygen to Drinking Water. U.S. Patent 69361179B2, 30 August 2005. [Google Scholar]
- Compagnie Gervais Danone. Method for Enriching Water with Oxygen by an Electrolytic Process, Oxygen enrIched Water or Beverage and Uses Thereof. U.S. Patent 8,709,231, 19 December 2008.
- Pakdaman, A. Oxygen Enriched Water and Oral Oxygen Therapy (OOT). Available online: https://static.webshopapp.com/shops/035143/files/056059208/pakdaman-studies-oxygen-enriched-water.pdf (accessed on 22 June 2020).
- Pușcaș, C.; Moldovan, M.; Silaghi-Dumitrescu, L.; Ungureanu, L.; Silaghi-Dumitrescu, R. On the apparent redox reactivity of “oxygen-enriched water”. Biol. Trace Elem. Res. 2020, 1–9. [Google Scholar]
- Charton, A.; Péronnet, F.; Doutreleau, S.; Lonsdorfer, E.; Klein, A.; Jimenez, L.; Geny, B.; Diemunsch, P.; Richard, R. Effect of administration of water enriched in O2 by injection or electrolysis on transcutaneous oxygen pressure in anesthetized pigs. Drug Des. Devel. Ther. 2014, 8, 1161–1167. [Google Scholar] [CrossRef] [PubMed][Green Version]
- Schoenberg, M.H.; Hierl, T.C.; Zhao, J.; Wohlgemuth, N.; Nilsson, U.A. The generation of oxygen radicals after drinking of oxygenated water. Eur. J. Med. Res. 2002, 7, 109–116. [Google Scholar]
- Gruber, R.; Axmann, S.; Schoenberg, M.H. The influence of oxygenated water on the immune status, liver enzymes, and the generation of oxygen radicals; a prospective, randomised, blinded clinical study. Clin. Nutr. 2005, 24, 407–414. [Google Scholar] [CrossRef] [PubMed]
- Preiato, D. What is Oxygenated Water? Benefits, Uses and Precautions, Healthline. 5 March 2020. Available online: https://www.healthline.com/nutrition/oxygenated-water (accessed on 26 June 2020).
- Tromans, D. Temperature and pressure dependent solubility of oxygen in water: A thermodynamic analysis. Hydrometallurgy 1998, 48, 327–342. [Google Scholar] [CrossRef]
- Emsley, J. Oxygen. In Nature's Building Blocks: An A-Z Guide to the Elements; Oxford University Press: Oxford, UK, 2001; pp. 297–304. [Google Scholar]
- Air solubility in water. The Engineering Toolbox. Retrieved June 20. 2020. Available online: https://www.engineeringtoolbox.com (accessed on 26 June 2020).
- Evans, D.H.; Claiborne, J.B. The Physiology of Fishes, 3rd ed.; CRC Press: Boca Raton, FL, USA, 2005; p. 88. [Google Scholar]
- Li, Y.; Buckin, V. State of oxygen molecules in aqueous supersaturated solutions. J. Phys. Chem. B 2019, 123, 4025–4043. [Google Scholar] [CrossRef] [PubMed]
- Gudkov, S.V.; Bruskov, V.I.; Astashev, M.E.; Chernikov, A.V.; Yaguzhinsky, L.S.; Zakharov, S.D. Oxygen—Dependent auto-oscillations of water luminescence triggered by the 1264 nm radiation. J. Phys. Chem. B 2011, 115, 7693–7698. [Google Scholar] [CrossRef] [PubMed]
- Ivanov, E.V.; Abrosimov, V.K. Specific features of hydration of gaseous nitrogen and oxygen, revealed from data on their solubility in water H/D isotopomers. Russian J. Gen. Chem. 2005, 75, 1851–1856. [Google Scholar] [CrossRef]
- Vaz da Cruz, V.; Gelmukhanov, F.; Eckert, S.; Iannuzzi, M.; Ertan, E.; Pietzsch, A.; Couto, R.C.; Niskanen, J.; Fondell, M.; Dantz, M.; et al. Probing hydrogen bond strength in liquid water by resonant inelastic X-ray scattering. Nat. Commun. 2019, 10, 1013. [Google Scholar]
- Nieva, J.; Wentworth, P., Jr. The antibody-catalyzed water oxidation pathway—A new chemical arm to immune defense. Trends Biochem. Sci. 2004, 29, 274–278. [Google Scholar] [CrossRef] [PubMed]
- Oszczęda, Z.; Elkin, I.; Stręk, W. Equipment for treatment of water with plasma. Polish Patent Application P-389626, 20 November 2009. [Google Scholar]
- McCaa, D.J.; Shaw, J.H. The infrared spectrum of ozone. J. Mol. Struct. 1968, 25, 374–397. [Google Scholar] [CrossRef]
- Keutsch, F.N.; Cruzan, J.D.; Saykally, R.J. The water trimer. Chem. Revs. 2003, 103, 2533–2578. [Google Scholar] [CrossRef] [PubMed]
- Gudkov, S.V.; Astashev, M.E.; Bruskov, V.I.; Kozlov, V.A.; Zakharov, S.D.; Bunkin, N.F. Self-oscillating water chemiluminescence modes and reactive oxygen species generation induced by laser irradiation; effect of the exclusion zone created by Nafion. Entropy 2014, 16, 6166–6185. [Google Scholar] [CrossRef]
- Chaplin, M. Water Structure and Science. 2016. Available online: www1.lsbu.ac.uk/water/water_vibrational_spectrum.html (accessed on 20 June 2020).
- Krupienie, P.H. The spectrum of molecular oxygen. J. Phys. Chem. Ref. Data 1972, 1, 423–534. [Google Scholar] [CrossRef]
- Hu, Q.; Zhao, H.; Ouyang, S. Understanding water structure from Raman spectra of isotopic substitution H2O/D2O up to 573 K. Phys. Chem. Chem. Phys. 2017, 19, 21540–21547. [Google Scholar] [CrossRef] [PubMed]
- Oszczeda, Z.; Tomasik, P.; Ciesielski, W.; Kulawik, D. A Way of removal of permanent and temporary water hardness applying low-temperature, low-pressure glow plasma of low-frequency. Polish Patent Application P-426720, 20 August 2018. [Google Scholar]
- Ciesielska, K.; Ciesielski, W.; Khachatryan, K.; Kulawik, D.; Oszczęda, Z.; Tomasik, P. Structure and physicochemical properties of water treated under ammonia with low-temperature, low-pressure glow plasma of low frequency. Open Chem. 2020. accepted. [Google Scholar]


© 2020 by the authors. Licensee MDPI, Basel, Switzerland. This article is an open access article distributed under the terms and conditions of the Creative Commons Attribution (CC BY) license (http://creativecommons.org/licenses/by/4.0/).