Lesson Learned from Catastrophic Floods in Western Japan in 2018: Sustainable Perspective Analysis


Abstract
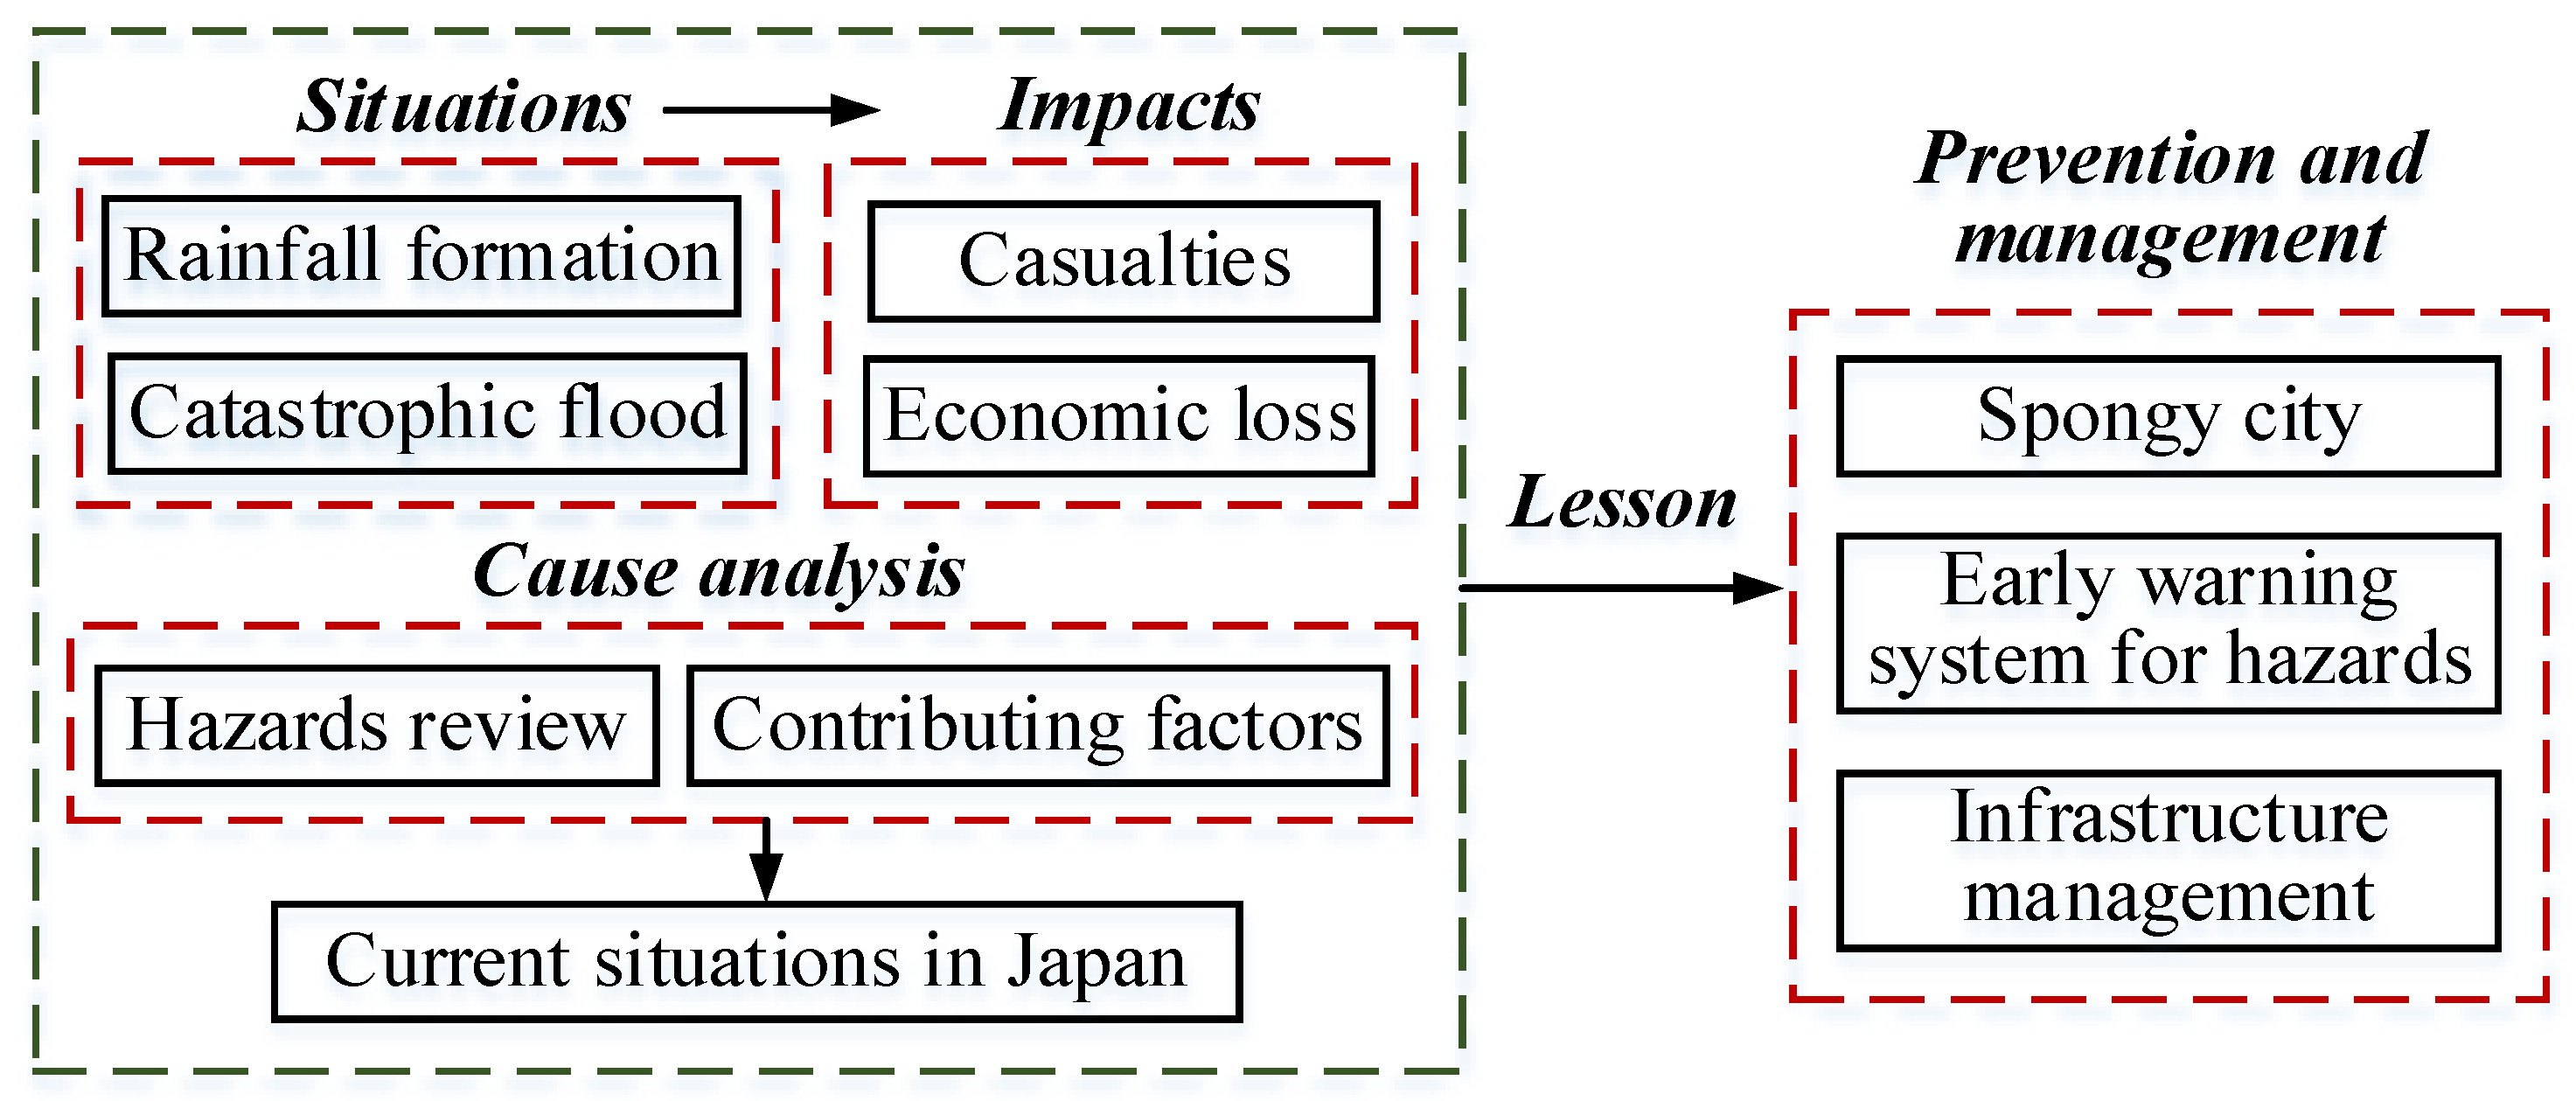
:1. Introduction
2. Investigations
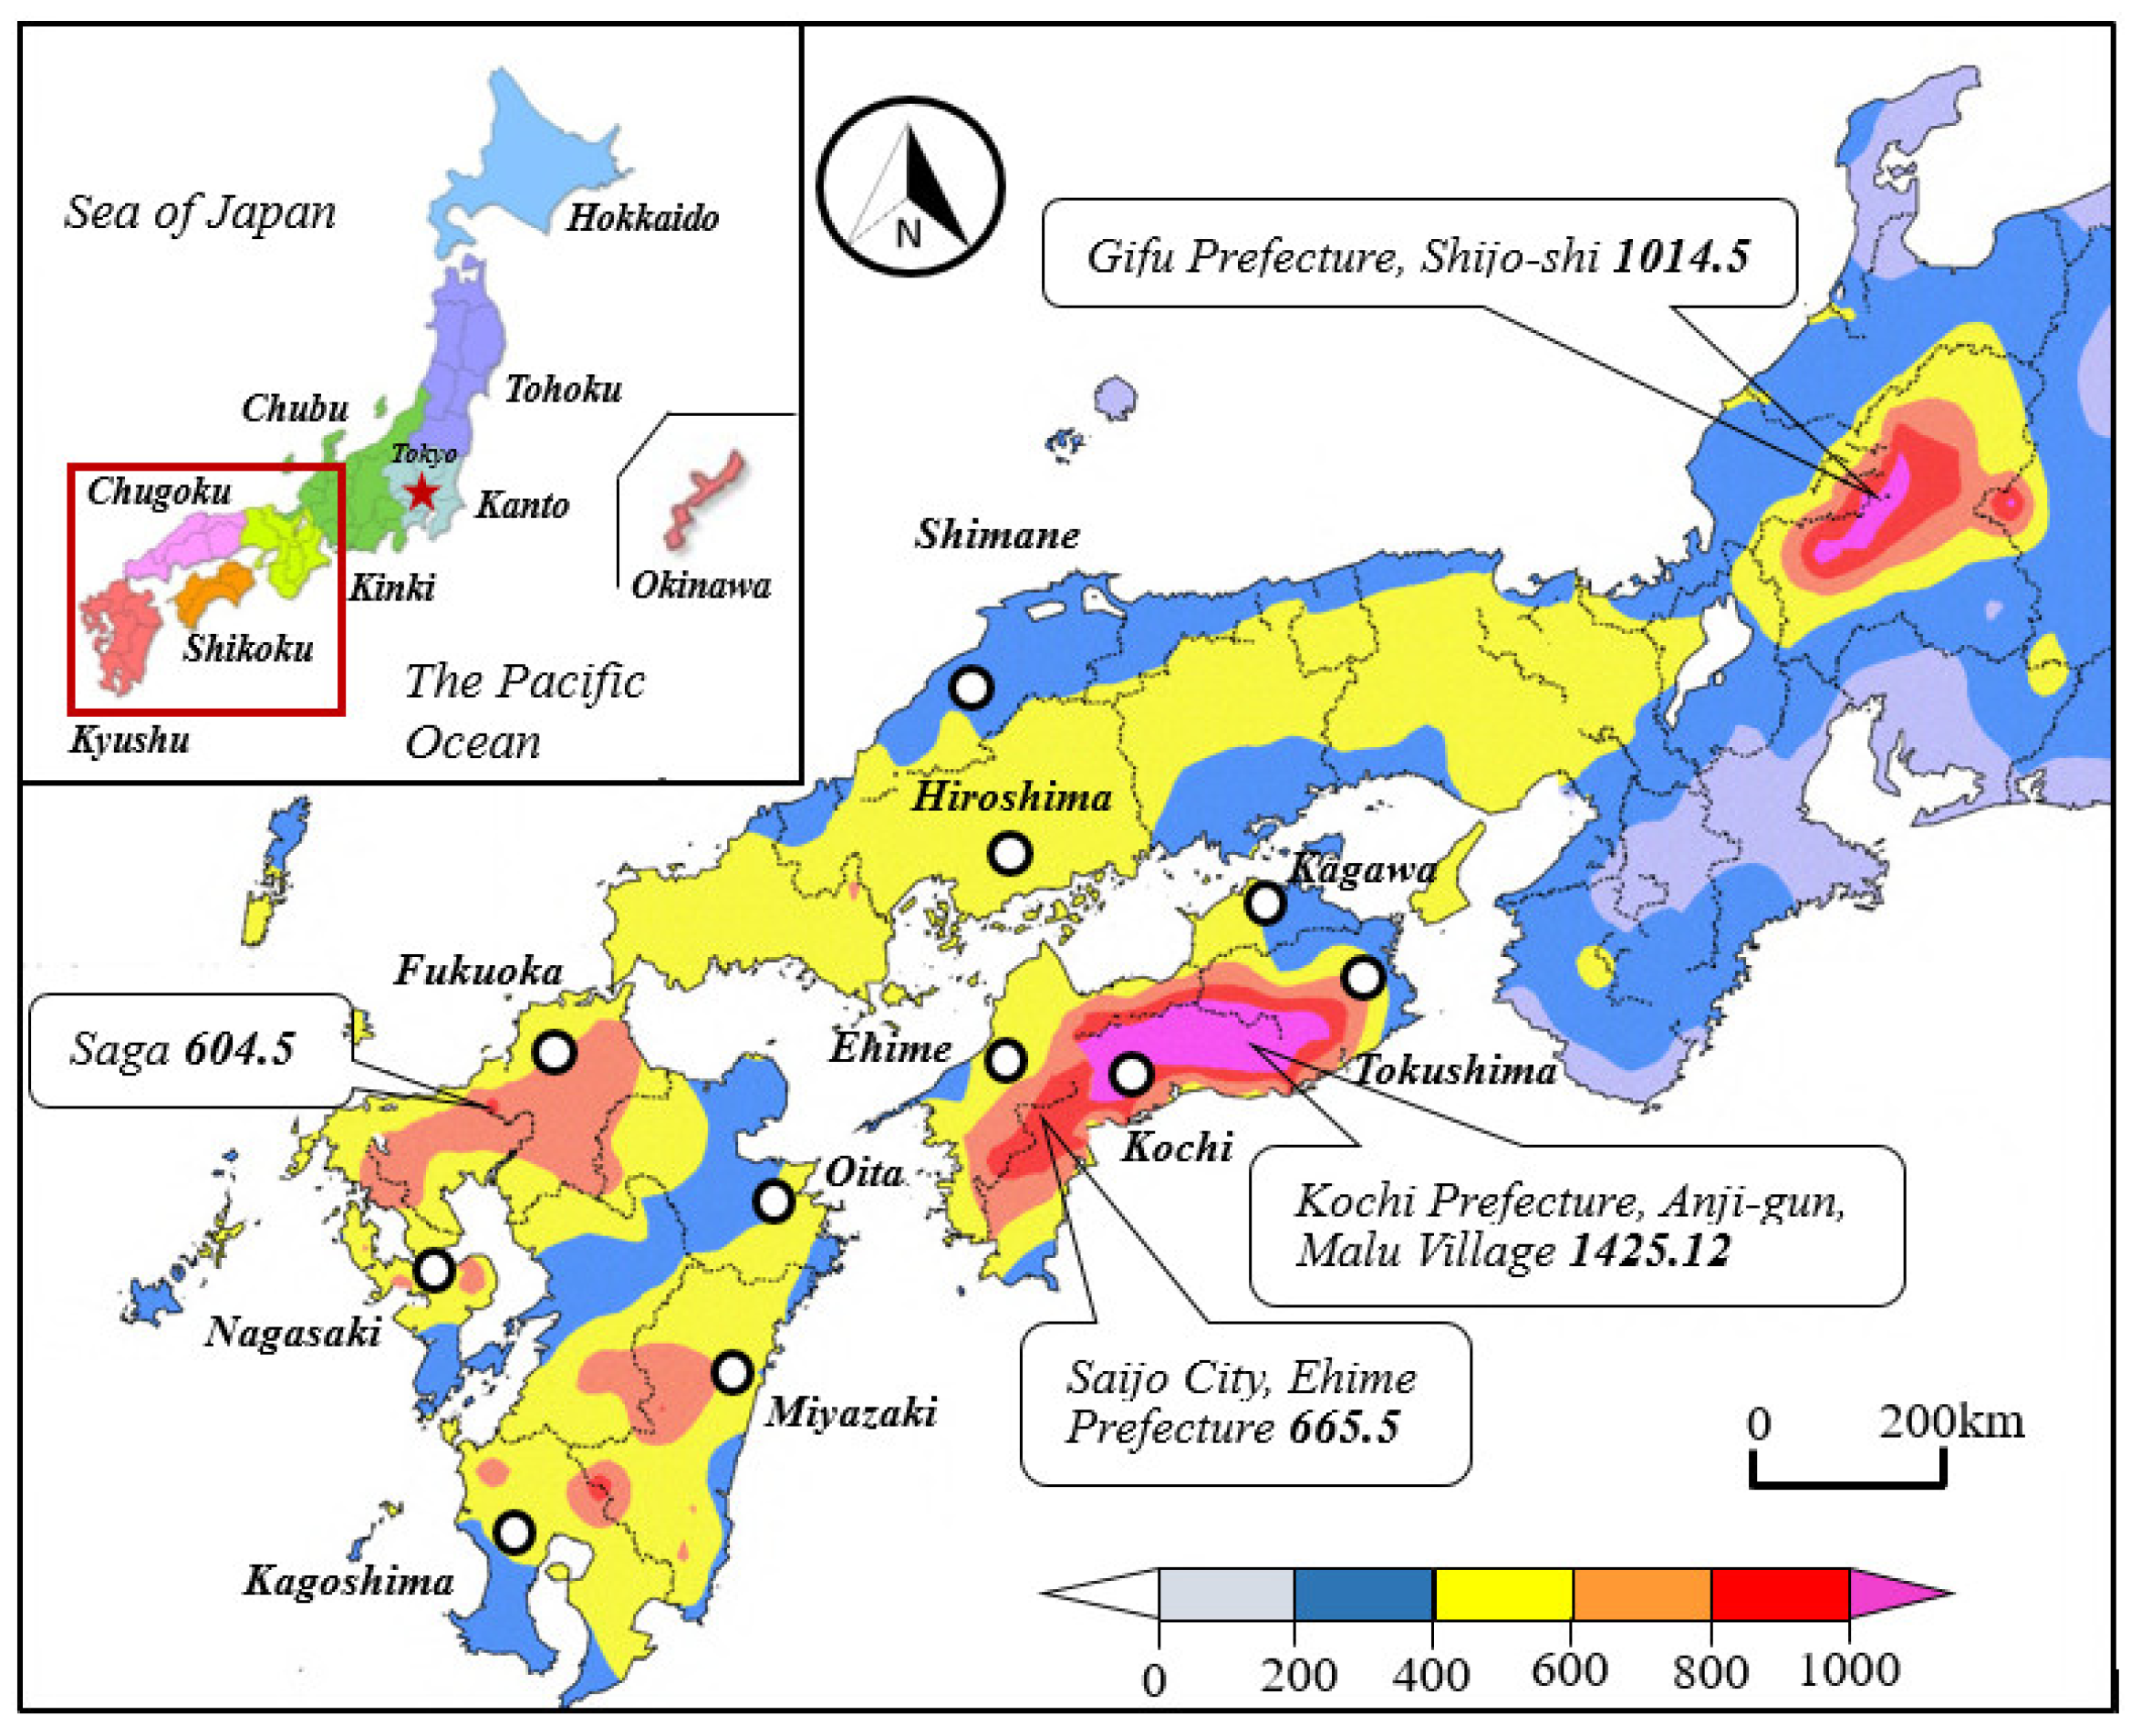
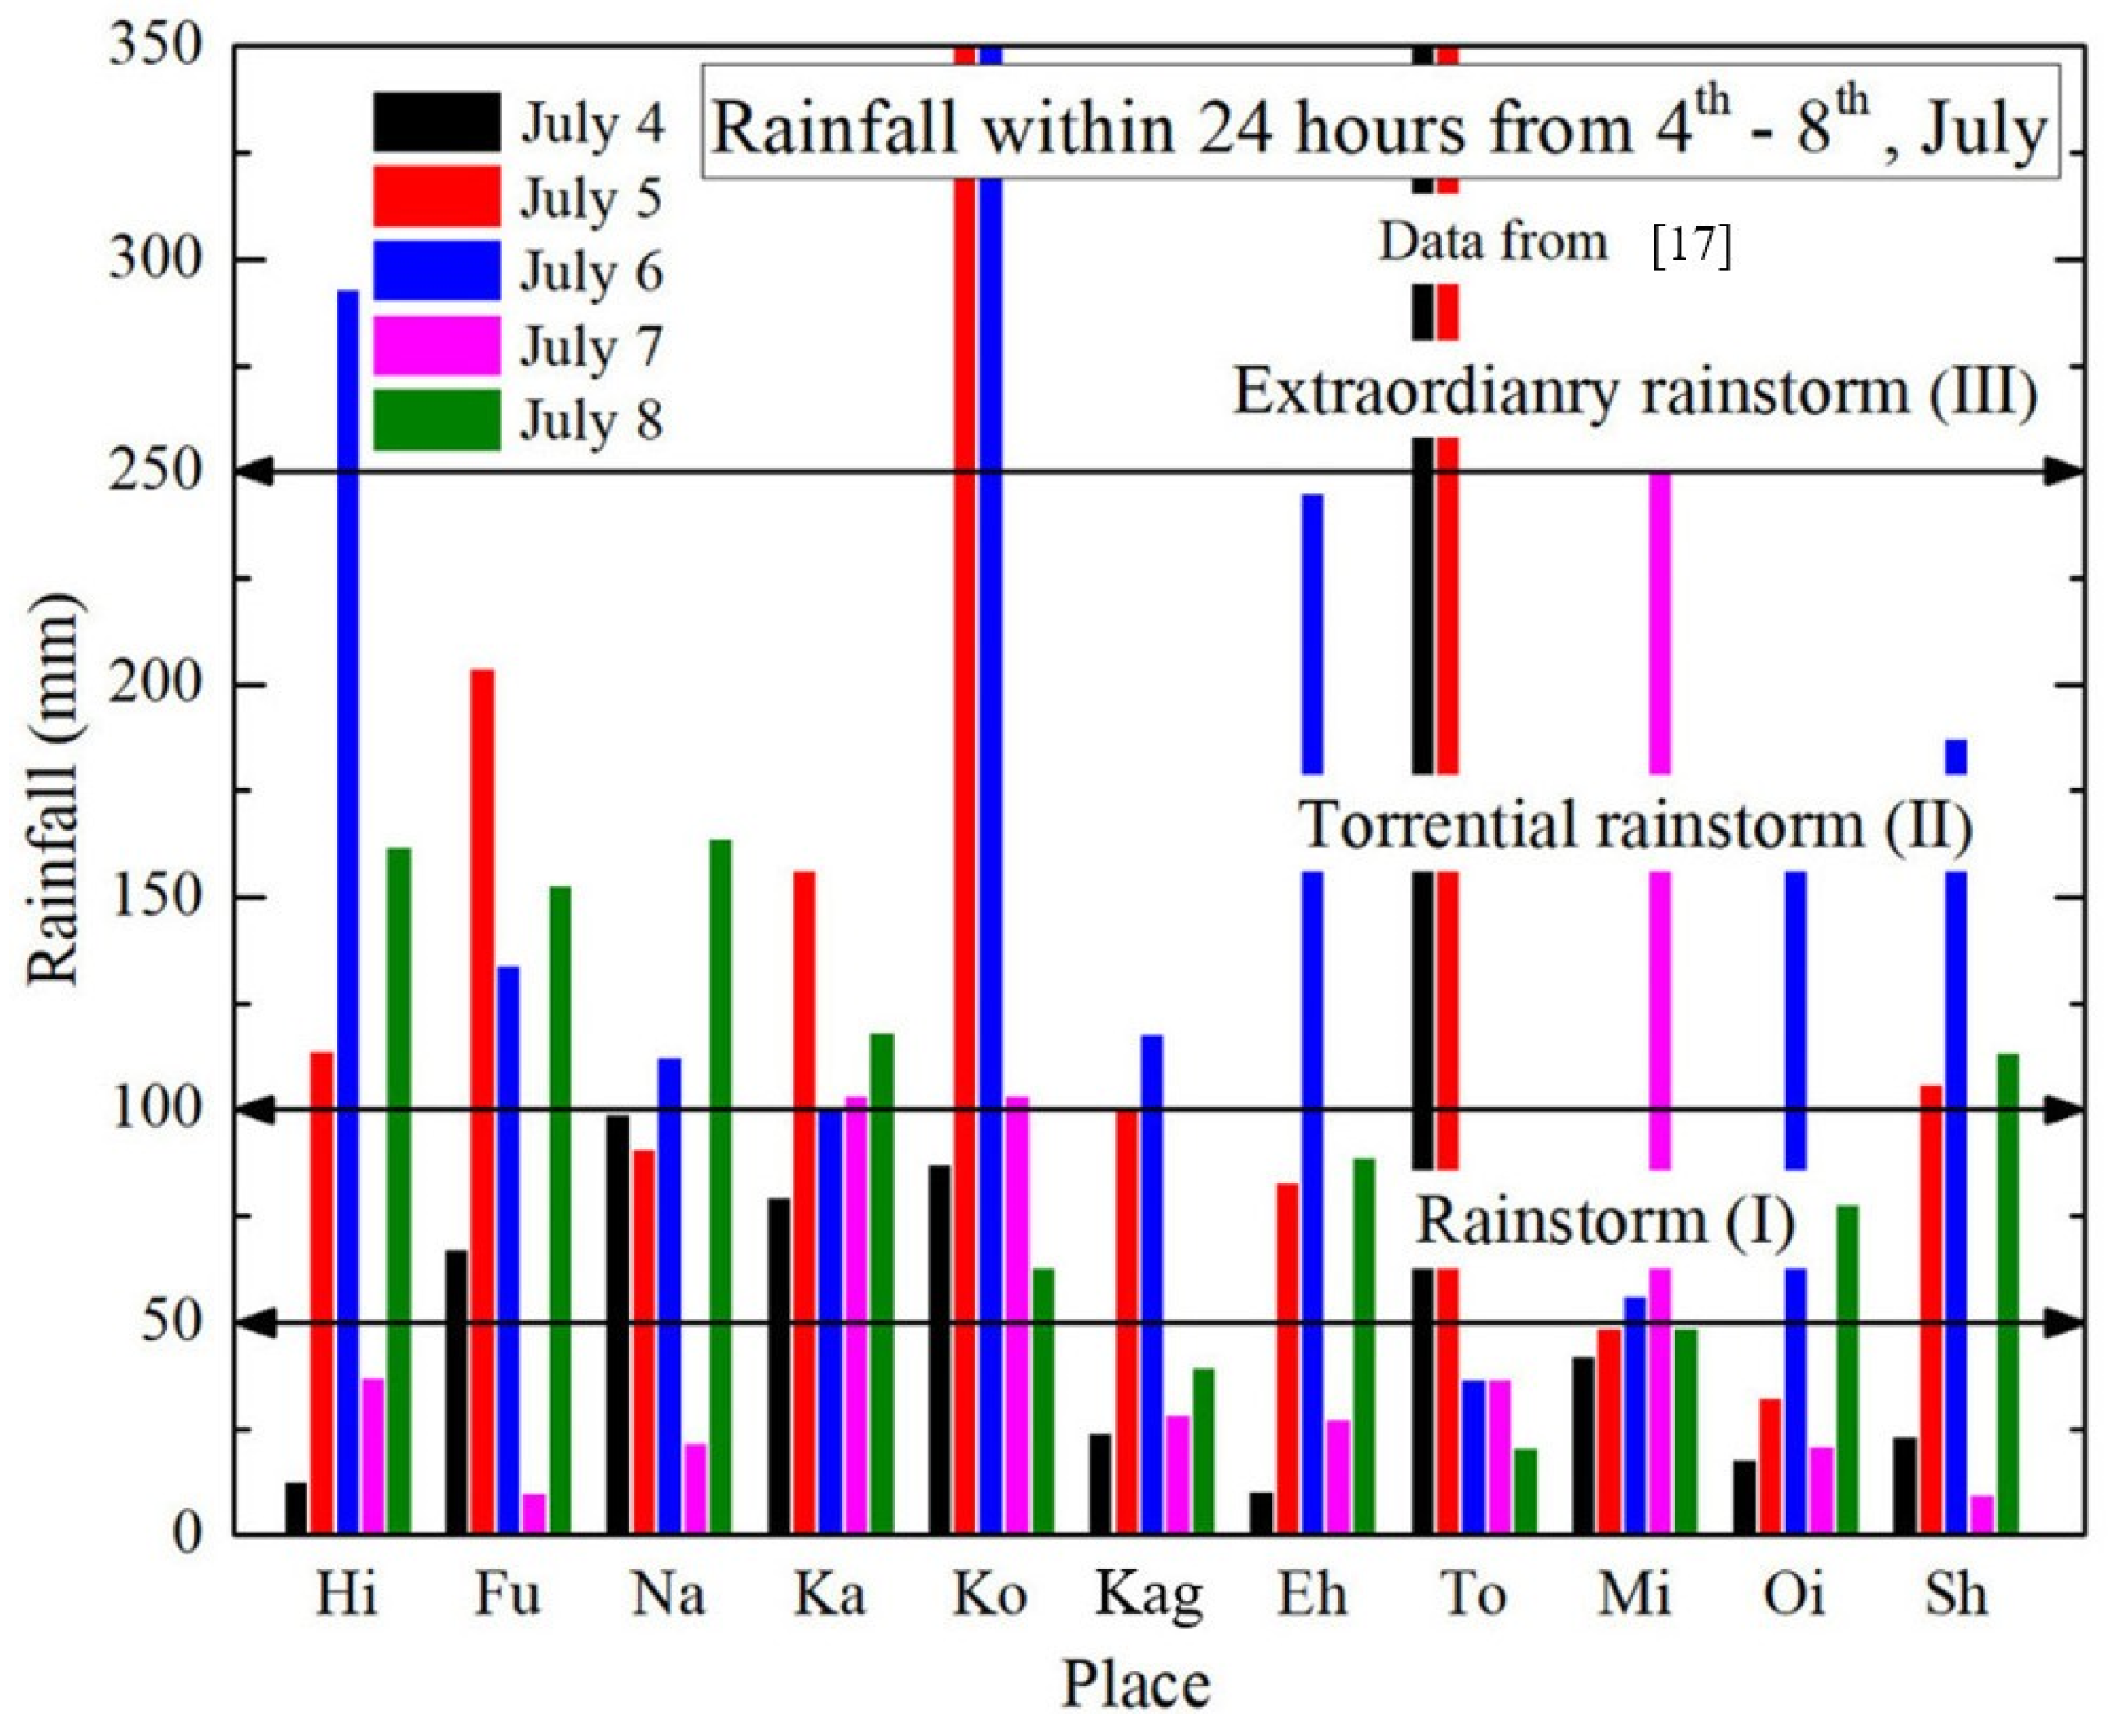
2.1. Rainfall Formation
2.2. Flooding in Western Japan
3. Hazards and Loss Caused by Flooding
3.1. Flood Hazard
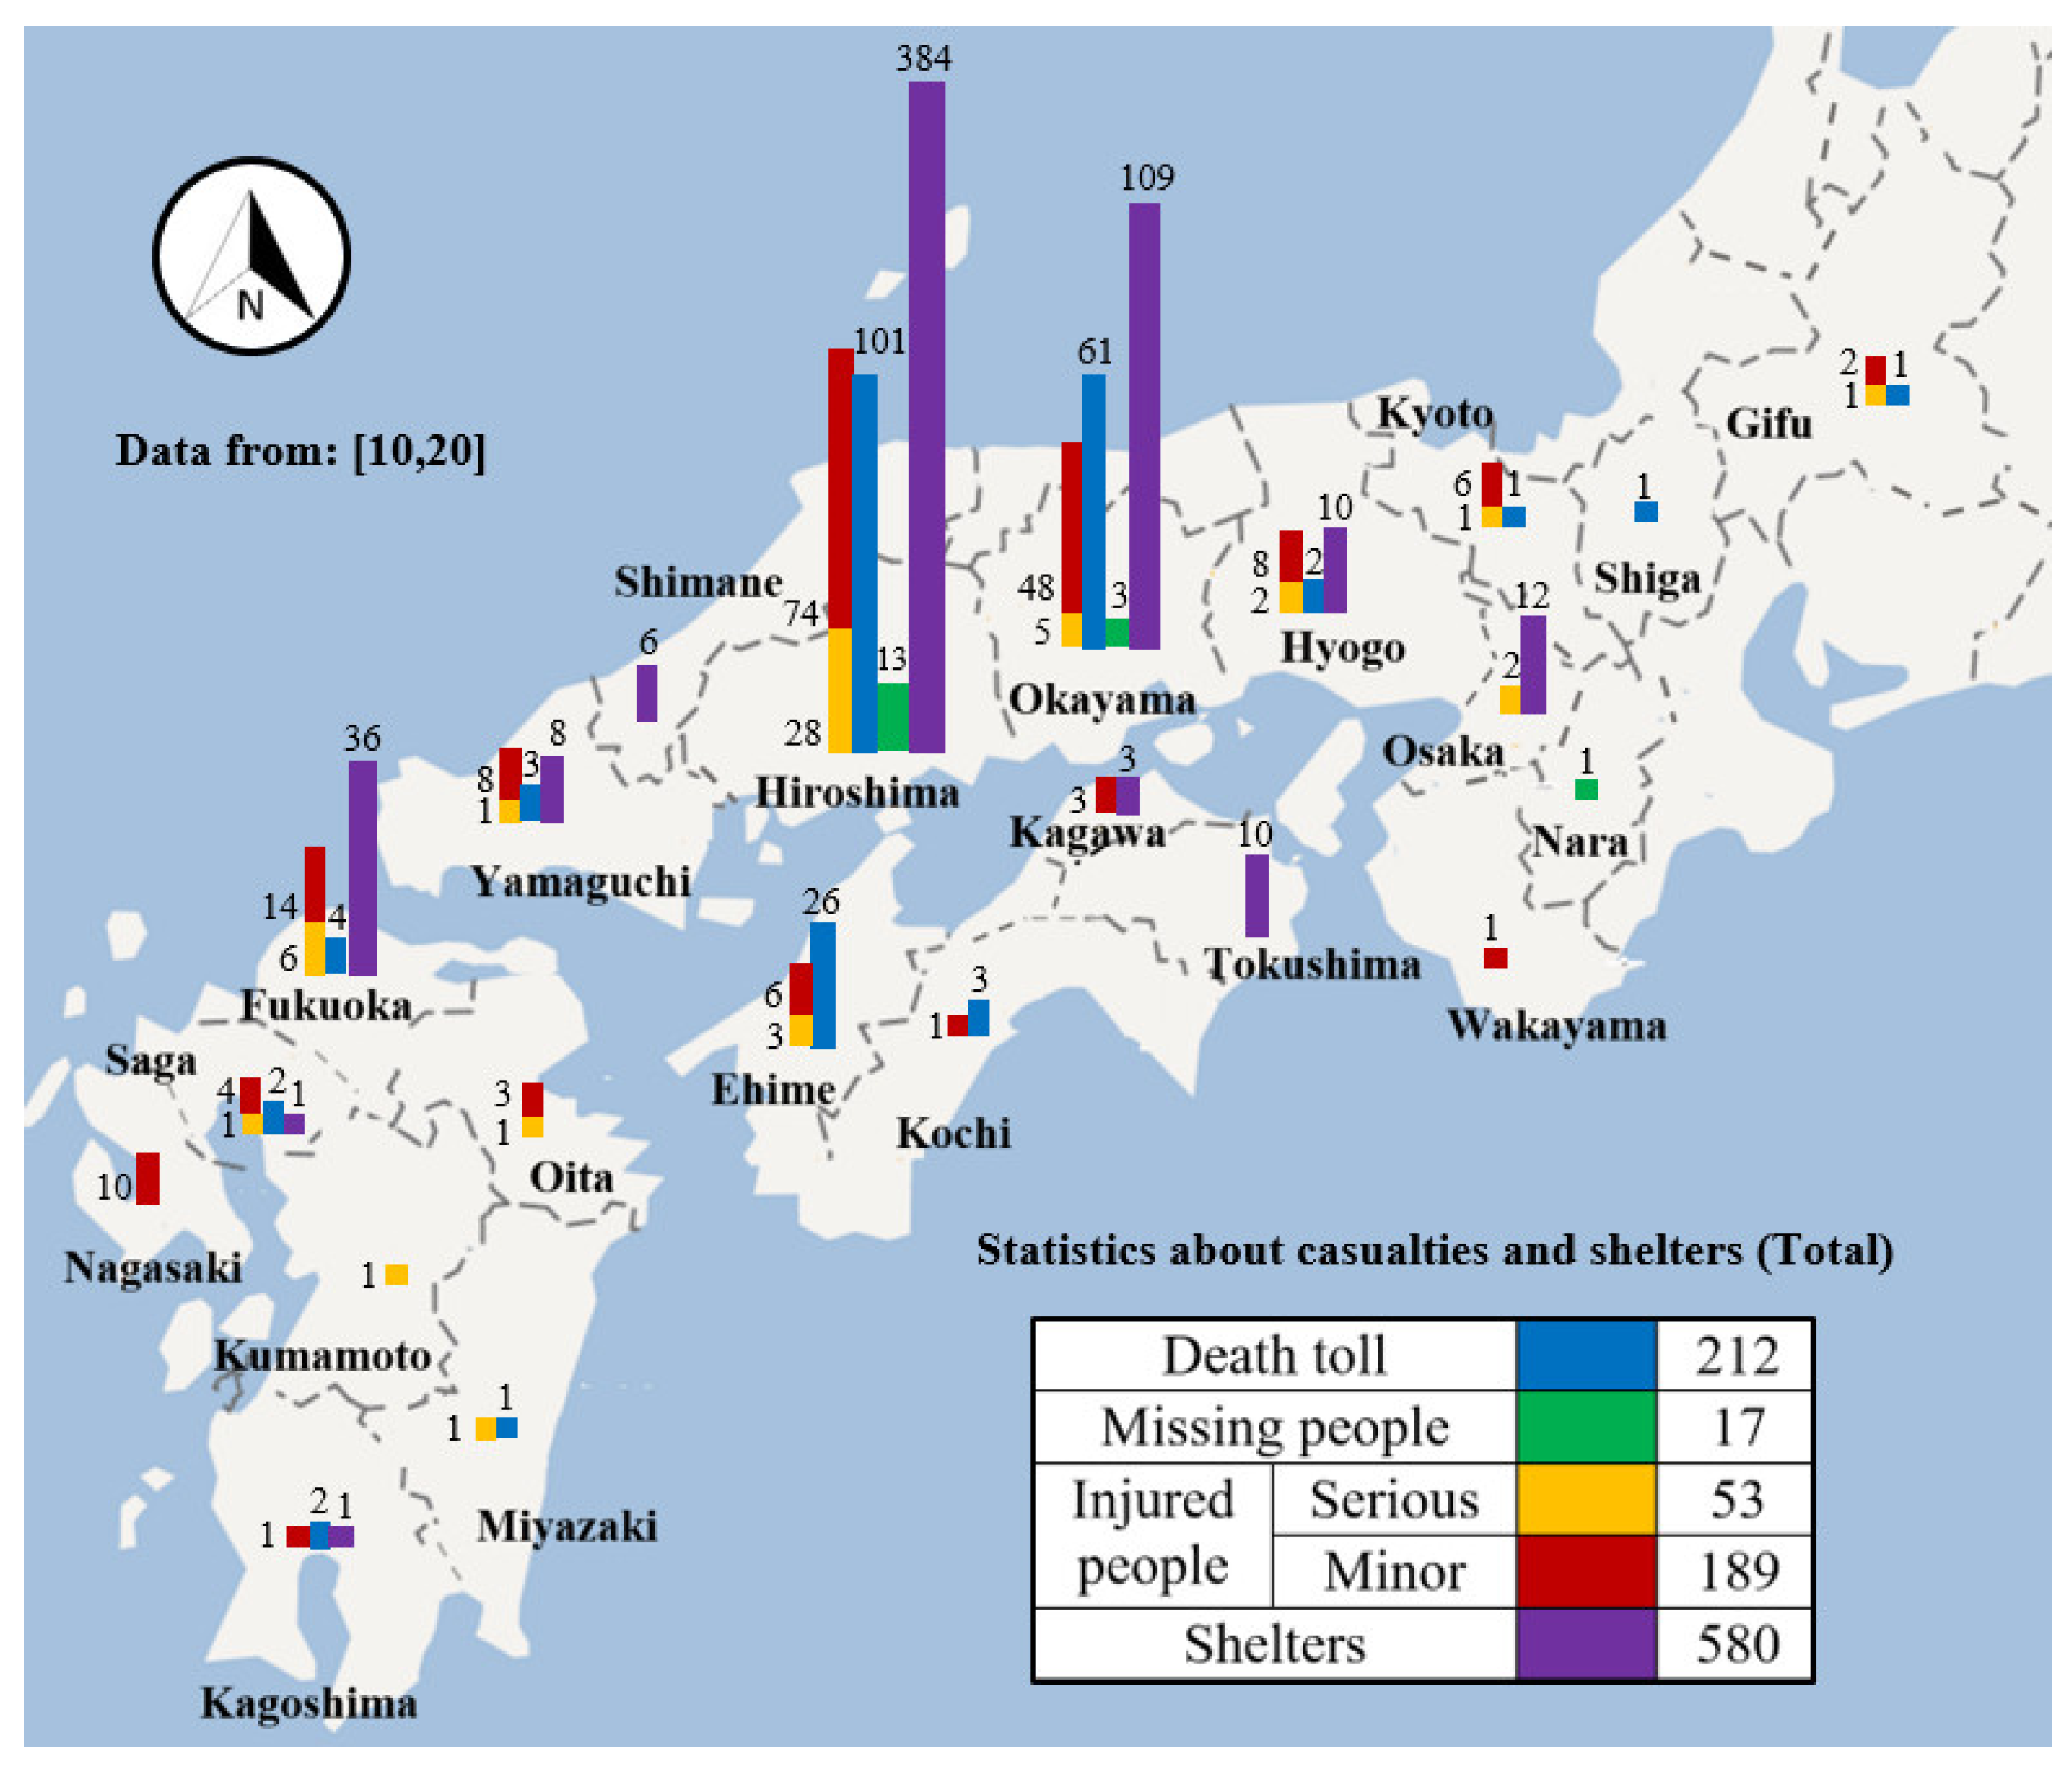
3.2. Casualties and Economic Losses
4. Analysis
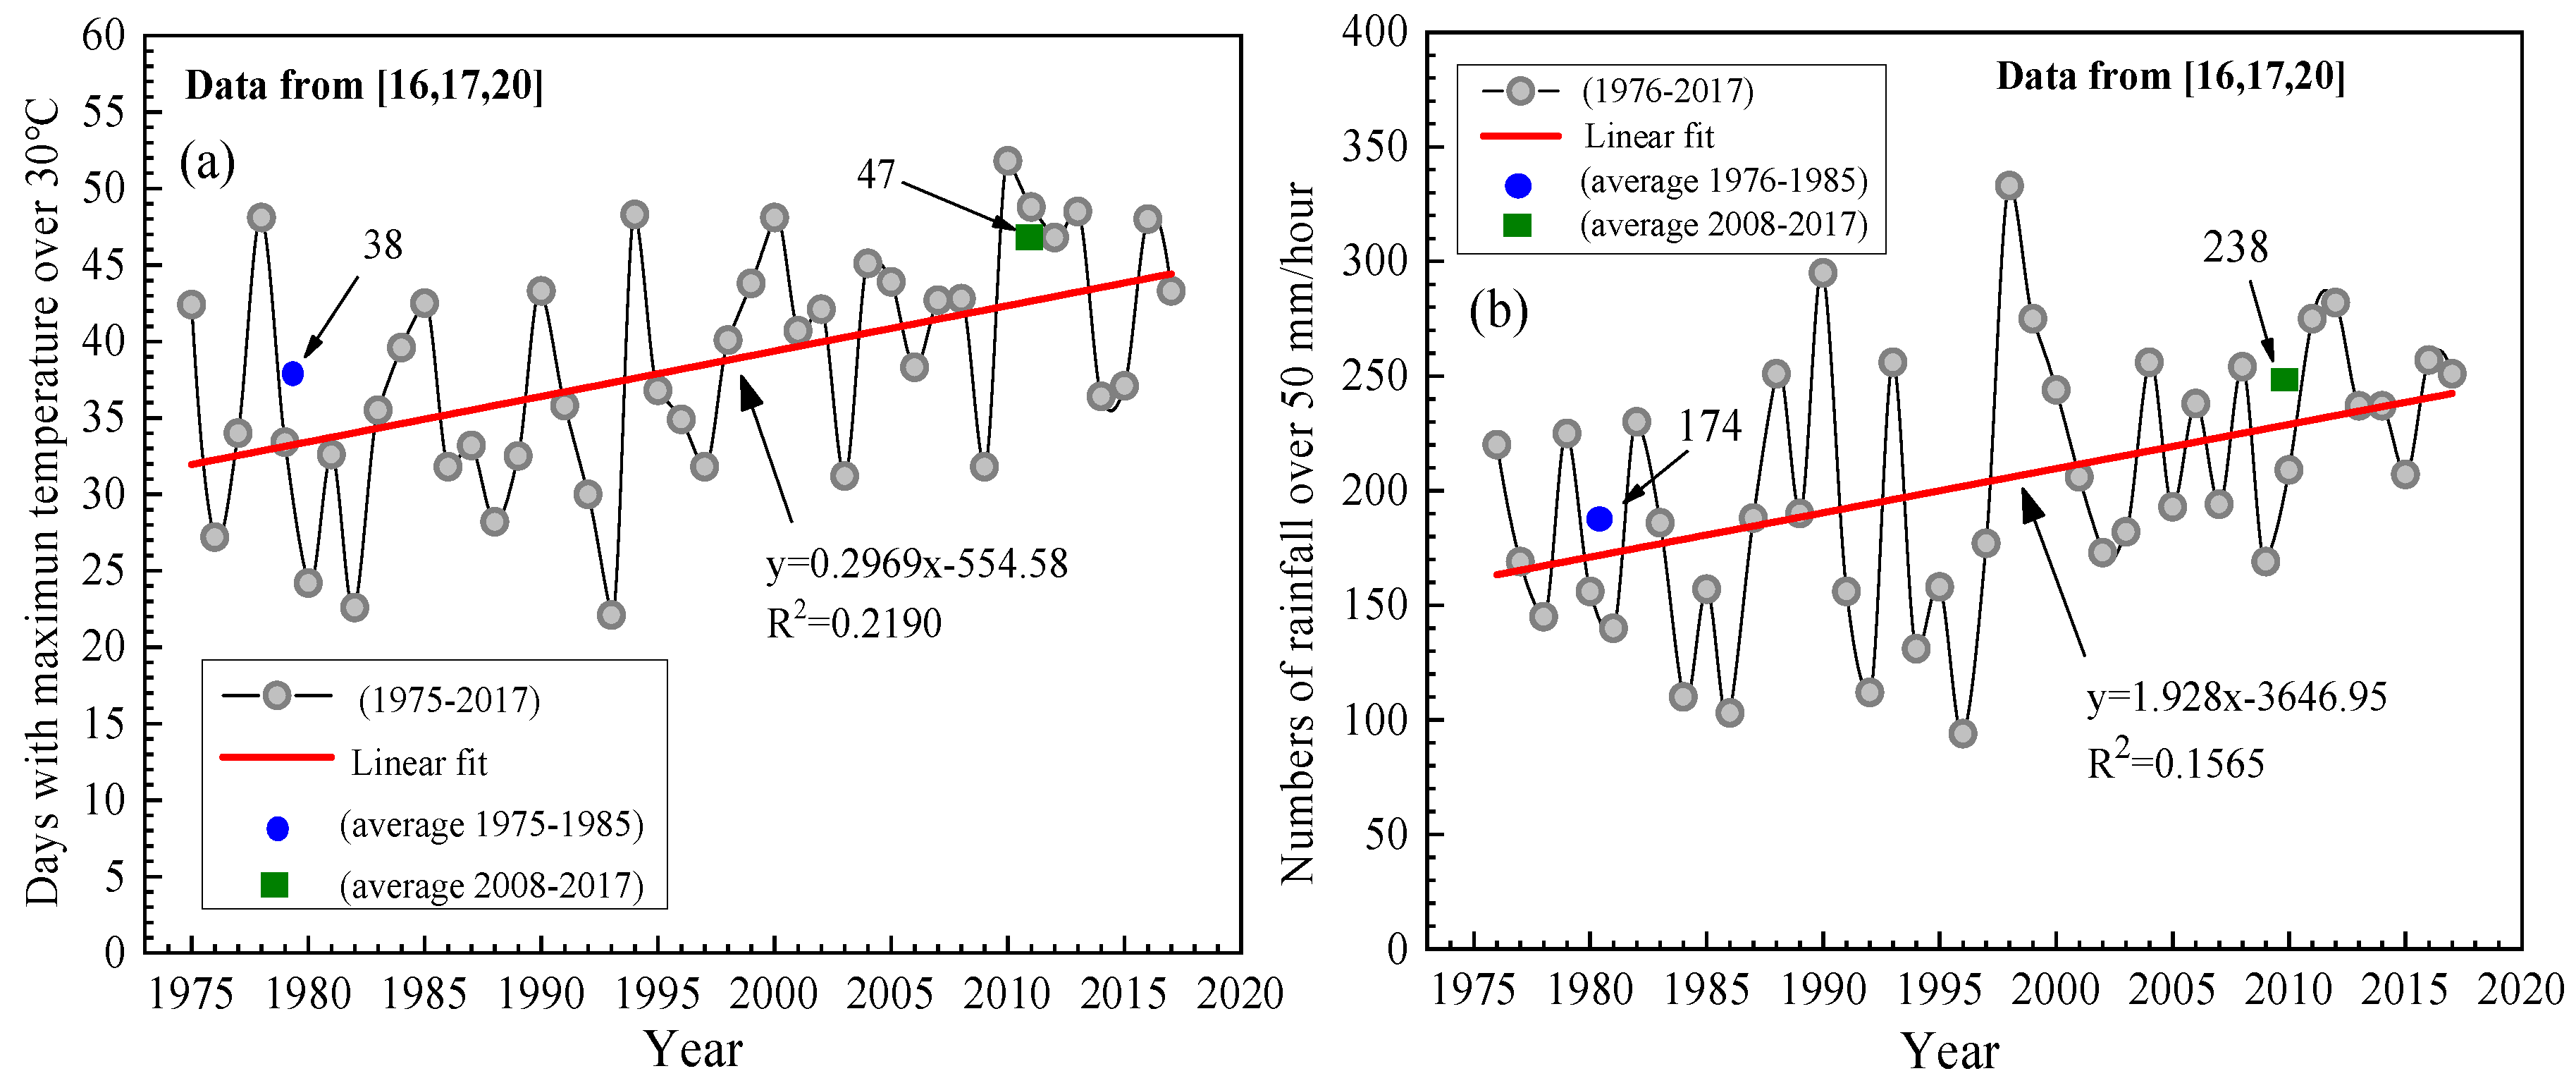
4.1. Natural Hazard Statistics over the Recent 30 Years in Japan
4.2. Cause Analysis of Flood Hazards in Japan
5. Suggestions
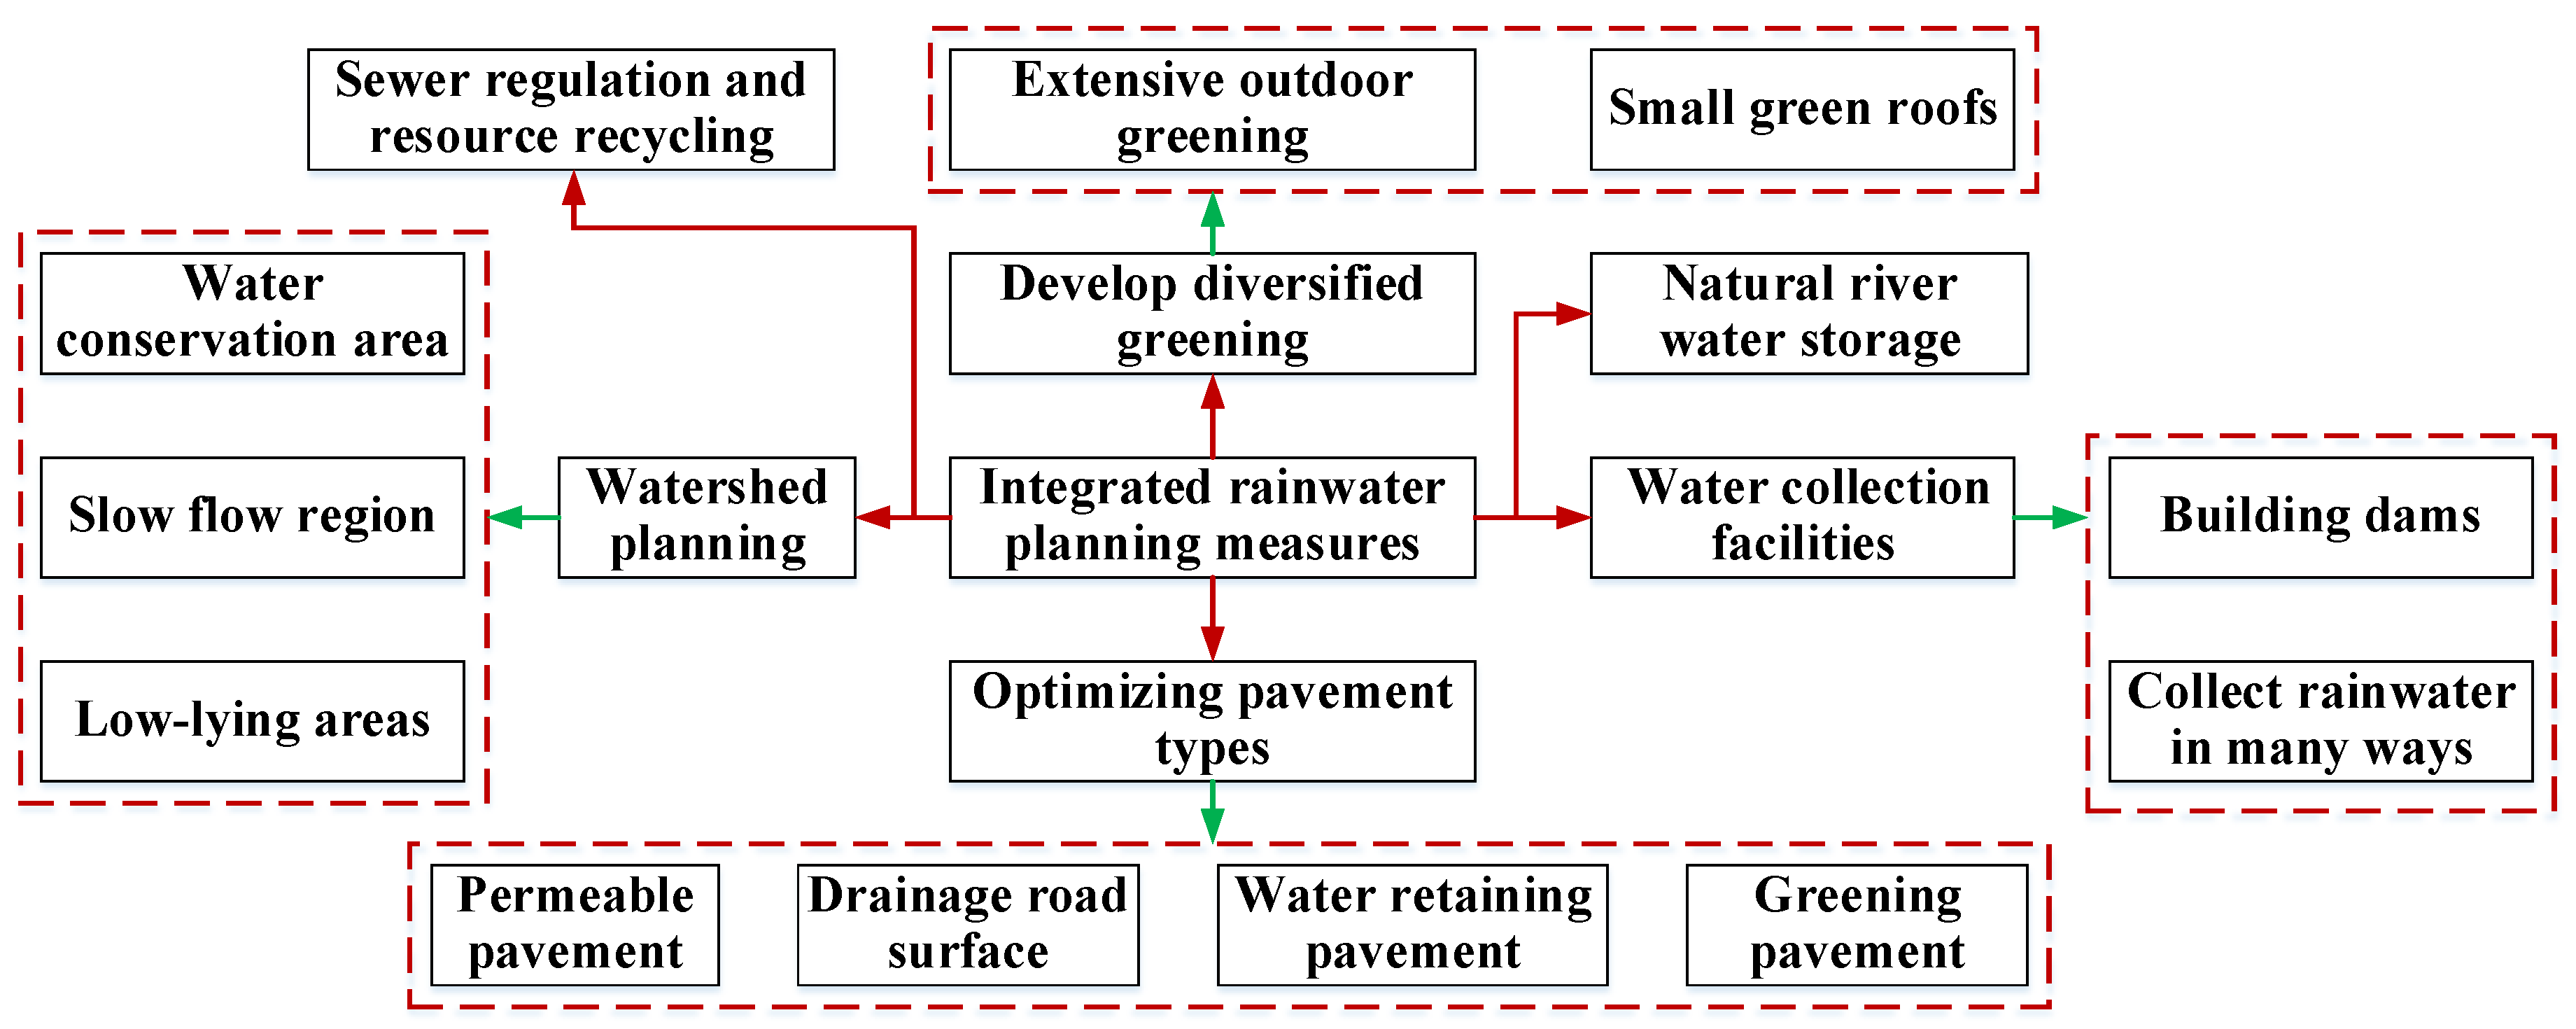
5.1. Strengthen River Management and Construct Sponge Cities
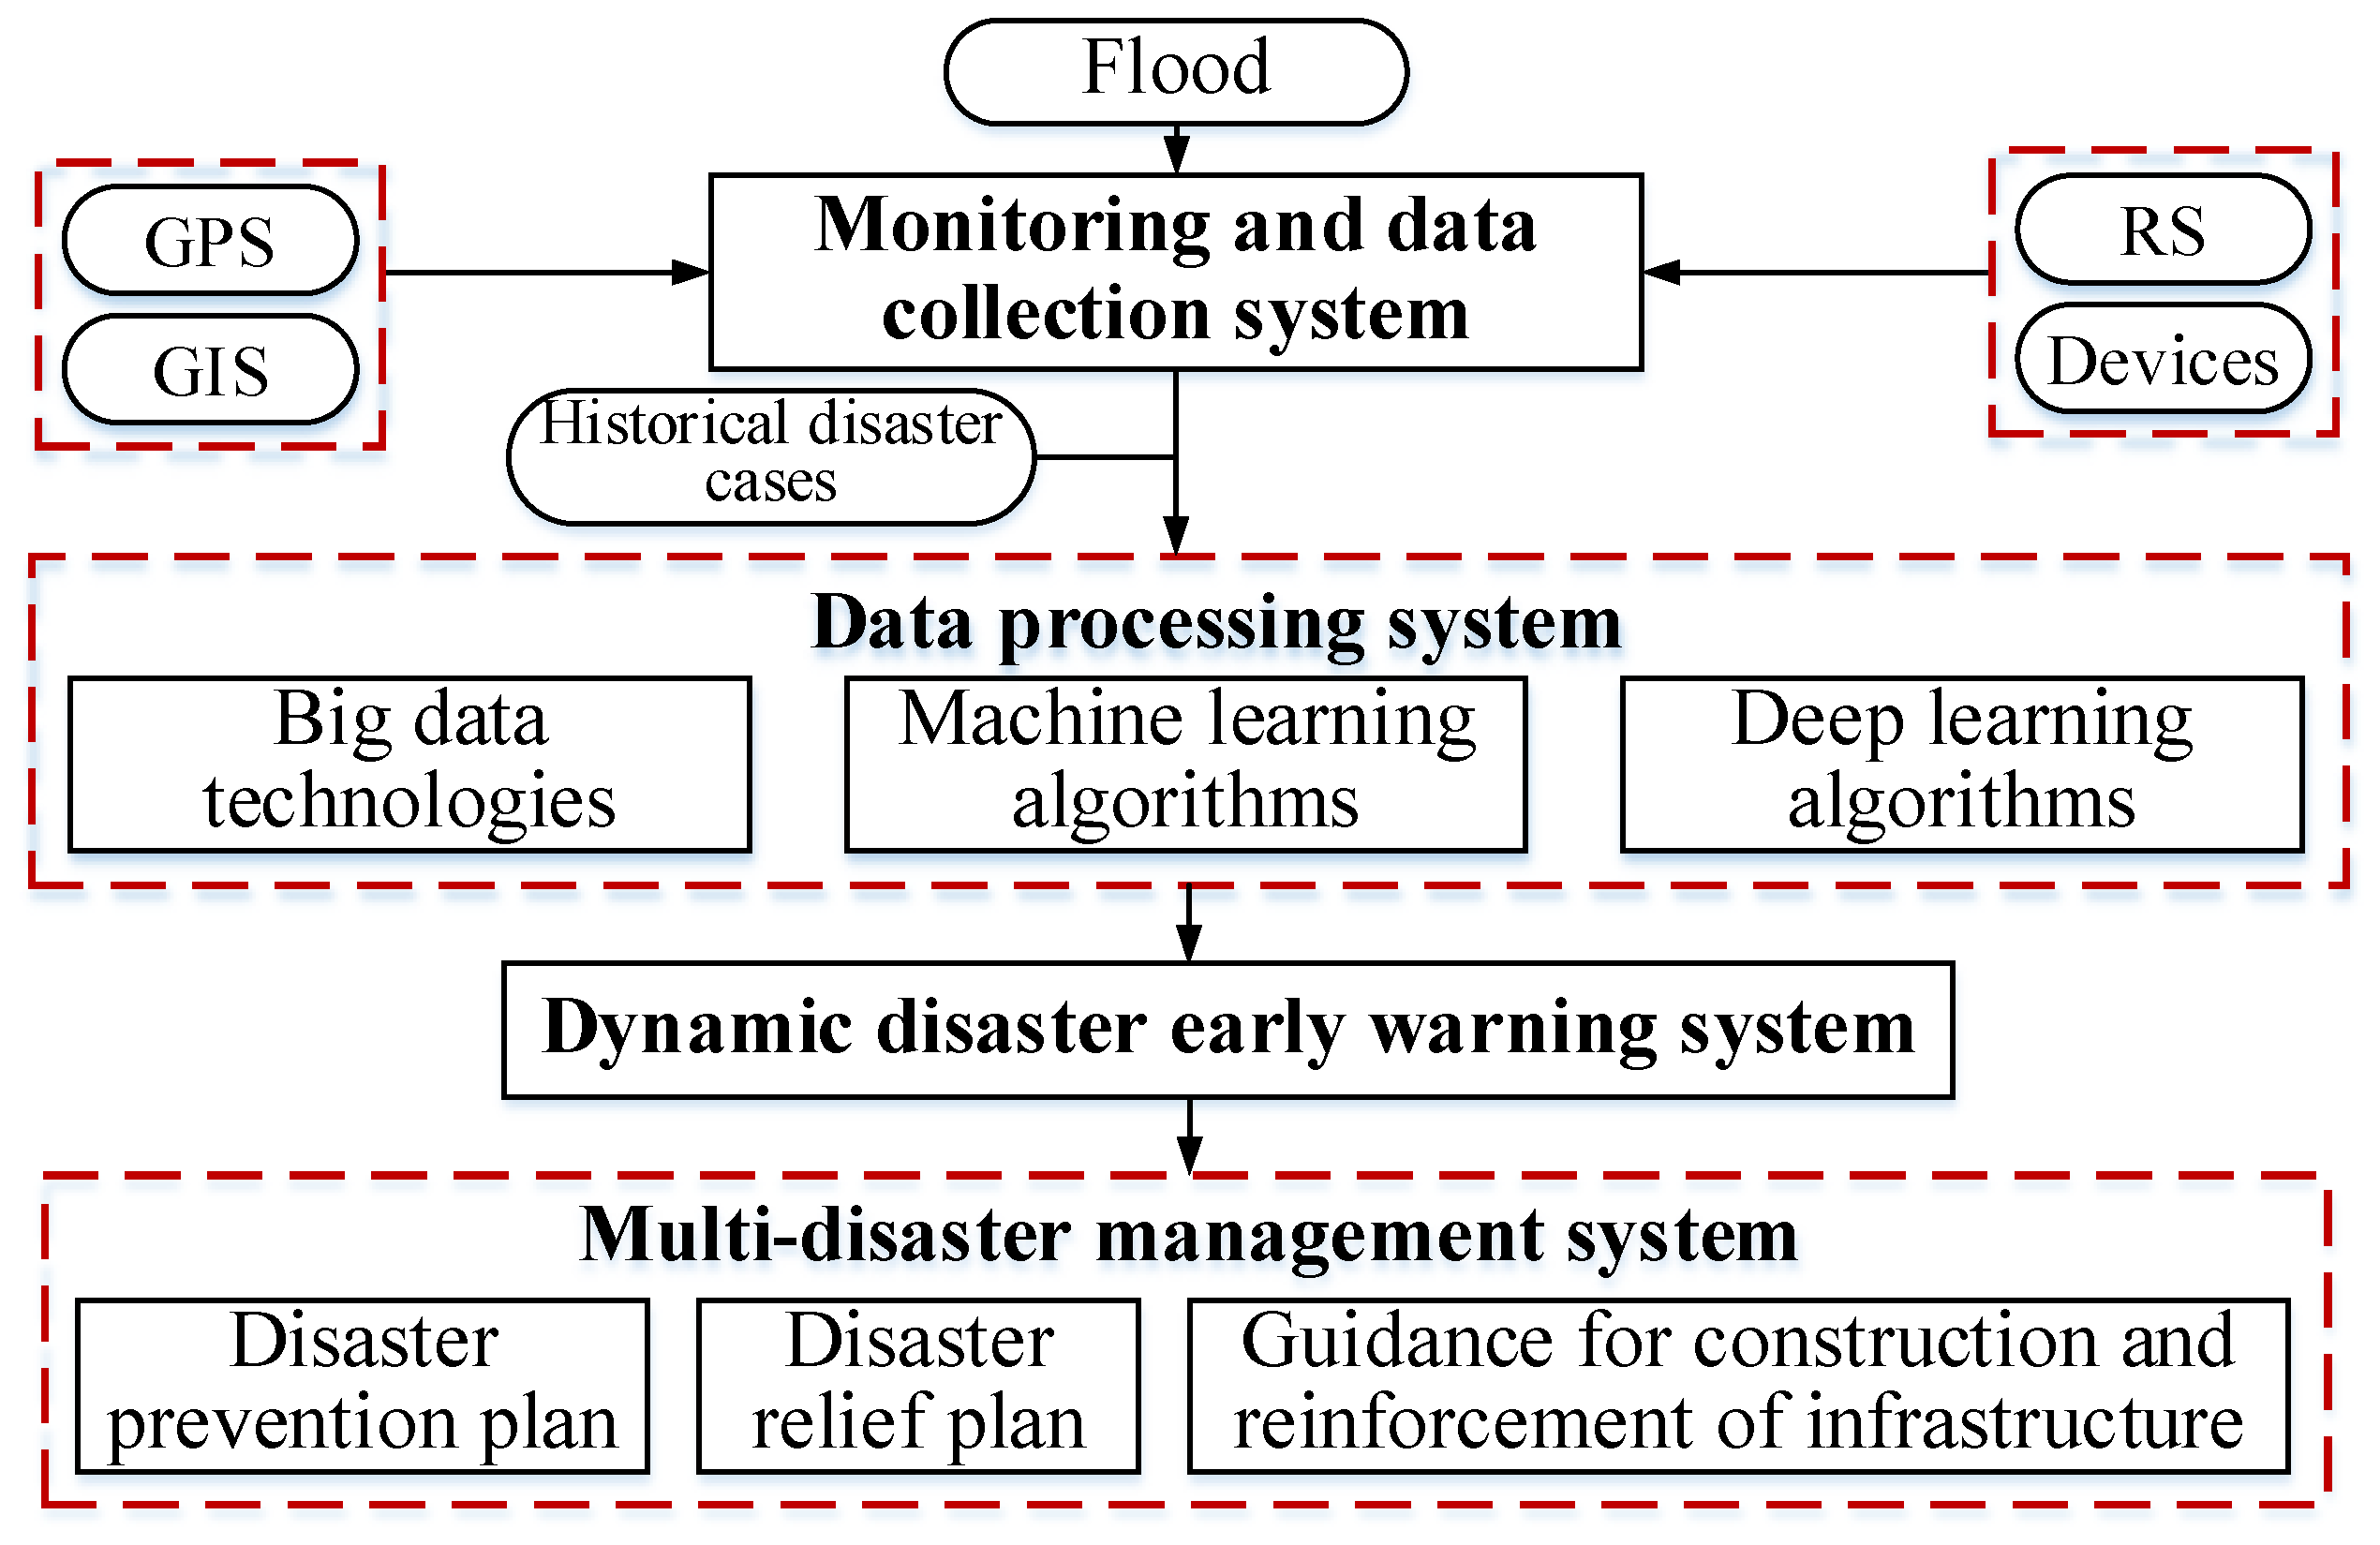
5.2. Establishment of an Early Warning System for Flood-Hazards
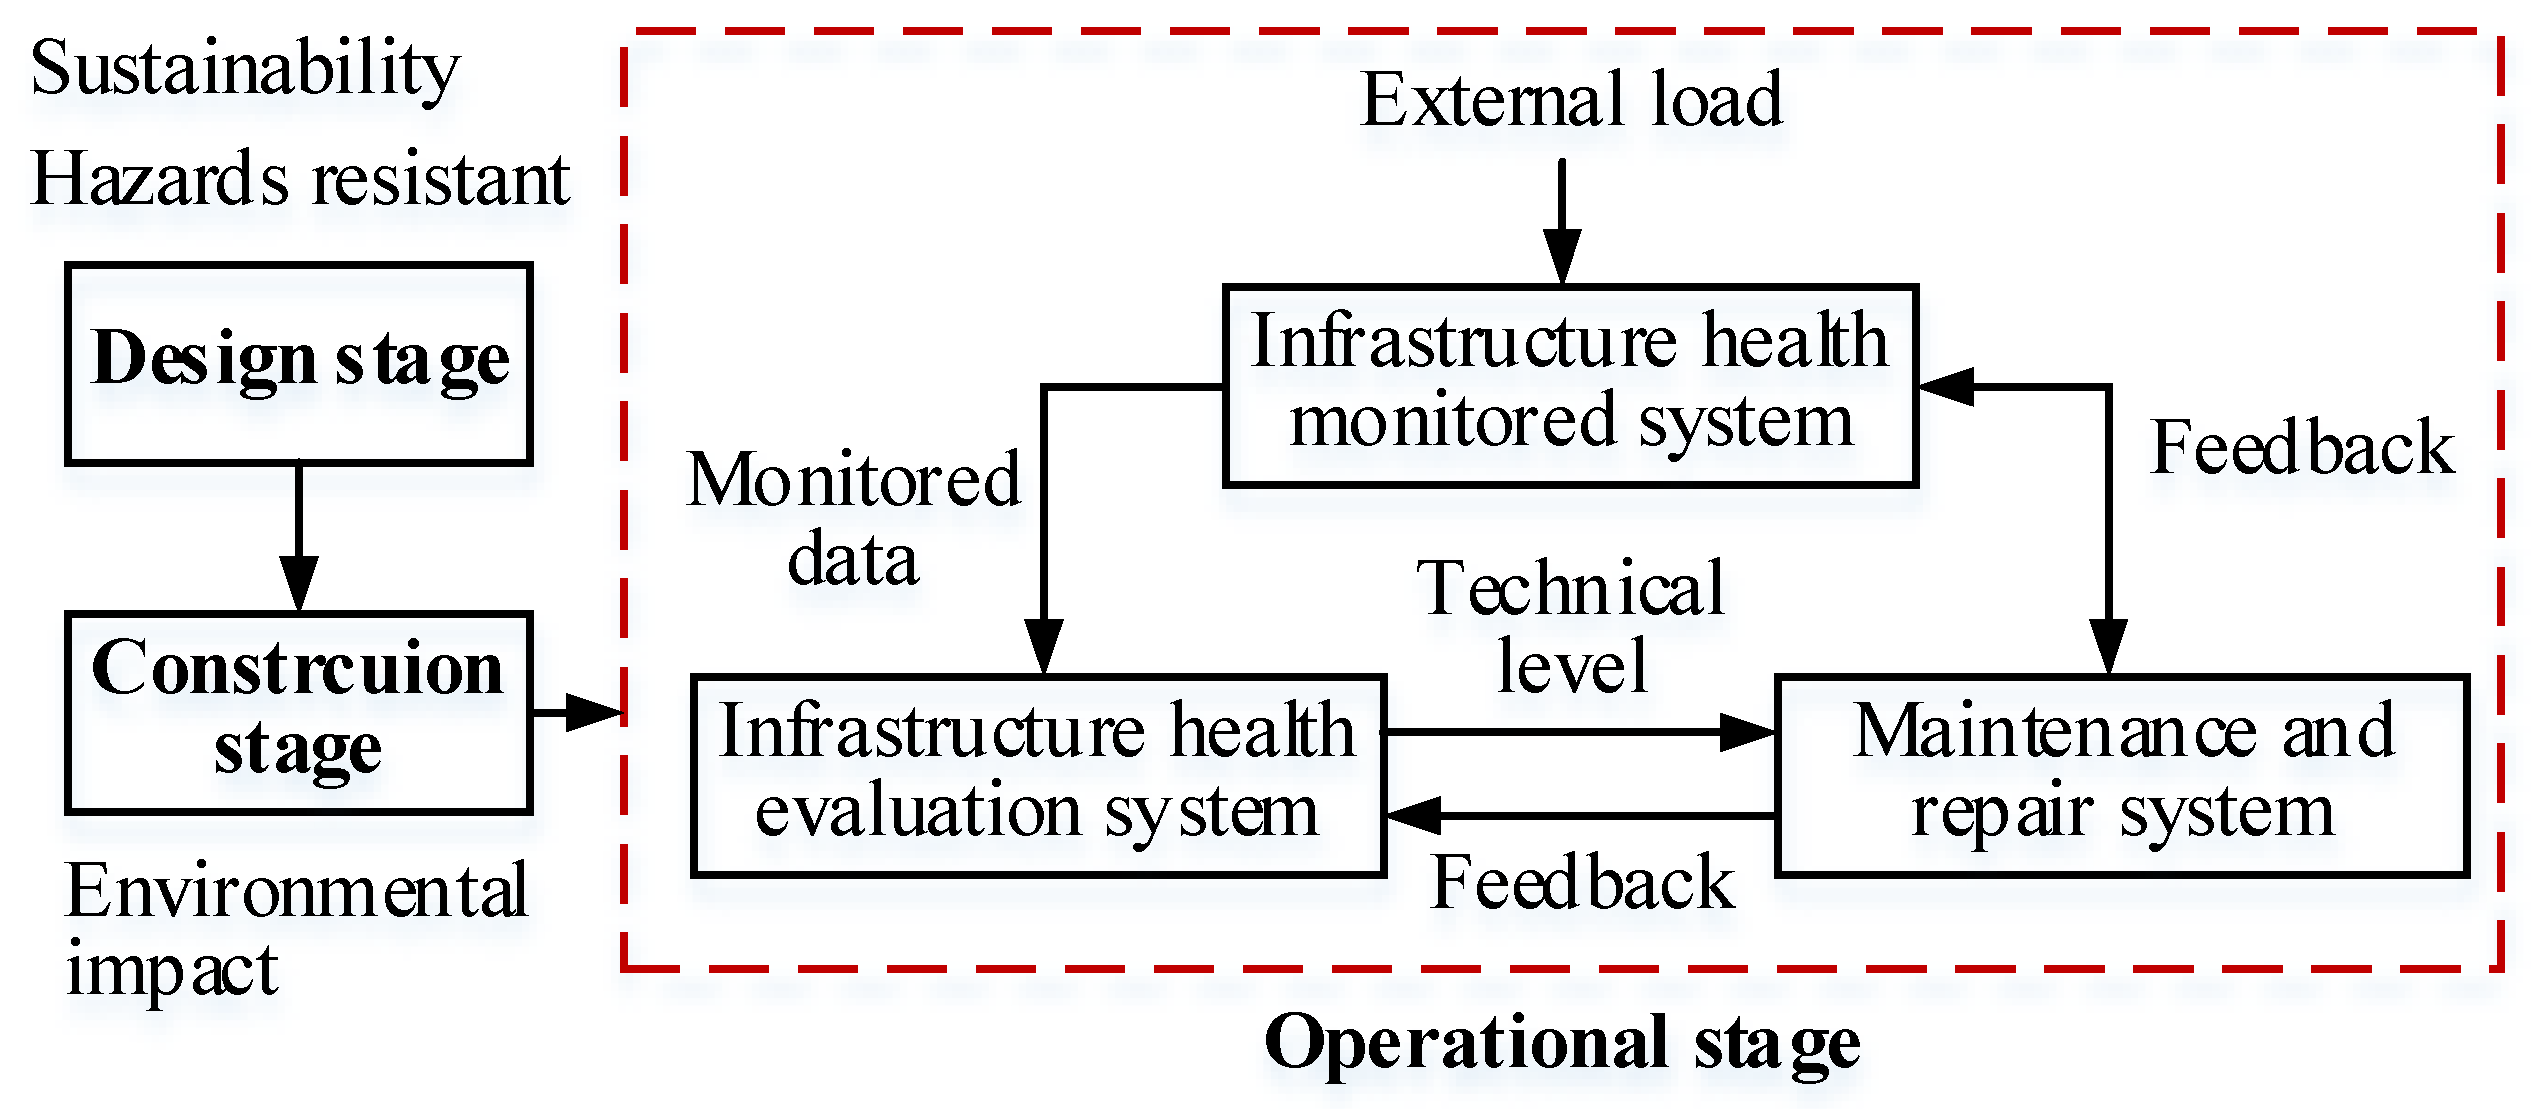
5.3. Management of Infrastructure
5.4. Other Recommendations
6. Conclusions
- (1)
- The catastrophic flood that occurred in western Japan in July 2018 led to 212 deaths. This flood hazard also led to more than 2000 houses being damaged/destroyed and 619 geological disasters in 31 prefectures. The impacts of the catastrophic flooding hazard in western Japan revealed the vulnerabilities of hazard prevention and management systems in Japan. The causes of and contributing factors to the catastrophic flood are illustrated. The analysis of the catastrophic flood in Japan provides a valuable lesson for flood hazard prediction, prevention, and management.
- (2)
- Some countermeasures are presented to better prevent and cope with flood hazards in the future. A spongy city should be constructed to enhance the resilience to adapt to extreme rainfall events. In addition, a framework for a flood hazard early warning system is proposed. A collaborative early warning system is established based on information science and artificial intelligence technologies. Finally, the importance of maintaining and updating infrastructure in time is highlighted.
Author Contributions
Funding
Conflicts of Interest
Nomenclature
| Items | Abbreviation |
| Carbon dioxide | CO2 |
| Ehime | Eh |
| Fukuoka | Fu |
| Geographical information system | GIS |
| Global positioning system | GPS |
| Hiroshima | Hi |
| Japanese Yen | JPY |
| Hazards prevention and management system | HPMS |
| Information science and artificial intelligence technologies | ISAIT |
| Kagoshima | Ka |
| Kochi | Ko |
| Kagawa | Kag |
| Ministry of Construction | MOC |
| Miyazaki | Mi |
| Early warning system | EWS |
| Nagasaki | Na |
| Oita | Oi |
| Remote sensing | RS |
| Shimane | Sh |
| Tokushima | To |
References
- Lyu, H.M.; Shen, S.L.; Zhou, A.; Yang, J. Risk assessment of mega-city infrastructures related to land subsidence using improved trapezoidal FAHP. Sci. Total Environ. 2020, 717, 135310. [Google Scholar] [CrossRef] [PubMed]
- Lyu, H.M.; Wang, G.F.; Shen, J.S.; Lu, L.H.; Wang, G.Q. Analysis and GIS mapping of flooding hazards on 10 May 2016, Guangzhou, China. Water 2016, 8, 447. [Google Scholar] [CrossRef] [Green Version]
- Lyu, H.M.; Shen, S.L.; Zhou, A.; Zhou, W.H. Data in flood risk assessment of metro systems in a subsiding environment using the interval FAHP-FCA approach. Data Brief 2019, 26, 104468. [Google Scholar] [CrossRef] [PubMed]
- Wu, Y.X.; Lyu, H.M.; Shen, S.L.; Zhou, A. A three-dimensional fluid-solid coupled numerical modeling of the barrier leakage below the excavation surface due to dewatering. Hydrogeol. J. 2020, 28, 1449–1463. [Google Scholar] [CrossRef]
- Wu, Y.X.; Shen, S.L.; Lyu, H.M.; Zhou, A.N. Analyses of leakage effect of waterproof curtain during excavation dewatering. J. Hydrol. 2020, 583, 124582. [Google Scholar] [CrossRef]
- Intergovernmental Panel on Climate Change (IPCC). Climate Change: Radiative Forcing of Climate Change and an Evaluation of the IPCC IS92 Emission Scenarios; Cambridge University Press: Cambridge, UK, 1995. [Google Scholar]
- Lin, S.S.; Shen, S.L.; Zhou, A.; Lyu, H.M. Sustainable development and environmental restoration in Lake Erhai, China. J. Clean. Prod. 2020, 258, 120758. [Google Scholar] [CrossRef]
- Ward, P.J.; Kummu, M.; Lall, U. Flood frequencies and durations and their response to El Niño Southern Oscillation: Global analysis. J. Hydrol. 2016, 539, 358–378. [Google Scholar] [CrossRef] [Green Version]
- Ali, R.S.; Kuriqi, A.; Kisi, O. Human-environment natural disasters interconnection in China: A review. Climate 2020, 8, 48. [Google Scholar] [CrossRef] [Green Version]
- Cabinet Office. Government of Japan (COGOJ). Damage Caused by Heavy Rain on July 9th, Heisei 30. Available online: http://www.bousai.go.jp/updates/h30typhoon7/index.html (accessed on 5 May 2019). (In Japanese)
- Hussein, S.; Abdelkareem, M.; Hussein, R.; Askalany, M. Using remote sensing data for predicting potential areas to flash flood hazards and water resources. Remote Sens. Appl. Soc. Environ. 2019, 16, 100254. [Google Scholar] [CrossRef]
- Sharma, T.P.P.; Zhang, J.H.; Koju, U.A.; Zhang, S.; Bai, Y.; Suwal, M.K. Review of flood disaster studies in Nepal: A remote sensing perspective. Int. J. Disaster Risk Reduct. 2019, 34, 18–27. [Google Scholar] [CrossRef]
- Zhang, K.Q.; Gann, D.; Ross, M.; Robertson, Q. Accuracy assessment of ASTER, SRTM, ALOS, and TDX DEMs for Hispaniola and implications for mapping vulnerability to coastal flooding. Remote Sens. Environ. 2019, 225, 290–306. [Google Scholar] [CrossRef]
- Dodangeh, E.; Choubin, B.; Eigdir, A.N.; Nabipour, N.; Panahi, M.; Shamshirband, S.; Mosavi, A. Integrated machine learning methods with resampling algorithms for flood susceptibility prediction. Sci. Total Environ. 2020, 705, 135983. [Google Scholar] [CrossRef] [PubMed]
- China National Meteorological Center. Available online: http://data.cma.cn/ (accessed on 25 July 2018).
- Cabinet Office. Government of Japan (COGOJ). The Rainstorm Disaster in Northern Kyushu (TRDNK). 2018. Available online: http://www.bousai.go.jp/kaigirep/hakusho/h30.html (accessed on 5 May 2019). (In Japanese)
- Japan Meteorological Agency (JMA). Available online: http://www.data.jma.go.jp/cpdinfo/extreme/extreme_p.html (accessed on 25 July 2018).
- Ministry of Land, Infrastructure, Transport and Tourism (MLITT). 2018. Available online: http://www.mlit.go.jp/index.html (accessed on 5 May 2019). (In Japanese).
- Jiang, F.R. Japan’s catastrophic flood in July 2018 and its response. China Flood Drought Manag. 2018, 28, 12. [Google Scholar] [CrossRef]
- Edogawa River Office. Metropolitan Area Outer Canal. Available online: https://www.ktr.mlit.go.jp/edogawa/gaikaku/hans/edogawa_hans00823.html (accessed on 5 May 2019). (In Japanese)
- Japan Meteorological Agency (JMA). Heavy Rain Due to Plum Rain Plum Rain Front and Typhoon Prapiroon. Available online: http://www.data.jma.go.jp/gmd/cpd/longfcst/ (accessed on 5 May 2019). (In Japanese)
- Cabinet Office. Government of Japan (COGOJ). July Heisei Heavy Rain Emergency Disaster Countermeasure Headquarters Meeting. Available online: http://www.bousai.go.jp/updates/h30typhoon7/index.html (accessed on 5 May 2019). (In Japanese)
- Lyu, H.M.; Sun, W.J.; Shen, S.L.; Arulrajah, A. Flood risk assessment in metro systems of mega-cities using a GIS-based modeling approach. Sci. Total Environ. 2018, 626, 1012–1025. [Google Scholar] [CrossRef]
- Lyu, H.M.; Xu, Y.S.; Cheng, W.C.; Arulrajah, A. Flooding hazards across southern China and prospective sustainability measures. Sustainability 2018, 10, 1682. [Google Scholar] [CrossRef] [Green Version]
- Lyu, H.M.; Shen, S.L.; Zhou, A.N.; Yang, J. Perspectives for flood risk assessment and management for mega-city metro system. Tunn. Undergr. Space Technol. 2019, 84, 31–44. [Google Scholar] [CrossRef]
- Lyu, H.M.; Zhou, W.H.; Shen, S.L.; Zhou, A.N. Inundation risk assessment of metro system using AHP and TFN-AHP in Shenzhen. Sustain. Cities Soc. 2020, 56, 102103. [Google Scholar] [CrossRef]
- Lyu, H.M.; Shen, S.L.; Yang, J.; Yin, Z.Y. Inundation analysis of metro systems with the storm water management model incorporated into a geographical information system: A case study in Shanghai. Hydrol. Earth Syst. Sci. 2019, 23, 4293–4307. [Google Scholar] [CrossRef] [Green Version]
- Marchi, L.; Borga, M.; Preciso, E.; Gaume, E. Characterization of selected extreme flash floods in Europe and implications for flood risk management. J. Hydrol. 2010, 394, 118–133. [Google Scholar] [CrossRef]
- Gallina, V.; Torresan, S.; Critto, A. A review of multi-risk methodologies for natural hazards: Consequences and challenges for a climate change impact assessment. J. Environ. Manag. 2016, 168, 123–132. [Google Scholar] [CrossRef]
- Zhao, J.W.; Peng, F.L.; Wang, T.Q. Advances in master planning of urban underground space (UUS) in China. Tunn. Undergr. Space Technol. 2016, 55, 290–307. [Google Scholar] [CrossRef]
- Peng, J.; Peng, F.L. A GIS-Based evaluation method of underground space resource for urban spatial planning: Part 1 Methodology. Tunn. Undergr. Space Technol. 2018, 74, 82–95. [Google Scholar] [CrossRef]
- Qiao, Y.K.; Peng, F.L.; Wang, Y. Monetary valuation of urban underground space: A critical issue for the decision-making of urban underground space development. Land Use Policy 2017, 69, 12–24. [Google Scholar] [CrossRef]
- Shen, S.L.; Atangana Njock, P.G.; Zhou, A.; Lyu, H.M. Dynamic prediction of jet grout column diameter in soft soil by using Bi-LSTM deep learning. Acta Geotech. 2020. [Google Scholar] [CrossRef]
- Wang, X.W.; Yang, T.L.; Xu, Y.S.; Shen, S.L. Evaluation of optimized depth of waterproof curtain to mitigate negative impacts during dewatering. J. Hydrol. 2019, 577, 123969. [Google Scholar] [CrossRef]
- Wu, H.N.; Shen, S.L.; Chen, R.P.; Zhou, A.N. Three-dimensional numerical modelling on localised leakage in segmental lining of shield tunnels. Comput. Geotech. 2020, 122, 103549. [Google Scholar] [CrossRef]
- Elbaz, K.; Shen, S.L.; Sun, W.J.; Yin, Z.Y.; Zhou, A.N. Prediction model of shield performance during tunneling via incorporating improved Particle Swarm Optimization into ANFIS. IEEE Access 2020, 8, 39659–39671. [Google Scholar] [CrossRef]
- Shen, S.L.; Wu, Y.X.; Misra, A. Calculation of head difference at two sides of a cut-off barrier during excavation dewatering. Comput. Geotech. 2017, 91, 192–202. [Google Scholar] [CrossRef]
- Cabinet Office. Government of Japan (COGOJ). Japan’s Heisei 30 years Disaster Prevention White Paper. Available online: http://www.bousai.go.jp/kaigirep/hakusho/h30.html (accessed on 5 May 2019). (In Japanese)
- China Research and Communication Center (CRCC). 2018. Available online: http://www.jst.go.jp/crcc/ (accessed on 5 May 2019).
- Road Branch, Ministry of Land, Infrastructure, Transport and Tourism (MLIT). Annual Report of Road Maintenance, the Ministry of Land, Infrastructure, Transport. and Tourism; MLIT: Tokyo, Japan, 2017; 47p.
- Lamond, J.E.; Proverbs, D.G. Resilience to flooding: Lessons from international comparison. Proc. Inst. Civ. Eng. Urban Des. Plan. 2009, 162, 63–70. [Google Scholar] [CrossRef]
- Arulrajah, A.; Yaghoubi, E.; Imteaz, M.; Horpibulsuk, S. Recycled waste foundry sand as a sustainable subgrade fill and pipe-bedding construction material: Engineering and environmental evaluation. Sustain. Cities Soc. 2017, 28, 343–349. [Google Scholar] [CrossRef]
- Kuriqi, A. Assessment and quantification of meteorological data for implementation of weather radar in mountainous regions. Mausam 2016, 67, 789–802. [Google Scholar]
- Japan Meteorological Agency (JMA). Heavy Rain in July Heisei 30 and the High Temperature Characteristics and Factors Record after Mid-July. Available online: http://www.jma.go.jp/jma/press/1808/10c/h30goukouon20180810.html (accessed on 5 May 2019). (In Japanese)
- Iclimate. 2018. Available online: http://www.qh323.com/portal/ClimateData (accessed on 5 May 2019).
- Wu, H.L.; Cheng, W.C.; Shen, S.L.; Lin, M.Y.; Arulrajah, A. Variation of hydro-environment during past four decades with underground sponge city planning to control flash floods in Wuhan, China: An overview. Undergr. Space 2020, 5, 184–198. [Google Scholar] [CrossRef]
- Xu, Y.S.; Shen, S.L.; Ren, D.J.; Wu, H.N. Analysis of factors in land subsidence in Shanghai: A view based on Strategic Environmental Assessment. Sustainability 2016, 8, 573. [Google Scholar] [CrossRef] [Green Version]
- Sutanto, S.J.; Lanen, H.A.J.V.; Wetterhall, F.; Llort, X. Potential of Pan-European seasonal hydro-meteorological drought forecasts obtained from a Multi-Hazard Early Warning System. Bull. Am. Meteor. Soc. 2020, 101, E368–E393. [Google Scholar] [CrossRef] [Green Version]
- Xu, Y.S.; Shen, S.L.; Lai, Y.; Zhou, A.N. Design of sponge city: Lessons learnt from an ancient drainage system in Ganzhou, China. J. Hydrol. 2018, 563, 900–908. [Google Scholar] [CrossRef]
- Wu, Y.X.; Shen, S.L.; Yuan, D.J. Characteristics of dewatering induced drawdown curve under barrier effect of retaining wall in aquifer. J. Hydrol. 2016, 539, 554–566. [Google Scholar] [CrossRef]
- Liu, X.; Zhou, A.; Shen, S.L.; Li, J.; Sheng, D.C. A micro-mechanical model for unsaturated soils based on DEM. Comput. Methods Appl. Mech. Eng. 2020, 368, 113183. [Google Scholar] [CrossRef]
- Zhang, N.; Shen, S.L.; Zhou, A.N.; Xu, Y.S. Investigation on performance of neural network using quadratic relative error cost function. IEEE Access 2019, 7, 106642–106652. [Google Scholar] [CrossRef]
- Atangana Njock, P.G.; Shen, S.L.; Zhou, A.; Lyu, H.M. Evaluation of soil liquefaction using AI technology incorporating a coupled ENN/t-SNE model. Soil Dyn. Earthq. Eng. 2020, 130, 105988. [Google Scholar] [CrossRef]


| Point | Tokyo Standard Time | Wind Speed (m/s) | Scale of Wind Force | Tropical Storm Grate |
|---|---|---|---|---|
| 1 | 3 July, 7:00 | 30 | 11 | Severe tropical storm |
| 2 | 3 July, 19:00 | 28 | 10 | Severe tropical storm |
| 3 | 4 July, 7:00 | 25 | 10 | Severe tropical storm |
| 4 | 4 July, 19:00 | 23 | 9 | Tropical storm |
| 5 | 5 July, 7:00 | 20 | 8 | Tropical storm |
| Item | Geological Disaster Numbers | ||
|---|---|---|---|
| Geo-Disaster Types | Debris flow | Cliff collapsed | Landslides |
| 168 | 427 | 24 | |
| Heaviest Affected Prefectures | Hiroshima | Ehime | Hyogo |
| 123 | 59 | 51 | |
| Category | Economy Loss (Billion JPY) |
|---|---|
| Agriculture | 16.1 |
| Public infrastructure | 321 |
| Small and medium enterprises | 473.8 |
| Forestry | 23.13 |
| Fishery | 0.78 |
© 2020 by the authors. Licensee MDPI, Basel, Switzerland. This article is an open access article distributed under the terms and conditions of the Creative Commons Attribution (CC BY) license (http://creativecommons.org/licenses/by/4.0/).
Share and Cite
Lin, S.-S.; Zhang, N.; Xu, Y.-S.; Hino, T. Lesson Learned from Catastrophic Floods in Western Japan in 2018: Sustainable Perspective Analysis. Water 2020, 12, 2489. https://doi.org/10.3390/w12092489
Lin S-S, Zhang N, Xu Y-S, Hino T. Lesson Learned from Catastrophic Floods in Western Japan in 2018: Sustainable Perspective Analysis. Water. 2020; 12(9):2489. https://doi.org/10.3390/w12092489
Chicago/Turabian StyleLin, Song-Shun, Ning Zhang, Ye-Shuang Xu, and Takenori Hino. 2020. "Lesson Learned from Catastrophic Floods in Western Japan in 2018: Sustainable Perspective Analysis" Water 12, no. 9: 2489. https://doi.org/10.3390/w12092489