Growth and Collapse Dynamics of a Vapor Bubble near or at a Wall


Abstract
:1. Introduction
2. SPH Modeling
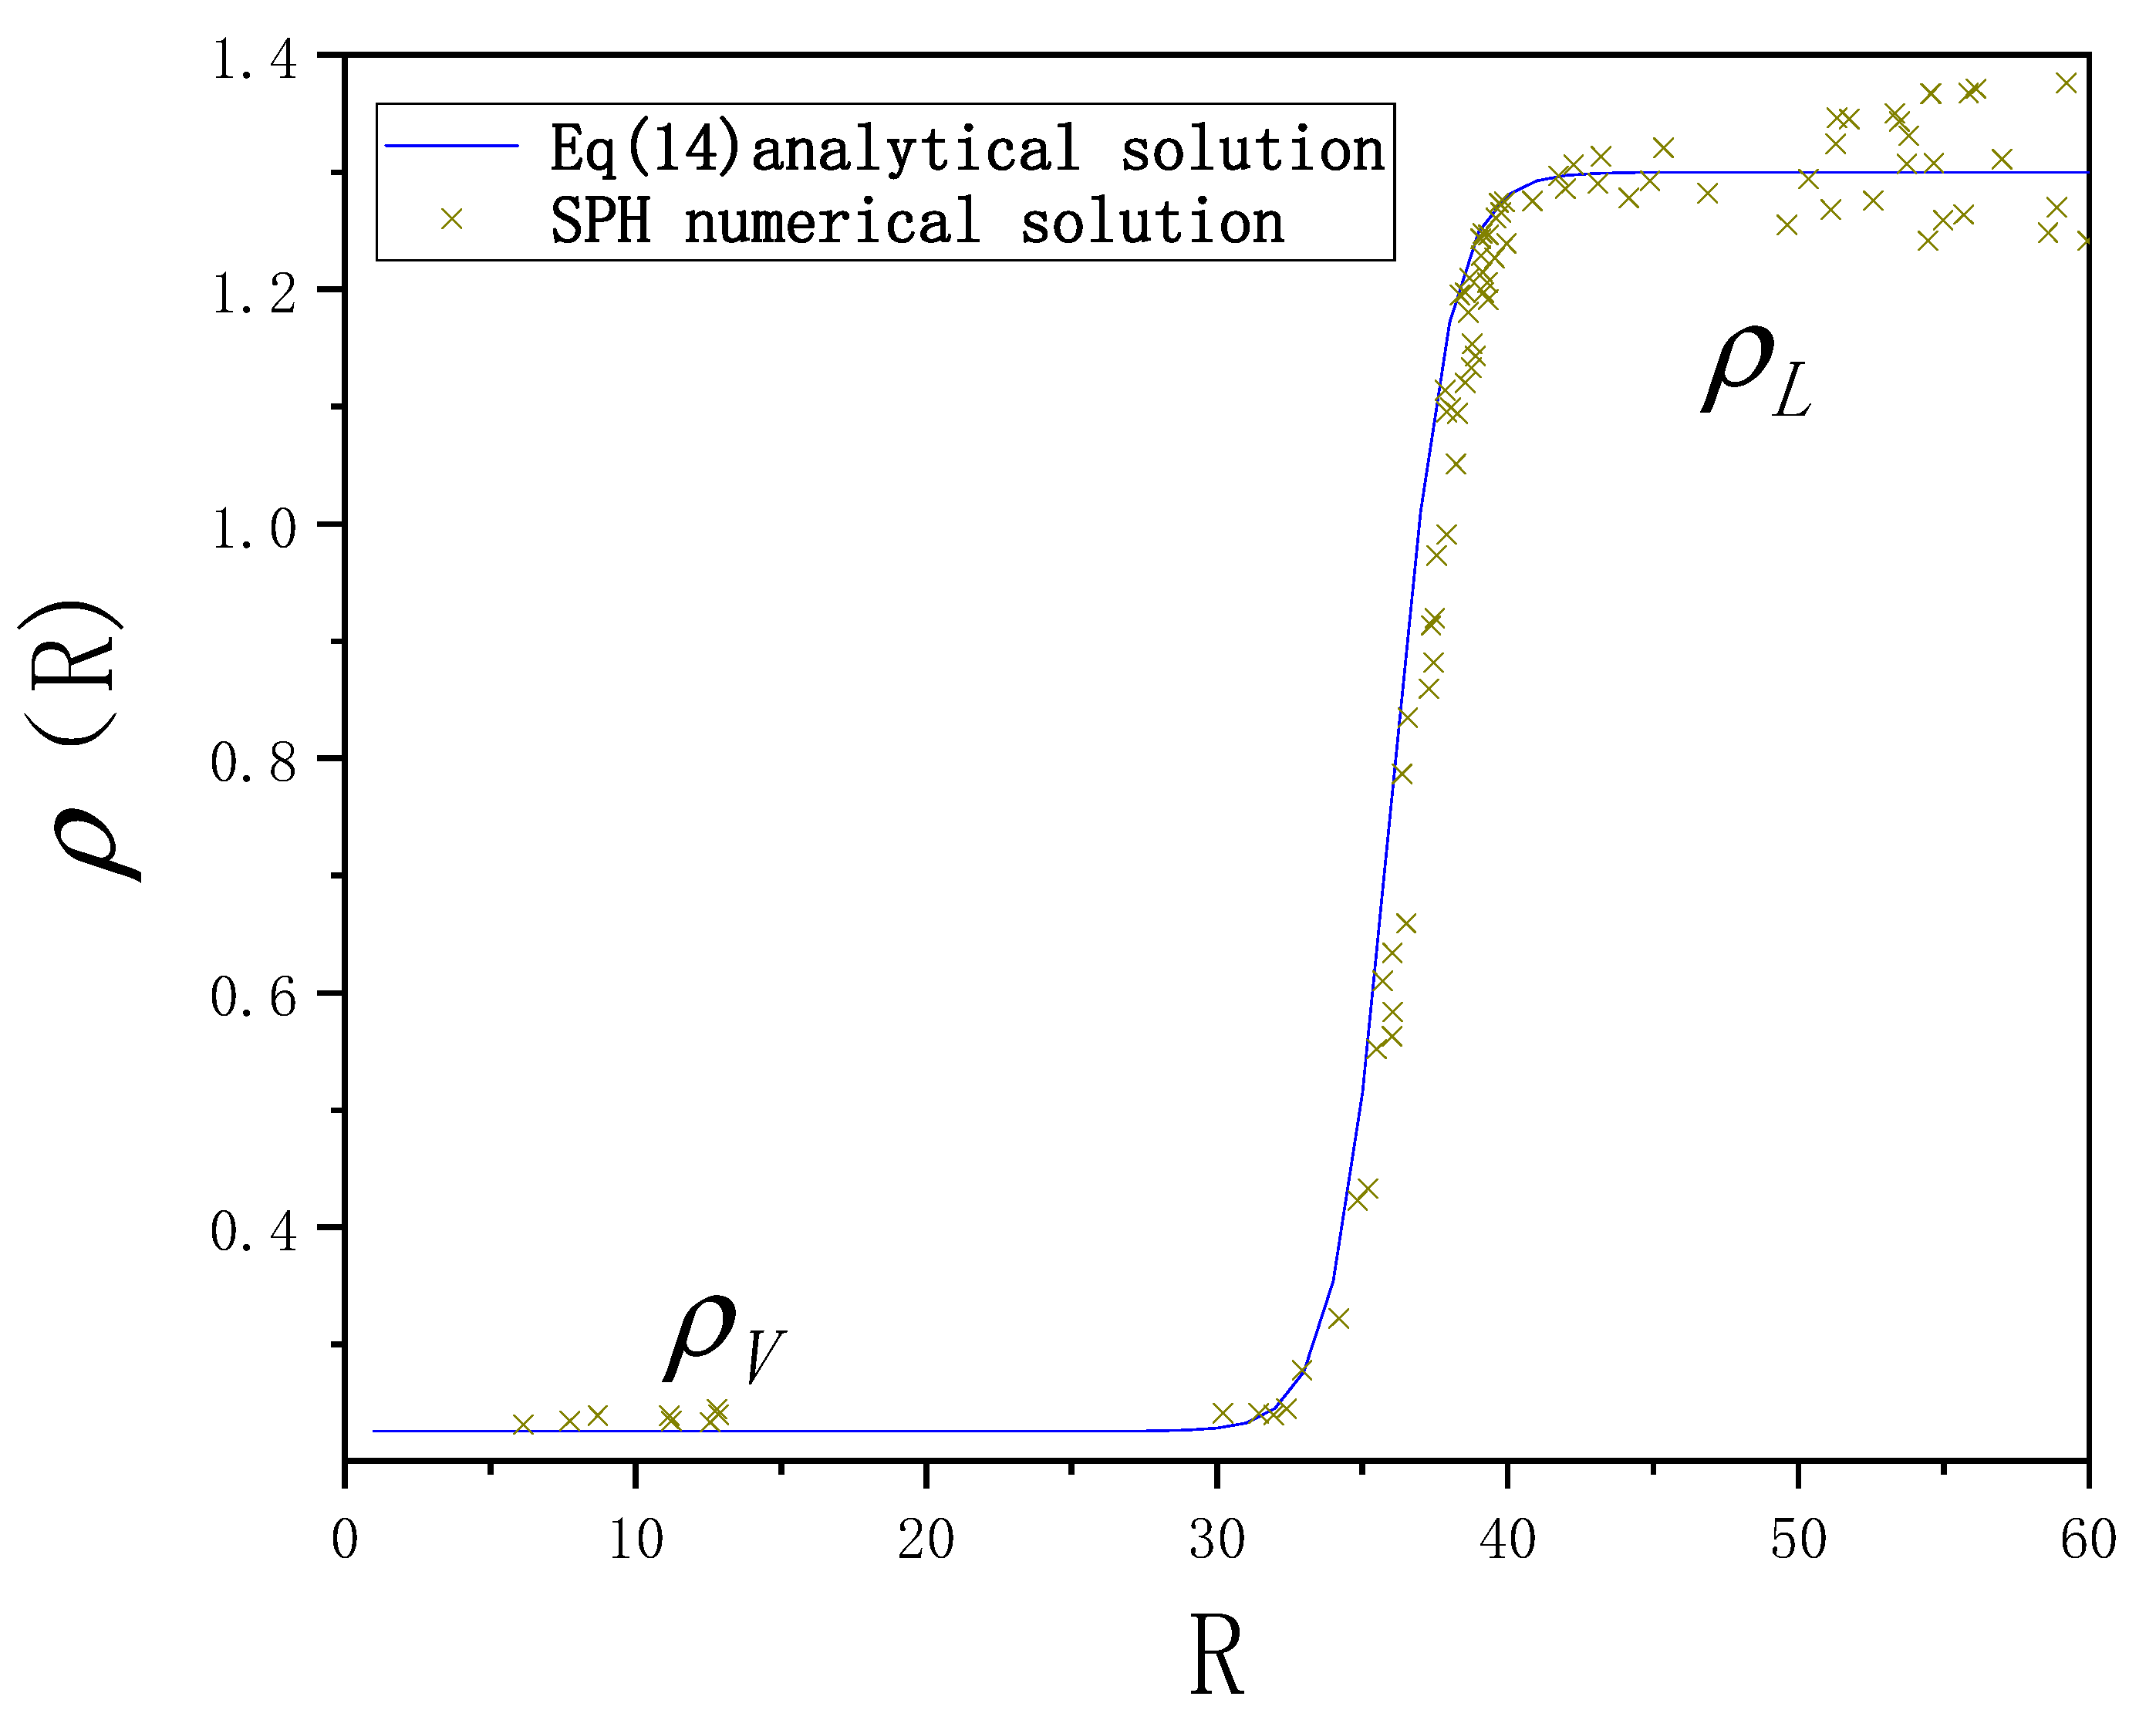
3. Validation
4. Result
4.1. Set-Up
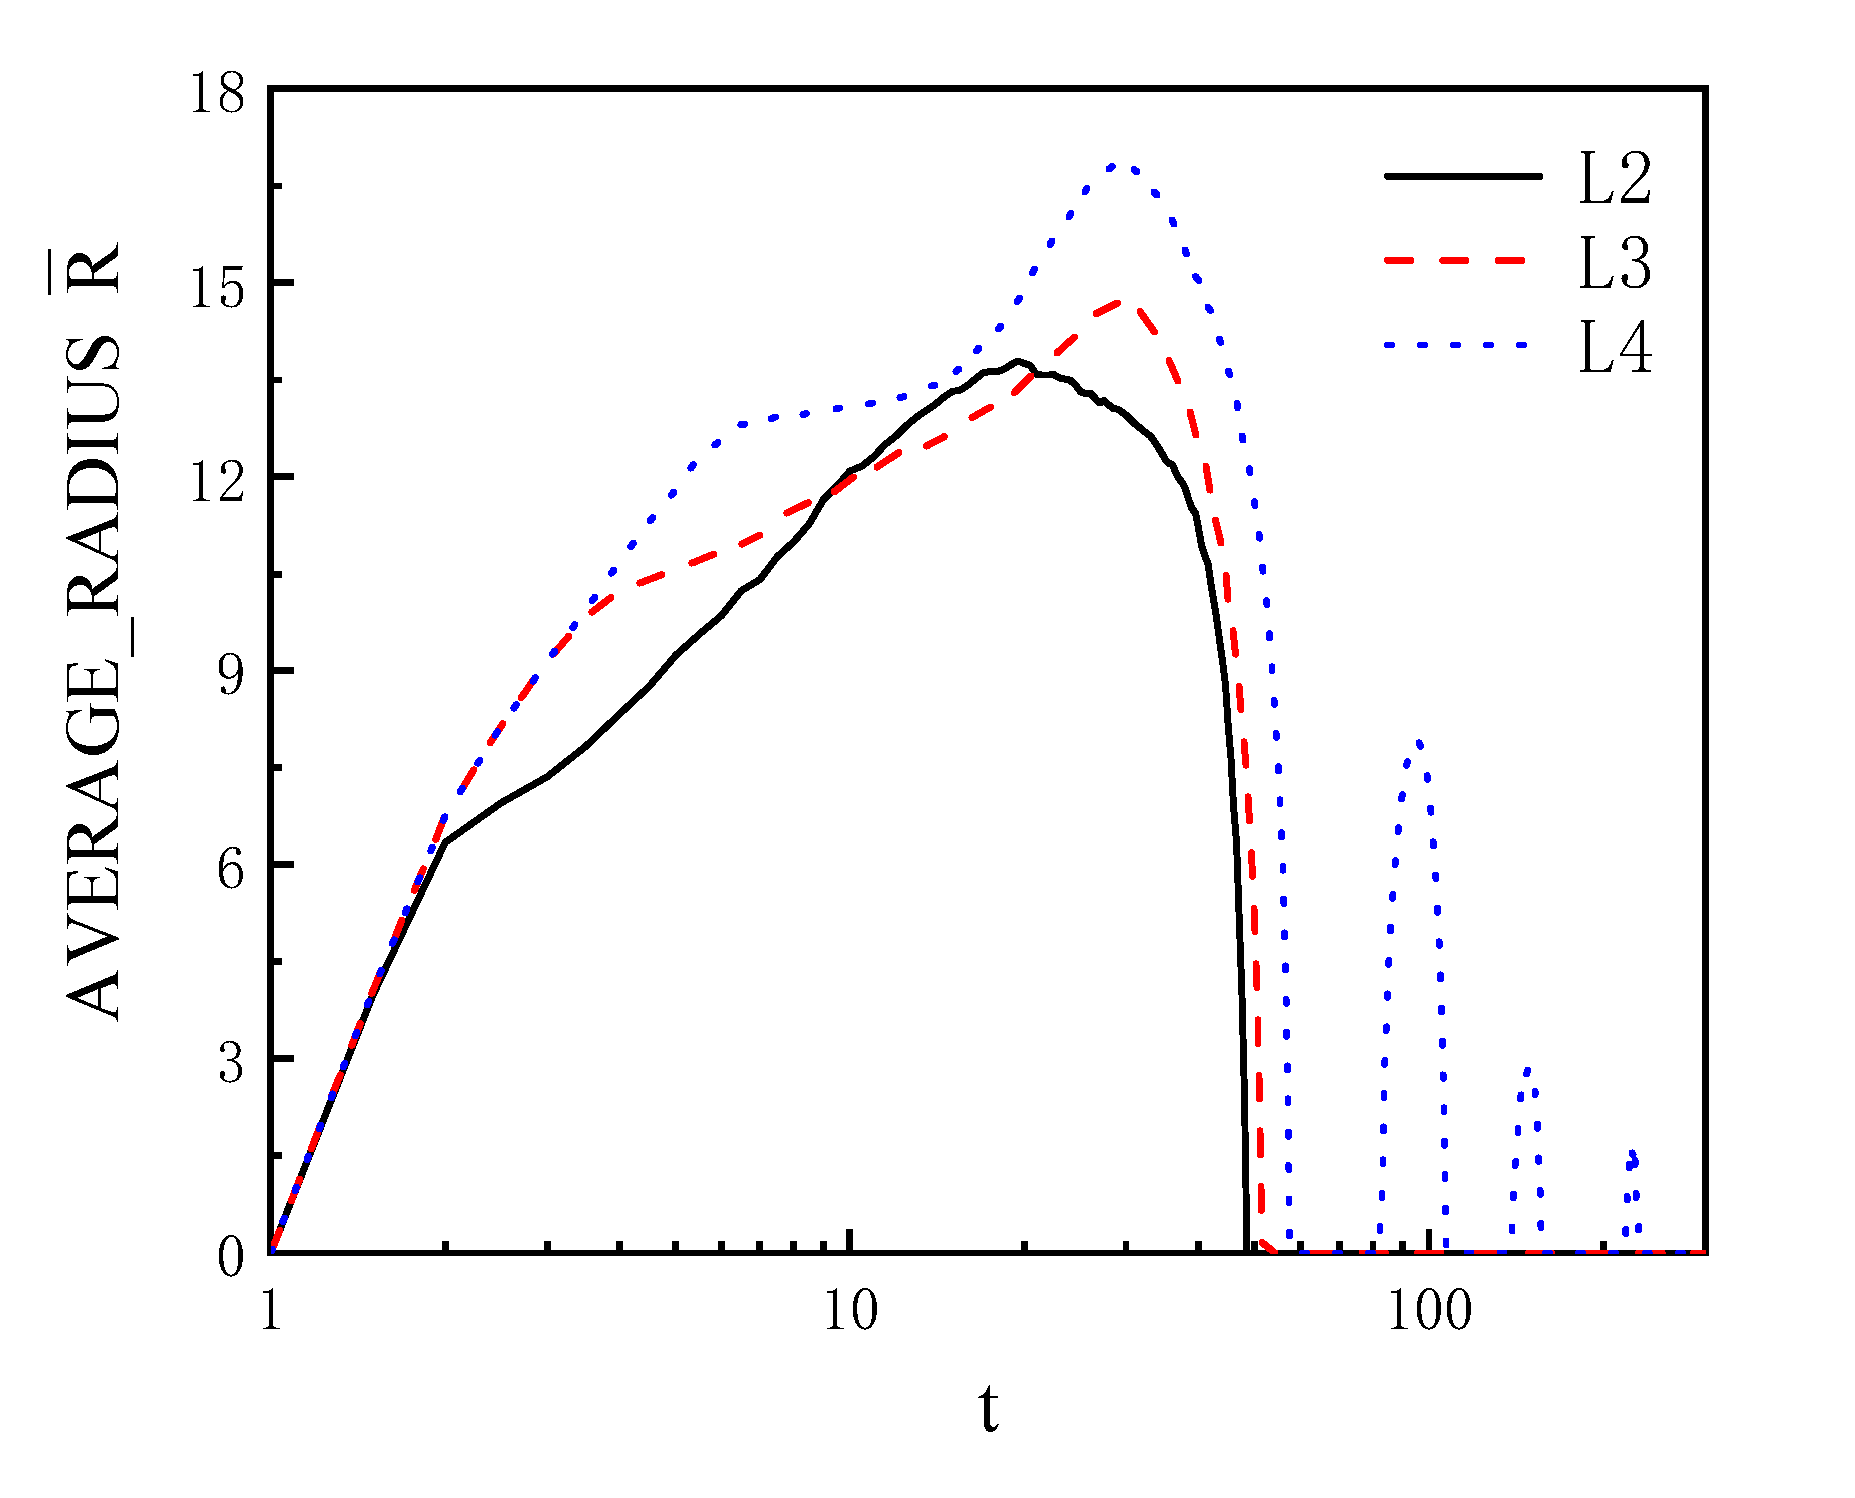
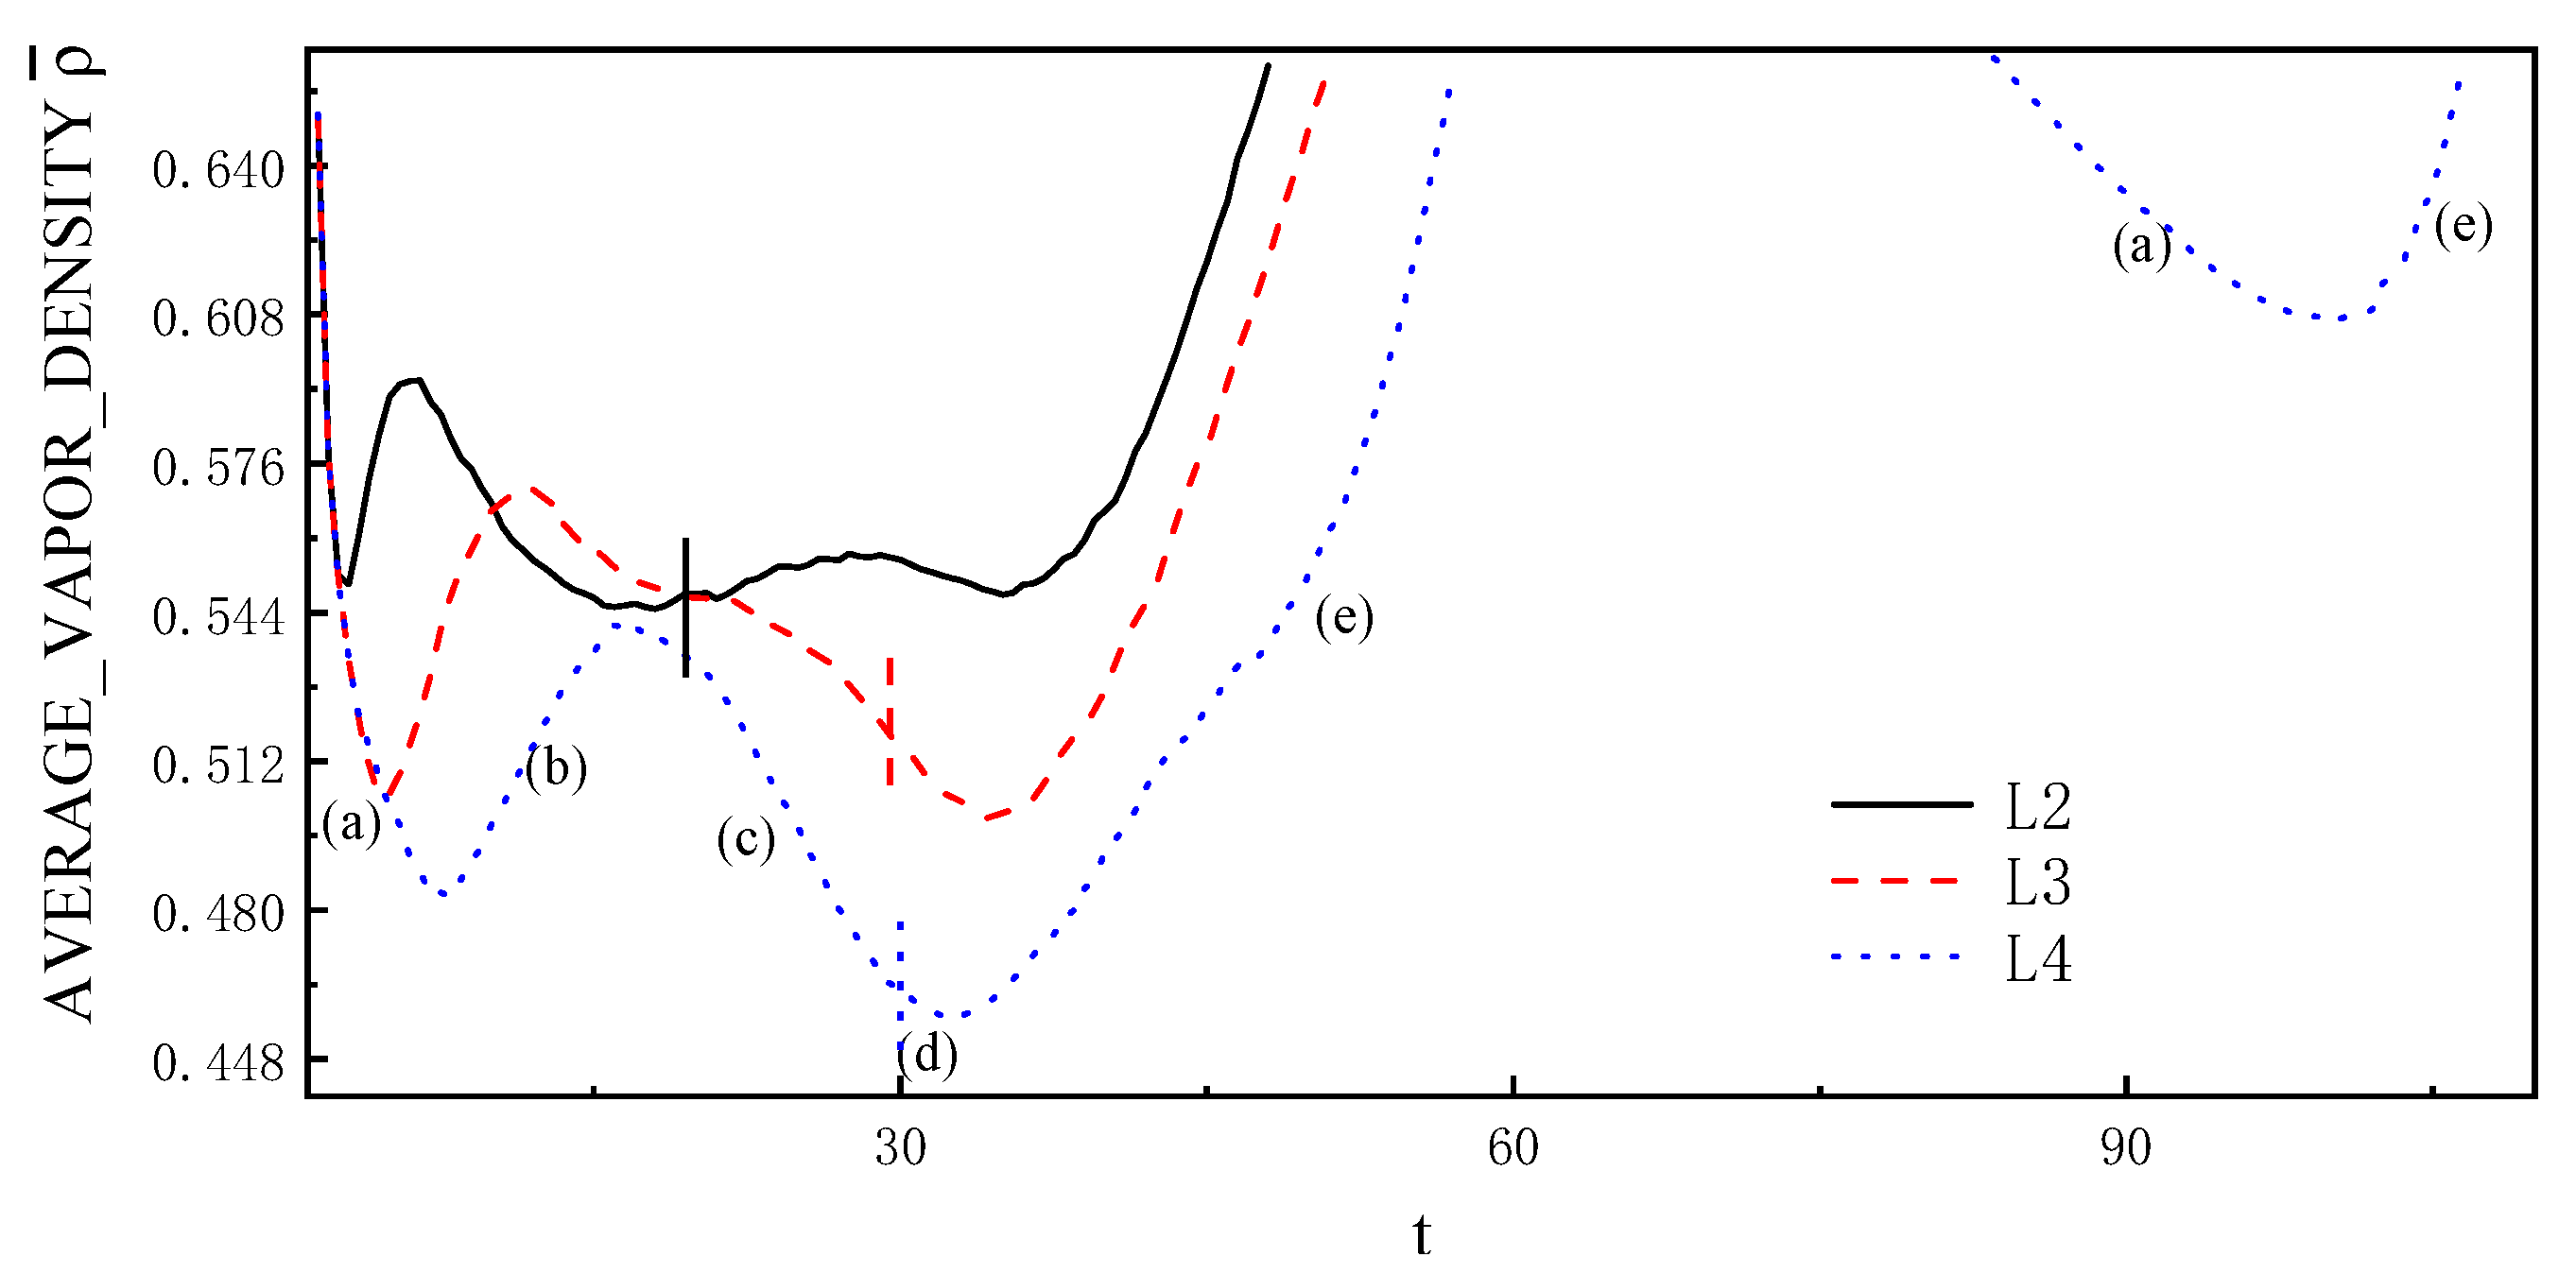
4.2. Bubble near the Wall
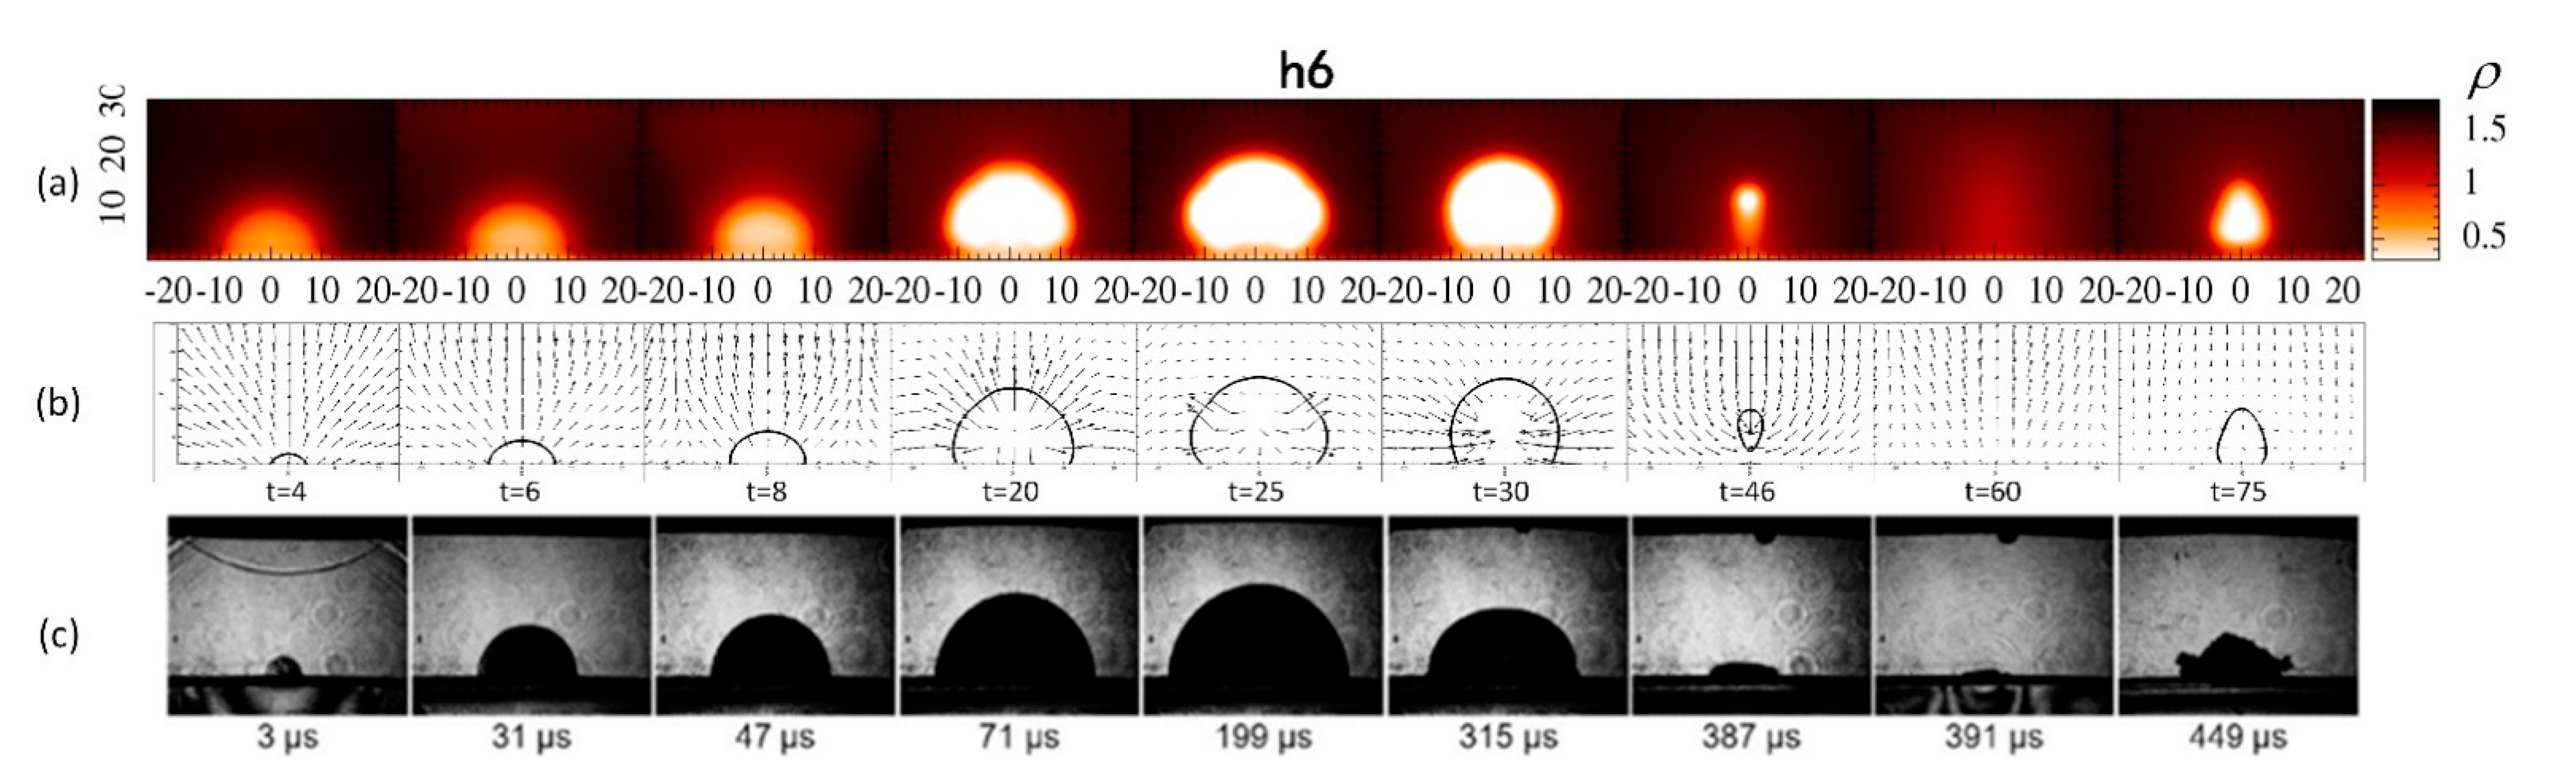
4.3. Bubble at the Wall
5. Conclusions
Author Contributions
Funding
Data Availability Statement
Conflicts of Interest
References
- Alheshibri, M.; Qian, J.; Jehannin, M.; Craig, V.S.J. A History of Nanobubbles. Langmuir 2016, 32, 11086–11100. [Google Scholar] [CrossRef] [PubMed]
- Lin, L.; Peng, X.; Mao, Z.; Li, W.; Yogeesh, M.N.; Rajeeva, B.B.; Perillo, E.P.; Dunn, A.K.; Akinwande, D.; Zheng, Y. Bubble-Pen Lithography. Nano Lett. 2016, 16, 701–708. [Google Scholar] [CrossRef]
- Kharangate, C.R.; Mudawar, I. Review of computational studies on boiling and condensation. Int. J. Heat Mass Transf. 2017, 108, 1164–1196. [Google Scholar] [CrossRef]
- Jo, H.J.; Kim, S.H.; Park, H.S.; Kim, M.H. Critical heat flux and nucleate boiling on several heterogeneous wetting surfaces: Controlled hydrophobic patterns on a hydrophilic substrate. Int. J. Multiph. Flow 2014, 62, 101–109. [Google Scholar] [CrossRef]
- Ekaterina Y, L.; Dmitri O, L. Nanotechnology-Based Platforms. Cancer Nanotechnol. 2016, 1530, 165–192. [Google Scholar]
- Shao, J.; Xuan, M.; Dai, L.; Si, T.; Li, J.; He, Q. Near-infrared-activated nanocalorifiers in microcapsules: Vapor bubble generation for in vivo enhanced cancer therapy. Angew. Chem. Int. Ed. 2015, 54, 12782–12787. [Google Scholar] [CrossRef] [PubMed]
- Teirlinck, E.; Fraire, J.; Van Acker, H.; Wille, J.; Swimberghe, R.; Brans, T.; Xiong, R.; Meire, M.; De Moor, R.; De Smedt, S.; et al. Laser-induced vapor nanobubbles improve diffusion in biofilms of antimicrobial agents for wound care. Biofilm 2019, 1, 100004. [Google Scholar] [CrossRef]
- Feng, Z.C.; Leal, L.G. Nonlinear Bubble Dynamics. Annu. Rev. Fluid Mech. 1997, 29, 201–243. [Google Scholar] [CrossRef]
- Rekhviashvili, S.S. Single-bubble sonoluminescence model. Tech. Phys. Lett. 2008, 34, 1072–1074. [Google Scholar] [CrossRef]
- Prosperetti, A. Vapor Bubbles. Annu. Rev. Fluid Mech. 2017, 49, 221–248. [Google Scholar] [CrossRef]
- Robinson, P.B.; Blake, J.R.; Kodama, T.; Shima, A.; Tomita, Y. Interaction of cavitation bubbles with a free surface. J. Appl. Phys. 2001, 89, 8225–8237. [Google Scholar] [CrossRef]
- Zhang, Y.; Qiu, X.; Zhang, X.; Tang, N. Collapsing dynamics of a laser-induced cavitation bubble near the edge of a rigid wall. Ultrason. Sonochem. 2020, 67, 105157. [Google Scholar] [CrossRef] [PubMed]
- Gonzalez-Avila, S.R.; Klaseboer, E.; Khoo, B.C.; Ohl, C.D. Cavitation bubble dynamics in a liquid gap of variable height. J. Fluid Mech. 2011, 682, 241–260. [Google Scholar] [CrossRef]
- Sun, C.; Can, E.; Dijkink, R.; Lohse, D.; Prosperetti, A. Growth and collapse of a vapour bubble in a microtube: The role of thermal effects. J. Fluid Mech. 2009, 632, 5–16. [Google Scholar] [CrossRef]
- Edel, Z.J.; Mukherjee, A. Experimental investigation of vapor bubble growth during flow boiling in a microchannel. Int. J. Multiph. Flow 2011, 37, 1257–1265. [Google Scholar] [CrossRef]
- Kangude, P.; Srivastava, A. Understanding the growth mechanism of single vapor bubble on a hydrophobic surface: Experiments under nucleate pool boiling regime. Int. J. Heat Mass Transf. 2020, 154, 119775. [Google Scholar] [CrossRef]
- Lee, H.S.; Merte, H. Spherical vapor bubble growth in uniformly superheated liquids. Int. J. Heat Mass Transf. 1996, 39, 2427–2447. [Google Scholar] [CrossRef]
- Rayleigh, L., VIII. On the pressure developed in a liquid during the collapse of a spherical cavity. London, Edinburgh, Dublin Philos. Mag. J. Sci. 1917, 34, 94–98. [Google Scholar] [CrossRef]
- Plesset, M.S.; Zwick, S.A. A nonsteady heat diffusion problem with spherical symmetry. J. Appl. Phys. 1952, 23, 95–98. [Google Scholar] [CrossRef] [Green Version]
- Ivashnyov, O.E.; Smirnov, N.N. Thermal growth of a vapor bubble moving in superheated liquid. Phys. Fluids 2004, 16, 809–823. [Google Scholar] [CrossRef]
- Hao, L. Analysis of bubble growth and motion dynamics in superheated liquid during flash evaporation. Int. J. Heat Mass Transf. 2020, 151, 119356. [Google Scholar] [CrossRef]
- Pavlov, P.A. Fast collapse of a vapor bubble. Int. J. Heat Mass Transf. 2017, 104, 627–633. [Google Scholar] [CrossRef]
- Qin, Z.; Alehossein, H. Heat transfer during cavitation bubble collapse. Appl. Therm. Eng. 2016, 105, 1067–1075. [Google Scholar] [CrossRef]
- Zhang, J.; Zhang, L.; Deng, J. Numerical study of the collapse of multiple bubbles and the energy conversion during bubble collapse. Water 2019, 11, 247. [Google Scholar] [CrossRef] [Green Version]
- Wang, Q.; Yao, W.; Quan, X.; Cheng, P. Validation of a dynamic model for vapor bubble growth and collapse under microgravity conditions. Int. Commun. Heat Mass Transf. 2018, 95, 63–73. [Google Scholar] [CrossRef]
- Chen, G.Q.; Huang, X.; Zhang, A.M.; Wang, S.P. Simulation of three-dimensional bubble formation and interaction using the high-density-ratio lattice Boltzmann method. Phys. Fluids 2019, 31, 027102. [Google Scholar]
- Yang, Y.; Shan, M.; Kan, X.; Shangguan, Y.; Han, Q. Thermodynamic of collapsing cavitation bubble investigated by pseudopotential and thermal MRT-LBM. Ultrason. Sonochem. 2020, 62, 104873. [Google Scholar] [CrossRef]
- Wang, Y.; Cai, J. Numerical investigation on bubble evolution during nucleate boiling using diffuse interface method. Int. J. Heat Mass Transf. 2017, 112, 28–38. [Google Scholar] [CrossRef]
- Gallo, M.; Magaletti, F.; Cocco, D.; Casciola, C.M. Nucleation and growth dynamics of vapor bubbles. J. Fluid Mech. 2020, 883, 883. [Google Scholar] [CrossRef]
- Felderhof, B.U. Dynamics of the diffuse gas-liquid interface near the critical point. Physica 1970, 48, 541–560. [Google Scholar] [CrossRef]
- Greiner, W.; Neise, L.; Horst, S. Thermodynamics and Statistical Mechanics; D. Rischke: New York, NY, USA, 1995; pp. 107–110. [Google Scholar]
- Yang, X.; Liu, M.; Peng, S. Smoothed particle hydrodynamics modeling of viscous liquid drop without tensile instability. Comput. Fluids 2014, 92, 199–208. [Google Scholar] [CrossRef] [Green Version]
- Xiong, H.; Zhang, C.; Yu, Z. Multiphase SPH modeling of water boiling on hydrophilic and hydrophobic surfaces. Int. J. Heat Mass Transf. 2019, 130, 680–692. [Google Scholar] [CrossRef]
- Maheshwari, S.; Van Der Hoef, M.; Prosperetti, A.; Lohse, D. Dynamics of Formation of a Vapor Nanobubble around a Heated Nanoparticle. J. Phys. Chem. C 2018, 122, 20571–20580. [Google Scholar] [CrossRef] [PubMed] [Green Version]
- Nguyen, T.T.P.; Tanabe-Yamagishi, R.; Ito, Y. Effects of liquid depth on the expansion and collapse of a hemispherical cavitation bubble induced in nanosecond pulsed laser ablation of a solid in liquid. Opt. Lasers Eng. 2020, 126, 105937. [Google Scholar] [CrossRef]


| Type | CASE ID | h/dx | L/dx | γ = L/Rx | η = h/Rx | η-γ | Nsecb |
|---|---|---|---|---|---|---|---|
| Near the wall | L2 | 100 | 20 | 1.0027 | 5.0128 | 4.0101 | 0 |
| L3 | 100 | 30 | 1.3466 | 4.4887 | 3.1421 | 0 | |
| L4 | 100 | 40 | 1.0288 | 2.5721 | 1.5433 | 3 | |
| At the wall | h10 | 100 | 0 | 0 | 5.7777 | 5.7777 | 0 |
| h8 | 80 | 0 | 0 | 4.5021 | 4.5021 | 0 | |
| h7 | 70 | 0 | 0 | 2.5743 | 2.5743 | 1 | |
| h6 | 60 | 0 | 0 | 1.8387 | 1.8387 | 1 | |
| h4 | 40 | 0 | 0 | 0.8228 | 0.8228 | NA | |
| h2 | 20 | 0 | 0 | <0.5 | <0.5 | NA |
Publisher’s Note: MDPI stays neutral with regard to jurisdictional claims in published maps and institutional affiliations. |
© 2020 by the authors. Licensee MDPI, Basel, Switzerland. This article is an open access article distributed under the terms and conditions of the Creative Commons Attribution (CC BY) license (http://creativecommons.org/licenses/by/4.0/).
Share and Cite
Wang, H.; Zhang, C.; Xiong, H. Growth and Collapse Dynamics of a Vapor Bubble near or at a Wall. Water 2021, 13, 12. https://doi.org/10.3390/w13010012
Wang H, Zhang C, Xiong H. Growth and Collapse Dynamics of a Vapor Bubble near or at a Wall. Water. 2021; 13(1):12. https://doi.org/10.3390/w13010012
Chicago/Turabian StyleWang, Huigang, Chengyu Zhang, and Hongbing Xiong. 2021. "Growth and Collapse Dynamics of a Vapor Bubble near or at a Wall" Water 13, no. 1: 12. https://doi.org/10.3390/w13010012