Abstract
Stormwater management is a key issue in line with global problems of urbanization and climate change. Assessing the effectiveness in managing stormwater is crucial to maintain urban resilience to flooding risk. A method based on a stormwater management model (SWMM) was developed for assessing the control of stormwater runoff volume and the percentage removal of suspended solids by implementing a Sponge City strategy. An interdisciplinary approach was adopted incorporating Low Impact Development (LID) with urban green infrastructure and grey infrastructure paradigms in a typical old residential community in Suzhou, China. Sponge facilities for reducing stormwater runoff included bio-retention cells, permeable pavements, grassed pitches, and stormwater gardens. The simulation results of SWMM show that the stormwater pipe system can meet the management standard for storms with a five-year recurrence interval. The volume capture ratio of annual runoff was 91%, which is higher than control target of 80%. The suspended solids reduction rate was 56%, which meets the requirement of planning indicators. Thus, the proposed method of spongy facilities can be used for renovation planning in old residential areas in China. Implementing spongy facilities with a LID strategy for stormwater management can significantly enhance urban water resilience and improve ecosystem services.
1. Introduction
Intensified global urbanization in the past 100 years with increased climate change has significantly increased urban stormwater runoff volume with uncertainties [1] and brought with it numerous problems of water pollution and flood disasters [2] to cause a dramatic change to urban living [3]. Between 1978 and 2017, China’s urban population grew by 58.5%. Additionally, since 1981, the country’s built-up urban areas have increased by 29.5 times, and the average urban road area per person has increased by 9.2 times (Figure 1). Such rapid urbanization [4], together with the effects of climate change, has caused serious environmental problems, since impervious surfaces convert precipitation to stormwater runoff and thus cause various problems related to water quantity and quality [5] such as urban waterlogging, water shortage, water pollution, ecosystem shrinking of lakes and rivers, and ecological deterioration of aquatic habitats [6,7]. In response, the “Sponge City Program” relating to best management practices was proposed in 2013 for sustainable development in urban areas, which have sound “flexibility” integrating green and grey infrastructures to adapt to environmental changes and natural disasters. Sponge City development can manage urban surface runoff by absorbing, storing, seeping, and purifying stormwater runoff, to combine ecological facilities and green-space patches with traditional grey infrastructure for urban runoff control [8]. Such stormwater management can not only solve the problems of waterlogging and water pollution, but also improve the water utilization efficiency to enhance ecosystem services in urban areas [9,10].
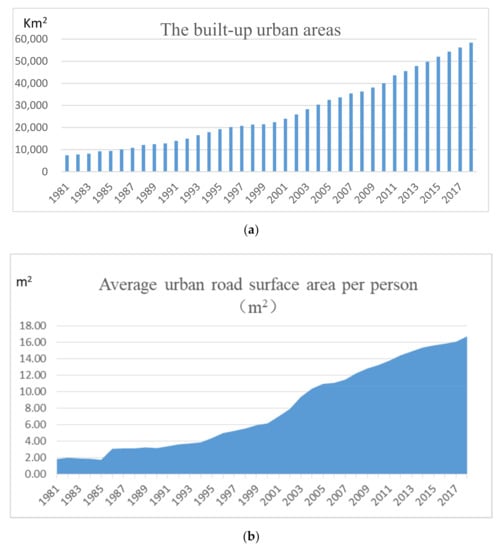
Figure 1.
Changes in (a) the built-up urban areas from 1981 to 2018 in China and (b) the average urban road surface area per person (1981–2018).
Residential areas often account for 40–50% of the urban development land area, with the roads and drainage facilities associated [11]. A low-cost management approach is needed for residential areas because high-density residential buildings, high impervious surface area rate, inelasticity for land use, and the high cost of stormwater management all depend on grey pipelines [12]. Low Impact Development (LID) provides a cost-effective and resilient approach of integrating land development with mimic natural processes, by focusing on balances of sustainable water quality and pollutant load derived from developed areas [13,14]. LID facilities with small land occupation and low-cost maintenance with enhanced water quality of aquatic habitat are most suitable for urban residential areas. Additionally, residential areas have a large number of individual buildings and abundant green spaces, for which LID facilities can be used to improve the status of stormwater management and enhance the multiple ecological effects of the landscape, such as flooding mitigation and pollution reduction [15,16]. As the residential area can be an important practice object for Sponge City renovation, it will promote to build the whole city as a “big sponge” through the construction of green stormwater infrastructures in many residential areas called “small sponge”. Such a stormwater management strategy can enhance urban ecosystem services to provide nature benefits to human society, by improving capacities of flood risk reduction and the control of surface runoff pollution in both residential areas and whole cities [17].
To effectively control stormwater runoff, reduce stormwater pollution, and restore ecosystem function and biodiversity, the sponge renovation and ecological restoration of old residential areas have become a task of urban water management [18]. However, the renovation of exiting older residential areas is a complex task, especially for many old towns, as the original plan may not be found or the low willingness of the residents for such changes [18]. This complexity has been further exacerbated by the involvements of many government agencies, such as water conservancy bureaus, housing and construction bureaus, and municipal engineering departments [19]. Therefore, a comprehensive solution is required that integrates professional knowledge of landscape architecture, urban planning, land use, road and traffic planning, ecology, and hydrology. Even though Sponge City construction is similar to LID in that it is an innovative method with characteristics of a comprehensive engineering system for urban runoff control [13], there are only limited studies in the selection of Sponge City facilities in China and the assessment of spongy facilities that have been implemented in actual design plans.
Understanding the effectiveness of innovative technical measures for runoff management under local habitat conditions remains a knowledge gap. The objective of this study is to examine the effect of Sponge City LID technology on stormwater runoff control, pollution reduction, and environmental improvement in the old town of Wujiang District in Suzhou City. As the Sponge City technology using the LID concept can improve the water management of the residential area, this study assesses the effectiveness of a planning scheme involving sponge facilities. Such assessment will help to design a livable urban community by controlling total annual runoff quantity, reducing flood risks, and maintaining good water quality to enhance habitat quality in urban areas.
2. Materials and Methods
2.1. Study Site
Suzhou, in Jiangsu Province, eastern China, is an economically important and highly developed city, which has the highest level of industrialization and urbanization in China. Many areas in Suzhou are covered by dense river–lake–wetland networks. However, rapid urban development in Suzhou has caused many serious problems in urban water systems, such as the encroachment of river corridors and the truncation of rivers. Moreover, many rivers have become polluted with significant input of nonpoint source pollution [19,20] especially during storm events. These problems have reduced river self-purification capacity and caused ecosystem degradation in Suzhou [21].
For enhancing water pollution control, a renovation project with improving stormwater management was proposed for the Shuixianghuayuan old residential area in Songling Town, Wujiang District, Suzhou (31°08′59.6″ N, 120°38′16.7″ E). The location and land use map of the Shuixianghuayuan old residential area is shown in Figure 2. The total area of Shuixianghuayuan is 5.57 hectares, with a green-space area of 2.47 hectares, a building footprint of 1.54 hectares, a total road and paved area of 1.41 hectares, and a landscape pool and discharge ditch of 0.15 hectares (data from Wujiang Construction Bureau, 2017). Additionally, there is some additional space for placing spongy facilities, since the elevation of roads in the site is about 1.80–2.10 m, and the longitudinal slope of the site is about 1–2‰.
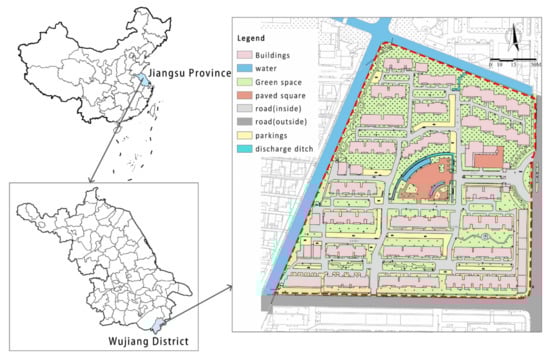
Figure 2.
Location and land use map of the Shuixianghuayuan old residential area in the Songling Town, Wujiang District of Suzhou, China (31°08′59.6″ N, 120°38′16.7″ E), the Shuixianghuayuan old residential area in Wujiang District, Suzhou.
An investigation of the site revealed that both of the building density and residential population density were high. The surface impervious area rate was high, which resulted in a large integrated runoff coefficient of stormwater. In terms of underground conditions, the residential area has a combined drainage and sewer system, which means that the drainage of stormwater and sewage within the same pipe would result in the poor reuse of stormwater resources and cause serious pollution due to sewage overflow. A comprehensive assessment of the site showed that, under traditional development, the volume capture ratio of annual rainfall is 44.69%, which does not meet the requirement of Sponge City construction [22].
2.2. Study Roadmap
The purpose of the old residential renovation project was to build a Sponge City pilot, which can improve the living environment and ensure water safety with stormwater runoff and maintain high water quality. Therefore, all parts of the planning scheme are based on how to collect the stormwater runoff using sponge facilities before it discharges to nearby rivers or lakes, and on how to provide the system with the ability to maintain water quality. The flowchart in Figure 3 outlines the main phases of the stormwater management based on LID in the Shuixianghuayuan old residential area, as explained below:
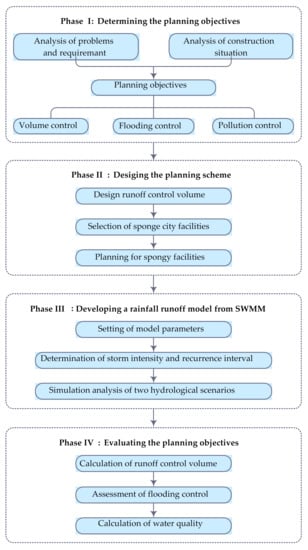
Figure 3.
Flowchart of the stormwater management based on Low Impact Development (LID) in an old residential area.
- (1)
- Phase I: Determining the planning objectives. Based on the analysis of the study area and considering the knotty problems, developmental requirements, and construction situation, the planning objectives for a Sponge City are determined, including runoff volume control, flooding control, and pollution control.
- (2)
- Phase II: Designing the planning scheme. The design runoff control volume is calculated from the Technical Guidelines for Sponge City Construction (hereafter, Guidelines) [23]. The study area is then divided into several catchment zones, and suitable sponge facilities are selected based on the zones’ regional characteristics, such as bio-retention cells and grassed pitches [24]. Finally, a general engineering planning scheme is established for spongy facilities.
- (3)
- Phase III: Developing a rainfall–runoff model using a stormwater management model (SWMM). A rainfall–runoff SWMM is developed, and values of each parameter are determined as input data for the model, including the area, slope, and length of sub-catchments and drainage systems. Then, the temporal distribution of design storm intensity is established from the synthetic rainfall pattern of Chicago storms with recurrence intervals of 2, 5, 10, and 20 years considered. Finally, two hydrological scenarios are proposed for simulation analysis and comparison, of which Scenario 1 is the traditional drainage system without sponge facilities and Scenario 2 is the drainage system with sponge facilities.
- (4)
- Phase IV: Evaluating the planning objectives. Based on the Guidelines, the effectiveness of spongy facilities for controlling runoff volume and water quality is analyzed. Additionally, the effectiveness of sponge facilities for flood control is evaluated under storm conditions with different recurrence intervals.
2.3. Sponge City Planning
The sponge planning scheme includes three objectives: (1) the volume capture ratio of annual rainfall is over 80%, and the designed rainfall depth is 26.7 mm; (2) the flow control target is to achieve the standard of drainage capacity for a design storm with a 2-year recurrence interval; (3) the green space is provided with ecosystem service functions, which can effectively reduce stormwater runoff pollution and achieve a 55% reduction in non-point source pollution [25]. The weighted average method was used to calculate the comprehensive runoff coefficient of the Shuixianghuayuan old residential area, based on the Guidelines [22]. The runoff coefficient of each underlying surface is as follows: hard roof: 0.85; green space: 0.15; water: 1.00; impervious pavement: 0.85. The comprehensive runoff coefficient of the total area is 0.42. Additionally, based on the volumetric method from the Guidelines, the design runoff control quantity is calculated as 624.14 m3 [26].
The framework design of conceptual sponge facilities for the Shuixianghuayuan old residential area is illustrated in Figure 4. There are many types of sponge facilities, and each type has its own applicable scope, technical points, economical characteristics, and aesthetic values [27]. Based on the local conditions in Wujiang District, which has a high groundwater level [28] and weak soil permeability [29], bio-retention cells were primarily considered, since they are appropriate for harvesting and purifying stormwater from roofs, roads, and gardens. In parking areas, permeable pavements were selected. In the central square area, which is a largely paved area with some green landscaped zones, grassed pitches and stormwater gardens were selected.
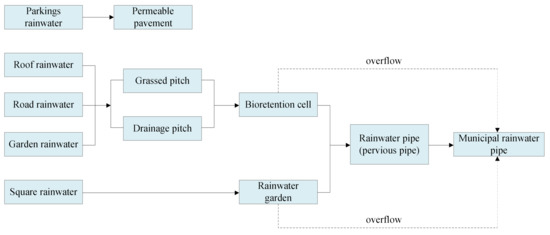
Figure 4.
Conceptual framework of sponge facilities for the Shuixianghuayuan old residential area.
According to the present topographic elevation and design scheme of the rain sewer pipe network, the Shuixianghuayuan old residential area is divided into nine catchment areas (S1–S9). The planning scheme of sponge facilities is illustrated in Figure 5. In this residential area, after the implementation of the planned sponge facilities, stormwater runoff from roofs, impermeable pavements, and roads will be collected and discharged to the municipal pipe network or nearby rivers. The total area of the footprint of sponge installations in Shuixianghuayuan is 9746 m2, accounting for 17% of the entire constructed area, in which the area of bio-retention cells is 1522 m2, the area of permeable pavements is 3534 m2, the area of grassed pitches is 4448 m2, and the area of stormwater gardens is 243 m2.
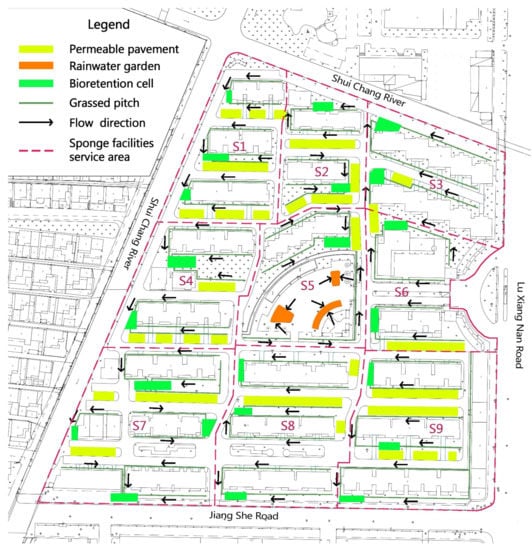
Figure 5.
General sponge planning scheme for the Shuixianghuayuan old residential area.
2.4. Assessment on Sponge Facilities’ Effectiveness
2.4.1. Runoff Simulation Model
The SWMM is a dynamic rainfall–runoff simulation model, which can be used to simulate urban hydrological processes, pipe network hydrodynamic processes, and water quality evolution processes [30,31]. This study used the SWMM software to assess the effectiveness of sponge facilities in the Shuixianghuayuan old residential area.
Figure 6 shows the SWMM network for the Shuixianghuayuan old residential area, where the drainage system includes 68 sub-catchments (S1–S68), 62 nodes (J1–J62), 62 conduits (G1–G62), and three outlets (P1–P3). The input data include the area, width, and percentage imperviousness of the sub-catchment, the length and diameter of the pipe, and the invert elevation and maximum depth of the node. Details of these input data are summarized in Supplementary Materials (Tables S1–S3). Based on the SWMM user manual and some references [32,33,34], the ranges of hydrological parameters for the SWMM model are given in Table 1, including the manning coefficients of the impervious and pervious surfaces, the depression storage of the impervious and pervious areas, and the maximum and minimum infiltration rates of pipes.
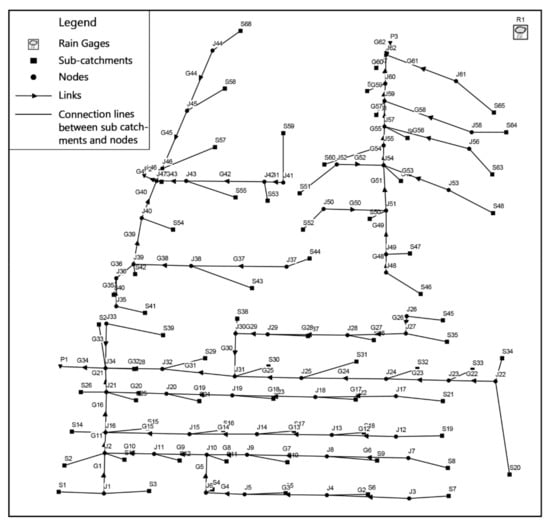
Figure 6.
Generalized map (sub-catchments, nodes, links, etc.) of the Shuixianghuayuan old residential area in SWMM model.

Table 1.
Ranges of hydrologic parameters for the stormwater management model (SWMM).
The annual rainfall data and synthetic storm data for a typical year in Suzhou were also input into SWMM software for rainfall–runoff modelling, and two scenarios were simulated for comparison and analysis. Scenario 1 is a traditional drainage system without sponge facilities, and Scenario 2 is a drainage system with sponge facilities designed according to the above planning scheme. Here, runoff control volume and percentage removal of suspended solids were assessed through the comparison and analysis of simulations for the selected sponge facilities.
2.4.2. Assessment of the Flood Control Ability of Spongy Facilities via Synthetic Design Rainfall
The SWMM model can be used to simulate annual time series of rainfall or a singular rainfall event [30,31]. For this study, the simulation results for a singular rainfall event were used to assess the short-term runoff characteristics, while the modelling of a 2-h design rainstorm event with a 5-min time step was used to assess the effectiveness of sponge facilities for flood control.
Based on the short-duration rainfall models recommended in the Technical Guidelines for the Establishment of Intensity-Duration-Frequency Curves and Design Rainstorm Profiles [23], the Chicago storms [35] were chosen for a synthetic rainfall model, and the local storm intensity formula was used to generate design rainstorm events in Suzhou City.
The design rainfall intensity formula for Suzhou is as follows [36]:
The formula for transforming into Chicago storm intensity is as follows:
where q is the design rainfall intensity in L/(s∙hm2), P is the design rainfall recurrence interval in years, t is the design rainfall time in min, i is the rainfall intensity in mm/min, and a, b, and c are rainfall parameters for Suzhou.
The formulas of rainfall intensity before and after the time for peak rainfall are as follows:
and
where i(ta) and i(tb) are the instantaneous rainfall intensity in mm/min; ta and tb are the times before and after the peak time in min, respectively; r is the peak time during 0–1 range, which represents the peak occurrence at the beginning (0) and the end (1) of the storm, respectively. In this study, 0.4 was chosen as the value of r [37], and a, b, and c were obtained from Equation (2). From Equations (1)–(4), 2-h synthetic storms with recurrence intervals of 2, 5, 10, and 20 years were determined, as summarized in Figure 7.
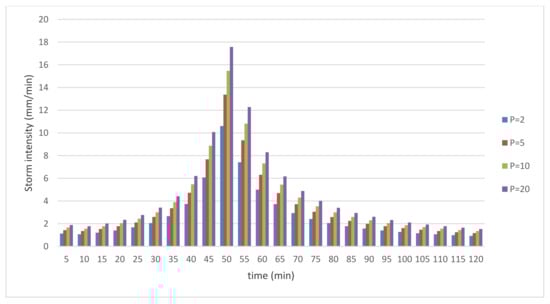
Figure 7.
Two-hour synthetic rainfall events with 2-, 5-, 10-, and 20-year recurrence intervals (P) for Suzhou.
3. Results
3.1. Runoff Control Volume
The total runoff control volume of sponge facilities in each catchment area can meet the demand of runoff control volume in the corresponding area (Table 2). As shown in the table, the simulation results show that the total annual runoff control volume of the Shuixianghuayuan old residential area is 970.75 m3, which is equivalent to 41.52 mm of the designed rainfall depth and corresponds to 91% of the volume capture ratio of annual runoff. This shows that the implementation of sponge facilities can meet the planning control target of 80% in volume.
Table 2.
Calculated runoff control volumes in each catchment area.
3.2. Assessment of Flooding Control
Under Scenario 1 (the traditional drainage system without sponge facilities), the 5-min maximum floodwater volumes from each link and node are much higher than that under Scenario 2 (the drainage system with sponge facilities) in Figure 8, where different colors represent the 5-min maximum floodwater volumes from each link and node, respectively. As shown in Figure 8a, the floodwater volumes from links G3, G5, G9, G12, G14, G19, G20, G22, G24, G25, G28, G29, G31, G32, G34, G46, and G60 are lower under Scenario 2 than under Scenario 1. Figure 9a shows that the floodwater volumes from all nodes except the outlet are lower than 0.3 m, which indicates that the scheme also meets the flood control standard for a storm with a 5-year recurrence interval. Furthermore, the simulation results in Figure 9c show that the local flooding situations would not be serious even if a 20-year recurrence-interval storm occurred.
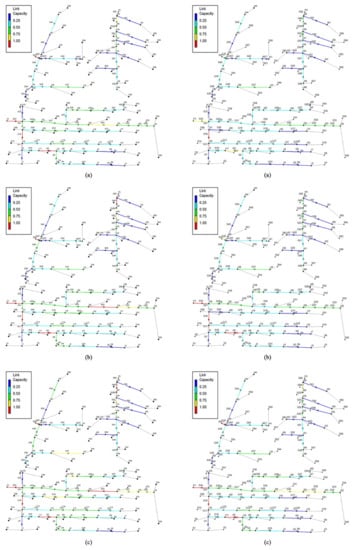
Figure 8.
Flood simulation of each link for Scenario 1 (left) and 2 (right) under storm conditions with 5-, 10-, and 20-year recurrence intervals: (a) 5-year; (b) 10-year; (c) 20-year. Different colors represent different capacities for floodwater from each link. Red lines indicate the high capacity for floodwater volumes and blue lines indicate the low capacity of for floodwater volumes.
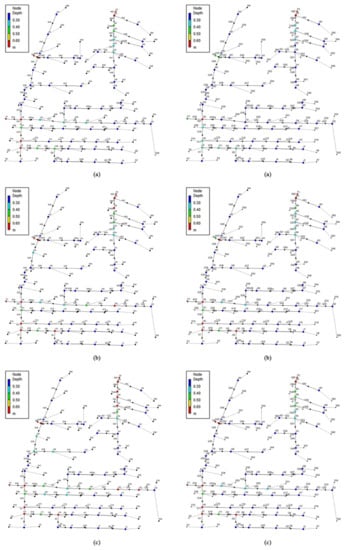
Figure 9.
Flood simulation of each node for Scenario 1 (left) and 2 (right) under storm conditions with 5-, 10-, and 20-year recurrence intervals: (a) 5-year; (b) 10-year; (c) 20-year. Different colors represent different capacities for floodwater from each node, respectively. Red nodes indicate the high capacity of floodwaters, and blue the low capacity.
Their time series were calculated based on the standing water depth of 0.15 m and flooding criteria. Figure 10 shows the variations of floodwater volumes under the two scenarios for a storm with a 20-year recurrence interval. The results reveal that Scenario 2 has much lower flooding risks than Scenario 1. Additionally, taking the site with the lowest elevation as an example, Figure 11 shows that, in Scenario 2, the duration of standing water depths exceeding 0.15 m is 7.5 min, whereas it is 17.5 min in Scenario 1, which clearly demonstrates that the sponge facilities have a better flood control ability in Scenario 2 than in Scenario 1.
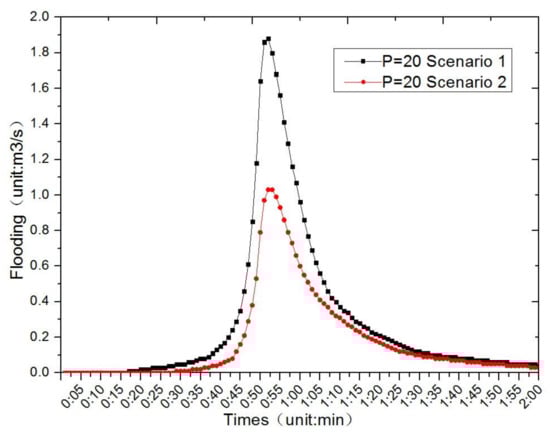
Figure 10.
Comparison of the flooded areas for Scenarios 1 and 2 for a storm with a recurrence interval (P) of 20 years.
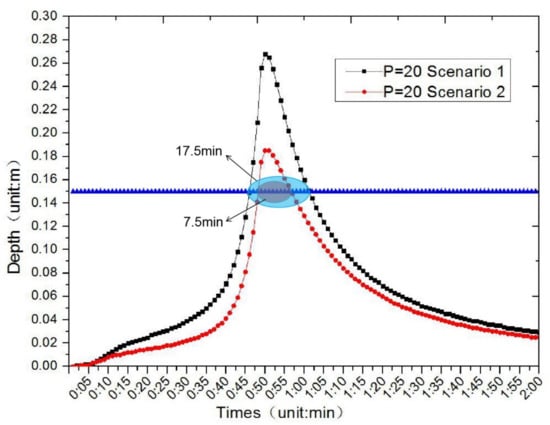
Figure 11.
Comparison of the standing water depth for scenarios 1 and 2 for a storm with a recurrence interval (P) of 20 years.
3.3. Calculation of Water Quality
Based on the ecological purification functions of the sponge system in the Shuixianghuayuan old residential area, the percentage removal of suspended solids (SS) based on the Guidelines [22] can be used as an indicator parameter to assess water quality in this area. This study also evaluates the effect of water quality control based on the following Equations (5)–(7):
and
where r is the comprehensive removal rate of SS by sponge facilities in percent, Wi is the runoff control quantity of single sponge facilities in m3, ni is the average removal rate of SS by a single type of sponge facility in percent, a is the annual total runoff control rate in percent, s is the removal rate of SS load in catchment areas, Aj is the area of the sub-catchments in hm2, nj is the removal rate of the SS load of the sub-catchments in percent, and φj is the comprehensive rainfall runoff coefficient of the sub-catchments.
Based on Equations (5)–(7), the percentage removal of SS by sponge facilities was calculated from runoff in the Shuixianghuayuan old residential area. The SS removal rate of several selected sponge facilities in the study area was obtained based on the value range given in the Guidelines, in which the SS removal rate of stormwater garden and bio-retention cells is 70% (see Table 3). The results in Table 3 also show that the reduction rate of SS can reach 56% annually, which meets the requirement of planning indicators.
Table 3.
Percentage removal of suspended solids (SS) from runoff by sponge facilities in the Shuixianghuayuan old residential area.
4. Discussions
4.1. Runoff Control Volume
The runoff control volumes of various facilities and each catchment area were calculated based on the constraints of green space, permeable pavement, tree-root system protection, and permeability in each catchment area. By comparing the designed runoff control volume, the situations of meeting the standard were evaluated. The calculated runoff control volume was based on the water-holding capacity of different sponge facilities and the volumetric method in the Guidelines. In each catchment area, the demand of runoff control volume in the corresponding area was met by the total runoff control volume of sponge facilities that include bio-retention cells, permeable pavement, grassed pitch, and stormwater garden [21]. The planning control target of 80% in volume was achieved through the implementation of sponge facilities, which indicates effective LID design performance.
4.2. Flooding Control Assessment
One of the planning objectives for the Shuixianghuayuan old residential area is to achieve the standard of drainage capacity for a design storm with a 2-year recurrence interval. Based on the modelling results of the SWMM, the effectiveness of sponge facilities for flood control under two scenarios was assessed under stormwater conditions with recurrence intervals of 5, 10, and 20 years (Figure 8 and Figure 9). In Figure 8, we have compared 5-min maximum floodwater volumes at different links between Scenario 1 (the traditional drainage system without sponge facilities) and Scenario 2 (the drainage system with sponge facilities), depending on storm conditions with recurrence intervals of 5, 10, and 20 years. It emphasizes the importance of locations and sizes in spongy facilities because it shows different temporal/spatial patterns in each link as described in Section 3.2. In Figure 9, we have compared 5-min maximum floodwater volumes at different nodes between Scenario 1 and 2, similar to Figure 8. It also emphasizes the importance of locations and sizes in spongy facilities because it shows different temporal/spatial patterns in each node as well. We have quantitatively analyzed the impact of spongy facilities on floodwater volumes and described its meaning in Figure 8, Figure 9, Figure 10, Figure 11 in Section 3.2 and Section 4.2, which shows better flood control ability in Scenario 2 (the drainage system with sponge facilities).
For the drainage system with sponge facilities (Scenario 2), the 5-min maximum floodwater volumes from each link and node were much lower than that under the traditional drainage system without sponge facilities (Scenario 1), which reflects the effectiveness of Sponge City facilities.
To further assess the effectiveness of sponge facilities for flood control, the time series of the flood volumes and standing water depths were compared between the two scenarios. The flooding risks are associated with standing water depths calculated according to the site topography and the flood volumes of each node. Our results reveal that flooding risks under Scenario 2 were much lower than Scenario 1, which indicates that the sponge facilities have a better and effective flood control capacity to manage rainwater [38].
4.3. Application of LID
The application of the proposed approach to Wujiang is an example of how LID can be used to inform the management of stormwater runoff. By implementing the stormwater garden and bi-retention cells of spongy facilities, the simulation results show that the target runoff control volume and SS removal rate given in the guidelines are achievable for a typical old residential area (Table 3). The reduction in runoff volume can also be achieved via adopting other facilities, such as green roofs, permeable pavements, and rain barrels [39]. Furthermore, Liu et al. [40] studied the effectiveness of different green infrastructure (GI) on the reduction in runoff and reported a limited effect based on a single GI with importance of GI combined effect. Moreover, Mei et al. [41] indicated that the combination of bio-retention cells, and vegetated swale appears to be the most cost-effective GI option for unit investment. These results correspond well with the results of our study, confirming the effectiveness of stormwater gardens and bi-retention cells for reducing runoff. Additionally, our study shows the effectiveness of spongy facilities on the removal rate of SS, which could be of use for their application in enhancing urban ecosystems in the renovation plans for old residential areas in the future. Since the investment and revenue mechanisms of the Sponge City Plan are still at an exploratory stage, the cost-effectiveness of the implementation of GI should be fully considered with integrated assessments.
The Sponge City Plan deviates from the traditional rapid-draining approach in an attempt to preserve or restore the sponge-like capacity of natural landscapes to absorb and store rainwater during urbanization [42]. Thereby, as a holistic, ecosystem-based approach that integrates with urban planning and design, Sponge City Plan has multi-capacities for alleviating flooding risk, reducing runoff pollution, and augmenting water supply for different uses, including environmental uses, toward water resilience, and sustainability [43]. Notably, the initiative prioritizes ecosystem conservation and habitat restoration, explicitly considering the water and environmental impact of development, while meeting the rising demand for water resources. It reflects the modern understanding of tackling urban water issues in a holistic, sustainable way and is consistent with integrated urban water management [44,45,46].
4.4. Management Implication and Future Direction
In order to meet the drainage requirements of sustainable urban development, urban stormwater management has become increasingly sophisticated, multi-dimensional, and integrated in nature [47]. Integrative urban drainage management is relevant with environmental requirements with ecological challenges, such as restoring and maintaining the natural flow regime, reducing non-point source pollution, rainwater harvesting and reuse, ecosystem protection and conservation, and enhancing ecosystem services in terms of eco-aesthetics and eco-recreation [48]. Although China’s water management was traditionally engineering-oriented and sector-based, especially in urban areas, only recently has China started to pay more attention to holistic stormwater management including low-impact development [49], and therefore, the country has little prior ecological knowledge and experience [27]. In recent decades, urban stormwater management has received much attention across the world, as evidenced by an exponential growth in the use of urban drainage terminology [47], partially in response to societal needs for improved stormwater management under changing development conditions such as climate change and urbanization [50,51].
Corresponding to the increased requirements for managing urban stormwater, implementing the Sponge City Plan requires understanding and accounting for not only urban hydrology [51], including landscape imperviousness and hydrological impact [52], and stormwater runoff dynamics [53], but also available technical measures and their performance [54,55,56,57], spatial heterogeneity and adaptability [58,59], and management strategy and governance [60], supported by reliable hydrological modelling assessment [61]. All these important aspects demand both technical knowledge and strong management strategies with governance capacity, challenging China’s ambition for holistic urban stormwater management [62].
Along with increasingly frequent extreme climate events caused by climate change [63,64], the combination of urban stormwater management and habitat eco-restoration in order to enhance the capacity for dealing with sudden-onset disasters is a crucial strategy for alleviating the impact of urban rainstorm floods. Site-scale field experiments in combination with water-scale scenario simulations will help determine reasonable GI design parameters [41]. Taking an integrated, watershed-scale approach and focusing on the connectivity of the source–community–region–watershed scales can prevent the segmentation and isolation of the system and focus on the full benefits of the Sponge City approach—which includes factors such as nature conservation, flood reduction, ecosystem service enhancement, and water resource protection—and ultimately promote a healthier watershed.
5. Conclusions
Previous studies have focused on Low Impact Development (LID) in order to pursue sustainability and reported that different green infrastructure (GI) parameters show different sensitivities that are related to rainfall characteristics [39]. The Chinese government’s “Sponge City Plan”, as a holistic strategy, can tackle urban pluvial flooding, while improving ecosystem services and enhancing environmental and habitat health [65,66]. This study indicates that Sponge City construction with a LID approach integrating green and grey infrastructure paradigms can effectively improve water quality and allow urban runoff control in a typical old residential community. Using a case study of the Shuixianghuayuan old residential area in Songling Town, Wujiang District, Suzhou, the study shows that a sponge system combined with bio-retention cells, permeable pavements, grassed pitches, and stormwater gardens can reduce flooding risks with a storm with a 5-year recurrence interval, while maintaining water quality with a 56% reduction in SS load. The results indicate that the proposed method of implementing spongy facilities can be used for renovation planning in old residential areas in China for the development of sponge cities.
The novelty of our research outcomes with respect to quantitative assessment of effectiveness in various sponge facilities including bio-retention cells, permeable pavements, grassed pitches, and stormwater gardens. Here, we have considered changes in stormwater runoff volume and suspended solids before and after installing spongy facilities in old residential areas in China, which are important evaluation criteria for stormwater management. It should be noted that this approach covers practical solutions for simultaneous water quantity/quality controls with useful information about successful implementation of integrating green and gray infrastructures in old residential areas.
Understanding the reliability of innovative technical measures for stormwater runoff management with a focus on ecosystem services and urban sustainability under local habitat conditions remains a knowledge gap [67]. Thus, the added value that LID can bring to regenerating old urban areas offers timely and effective options for solutions to economic and water challenges in an urbanizing world [68]. Based on our findings, further studies should explore how government policies could better preserve better ecosystem services for urban rainwater management from regional and national perspectives [43] and ensure more sustainable development with flood resilience [69] and risk management [70], in particular when regenerating ecologically friendly urban habitats.
Supplementary Materials
The following are available online at https://www.mdpi.com/2073-4441/13/1/4/s1, Table S1: Generalized results for sub-catchments in the stormwater management model (SWMM); Table S2. Generalized results for pipes in the SWMM; Table S3. Generalized results for nodes in the SWMM.
Author Contributions
Conceptualization: Y.Z. and X.C.; methodology: X.C. and Y.Z.; investigation: X.C., Y.Z., J.Z. and W.Z.; writing—original draft preparation: X.C. and Y.Z.; writing—review and editing: Y.Z., X.C., C.J., J.H. and X.T.; supervision: Y.Z.; funding acquisition: Y.Z., J.Z. and W.Z. All authors have read and agreed to the published version of the manuscript.
Funding
This research was funded by the Natural Science Foundation of Jiangsu Province, China, grant number: BK20171238.
Acknowledgments
The authors are grateful for support from the Suzhou Wujiang Taihu New City Administrative Committee, the Natural Science Foundation of Jiangsu Province, China (grant number BK20171238), and the Suzhou Association of Science and Technology. This research is partially supported by the Research Fund (RDH-101-2020-0044) of Xi’an Jiaotong-Liverpool University Urban and Environmental Studies University Research Center. The authors appreciate the helps from Zhijie Wu, Ying Hua, and Cuimei Li for field work, and the assistance from Liyin Shen for commenting and Martyn Hills for polishing the manuscript.
Conflicts of Interest
The authors declare no conflict of interest.
References
- Larsen, T.A.; Hoffmann, S.; Luthi, C.; Truffer, B.; Maurer, M. Emerging solutions to the water challenges of an urbanizing world. Science 2016, 352, 928–933. [Google Scholar] [CrossRef]
- Zhang, W.; Villarini, G.; Vecchi, G.A.; Smith, J.A. Urbanization exacerbated the rainfall and flooding caused by hurricane Harvey in Houston. Nature 2018, 563, 384–388. [Google Scholar] [CrossRef] [PubMed]
- Grimm, N.B.; Faeth, S.H.; Golubiewski, N.E.; Redman, C.L.; Wu, J.; Bai, X.; Briggs, J.M. Global change and the ecology of cities. Science 2008, 319, 756–760. [Google Scholar] [CrossRef] [PubMed]
- Bai, X.M.; Shi, P.J.; Liu, Y.S. Realizing China’s urban dream. Nature 2014, 509, 158–160. [Google Scholar] [CrossRef] [PubMed]
- Brabec, E.; Schulte, S.; Richards, P.L. Impervious surfaces and water quality: A review of current literature and its implications for watershed planning. J. Plan. Lit. 2002, 16, 499–524. [Google Scholar] [CrossRef]
- Walsh, C.J.; Roy, A.H.; Feminella, J.W.; Cottingham, P.D.; Groffman, P.M.; Morgan, R.P. The urban stream syndrome: Current knowledge and the search for a cure. J. N. Am. Benthol. Soc. 2005, 24, 706–723. [Google Scholar] [CrossRef]
- Hou, X.; Guo, H.; Wang, F.; Li, M.; Xue, X.; Liu, X.; Zeng, S. Is the sponge city construction sufficiently adaptable for the future stormwater management under climate change? J. Hydrol. 2020, 588, 125055. [Google Scholar] [CrossRef]
- Yu, S.L.; Jia, H.F. China’s ambitious Sponge City initiative: A monumental effort for green/grey infrastructure integration. ASCE EWRI Curr. 2016, 17, 8–9. (In Chinese) [Google Scholar]
- Wu, Z.J.; Zhang, Y.X. Spatial variation of urban thermal environment and its relation to green space patterns: Implication to sustainable landscape planning. Sustainability 2018, 10, 2249. [Google Scholar] [CrossRef]
- Wu, Z.J.; Zhang, Y.X. Water bodies’ cooling effects on urban land daytime surface temperature: Ecosystem service reducing heat island effect. Sustainability 2019, 11, 787. [Google Scholar] [CrossRef]
- Shen, L.; Du, L.; Yang, X.; Du, X.; Wang, J.; Hao, J.L. Sustainable strategies for transportation development in emerging cities in China: A simulation approach. Sustainability 2018, 10, 844. [Google Scholar] [CrossRef]
- Liang, C.Z.; Li, C. Main practices and thoughts on comprehensive renovation of old residential areas in Beijing. Constr. Sci. Technol. 2016, 9, 20–23. [Google Scholar]
- Davis, A.P. Green engineering principles promote low impact development. Environ. Sci. Technol. 2005, 39, 338A–344A. [Google Scholar] [CrossRef] [PubMed]
- Dietz, M.E. Low impact development practices: A review of current research and recommendations for future directions. Water Air Soil Pollut. 2007, 186, 351–363. [Google Scholar] [CrossRef]
- Wang, C.H.; Fang, S.M.; Chen, X.L. Practice of drainage and control of waterlogging in old residential areas based on the concept of Sponge City Construction. Water Wastewater Eng. 2017, 43, 45–47. (In Chinese) [Google Scholar]
- Liang, C.M.; Zhang, X.; Xia, J.; Xu, J.; She, D.X. The effect of Sponge City Construction for reducing directly connected impervious areas on hydrological responses at the urban catchment scale. Water 2020, 12, 1163. [Google Scholar] [CrossRef]
- Prudencio, L.; Null, S.E. Stormwater management and ecosystem services: A review. Environ. Res. Lett. 2018, 13, 033002. [Google Scholar] [CrossRef]
- Herslund, L.; Mguni, P. Examining urban water management practices–challenges and possibilities for transitions to sustainable urban water management in Sub-Saharan cities. Sustain. Cities Soc. 2019, 48, 573. [Google Scholar] [CrossRef]
- Guo, B.; Zhang, L.; Li, Y. Research on the path of residents’ willingness to upgrade by installing elevators in old residential quarters based on safety precautions. Saf. Sci. 2019, 118, 389396. [Google Scholar] [CrossRef]
- Cheng, Y.; Wang, R. A novel stormwater management system for urban roads in China based local conditions. Sustain. Cities Soc. 2019, 39, 163–171. [Google Scholar] [CrossRef]
- Jia, H.F.; Ma, H.T.; Sun, Z.X.; Yu, S.L.; Ding, Y.W.; Liang, Y. A closed urban scenic river system using stormwater treated with LID-BMP technology in a revitalized historical district in China. Ecol. Eng. 2014, 71, 448–457. [Google Scholar] [CrossRef]
- Zhang, L.W. Sponge City Case Studies; China Building Industry Press: Beijing, China, 2017. (In Chinese) [Google Scholar]
- Ministry of Housing and Urban-Rural Development of the People’s Republic of China (MOHURD). Technical Guidelines for Establishment of Intensity-Duration-Frequency Curve and Design Rainstorm Profile; China Meteorological Administration (CMA): Beijing, China, 2014. (In Chinese)
- Xu, T.; Jia, H.; Wang, Z.; Mao, X.; Xu, C. SWMM-based methodology for blockscale LID-BMPs planning based on site-scale multi-objective optimization: A case study in Tianjin. Front. Env. Sci. Eng. 2017, 11, 1. [Google Scholar]
- Jiang, B.; Cao, W.C.; Zhu, J.G. Planning and design of Sponge City in Kunshan City. China Water Wastewater 2016, 32, 70–73. (In Chinese) [Google Scholar]
- Che, W.; Zhao, Y.; Li, J.Q.; Wang, W.L.; Wang, J.L.; Wang, S.S.; Gong, Y.W. Explanation of Sponge City Development Technical Guide : Basic Concepts and Comprehensive Goals. China Water Wastewater 2015, 31, 1–5. [Google Scholar]
- Jia, H.F.; Yao, H.R.; Yu, S.L. Advances in LID BMPs research and practices for urban runoff control in China. Front. Environ. Sci. Eng. 2013, 7, 709–720. [Google Scholar] [CrossRef]
- Lu, W.; Luo, Z.J.; Du, J.J.; Ning, D. Shallow groundwater allowable withdrawal resources assessment in Wujiang Area. Coal Geol. China 2018, 30, 51–55. (In Chinese) [Google Scholar]
- Hou, P.C.; Xu, X.D.; Pan, G.X. Variation of soil quality with different land use change in Tai Lake region, Jiangsu, China: A case study of soil quality survey of Wujiang municipality in 2003. Ecol. Environ. 2007, 16, 152–157. (In Chinese) [Google Scholar]
- Rossman, L.A. Storm Water Management Model–User’s Manual Version 5.0; EPA/600/R-05/040; National Risk Management Research Laboratory, United States Environmental Protection Agency: Cincinnati, OH, USA, 2010. [Google Scholar]
- Ma, X.Y.; Zhu, Y.L.; Mei, K.; Zhuang, Y.J.; Zhuang, M.H. Application of SWMM in the simulation of non-point source pollution load in urban residential area. Res. Environ. Sci. 2012, 25, 95–102. (In Chinese) [Google Scholar]
- Zhang, S.J.; Gong, Y.W.; Chen, Y.X. Case Study of hydrological parameters sensitivity analysis using SWMM. J. Beijing Inst. Civ. Eng. Archt. 2012, 28, 45–48. (In Chinese) [Google Scholar]
- Chen, X.Y.; Zhang, N.; Wu, F.F.; He, B. Stormwater management model (SWMM): Principles, parameters and applications. China Water Wastewater 2013, 29, 4–7. (In Chinese) [Google Scholar]
- Zhou, Y.; Yu, M.H.; Chen, Y.X. Estimation of sub-catchment width in SWMM. China Water Wastewater 2014, 30, 61–64. (In Chinese) [Google Scholar]
- Keifer, C.J.; Chu, H.H. Synthetic storm pattern for drainage design. J. Hydraul. Div. 1957, 83, 1–25. [Google Scholar]
- Jiang, Y.L.; Lu, M.B. Evaluation and analysis of rainstorm intensity formula in central district of Suzhou City. Urban Roads Bridge Flood Ctrl. 2016, 8, 149–151. (In Chinese) [Google Scholar]
- Cheng, G. Simulation and Key Technology Research on Water Quality for Sponge City: A Case Study of a Test Area in Yixing City; Suzhou University of Science and Technology: Suzhou, China, 2016. [Google Scholar]
- Li, Y.; Li, H.X.; Huang, J.; Liu, C. An approximation method for evaluating flash flooding. J. Clean. Prod. 2020, 257, 120525. [Google Scholar] [CrossRef]
- Palla, A.; Gnecco, I. Hydrologic modeling of low impact development systems at the urban catchment scale. J. Hydrol. 2015, 528, 361–368. [Google Scholar] [CrossRef]
- Liu, W.; Chen, W.; Peng, C. Assessing the effectiveness of green infrastructures on urban flooding reduction: A community scale study. Ecol. Model 2014, 291, 6–14. [Google Scholar] [CrossRef]
- Mei, C.; Liu, J.; Wang, H.; Yang, Z.; Ding, X.; Shao, W. Integrated assessments of green infrastructure for flood mitigation to support robust decision-making for sponge city construction in an urbanized watershed. Sci. Total Environ. 2018, 639, 1394–1407. [Google Scholar] [CrossRef]
- Xia, J.; Zhang, Y.Y.; Xiong, L.H.; Shan, H.; Wang, L.F.; Yu, Z.B. Opportunities and challenges of the Sponge City construction related to urban water issues in China. Sci. China Earth Sci. 2017, 60, 652–658. [Google Scholar] [CrossRef]
- Ma, Y.C.; Jiang, Y.; Swallow, S. China’s sponge city development for urban water resilience and sus-tainability: A policy discussion. Sci. Total Environ. 2020, 729, 139078. [Google Scholar] [CrossRef]
- Mitchell, V.G. Applying integrated urban water management concepts: A review of Australian experience. J. Environ. Manag. 2006, 37, 598–605. [Google Scholar] [CrossRef]
- Mostafavi, M.; Doherty, G. Ecological Urbanism; Lars Müller Publishers: Baden, Switzerland, 2010. [Google Scholar]
- Mottaghi, M.; Aspegren, H.; Jönsson, K. Integrated urban design and open storm drainage in our urban environments: Merging drainage techniques into our city’s urban spaces. Water Pract. Technol. 2016, 11, 118–126. [Google Scholar] [CrossRef]
- Fletcher, T.D.; Shuster, W.; Hunt, W.F.; Ashley, R.; Butler, D.; Arthur, S.; Trowsdale, S.; Barraud, S.; Semadeni-Davies, A.; Bertrand-Krajewski, J.-L.; et al. SUDS, LID, bmps, WSUD and more—the evolution and application of terminology surrounding urban drainage. Urban Water J. 2015, 12, 525–542. [Google Scholar] [CrossRef]
- Jiang, Y.; Zevenbergen, C.; Fu, D. Understanding the challenges for the governance of China’s “sponge cities” initiative to sustainably manage urban stormwater and flooding. Nat. Hazards 2017, 89, 521–529. [Google Scholar] [CrossRef]
- Jiang, Y.; Zevenbergen, C.; Ma, Y. Urban pluvial flooding and stormwater management: A contemporary review of China’s challenges and “sponge cities” strategy. Environ. Sci. Policy 2018, 80, 132–143. [Google Scholar] [CrossRef]
- Varis, O.; Kummu, M.; Lehr, C.; Shen, D. China’s stressed waters: Societal and environmental vulnerability in China’s internal and transboundary river systems. Appl. Geogr. 2014, 53, 105–116. [Google Scholar] [CrossRef]
- Fletcher, T.D.; Andrieu, H.; Hamel, P. Understanding, management and modelling of urban hydrology and its consequences for receiving waters: A state of the art. Adv. Water Resour. 2013, 51, 261–279. [Google Scholar] [CrossRef]
- Jacobson, C.R. Identification and quantification of the hydrological impacts of imperviousness in urban catchments: A review. J. Environ. Manag. 2011, 92, 1438–1448. [Google Scholar] [CrossRef]
- Pyke, C.; Warren, M.P.; Johnson, T.; LaGro, J.; Scharfenberg, J.; Groth, P.; Freed, R.; Schroeer, W.; Main, E. Assessment of low impact development for managing stormwater with changing precipitation due to climate change. Landsc. Urban Plan. 2011, 103, 166–173. [Google Scholar] [CrossRef]
- Carter, T.; Jackson, C.R. Vegetated roofs for stormwater management at multiple spatial scales. Landsc. Urban Plan. 2007, 80, 84–94. [Google Scholar] [CrossRef]
- Berndtsson, J.C. Green roof performance towards management of runoff water quantity and quality: A review. Ecol. Eng. 2010, 36, 351–360. [Google Scholar] [CrossRef]
- Qin, H.; Li, Z.; Fu, G. The effects of low impact development on urban flooding under different rainfall characteristics. J. Environ. Manag. 2013, 129, 577–585. [Google Scholar] [CrossRef] [PubMed]
- Wang, M.; Zhang, D.Q.; Adhityan, A.; Ng, W.J.; Dong, J.W.; Tan, S.K. Assessing cost-effectiveness of bioretention on stormwater in response to climate change and urbanization for future scenarios. J. Hydrol. 2016, 543, 423–432. [Google Scholar] [CrossRef]
- Gallo, E.L.; Brooks, P.; Lohse, K.A.; McLain, J.E. Temporal patterns and controls on runoff magnitude and solution chemistry of urban catchments in the semi-arid southwest. Hydrol. Proc. 2012, 27, 995–1010. [Google Scholar] [CrossRef]
- Yang, L.; Smith, J.A.; Wright, D.B.; Baeck, M.L.; Villarini, G.; Tian, F.; Hu, H. Urbanization and climate change: An examination of nonstationarities in urban flooding. J. Hydrometeorol. 2013, 14, 1791–1809. [Google Scholar] [CrossRef]
- Ferguson, B.C.; Brown, R.R.; Deletic, A. Diagnosing transformative change in urban water systems: Theories and frameworks. Glob. Environ. Chang. 2013, 23, 264–280. [Google Scholar] [CrossRef]
- Bach, P.M.; Rauch, W.; Mikkelsen, P.S.; McCarthy, D.T.; Deletic, A. A critical review of integrated urban water modelling—Urban drainage and beyond. Environ. Modell. Softw. 2014, 54, 88–107. [Google Scholar] [CrossRef]
- Zevenbergen, C.; Gersonius, B.; Radhakrishan, M. Flood resilience. Phil. Trans. R. Soc. 2020. [Google Scholar] [CrossRef]
- Pendergrass, A.G. What precipitation is extreme? Science 2018, 360, 1072–1073. [Google Scholar] [CrossRef]
- Roche, K.R.; Müller-Itten, M.; Dralle, D.N.; Bolster, D.; Müller, M.F. Climate change and the opportunity cost of conflict. Proc. Natl. Acad. Sci. USA 2020, 117, 1935–1940. [Google Scholar] [CrossRef]
- Jia, H.F.; Wang, Z.; Zhen, X.Y.; Clar, M.; Yu, S.L. China’s Sponge City construction: A discussion on technical approaches. Front. Environ. Sci. Eng. 2017, 11, 8. [Google Scholar] [CrossRef]
- Li, H.; Ding, L.Q.; Ren, M.L.; Li, C.Z.; Wang, H. Sponge City Construction in China: A survey of the challenges and opportunities. Water 2017, 9, 594. [Google Scholar] [CrossRef]
- Yang, W.; Hyndman, D.; Winkler, J.; Viña, A.; Deines, J.; Lupi, F.; Luo, L.F.; Li, Y.K.; Basso, B.; Zheng, C.M.; et al. Urban water sustainability: Framework and application. Ecol. Soc. 2016, 21, 4. [Google Scholar] [CrossRef]
- Zhang, S.; Zevenbergen, C.; Rabé, P.; Jiang, Y. The influences of sponge city on property values in Wuhan, China. Water 2018, 10, 766. [Google Scholar] [CrossRef]
- Griffiths, J.; Chan, F.K.S.; Shao, M.; Zhu, F.F.; Higgitt, D.L. Interpretation and application of Sponge City guidelines in China. Philosophical Transactions of the Royal Society A: Mathematical. Phys. Eng. Sci. 2020, 378, 20190222. [Google Scholar]
- Chan, F.K.S.; Griffiths, J.A.; Higgitt, D.; Xu, S.Y.; Zhu, F.F.; Tang, Y.T.; Xu, Y.Y.; Thorne, C.R. “Sponge City” in China-a breakthrough of planning and flood risk management in the urban context. Land Use Policy 2018, 76, 772–778. [Google Scholar] [CrossRef]


Publisher’s Note: MDPI stays neutral with regard to jurisdictional claims in published maps and institutional affiliations. |
© 2020 by the authors. Licensee MDPI, Basel, Switzerland. This article is an open access article distributed under the terms and conditions of the Creative Commons Attribution (CC BY) license (http://creativecommons.org/licenses/by/4.0/).