Article

Water Conservation and Green Infrastructure Adaptations to Reduce Water Scarcity for Residential Areas with Semi-Arid Climate: Mineral de la Reforma, Mexico

by
Carlos Alfredo Bigurra-Alzati
1,
Ruperto Ortiz-Gómez
2,
Gabriela A. Vázquez-Rodríguez
3,
Luis D. López-León
1 and
Liliana Lizárraga-Mendiola
1,*
1
Academic Area of Engineering and Architecture, Autonomous University of the State of Hidalgo, km 4.5 Pachuca-Tulancingo Highway, Pachuca 42184, Mexico
2
Academic Unit of Engineering, Autonomous University of Zacatecas, Ramón López Velarde 801, Zacatecas 98000, Mexico
3
Academic Area of Chemistry, Autonomous University of the State of Hidalgo, km 4.5 Pachuca-Tulancingo Highway, Pachuca 42184, Mexico
*
Author to whom correspondence should be addressed.
Water 2021, 13(1), 45; https://doi.org/10.3390/w13010045
Submission received: 11 November 2020 / Revised: 5 December 2020 / Accepted: 21 December 2020 / Published: 29 December 2020
(This article belongs to the Section Urban Water Management)

Abstract

:
The increasing population and urban sprawl will continue to add significant pressure to natural resources in arid and semi-arid zones. This study evaluates the theoretical effectiveness of adapting resilient strategies such as water conservation and green infrastructure to mitigate the water scarcity faced by the inhabitants of a residential area with a semi-arid climate. Three scenarios were analyzed at a micro-basin level to determine the mitigation of surface runoff and the volume that can be theoretically intercepted for further use: (a) unaltered natural watershed (scenario 1), (b) currently urbanized watershed (scenario 2), and (c) watershed adapted with resilient strategies (scenario 3). For this last scenario, the annual usable volume of rainwater intercepted on the dwelling rooftops was obtained. The runoff and peak flow in the natural watershed were lower than in the other two scenarios. In contrast, a decrease in the runoff was observed in scenario 3 concerning scenario 2, which indicates that the interception of rainwater on house roofs and the adoption of green infrastructure solutions would significantly reduce the diameter of urban drainage pipes required in new developments, as well as the dependency of inhabitants on potable water services. In sites with semi-arid climates, it is possible to take advantage of the rainwater harvested on rooftops and the runoff intercepted through green infrastructure to mitigate local water scarcity problems, which should be considered and adopted in new residential developments.

1. Introduction

Around the world, the population inhabiting arid and semi-arid areas faces water scarcity problems, among other severe problems, due to low rainfall that prevents the recharge of aquifers or their surface storage [1]. A semi-arid zone is defined as one where annual precipitation is between 250 and 500 mm [2]. However, other definitions indicate that areas with less than 500 mm of rainfall are considered semi-arid, subhumid, or humid [3]. The average annual rainfall in Mexico is 700 mm in its northeastern region, considered semi-arid [4]. In addition to the lack of rain, the urban sprawl in these areas produces impervious surfaces that alter surface runoffs’ hydrological nature by preventing the infiltration of surface water into the ground and increasing stormwater in terms of volumes and peak flow [5]. Conventionally, stormwater is detained and conveyed through piped drainage systems [5]. However, the traditional approaches fail to address the increases in storm runoff volume and peak flows caused by urban development [1]. It is essential to implement resilient strategies such as rainwater harvesting (RWH) and green infrastructure (GI) to help in the restoration of the urban hydrological cycle [6]. These strategies could help mitigate the lack of water and reduce stormwater problems [6,7].
A rainwater harvesting (RWH) approach, as a conservation measure, would help people to overcome crises in water supply [7,8,9]. Domestic rainwater harvesting consists of the small-scale concentration, collection, storage, and domestic use of rainwater runoff, mainly from rooftops and other impervious surfaces [10]. Rainwater can replace potable water for several domestic services such as toilet flushing and garden irrigation [11] and potable purposes such as drinking, cooking, and bathing if subjected to some treatment level or even without treatment [12,13]. The additional effect is that when collected rainwater is used, other water sources’ demand can be reduced [6,14]. In arid and semi-arid regions, when RWH systems are employed not only for domestic consumption but for irrigation and infiltration in urban areas, it is possible to mitigate flooding events because of their stormwater capture efficiency [13]. RWH has been studied from different perspectives; some of its applications cover flood control in urban areas, quality control of surface runoff during rainfall events, watershed management, or green infrastructure building [6,7]. Among the RWH advantages, these systems enhance the efficiency of the available water use [7]. Its decentralized nature also allows the owners to benefit from direct supply [6]. RWH systems’ implementation diverts surface runoff away from stormwater collection systems and reduces the volume of runoff that needs to be managed during rainfall events [13].
In the literature, several examples of RWH applications exist to mitigate water scarcity problems in arid and semi-arid regions worldwide. Several archaeological findings suggest that RWH was common in Egypt, Thailand, Mexico, Pakistan, Ethiopia, Jordan, Korea, Sardinia, etc. [1,7,15]. In South Africa, where climate change impacts have been visible over the last three decades, RWH is the primary source of supply for 0.3% of the rural households [16]. Campisano et al. [10] mentioned that in Italian cities with dry temperate climates (annual rainfall of 420 mm), RWH can reduce domestic potable water consumption. Tabatabaee and Han [17] investigated the potential of RWH for sanitary purposes in a semi-arid zone of Iran (annual rainfall of 250 mm). Shokory and Rabanizada [18] investigated RWH as an alternative to sustaining water resources in Kabul, whose average yearly precipitation is 346 mm. In semi-arid climates of Nigeria (annual rainfall of 400 mm), Nnaji and Mama [12] determined that it is possible to cover about 68% and 40% of primary water demand through RWH. In a semi-arid region of Brazil (annual rainfall less than 800 mm), domestic RWH can provide potable water to meet the water needs (drinking and cooking) of a family of up to six people during 6–8 months [19]. In a rural semi-arid region of central Mexico (annual rainfall of 724 mm), it was possible to capture enough rain for household needs and reduce the work time required to obtain water from local sources [1]. In two Iranian cities with cold and semi-arid climates (annual rainfall varies from 386 and 316.8, respectively), Molaei et al. [9] determined that it is possible to obtain at least 70% of non-potable water from large surface roofs (300 m2). Further, RWH has been studied as a viable solution for flood mitigation in sub-Saharan regions’ inflow peak and volume reduction at the field and basin-scale [20]. In another study, the authors mentioned that RWH tanks contribute to the redistribution of flows over longer temporal scales, thus reducing the incidence of flooding downstream [13].
On the other hand, green infrastructure (GI) is an emerging planning and design concept to mitigate urban flooding [5,21]. The GI employs principles such as preserving and recreating natural landscape features, implementing several on-site infrastructures that mimic nature to reduce the stormwater runoff from sources [22,23]. GI is sometimes called low impact development (LID) [24]; both terms are increasingly being touted as a practical approach to lessen runoff and pollutant loadings to streams [25,26,27]. GI installations consist of systems and practices that utilize or simulate natural processes, allowing stormwater to infiltrate, evaporate, or be used on-site [5,25]. GI can increase the capacity for stormwater volume capture and detention within urban watersheds [27,28]. In addition, GI helps in runoff reduction, which is inherent for sustainable urban development [29].
The hydrological performance and benefits of GI practices have been shown in several studies. For example, Dreelin et al. [30] indicated that porous pavements reduced 93% of runoff on two parking lots. Alfredo et al. [31] found that green roofs can delay and prolong the roof discharge and reduce its peak rate. In another study, Feng et al. [32] determined the potential for GI to restore the predevelopment hydrologic cycle in a semi-arid urban catchment. Fry and Maxwell [21] concluded that GI has the most considerable impact on peak reduction for smaller storm events. Schubert et al. [33] compared gray infrastructure vs. green infrastructure scenarios and determined that GI can reduce downstream flooded areas by 29%. In northeastern Madrid (annual rainfall of 428 mm), Rodríguez-Sinobas et al. [34] analyzed a large-scale sustainable urban drainage infrastructure (consisting of rainwater, green roofs, and permeable pavement) to determine its performance. The authors concluded that one of the leading GI strengths is its easy adaptation to traditional urban drainage systems.
Despite these approaches, there is a need to develop more examples of how these resilient strategies could mitigate problems that urban semi-arid areas are experiencing to promote their adaptation in future urban areas. This sustainable solution addresses not only water scarcity but provides options to infiltrate stormwater and recharge aquifers. Few studies combine RWH and GI as an alternative for flooding reduction in semi-arid areas [6,7,13,20,29,31,35,36].
In this research, a theoretical rainfall-runoff model with fewer parameter requirements is employed to describe the potential of combining GI and RWH in homogeneous urban residential areas placed in semi-arid conditions.

Problem Statement and Scope

Currently, the city of Mineral de la Reforma has a shortage of drinking water for domestic consumption due to overexploitation of the local aquifer. Further, the collection system of sewage and stormwater is combined, which reduces the possibility of capturing a volume of rainwater that could be used locally without requiring complex treatments for non-potable uses. This fact also causes a flood problem during the rainy season because of the hydraulic infrastructure’s inefficiency in evacuating large volumes, for which it is not designed.
This study analyzed an established residential area with a homogeneous dwelling (surface area and typologies), common green spaces, and gray infrastructure (roads, walkways, ridges, sewage, and storm combined drainage system). The design for such homogeneous urbanization provides us a scenario for analyzing urban flooding processes, with and without water conservation and green infrastructure practices, on defined gray infrastructure. These factors helped to theoretically evaluate their effectiveness as sustainable combined practices to enhance adaptation in future residential developments, in order to mitigate water scarcity problems in places with semi-arid climates.

2. Materials and Methods

2.1. Location of the Study Area

The residential area is located in the city of Mineral de la Reforma, Hidalgo state, at 20°04′30″ N latitude and 98°43′30″ W longitude. Its average elevation is 2433 meters above sea level (masl). The watershed area is 1.43 km2 with 9.5% slope, 1414 m length, 135 m difference in topographic level (from top to bottom), and Phaeozem, impermeable sandy clay soil type [37]. The soil use is: residential area (0.6664 km2), dwelling covered area (0.3105 km2), sidewalks (0.045 km2), asphalt roadways (0.286 km2), public green areas (0.014 km2), commercial area (0.061 km2), ridges (0.0109 km2), and unaltered grassland area (0.7026 km2). The residential area includes 1483 dwellings, with very similar characteristics. Each dwelling lot has a total area of 90 m2, with roof surfaces of 60 m2 (Figure 1).

2.2. Climate

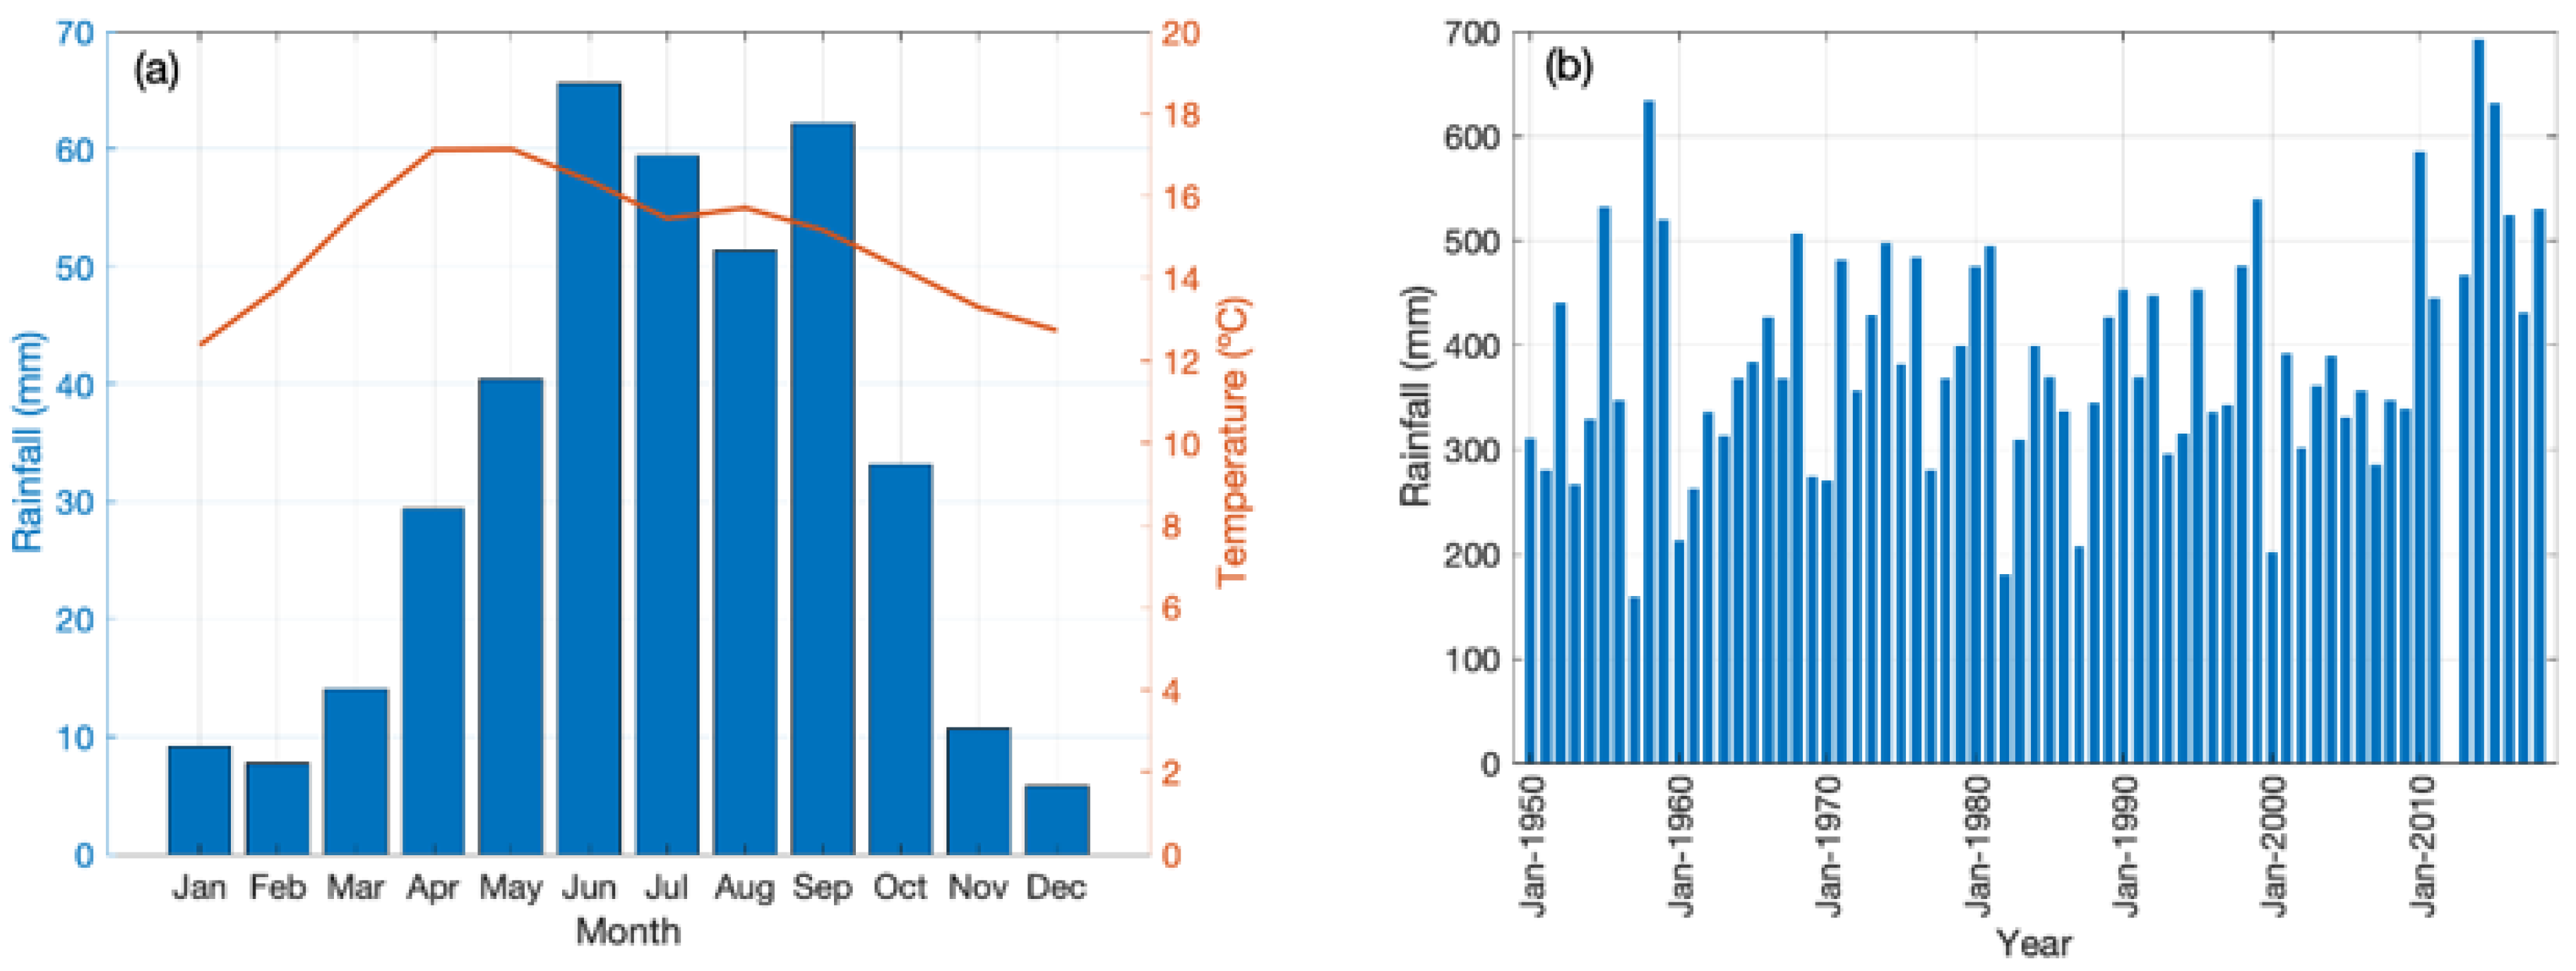
According to CONAGUA [38], the city has a semi-arid cold or temperate climate, with occasional hail and heavy rain during the summer months and dry conditions during winter. The average temperature is 14 °C, with maximum temperatures in April and May (24.6 and 24.1 °C, respectively). The annual rainfall ranges from 160 to 700 mm, and the rainy season extends from May to October (Figure 2). From this volume of rain, more than 70% is lost through evaporation [30]. Daily rainfall records from the local climatological station (station ID 13022) from 1950 to 2018, taken from the CLICOM database [38], were used to estimate the amount of harvestable water and peak discharge in the watershed.

2.3. Design of Proposed Scenarios

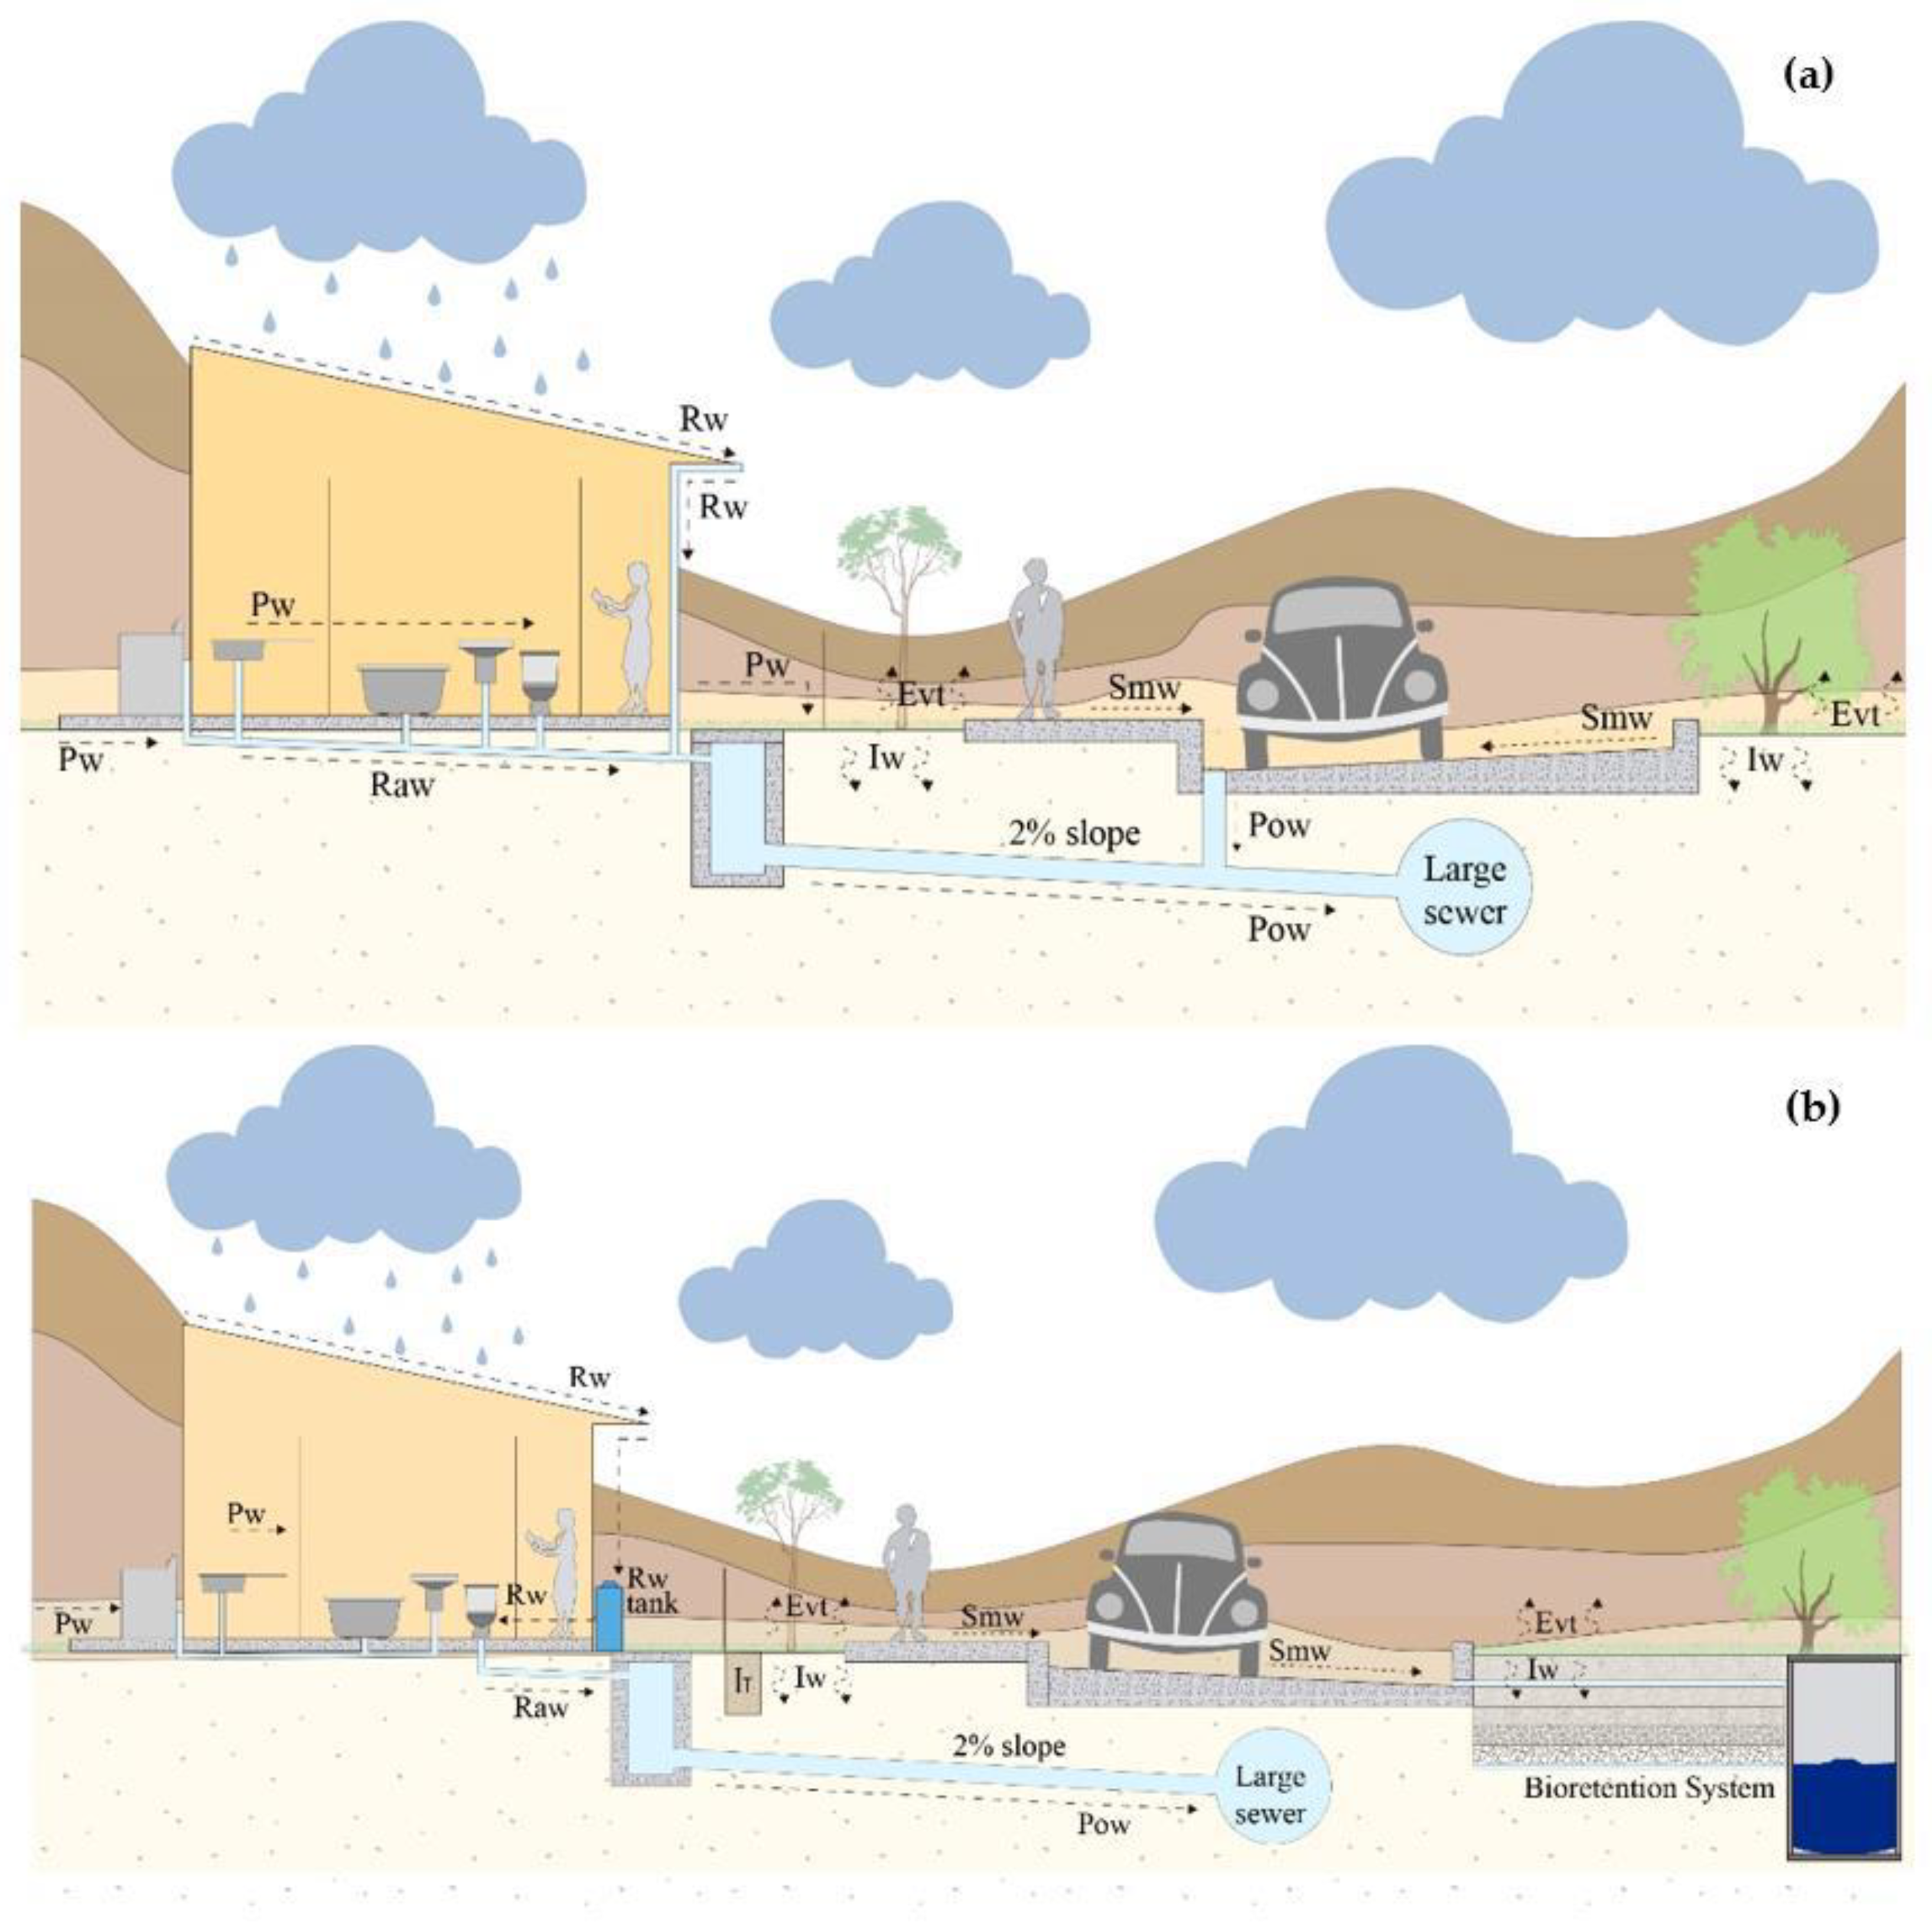
Conservation measures such as RWH are proposed to reduce the potable water deficit in dwellings and determine their capacity for surface runoff mitigation through capturing rainwater on the roofs of houses for non-potable purposes. Combining these conservation measures and green infrastructure such as infiltration trenches and bioretention systems could mitigate surface runoff, reduce the volume that diverts to stormwater drainage, and create self-consumption options. Three scenarios were analyzed to determine the technical feasibility of this proposal: (1) conditions before urban development (unaltered natural watershed, scenario 1, Figure 1a); (2) residential development with gray infrastructure, where the total runoff generated by rainfall connects to urban drainage (current urban watershed, scenario 2, Figure 1b and Figure 3a); and (3) residential development with rainwater harvesting and infiltration trenches into private gardens, and green infrastructure (infiltration trenches and bioretention systems) in public areas (combined gray and green infrastructure watershed, scenario 3, Figure 3b).
The third scenario consists of installing a rainwater harvesting tank that collects the runoff generated on the roof in each of the 1483 dwellings. Additionally, this harvested volume can be used as non-potable water to supply self-consumption. Excess water that is not stored in the tank will be absorbed in each house’s garden through infiltration trenches. This scenario assumes that the entire roofs of the dwelling and commercial area will intercept rainwater for self-consumption (see Section 2.5). This is intended to eliminate the runoff generated in the dwelling and commercial buildings in its entirety, reducing the runoff from the urbanized basin that will discharge to the drainage network. In public garden areas, replacement of the existing soil (Phaeozem) with sandy soil is proposed, thus allowing increased infiltration and reducing surface runoff. In their study, Martin-Mikle et al. [26] mentioned that sandy soils could augment GI infiltration capacity. In contrast, clayey soils (Phaeozem) and large impervious surface areas would increase the low infiltration capacity and contribute to large runoffs that will affect urban infrastructure [26]. The main design parameters proposed for each scenario are described in Table 1.

2.4. Definition of the Physical Characteristics of the Watershed

In this study, only the SW part of the original watershed was delimited and analyzed. The runoffs originate in the extreme south and cross the residential area in an SW and NE-SW direction (Figure 1). The northern part and the extreme E were discarded since, in the first case (original watershed), it crosses an old highway (NE-SW) and the hydraulic works parallel to this prevent the runoff that originates in the N part of the watershed from crossing the study area (Figure 1, P1). In the second case, a material bank significantly altered the topography, directing the runoff in the opposite direction to the study area (NE). For the purposes of this paper, we will refer to the study area as the watershed area (see Figure 1 and Table 1). The area of interest is a watershed in which the perimeter, slope, and average length are taken into account. Georeferenced information from the watershed (previous to and after urbanization) was extracted using Google Earth Pro.Ink [39]. Its topography delimits it to form surface runoff (from the higher topographic area into the lowest part, or flood zone). After georeferencing the land use and hydrological flows, Global Mapper v20.1 [40] was used to obtain the terrain’s topography and locate the main directions and slope of surface runoff. Subsequently, ARCHICAD [41] was employed to model the information in 3D and calculate the primary runoff’s topographic profile, distances, land use sub-areas, and slope (Table 1).

2.5. Rainwater Harvesting Volumes

The rainfall design was calculated from a frequency analysis of the average monthly rainfall to obtain the rainwater harvesting volumes. According to Schneider [42], in localities where rainfall variability is high, particularly in semi-arid and sub-humid regions, it is recommended to use rainfall values with occurrence probabilities higher than 50%. Based on the rainfall’s local characteristics, the type of consumption, and the scarcity situation, the available rainfalls could have a probability of occurrence from 75 to 90%. Monthly rainfall with occurrence probabilities of 50, 60, and 75% (R50, R60, and R75, respectively) was used in this investigation to determine its availability to be intercepted on rooftops (watershed volume). These rainfalls were analyzed utilizing a frequency analysis, using the Normal, 2-parameter and 3-parameter Log normal, 2-parameter Gamma, Log Pearson III, Gumbel, and Double Gumbel distributions. The best fit distribution was selected using the standard error of fit [43].
The monthly rainwater harvesting volume ( V c ) was computed with Equation (1) [44,45]:
V c = R × A r × C r 1000
where V c equals the monthly rainwater harvesting volume (m3); R is the available monthly rainfall (R50, R60, and R75, in mm); A r is the concrete rooftop surface (60 m2); C r is the runoff coefficient, which varies from 0.8 to 0.95 [44]. In this study, Equation (1) employs a runoff coefficient of 0.90 (dimensionless) for concrete rooftops.

2.6. Design Hydrograph Estimation

2.6.1. Rational Method for Estimate Maximum Discharge

Among the most used hydrological methods to model the rain-runoff process in non-gauged basins are Rational [46], Chow [47], triangular unit hydrograph [48], SCS (Soil Conservation Service) triangular unit hydrograph [49], and hydrograph unit [50]. In this study, the Rational method was used to calculate the peak discharge in the study watershed for the proposed scenarios (Equation (2)).
Q = 0.278 C e i A
where Q is the peak discharge (m3/s); C e is the runoff coefficient (dimensionless); i is the rainfall intensity (mm/hour); and A is the watershed area (km2).

2.6.2. Curve Number Method to Estimate Effective Rainfall

The temporal rainfall distribution is an essential factor that directly influences the magnitude of the peak discharge; however, there are no data on rainfall intensity in the study area, so the method of Kuishling and Gransky [46,51] was used. This formulation considers a distribution that adheres to maximum intensity curves. Generally, the rainfall that produces the peak discharge in the watershed is the rainfall corresponding to a duration equal to the watershed’s concentration time. This time is defined as the minimum time necessary for all the watershed points to be simultaneously contributing runoff to its outlet [46,51]. Therefore, it is needed to calculate the rainfall corresponding to the concentration time of the watershed. Kuishling and Gransky’s formulation is given by Equations (3) and (4):
R t = K t 1 e 1 e
K = H p ( 1 e ) 24 1 e
where R t is the rainfall in the time t (mm); t is the time for which rainfall is required (hours); K is a rainfall distribution coefficient (dimensionless); e is a dimensionless value that depends on the concentration-time ( t c ) and the watershed area [43]. For this study, e =0.8; and H p is the maximum 24-h rainfall (mm) for a specific return period.
The time t, for which it is required to know the rainfall, is the concentration time t c (Equation (5)), which was calculated with the Kirpich equation [46,51]:
t c = 0.000325 L 0.77 S 0.385
where L is the mean length of the channel (m), and S corresponds to its mean slope (%). The runoff coefficient ( C e ) and the rainfall intensity (i) are given by Equations (6) and (7).
C e = P e R e
i = R e t c
where P e is the effective or excess rainfall (mm). In this study, effective rainfall, R e , was obtained using the SCS curve number method [49].
A frequency analysis was carried out on the maximum annual rainfall series in 24 h to estimate the design rainfall ( H p ), with the same probability distribution functions and selection criteria used in Section 2.5. With the best fit distribution, the design storms for return periods ( T r ) of 2, 5, 10, and 20 years were determined.

2.6.3. SCS Dimensionless Unit Hydrograph to Determine Design Hydrographs

With the design peak discharge obtained for the different return periods, the corresponding design hydrographs were constructed for the three proposed scenarios, using the dimensionless unit hydrograph of the SCS [49]. Peak time, excess duration, and lag time were calculated with Equations (8)–(10) [49]:
t p = d e 2   +   t l a g
d e = t c
t l a g = 0.00505 ( L S ) 0.64
where t p is the peak time (hours); d e is the excess duration (hours); and t l a g is the lag time (hours).

3. Results

3.1. Rainwater Harvested on Dwellings

The frequency and occurrence of rainfall in the study area are basic design variables for sizing a rainwater harvesting system [45]. According to the rainfall analysis, where the standard error of fit was obtained, in general, the distribution function that best fits the monthly rainfall series was the Gumbel function.
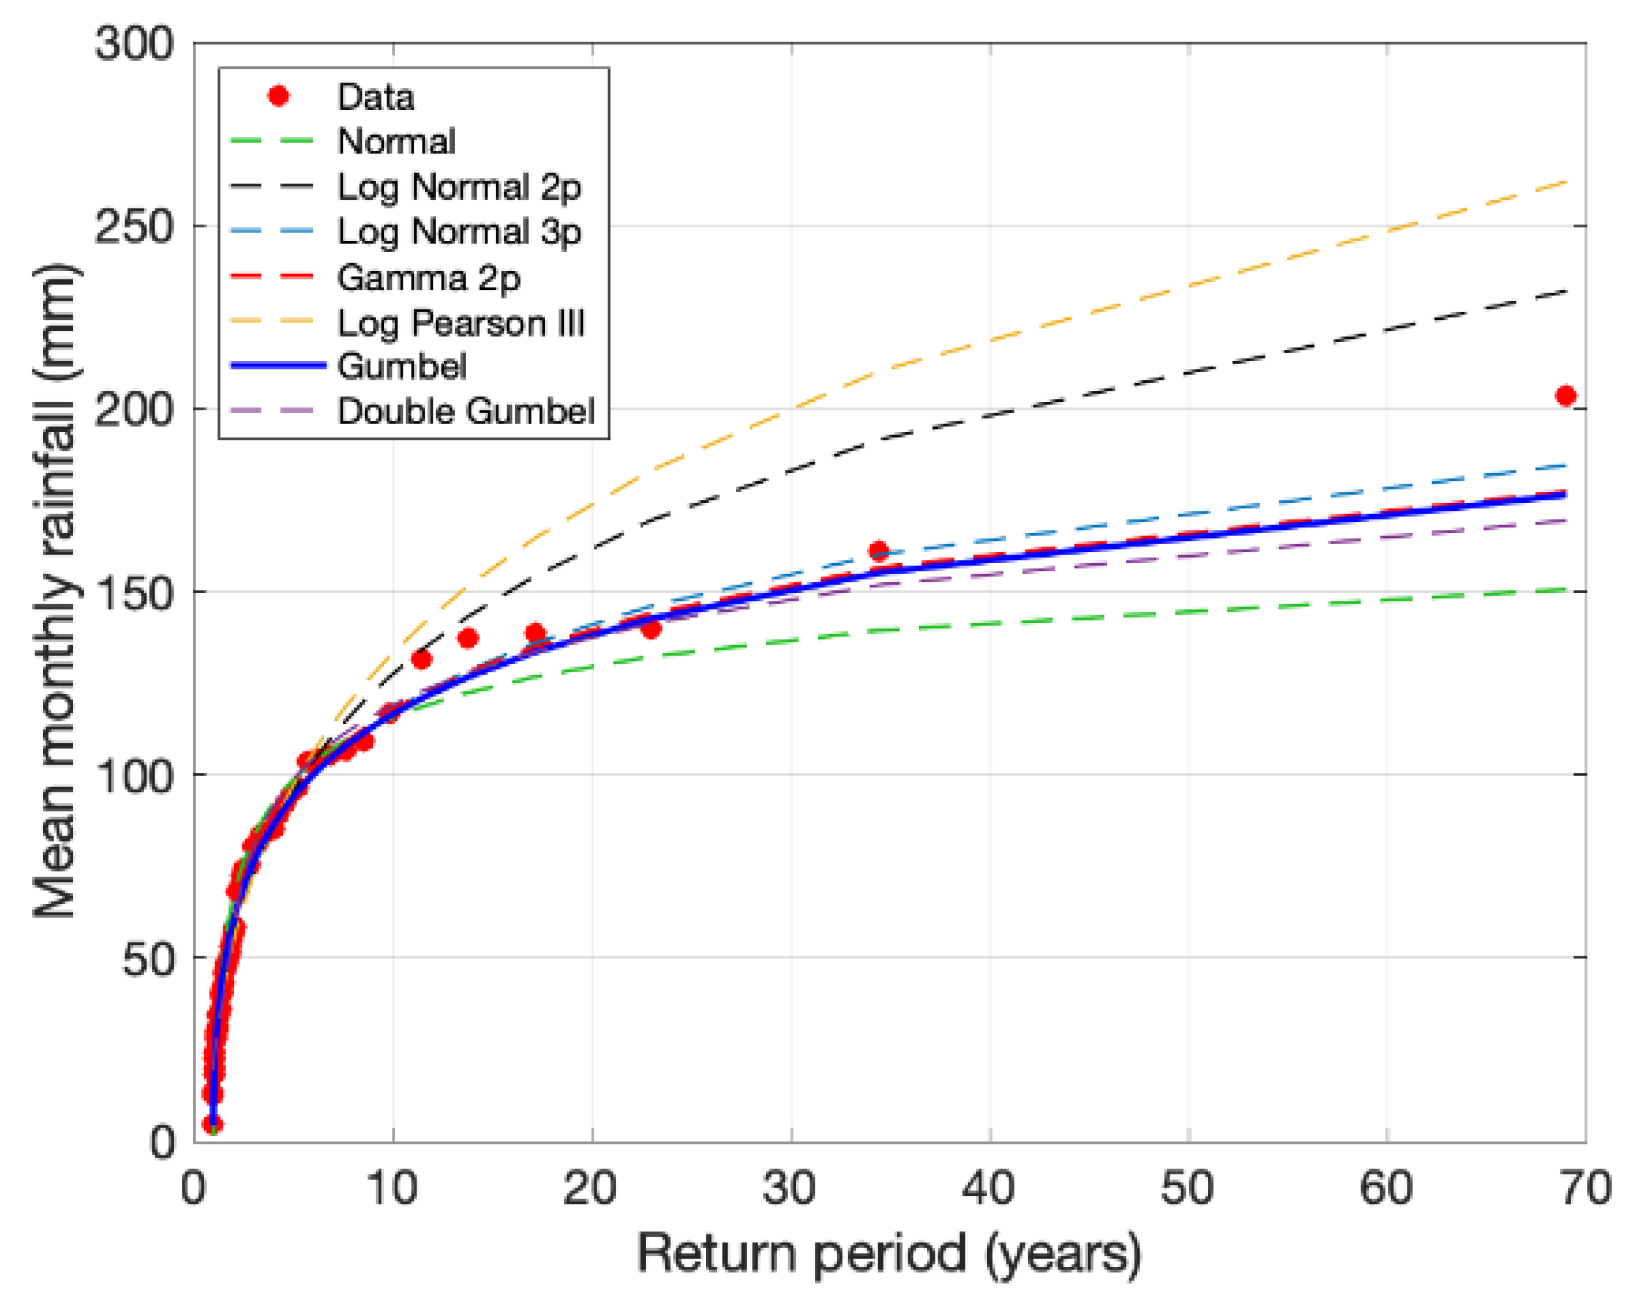
Figure 4 shows the fitting of the probability distribution functions for June, the month with the highest rainfall. The standard errors of fit presented by the different distributions for June were: 4.56, 4.85, 5.03, 5.91, 7.84, 10.63 y 23.51 for the 2-parameter Gamma, Gumbel, 3-parameter Log-Normal, Double Gumbel, 2- parameter Log-Normal, Normal and Log Pearson III distributions, respectively. For T r < 10 years, the distribution functions have a very similar fit, obtaining slightly higher values through the Log Pearson III and 2-parameter Log-Normal distributions. From the Gumbel distribution function, the rainfall employed for the rainwater watershed analysis was determined, which corresponds to a probability of exceedance of 50% (R50), 60% (R60), and 75% (R75).
Table 2 shows the volume of rainwater that can be harvested during the period from May to September, which concentrates between 73.0% and 86.0% of the rainfall, with a probability of exceedance of 50% and 75%, respectively. Considering that each dwelling has a catchment area of 60 m2, Table 2 shows the monthly volumes that can be harvested annually: 9.12 m3 (Vc75), 14.72 m3 (Vc60), and 18.48 m3 (Vc50).

3.2. Estimation of the Design Event

When direct measurements are not available to help determine the runoff history at a site of interest, it is necessary to estimate the design flood for different return periods [52]. It can help to design stormwater infrastructure, such as drainage networks, flood control, and irrigation. Additionally, if hydrometric information is lacking, it is recommended to analyze the frequencies of the design flood and select the one representing a better performance of the studied sample [53].

3.2.1. Basin Response Times

Both the spatial and temporal distribution of runoff and the critical duration of flood-producing rainfall is influenced by the watershed response time [54]. The watershed response time is also directly related to, and influenced by, climatological variables, watershed geomorphology, watershed variables (e.g., land cover, soils and storage), and channel geomorphology [54]. With Equations (5), (8)–(10), and with the characteristics of the basin (Table 1), their response times were obtained as 0.214 h, 0.214 h, 0.255 h, and 0.362 h, for the time of concentration ( t c ), excess duration ( d e ), lag time ( t l a g ) and peak time ( t p ), respectively.

3.2.2. Design Rainfall

Figure 5 shows the adjustment of the distribution functions to the 24-h daily maximum rainfall series. According to the values of the standard error of fit calculated for each distribution applied in the frequency analysis, the probability distribution that best fits these series was the double Gumbel function, which presented a value of 4.02.
With this distribution function, the design rainfalls for the return periods analyzed were obtained (Table 3). With these values and the watershed’s response times (Section 3.2.1), the rainfall corresponding to the time of concentration was determined.

3.2.3. Effective Rainfall and Design Hydrographs

From the rainfall associated with the watershed time of concentration ( R t ) for each return period ( T r ), the effective or excess rainfall ( R e ) was estimated using the SCS curve number method [49] for each of the analyzed scenarios (Table 4). This method has been employed to estimate relative runoff reductions with different GI strategies in a low-density residential watershed [55,56,57]. The curve numbers for modeling scenarios 1, 2, and 3 are 68.0, 80.7, and 73.6, respectively. Table 4 shows that the effective rainfall in scenario 2 ( R e 2 ) is higher than in scenarios 1 ( R e 1 ) and 3 ( R e 3 ), since the curve number is the highest. The effective rainfall for a return period of two years and the three analyzed scenarios is zero.

3.2.4. Peak Discharge and Design Hydrograph

From the estimated rainfall ( R t and R e ), the runoff coefficients and the design intensities (Equations (6) and (7)) were obtained for the return periods analyzed. These values, as well as peak discharge values (Q), calculated through the Rational method for the three analyzed scenarios, are shown in Table 5.
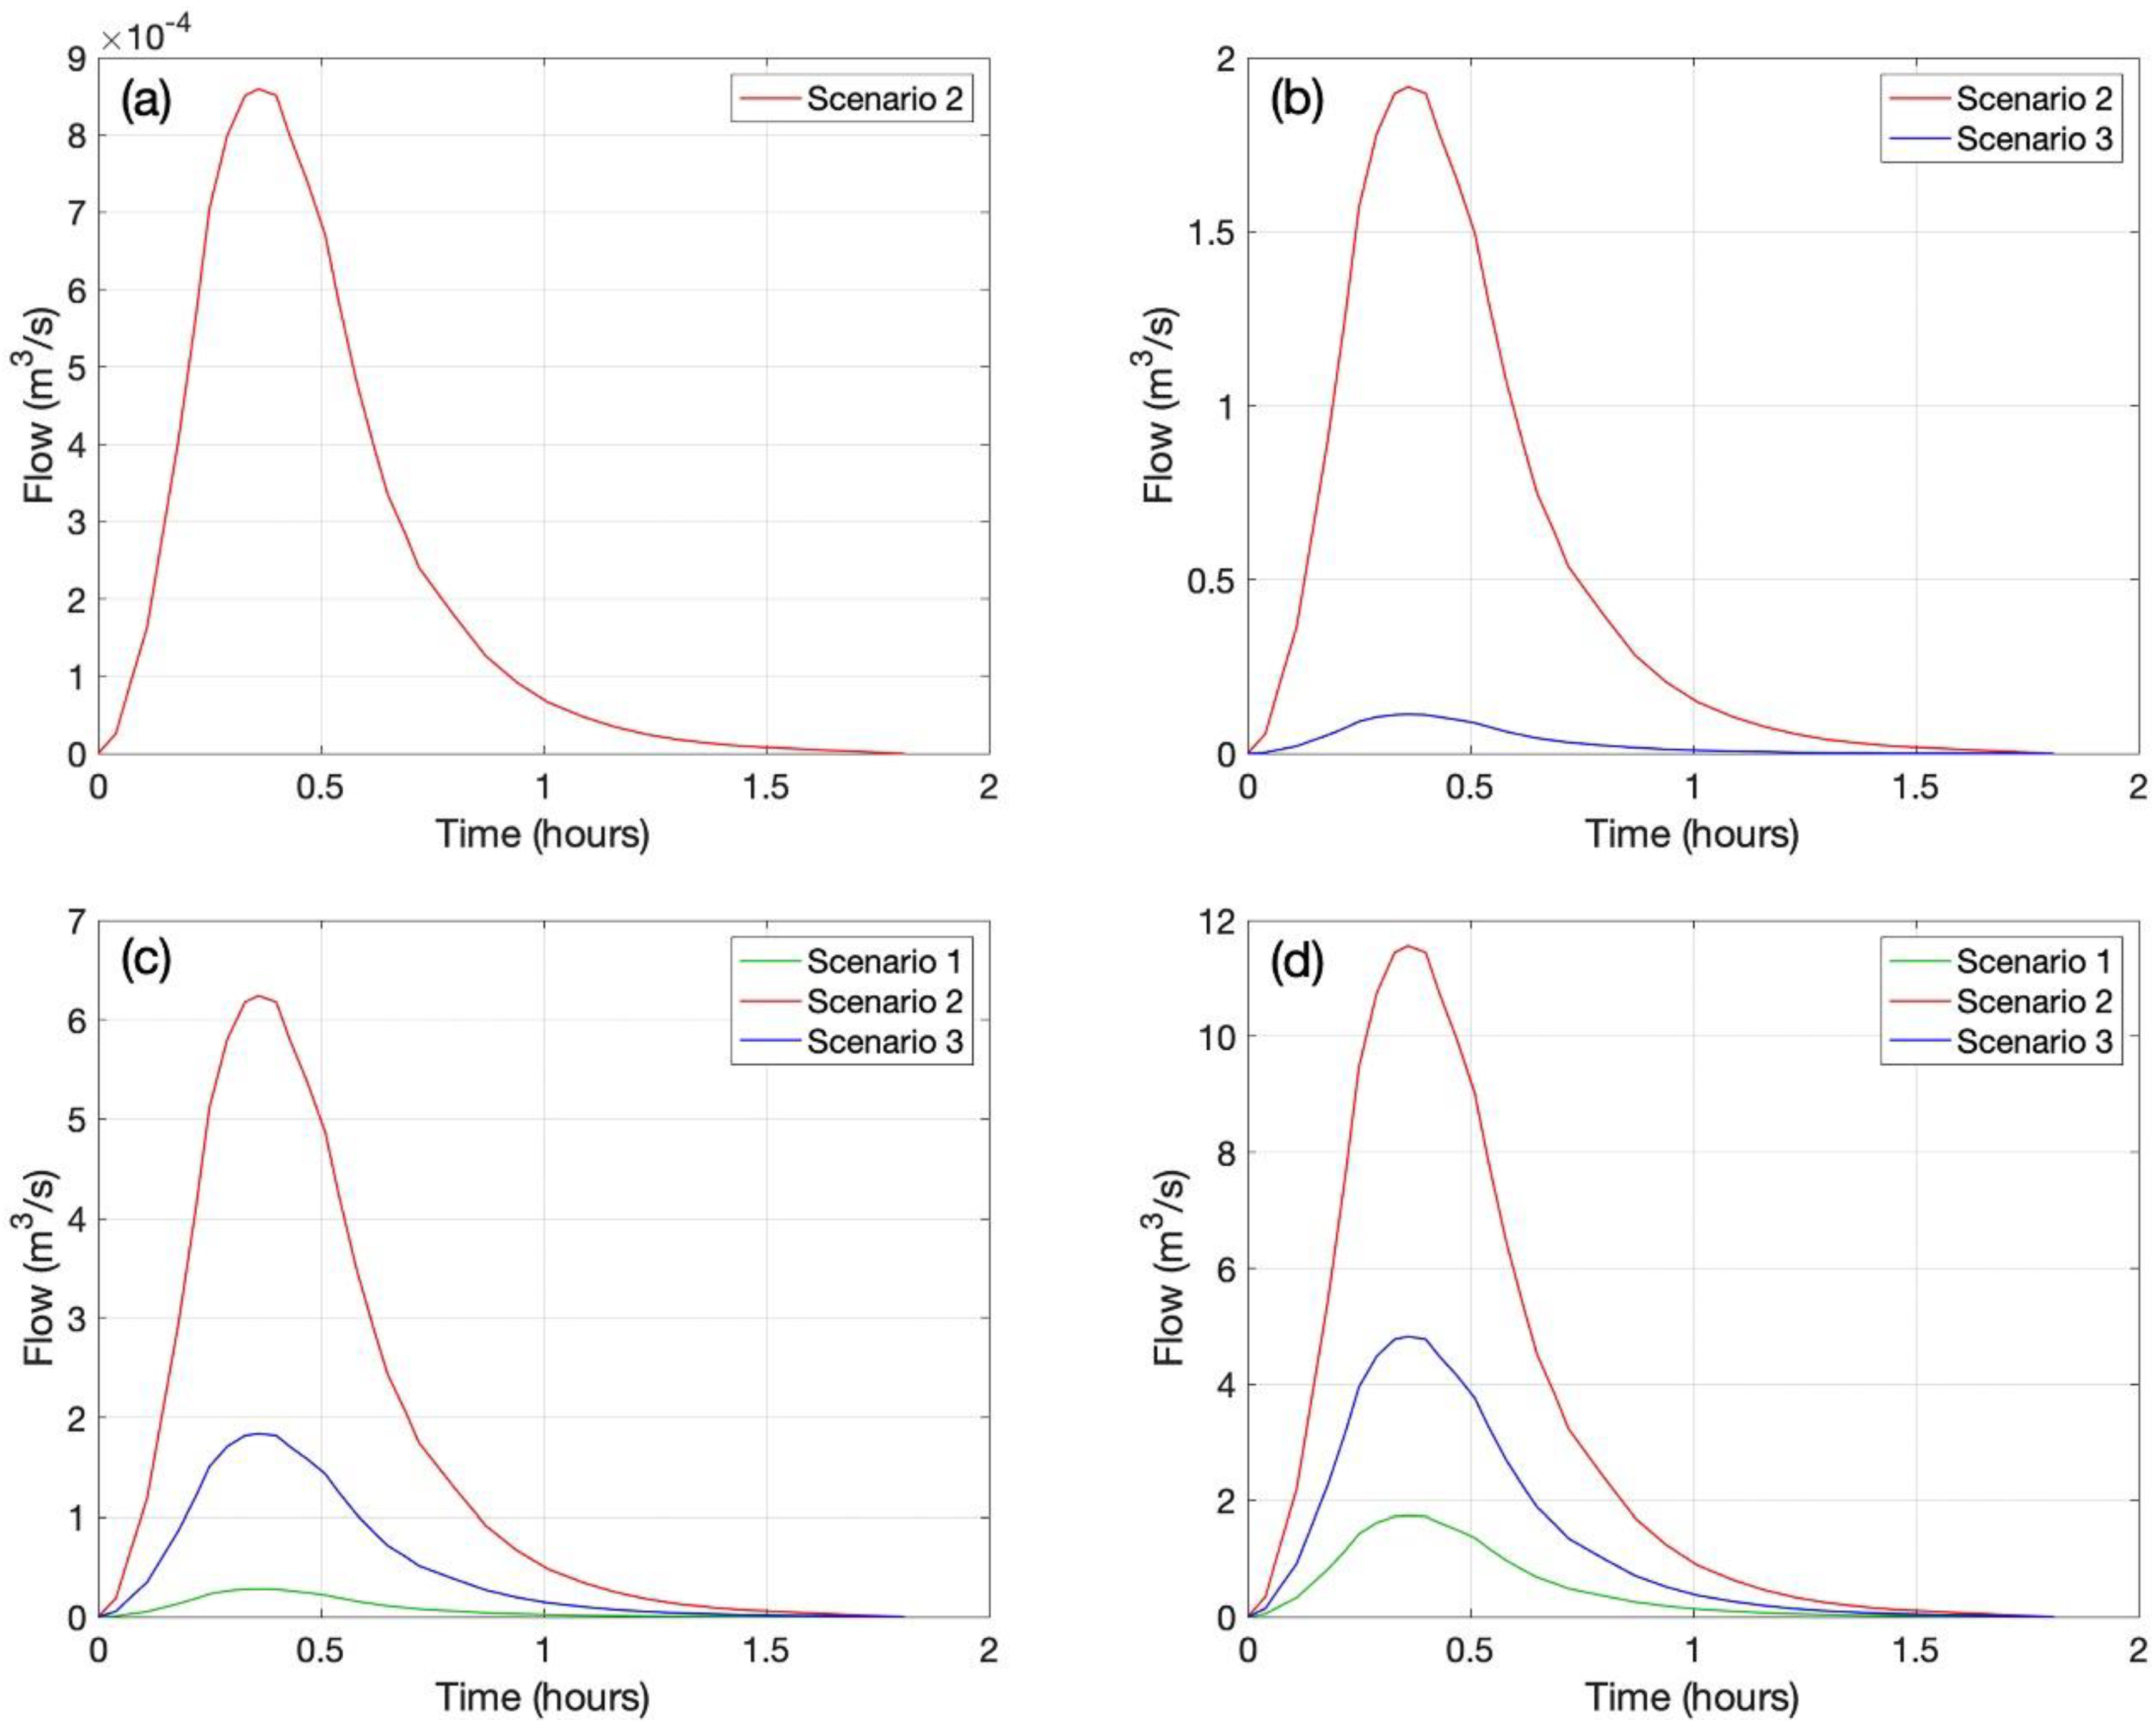
As indicated before, the design hydrographs for each analysis scenario were determined using the SCS unit hydrograph. Figure 6 shows that the runoff variation is a function of modeling scenarios 1, 2, and 3.
The lowest runoff was calculated for the pre-developed watershed (unaltered natural watershed, scenario 1) for the return periods analyzed. The runoff generated for urbanized conditions (current urban watershed, scenario 2) was the highest. Likewise, by incorporating conservation measures and green infrastructure in the urban area (combined infrastructure, scenario 3), it is possible to significantly reduce maximum runoff volumes and, with this, reduce the damage to infrastructure due to flooding and increase the potential for retention of runoff for its use. Peak discharges for the 10 and 20-year return periods of scenario 3 represent only 29, and 42%, respectively, of the maximum discharge estimated for scenario 2. This allows us to conclude that, by incorporating conservation measures and green infrastructure in new urbanizations such as residential areas, stormwater would be considerably reduced, allowing the urban drainage pipe diameter and possible flood areas to be diminished. On the other hand, the maximum peak discharge (scenario 1) for the return periods of 10 and 20 years shows an increase of 553, and 177%, respectively, concerning the maximum discharge of scenario 3. It demonstrates that, as the return period increases, the difference in the maximum peak discharges tends to decrease. For the return period of 5 years, the runoff volume in scenario 2 was 3299 m3, while for scenario 3 there was a runoff volume of 194 m3. In other words, the green infrastructure and conservation measures proposed had a significant impact in reducing the runoff, since the volume was reduced by 94.1%. For the 10-year return period in scenarios 2 and 3, the runoff volume was 10,743 m3 and 3161 m3, respectively. Combined gray and green infrastructure had a lower impact than in the previous case ( T r , 5 years), but the reduction in runoff volume is still important (70.6%). Finally, for the 20-year return period, in scenarios 2 and 3, the reduction in runoff volume due to the incorporation of green infrastructure was 58.3%.

4. Discussion

4.1. Conservation Measures (RWH)

Harvesting rainwater on the roofs of dwellings is an economical and useful option as a conservation measure, and manages the volume that runs off roads and discharges to sewage [5,58]. In this study, rainfall with an exceedance probability of 75% was considered the most critical case for determining minimum water storage conditions, since it concentrates 86% of the rainfall in 5 months throughout the year (May–September). Although the collection volumes of 60 m2 of the rooftop can partially replace the necessary consumption in the dwelling (between 1.07 m3/month and 2.04 m3/month), its versatility of use for domestic purposes, such as cleaning, hygiene, and irrigation of green areas, among others, makes it an effective alternative to mitigate shortage problems [8,12,59] and enhances the water security of its users [60,61].
This study highlights the potential for an interception on the roofs of the entire residential area (dwelling and commercial area) as an alternative to reduce the volume of surface runoff and mitigate the population’s water scarcity. The results indicate that, for each m2 of the collection area, it is possible to intercept 0.012 m3/m. These results were compared with data obtained in other study areas to evaluate its application’s generality in similar residential areas with a semi-arid climate (Table 6).
The table above shows the rainy season’s temporal variability and the amount of precipitation in different semi-arid areas (113.7–700 mm). These conditions may limit the potential to harvest sufficient volumes to satisfy domestic consumer demand (34–100%); however, their potential to mitigate surface runoff is still relevant (0.00029–0.136 m3/m2). In this study, the RWH intercepted on rooftops is equivalent to a total volume of 56,468 m3/a in 25.98% of the watershed (0.3715 km2). This alternative represents an opportunity to reduce the runoff volume that saturates the hydraulic network (gray infrastructure), incorporating a partial solution to mitigate water scarcity for the population. Also, if the dwelling’s garden is adapted utilizing an infiltration trench (an example of GI), the infiltration capacity and recharge of the subsoil could be increased [26,62]. There is evidence that the adoption of GI at the household level could augment stormwater retention volumes. For example, Palla et al. [63] reported that the average peak discharge and volume reduction rates of implementing RWH systems in a residential urban area were 33% and 26%, respectively. In a recent study, Tamagnone et al. [20] concluded that RWH, at the basin scale, could reduce flow peak and runoff volume by 13% and 8%, respectively.
This study hypothesizes that implementing these combined strategies (conservation measures and green infrastructure in the dwelling) in new residential developments represents an excellent opportunity to favor the sustainable management of rainwater. Another benefit is to promote its self-consumption as an alternative to mitigate problems of scarcity and flooding, especially in places where there is overexploitation of water resources, long periods of drought, and flash rain events.

4.2. Green Infrastructure

This study determined theoretically that, by modifying the land’s natural conditions (scenario 1), not only its geomorphology is altered, but the hydraulic infrastructure may be insufficient to capture runoff due to the waterproofing of its surface (scenario 2). As an alternative to mitigate this problem, it is recommended to adopt green infrastructures (GI) such as infiltration trenches or bioretention systems in common green areas. GI can increase the capacity for stormwater volume capture and detention within urban watersheds [27,28]. Further, GI is capable of restoring the predevelopment hydrologic cycle in semi-arid urban areas [32]. For this, local morphological conditions such as street slopes, their lengths, geometry, and the terrain’s roughness must be considered [26,64]. This analysis allows us to recommend design return periods between 2 and 5 years [34,65] and up to 10 years [50] to obtain design parameters and green infrastructure dimensioning. From the results analysis, it is recommended to consider T r = 10 years, since it represents 94.1% in the reduction of runoff, with a design rainfall of 20.6 mm, concentration-time of 12.84 min, and peak time of 21.71 min. These design parameters were useful not only in this proposal, but they can be adapted in the planning of new dwelling developments where the implementation of green infrastructure to mitigate surface runoff and the dimensioning of hydraulic infrastructure for conducting storm drainage is taken into account from its conception. In Connecticut, peak flow mitigation of similar GI was 65% [66], while in Australia, it was 80–90% [67]. In their study, Schubert et al. [33] compared gray infrastructure vs. green infrastructure scenarios and determined that GI can reduce downstream flooded areas by 29%. In Washington, Chapman and Horner [68] reported that a street-side bioretention facility could achieve 26–52% of runoff retention in real-weather conditions. Furthermore, the extraordinary potential represented by the adaptation of conservation measures in dwellings, in conjunction with green infrastructure, was observed, since part of the runoff is intercepted for self-consumption or can be infiltrated into private and public green areas [27,68].
First, the results of this study highlight the negative effect of the current urbanization style, since the urban hydrological cycle is adversely modified [69]. Second, our work confirms the positive effects of adopting resilient water strategies. The benefits of GI adaptation are that it can easily link with the pre-existing gray infrastructure [34]. For this reason, cities around the world are implementing them, often after a weather-related crisis [70]. These strategies are a compelling necessity in the current climatic change context, especially in arid and semi-arid zones. Land-use based modeling was applied at the simulation level to a semi-arid region of Brazil, and it was found that green infrastructure strategies would reduce flooded areas and impacts [71,72]. According to Barros-Ramalho-Alves et al. [72], such prediction methodologies can support both long-term urban planning and water resource management. Lastly, the parameters proposed in this study ( T r , T c , Q, R t and R e ) may be useful for the design and planning of sustainable stormwater infrastructure in new developments in urban areas with no precise rainfall information (hourly rainfall, rainfall intensity).

5. Conclusions

Although it is clear that urban waterproofing of surfaces negatively affects the hydrological cycle, it is vital to determine the potential of urban infrastructure to mitigate surface runoff. If the infrastructure adopts a sustainable approach, it can be a useful tool to reduce water scarcity problems in the home and offer self-management alternatives (such as the storage of surface runoff for green areas).
This study analyzed the hydraulic efficiency of combining strategies such as RWH for domestic consumption and GI in gardens and public areas in runoff mitigation. Design parameters such as return period, design rainfall, concentration-time, and peak time were necessary to propose RHW and GI adaptation in new residential areas to be constructed in semi-arid zones. This adaptation will facilitate dimensioning of the hydraulic infrastructure, mitigate the problem of flooding, and efficiently manage urban runoff to natural infiltration areas, preventing its discharge and mixing with public drainage.
Among the limitations of this study, the following should be mentioned: (a) the capacity of RWH for self-consumption in dwelling depends partially on the catchment area (rooftop area), so in new facilities, this will be decisive for sizing the appropriate storage tank, and (b) location, selection and dimensioning of GI should be analyzed before considering the design of the drainage network, since its hydraulic capacity to mitigate floods will depend on these factors.

Author Contributions

Conceptualization, C.A.B.-A. and L.L.-M.; methodology, R.O.-G. and L.L.-M.; investigation, L.D.L.-L.; writing—original draft preparation, L.L.-M., R.O.-G. and C.A.B.-A.; writing—review and editing, G.A.V.-R. All authors have read and agreed to the published version of the manuscript.

Funding

This research received no external funding.

Acknowledgments

The review comments of the four anonymous reviewers also greatly improved the presentation of this work.

Conflicts of Interest

The authors declare no conflict of interest.

References and Notes

  1. Neibaur, E.E.; Anderson, E.P. An examination of factors affecting sustainability of domestic rainwater harvesting systems in a rural, semi-arid region of Mexico. Water Sci. Technol. Water Supply 2016, 16, 1388–1397. Available online: http://iwaponline.com/ws/article-pdf/16/5/1388/411691/ws016051388.pdf (accessed on 1 October 2020). [CrossRef]
  2. Lane, L.J.; Nichols, M.H. Semi-arid climates and terrain. Environ. Geol. 1999. [Google Scholar] [CrossRef]
  3. Scanlon, B.R. Evaluation of Methods of Estimating Recharge in Semiarid and Arid Regions in the Southwestern U.S.; Water Science and Applications, Series; Groundwater recharge in a desert environment: The southwestern United States; Hogan, J.F., Phillips, F.M., Scanlon, B.R., Eds.; AGU: Washington, DC, USA, 2004. [Google Scholar] [CrossRef]
  4. Pontifes, P.A.; García-Meneses, P.M.; Gómez-Aísa, L.; Monterroso-Rivas, A.I.; Caso-Chávez, M. Land use/land cover change and extreme climatic events in the arid and semi-arid ecoregions of Mexico. Atmósfera 2018, 31, 355–372. [Google Scholar] [CrossRef] [Green Version]
  5. Liu, W.; Chen, W.; Peng, C. Assessing the effectiveness of green infrastructures on urban flooding reduction: A community scale study. Ecol. Model. 2014, 291, 6–14. [Google Scholar] [CrossRef]
  6. Sanches-Fernandes, L.F.; Terêncio, D.P.S.; Pacheco, F.A.L. Rainwater harvesting systems for low demanding applications. Sci. Total Environ. 2015, 529, 91–100. [Google Scholar] [CrossRef]
  7. Yannopoulos, S.; Giannopoulou, I.; Kaiafa-Saropoulou, M. Investigation of the Current Situation and Prospects for the Development of Rainwater Harvesting as a Tool to Confront Water ScarcityWorldwide. Water 2019, 11, 2168. [Google Scholar] [CrossRef] [Green Version]
  8. Abdulla, F.A.; Al-Shareef, A.W. Roof rainwater harvesting systems for household water supply in Jordan. Desalination 2009, 243, 195–207. [Google Scholar] [CrossRef]
  9. Molaei, O.; Kouchakzadeh, M.; Fashi, F.H. Evaluation of rainwater harvesting performance for water supply in cities with cold and semi-arid climate. Water Supply. 2019, 19, 1322–1329. Available online: http://iwaponline.com/ws/article-pdf/19/5/1322/571141/ws019051322.pdf (accessed on 29 January 2020). [CrossRef] [Green Version]
  10. Campisano, A.; Gnecco, I.; Modica, C.; Palla, A. Designing domestic rainwater harvesting systems under different climatic regimes in Italy. Water Sci. Technol. Water Supply 2013, 67, 2511–2518. Available online: http://iwaponline.com/wst/article-pdf/67/11/2511/440343/2511.pdf (accessed on 16 December 2019). [CrossRef]
  11. US Environmental Protection Agency (US EPA). Guidelines for Water Reuse, EPA Report 625-R-04-108; US Environmental Protection Agency: Washington, DC, USA, 2004. Available online: https://www.epa.gov/sites/production/files/2019-08/documents/2004-guidelines-water-reuse.pdf (accessed on 21 January 2020).
  12. Nnaji, C.C.; Mama, N.C. Preliminary assessment of rainwater harvesting potential in Nigeria: Focus on flood mitigation and domestic water supply. Water Resour. Manag. 2014, 28, 1907–1920. [Google Scholar] [CrossRef]
  13. Jing, X.; Zhang, S.; Zhang, J.; Wang, Y.; Wang, Y. Assessing efficiency and economic viability of rainwater harvesting systems for meeting non-potable water demands in four climatic zones of China. Resour. Conserv. Recycl. 2017, 126, 74–85. [Google Scholar] [CrossRef]
  14. Lizárraga-Mendiola, L.; Vázquez-Rodríguez, G.; Blanco-Piñón, A.; Rangel-Martínez, Y.; González-Sandoval, M. Estimating the Rainwater Potential per Household in an Urban Area: Case Study in Central Mexico. Water 2015, 7, 4622–4637. [Google Scholar] [CrossRef] [Green Version]
  15. AbdelKhaleq, R.A.; Ahmed, I.A. Rainwater harvesting in ancient civilizations in Jordan. Water Sci. Technol. Water Supply 2007, 7, 85–93. [Google Scholar] [CrossRef]
  16. Kahinda, J.M.; Taigbenu, A.E.; Boroto, R.J. Domestic rainwater harvesting as an adaptation measure to climate change in South Africa. Phys. Chem. Earth 2010, 35, 742–751. [Google Scholar] [CrossRef]
  17. Tabatabaee, J.; Han, M.Y. Rainwater harvesting potentials for drought mitigation in Iran. Water Sci. Technol. Water Supply 2010, 64, 816–821. Available online: http://iwaponline.com/wst/article-pdf/62/4/816/446434/816.pdf (accessed on 13 March 2020). [CrossRef]
  18. Shokory, J.A.N.; Rabanizada, E. Sustainable household water-saving and demand management options for Kabul City. IOP Conf. Ser. Earth Environ. Sci. 2020, 511, 012003. [Google Scholar] [CrossRef]
  19. Pereira-Lindoso, D.; Eiró, F.; Bursztyn, M.; Rodrigues-Filho, S.; Nasuti, S. Harvesting Water for Living with Drought: Insights from the Brazilian Human Coexistence with Semi-Aridity Approach towards Achieving the Sustainable Development Goals. Sustainability 2018, 10, 622. [Google Scholar] [CrossRef] [Green Version]
  20. Tamagnone, P.; Comino, E.; Rosso, M. Rainwater harvesting techniques as an adaptation strategy for flood mitigation. J. Hydrol. 2020, 586, 124880. [Google Scholar] [CrossRef]
  21. Fry, T.J.; Maxwell, R.M. Evaluation of distributed BMPs in an urban watershed—High resolution modeling for stormwater management. Hydrol. Process. 2017, 31, 2700–2712. [Google Scholar] [CrossRef]
  22. Graham, P.; Maclean, L.; Medina, D.; Patwardhan, A.; Vasarhelyi, G. The role of water balance modeling in the transition to low impact development. Water Qual. Res. J. Can. 2004, 39, 331–342. Available online: https://www.cawq.ca/journal/temp/article/121.pdf (accessed on 16 November 2019). [CrossRef] [Green Version]
  23. Winston, R.J.; Dorsey, J.D.; Hunt, W.F. Quantifying volume reduction and peak flow mitigation for three bioretention cells in clay soils in northeast Ohio. Sci. Total Environ. 2016, 553, 83–95. [Google Scholar] [CrossRef] [PubMed]
  24. Baek, S.S.; Choi, D.H.; Jung, J.W.; Lee, H.J.; Lee, H.; Yoon, K.S.; Cho, K.H. Optimizing low impact development (LID) for stormwater runoff treatment in urban area, Korea: Experimental and modeling approach. Water Res. 2015, 86, 122–131. [Google Scholar] [CrossRef] [PubMed]
  25. Jiang, H.; Yao, H.; Tang, Y.; Yu, S.L.; Field, R.; Tafuri, A.N. LID-BMPs planning for urban runoff control and the case study in China. J. Environ. Manag. 2015, 149, 65–76. [Google Scholar] [CrossRef]
  26. Martin-Mikle, C.J.; de Beurs, K.M.; Julian, J.P.; Mayer, P.M. Identifying priority sites for low impact development (LID) in a mixed-use watershed. Landsc. Urban Plan. 2015, 140, 29–41. [Google Scholar] [CrossRef] [Green Version]
  27. Chaffin, B.C.; Shuster, W.D.; Garmestani, A.S.; Furio, B.; Albro, S.L.; Gardiner, M.; Spring, M.; Odom-Green, O. A tale of two rain gardens: Barriers and bridges to adaptive management of urban stormwater in Cleveland, Ohio. J. Environ. Manag. 2016, 183, 431–441. [Google Scholar] [CrossRef] [PubMed]
  28. Zölch, T.; Henze, L.; Keilholz, P.; Pauleit, S. Regulating urban surface runoff through nature-based solutions—An assessment at the micro-scale. Environ. Res. 2017, 157, 135–144. [Google Scholar] [CrossRef]
  29. Yao, L.; Chen, L.; Wei, W.; Sun, R. Potential reduction in urban runoff by green spaces in Beijing: A scenario analysis. Urban For. Urban Green. 2015, 14, 300–308. [Google Scholar] [CrossRef]
  30. Dreelin, E.A.; Fowler, L.; Ronald Carroll, C. A test of porous pavement effectiveness on clay soils during natural storm events. Water Res. 2006, 40, 799–805. [Google Scholar] [CrossRef]
  31. Alfredo, K.; Montalto, F.; Goldstein, A. Observed and modeled performances of prototype green roof test plots subjected to simulated low-and high-intensity precipitations in a laboratory experiment. J. Hydrol. Eng. 2009, 15, 444–457. [Google Scholar] [CrossRef]
  32. Feng, Y.; Burian, S.; Pomeroy, C. Potential of green infrastructure to restore predevelopment water budget of a semi-arid urban catchment. J. Hydrol. 2016, 542, 744–755. [Google Scholar] [CrossRef]
  33. Schubert, J.E.; Burns, M.J.; Fletcher, T.D.; Sanders, B.F. A framework for the case-specific assessment of Green Infrastructure in mitigating urban flood hazards. Adv. Water Resour. 2017, 108, 55–68. [Google Scholar] [CrossRef]
  34. Rodríguez-Sinobas, L.; Zubelzu, S.; Perales-Momparler, S.; Canogar, S. Techniques and criteria for sustainable urban stormwater management. The case study of Valdebebas (Madrid, Spain). J. Clean. Prod. 2018, 172, 402–416. [Google Scholar] [CrossRef]
  35. Guizani, M. Storm Water Harvesting in Saudi Arabia: A Multipurpose Water Management Alternative. Water Resour. Manag. 2016, 30, 1819–1833. [Google Scholar] [CrossRef]
  36. Newburn, D.A.; Alberini, A. Household response to environmental incentives for rain garden adoption. Water Resour. Res. 2016, 1345–1357. [Google Scholar] [CrossRef] [Green Version]
  37. National Institute of Statistical Geography and Informatics (INEGI). Geographic Synthesis of the State of Hidalgo; National Institute of Statistical Geography and Informatics: Hidalgo, Mexico, 1992; 17p, ISBN 968-892-711-2. Available online: https://www.inegi.org.mx/contenido/productos/prod_serv/contenidos/espanol/bvinegi/productos/historicos/2104/702825220945/702825220945_1.pdf (accessed on 3 April 2020). (In Spanish)
  38. National Water Commission (CONAGUA). National Climatological Database (Sistema CLICOM); CONAGUA: Jalisco, Mexico, 2020; Available online: https://smn.conagua.gob.mx/es/climatologia/informacion-climatologica/informacion-estadistica-climatologica (accessed on 23 April 2020). (In Spanish)
  39. Google Earth Pro (7.0 beta). Location of the study area, Mineral de la Reforma, Hidalgo, Mexico. 20º04′30″ N, 98º43′30″ W. Eye alt 8.61 km. INEGI, DigitalGlobe 2020. Available online: https://earth.google.com/web/search/Mineral+de+la+Reforma,+Hgo./@20.08259671,-98.72506043,2427.3336312a,3573.127323d,35y,-0h,0t,0r/data=CigiJgokCfYvmUsLZyRAEfMlFiXLpzDAGdOE8fF0LRPAIbbZ8kFguFDA (accessed on 8 April 2020).
  40. Location of the Study Area: 20°04′30″ N, 98°43′30″ W. Data layers: Topography, land use, drainage basin. May 13, 2020. Using: Global Mapper Ink. v20.1, Blue Marble Geographics.
  41. Location of the Study Area: 20°04′30″ N, 98°43′30″ W. Data layers: Topography. May 15, 2020. Using: ARCHICAD Graphisoft 24.0.
  42. Schneider, S. Capture and rainwater storage. In Technical Options for Family Farming in Latin America and the Caribbean; Food and Agriculture Organization of the United Nations (FAO): Santiago, Chile, 2016; 270p, Available online: http://www.fao.org/3/a-i5534e.pdf (accessed on 11 June 2020).
  43. Kite, G.W. Frequency and Risk Analyze in Hydrology; Water Resources Publications LLC: Highlands Ranch, CO, USA, 2019; 266p, ISBN 978-1-887201-95-7. [Google Scholar]
  44. National Water Commission (CONAGUA). Technical Guidelines: Collection System for Rainwater for the Supply of Drinking Water at the Household Level; CONAGUA: Mexico City, Mexico, 2016; 42p, Available online: https://www.gob.mx/cms/uploads/attachment/file/152776/LINEAMIENTOS_CAPTACI_N_PLUVIAL.pdf (accessed on 2 February 2020). (In Spanish)
  45. Semaan, M.; Day, S.D.; Garvin, M.; Ramakrishnan, N.; Pearce, A. Optimal sizing of rainwater harvesting systems for domestic water usages: A systematic literature review. Resour. Conserv. Recycl. 2020, 6, 100033. [Google Scholar] [CrossRef]
  46. Hayes, D.C.; Young, R.L. Comparison of Peak Discharge and Runoff Characteristic Estimates from the Rational Method to Field Observations for Small Basins in Central Virginia; Scientific Investigations Report 2005-5254; U.S. Department of the Interior, U.S. Geological Survey: Reston, VA, USA, 2006. Available online: https://pubs.usgs.gov/sir/2005/5254/sir05_5254.pdf (accessed on 3 April 2020).
  47. Chow, V.T.; Maidment, D.R.; Mays, L.W. Applied Hydrology; McGraw Hill: New York, NY, USA, 1988. [Google Scholar]
  48. Natural Resources Conservation Service (NRCS). Part 630 Hydrology National Engineering Handbook; Chapter 16, Hydrographs; Natural Resources Conservation Service: Washington, DC, USA, 2007. Available online: https://directives.sc.egov.usda.gov/OpenNonWebContent.aspx?content=17755.wba (accessed on 9 April 2020).
  49. Soil Conservation Service (SCS). Urban Hydrology for Small Watersheds; Technical Release 55; Soil Conservation Service: Washington, DC, USA, 1986. Available online: https://www.nrcs.usda.gov/Internet/FSE_DOCUMENTS/stelprdb1044171.pdf (accessed on 13 May 2020).
  50. Témez, J.R. Facets of the hydrometeorological and statistical calculation of maximum flows. Public Works Mag. 2003, 3, 47–51. [Google Scholar]
  51. National Water Commission (CONAGUA). Hydrology Instructions to Determine the Ordinary Maximum Peak Discharge Associated with the Delimitation of the Federal Zone; CONAGUA: Mexico City, Mexico, 1987; 140p, Available online: http://dimsec.com/wp-content/uploads/2017/09/INSTRUCTIVO-HIDROLOG%C3%8DA.pdf (accessed on 1 June 2020). (In Spanish)
  52. United States Department of Agriculture (USDA). Chapter 15, Time of Concentration. Part 630 Hydrology, 2010, National Engineering Handbook. Available online: https://directives.sc.egov.usda.gov/OpenNonWebContent.aspx?content=27002.wba (accessed on 3 July 2020).
  53. Pérez-Sesma, J.A.; Maderey-Rascón, L.E.; Pereyra-Díaz, D.; Filobello-Niño, U.A. Estimation of flood design using the instantaneous hydrograph unit: A case study of the Tecolutla river watershed, Mexico. Geogr. Res. 2012, 79, 20–38. Available online: http://www.scielo.org.mx/pdf/igeo/n79/n79a3.pdf (accessed on 11 February 2020).
  54. Gericke, O.J.; Smithers, J.C. Review of methods used to estimate catchment response time for the purpose of peak discharge estimation. Hydrol. Sci. J. 2014, 59, 1935–1971. [Google Scholar] [CrossRef]
  55. Eaton, T.T. Approach and case-study of green infrastructure screening analysis for urban stormwater control. J. Environ. Manag. 2018, 209, 495–504. [Google Scholar] [CrossRef] [PubMed]
  56. Woznicki, S.A.; Hondula, K.L.; Jarnagin, S.T. Effectiveness of landscape-based green infrastructure for stormwater management in suburban catchments. Hydrol. Process. 2018, 32, 2346–2361. [Google Scholar] [CrossRef] [Green Version]
  57. Li, C.M.; Liu, M.; Hu, Y.; Zhou, R.; Wu, W.; Huang, N. Evaluating the runoff storage supply-demand structure of green infrastructure for urban flood management. J. Clean. Prod. 2021, 280, 124420. [Google Scholar] [CrossRef]
  58. Alim, M.; Rahman, A.; Tao, Z.; Samali, B.; Khan, M.M.; Shirin, S. Feasibility analysis of a small-scale rainwater system for drinking water production at Werrington, New South Wales, Australia. J. Clean Prod. 2020, 270, 122437. [Google Scholar] [CrossRef]
  59. Chapa, F.; Krauss, M.; Hack, J. A multi-parameter method to quantify the potential of roof rainwater harvesting at regional levels in areas with limited rainfall data. Resour. Conserv. Recycl. 2020, 161, 104959. [Google Scholar] [CrossRef]
  60. Escalante-Sandoval, C.; Reyes-Chávez, L. Regional estimation of design peak discharge. J. Hydraul. Eng. Mex. 2000, XV, 47–61. [Google Scholar]
  61. Akter, A.; Tanim, A.H.; Islam, M.K. Possibilities of urban flood reduction through distributed-scale rainwater harvesting. Water Sci. Eng. 2020, 13, 95–105. [Google Scholar] [CrossRef]
  62. Rashidi-Mehrabadi, M.H.; Saghafian, B.; Haghighi-Fashi, F. Assessment of residential rainwater harvesting efficiency for meeting non-potable water demands in three climate conditions. Resour. Conserv Recy. 2013, 73, 86–93. Available online: http://dx.doi.org/10.1016/j.resconrec.2013.01.015 (accessed on 30 November 2020). [CrossRef]
  63. Palla, A.; Gnecco, I.; La, B.P. The impact of domestic rainwater harvesting systems in storm water runoff mitigation at the urban block scale. J. Environ. Manag. 2017, 191, 297–305. [Google Scholar] [CrossRef] [PubMed]
  64. Kisakye, V.; Van der Bruggen, B. Effects of climate change on water savings and water security from rainwater harvesting systems. Resour. Conserv. Recycl. 2018, 138, 49–63. [Google Scholar] [CrossRef]
  65. Shevade, L.J.; Lo, L.J.; Montalto, F.A. Numerical 3D Model Development and Validation of Curb-Cut Inlet for Efficiency Prediction. Water 2020, 12, 1791. [Google Scholar] [CrossRef]
  66. Dietz, M.E.; Clausen, J.C. A field evaluation of rain garden flow and pollutant treatment. Water Air Soil Pollut. 2005, 167, 123–138. [Google Scholar] [CrossRef]
  67. Hatt, B.E.; Fletcher, T.D.; Deletic, A. Hydrologic and pollutant removal performance of stormwater biofiltration systems at the field scale. J. Hydrol. 2009, 365, 310–321. [Google Scholar] [CrossRef]
  68. Chapman, C.; Horner, R.R. Performance assessment of a street-drainage bioretention system. Water Environ. Res. 2010, 82, 109–119. [Google Scholar] [CrossRef] [PubMed]
  69. Brown, S.A.; Schall, J.D.; Morris, J.L.; Doherty, C.L.; Stein, S.M.; Warner, J.C. Urban Drainage Design Manual: Hydraulic Engineering Circular No. 22, 3rd ed.; Federal Highway Administration: Washington, DC, USA, 2016. Available online: https://www.fhwa.dot.gov/engineering/hydraulics/pubs/10009/10009.pdf (accessed on 1 June 2020).
  70. Mahaut, V.; Andrieu, H. Relative influence of urban-development strategies and water management on mixed (separated and combined) sewer overflows in the context of climate change and population growth: A case study in Nantes. Sustain. Cities Soc. 2019, 44, 171–182. [Google Scholar] [CrossRef]
  71. Zúñiga-Terán, A.A.; Staddon, C.; de Vito, L.; Gerlak, A.K.; Ward, S.; Schoeman, Y.; Hart, A.; Booth, G. Challenges of mainstreaming green infrastructure in built environment professions. J. Environ. Plan. Manag. 2020, 63, 710–732. [Google Scholar] [CrossRef]
  72. Barros-Ramalho-Alves, P.; Alexandra Alves Rufino, I.; Hermínio Cunha Feitosa, P.; Djordjević, S.; Javadi, A. Land-Use and Legislation-Based Methodology for the Implementation of Sustainable Drainage Systems in the Semi-Arid Region of Brazil. Sustainability 2020, 12, 661. [Google Scholar] [CrossRef] [Green Version]
Figure 1. Location of the study area: (a) unaltered natural watershed, and (b) definition of soil use at the current urban watershed. P1 shows the deviation of runoff from the north of the watershed; P2 corresponds to one of the common green spaces; P3 shows a typical house with its garden area.
Water 13 00045 g001
Figure 2. (a) Mean monthly rainfall and temperature. (b) Annual rainfall.
Water 13 00045 g002
Figure 3. Urban scenarios analyzed: (a) existing gray infrastructure (scenario 2), and (b) gray infrastructure plus conservation measures (rainwater harvesting) at the dwelling scale, and green infrastructure (bioretention systems, infiltration trenches) in private and common green areas (scenario 3). Pw, potable water; Raw, sewage; Rw, rainwater; Iw, infiltration; Evt, evapotranspiration; Smw, stormwater; Pow, polluted runoff; IT, infiltration trench.
Water 13 00045 g003
Figure 4. Fitting of the probability distributions to the mean monthly rainfall data for June in the function of the return period.
Water 13 00045 g004
Figure 5. Fitting the distribution functions to the data of maximum daily rainfall in 24-h in the function of the return period.
Water 13 00045 g005
Figure 6. Design hydrographs for the simulated scenarios and return periods analyzed. (a) T r = 2 years; (b) T r = 5 years; (c) T r = 10 years; (d) T r = 20 years.
Water 13 00045 g006
Table 1. Input parameters of proposed scenarios to determine their flooding mitigation and self-consumption potential.
Input ParameterScenario 1Scenario 2Scenario 3
Watershed area (km2)1.431.431.43
Slope (%)9.59.59.5
Length (m)141414141414
Soil useGrassland area
(1.43 km2)
Grassland area (0.7026 km2)
Dwelling (0.3105 km2)
Sidewalks (0.0450 km2)
Asphalt roadways (0.2860 km2)
Commercial area
(0.0610 km2)
Ridges
(0.0109 km2)
Public green areas
(0.0140 km2)
Grassland area (0.7026 km2)
Dwelling
(0.0 km2)
Sidewalks (0.0450 km2)
Asphalt roadways (0.2860 km2)
Commercial area
(0.0 km2)
Ridges
(0.0109 km2)
Public green areas
(0.0140 km2)
Soil typePhaeozemPhaeozemSandy soil *
VegetationXerophileXerophileXerophile
* [26].
Table 2. Average monthly rainfall with probabilities of occurrence of 50%, 60%, and 75% (mm).
MonthRainfall (mm)Rainwater Harvested Volume (m3)
MeanStdDevR50R60R75Vc50Vc60Vc75
Jan9.1014.007.104.000.000.380.210.00
Feb7.7013.805.602.600.000.300.140.00
March14.1021.1011.006.300.000.590.340.00
Apr29.4023.5025.9020.7012.801.401.120.69
May40.4028.8036.1029.7019.801.951.611.07
Jun65.6038.9059.9051.2037.903.232.772.04
Jul59.4043.7053.0043.3028.302.862.341.53
Aug51.4032.8046.5039.3028.002.512.121.51
Sep62.2043.3055.8046.2031.403.012.501.69
Oct33.1032.5028.3021.109.901.531.140.54
Nov10.6014.108.605.400.600.460.290.03
Dec5.707.704.602.900.200.250.160.01
Total388.70 342.30272.60168.9018.4814.729.12
Table 3. Maximum rainfall in 24 h ( H p ) and rainfall ( R t ) for the time of concentration and different return periods ( T r ).
Tr (years)Hp (mm)Rt (mm)
231.7012.33
553.0020.61
1072.6028.24
2089.9034.98
Table 4. Effective rainfall ( R e ) corresponding to the concentration-time ( t c ) for different return periods ( T r ).
Tr (years) Scenario 1
Re1 (mm)
Scenario 2
Re2 (mm)
Scenario 3
Re3 (mm)
20.000.000.00
50.001.030.06
100.153.360.99
200.946.232.60
Table 5. Peak discharges (Q) determined by the Rational method for the analyzed scenarios and different return periods ( T r ).
Tr (years) Scenario 1
Q1 (m3/s)
Scenario 2
Q2 (m3/s)
Scenario 3
Q3 (m3/s)
20.0000.0010.000
50.0001.9160.113
100.2816.2411.836
201.74311.5604.824
Table 6. Comparison of RWH approaches in different semi-arid urban areas.
ReferenceLocationAverage Annual Rainfall (mm)Rainfall DistributionRooftop Area (m2)RWH Volume (m3/m)Daily Consumption (L/d/capita)Demand Satisfied (%)Unit Volume of RWH (m3/m2 of Interception Area)
This studyMexico160–700May-October601.07–2.04 0.012
[6]Portugal500–700October-April1180.792.88 0.0024
[8]Jordan200–600October-April506.871.4340.136
[9]Iran316.88–386.007September-March100–3001.89–4.5300600.0189–0.015
[12]Nigeria400July-September3430.1–1.45150700.00029–0.004
[14]Mexico376.96May-October100–2005.25–5.9538.41000.052–0.029
[17]Iran113.7–257.3September-March401.33 0.033
[62]Iran288September-March60–2401.14–4.582401000.019
Data range113.7–7003–7 months40–1180.790.1–6.838.4–30034–1000.00029–0.136
Publisher’s Note: MDPI stays neutral with regard to jurisdictional claims in published maps and institutional affiliations.