5.1. Effects of Harmonic Heaving and Pitching Amplitude
As mentioned before, the AoA is one of the main parameters that affect the flapping foil efficiency [
3,
19,
28]. With different heaving amplitudes and different pitch amplitudes, the efficiency varies with the resulted AoAs for flapping foils with harmonic motion.
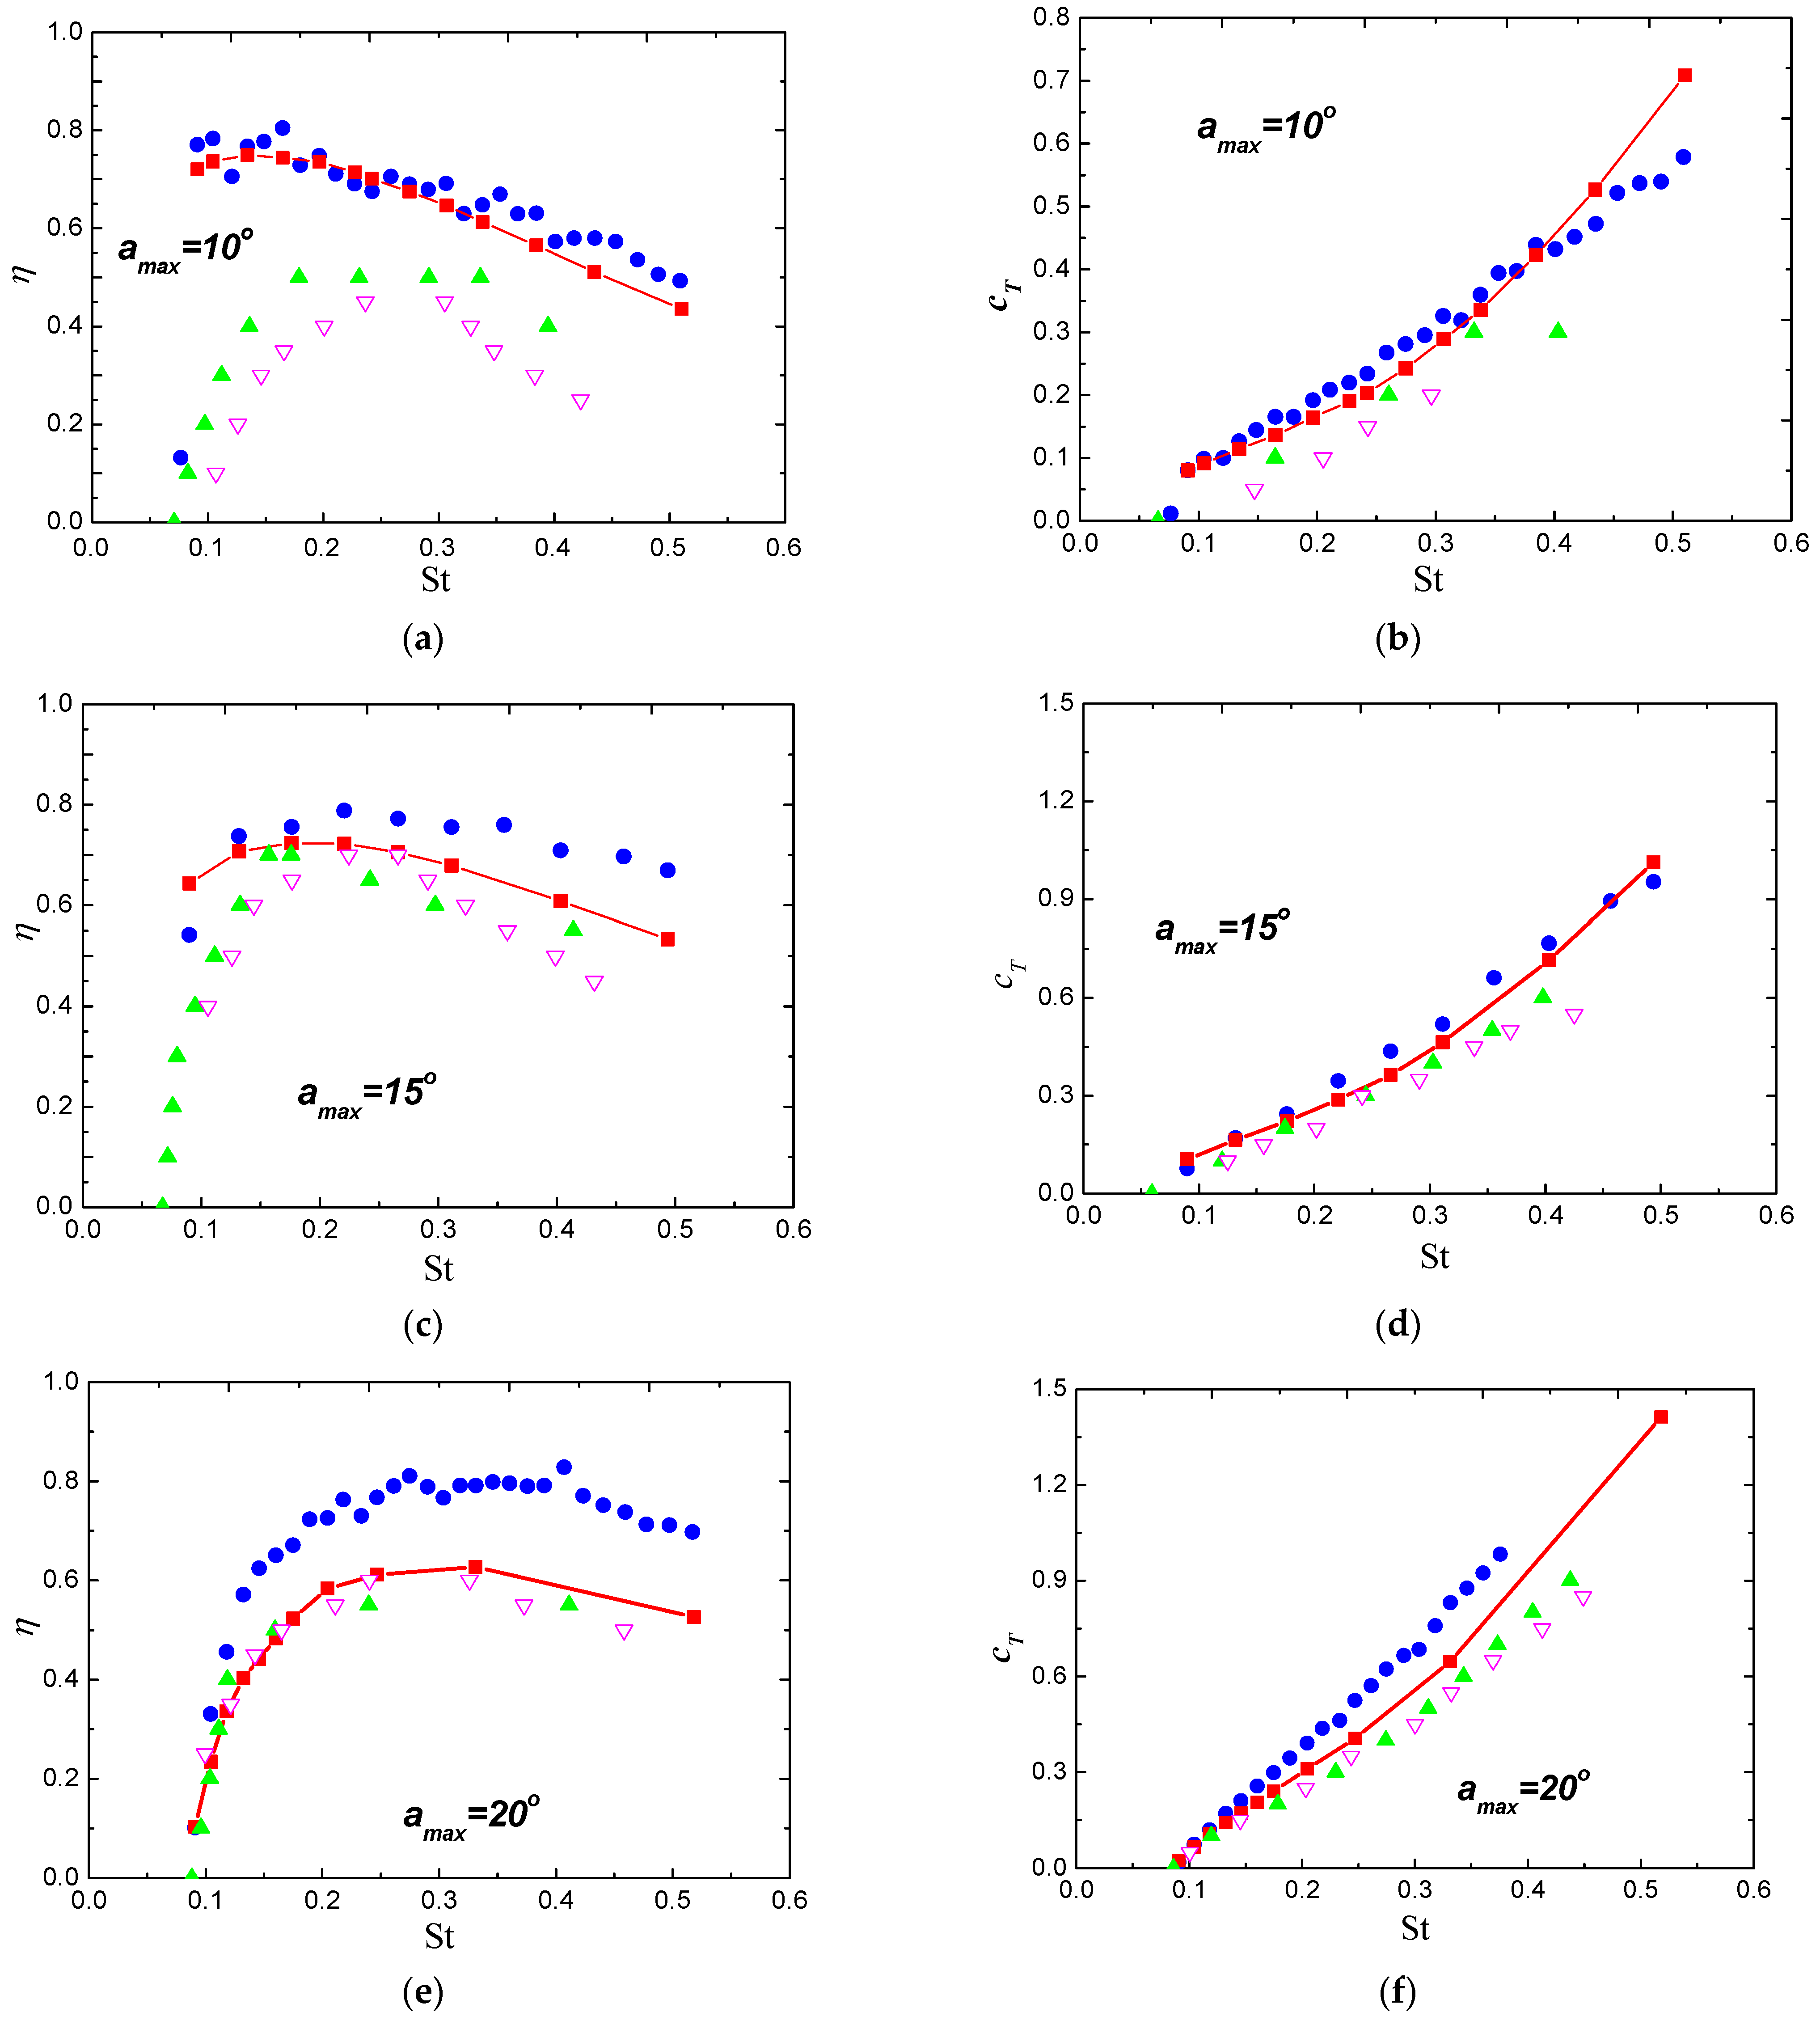
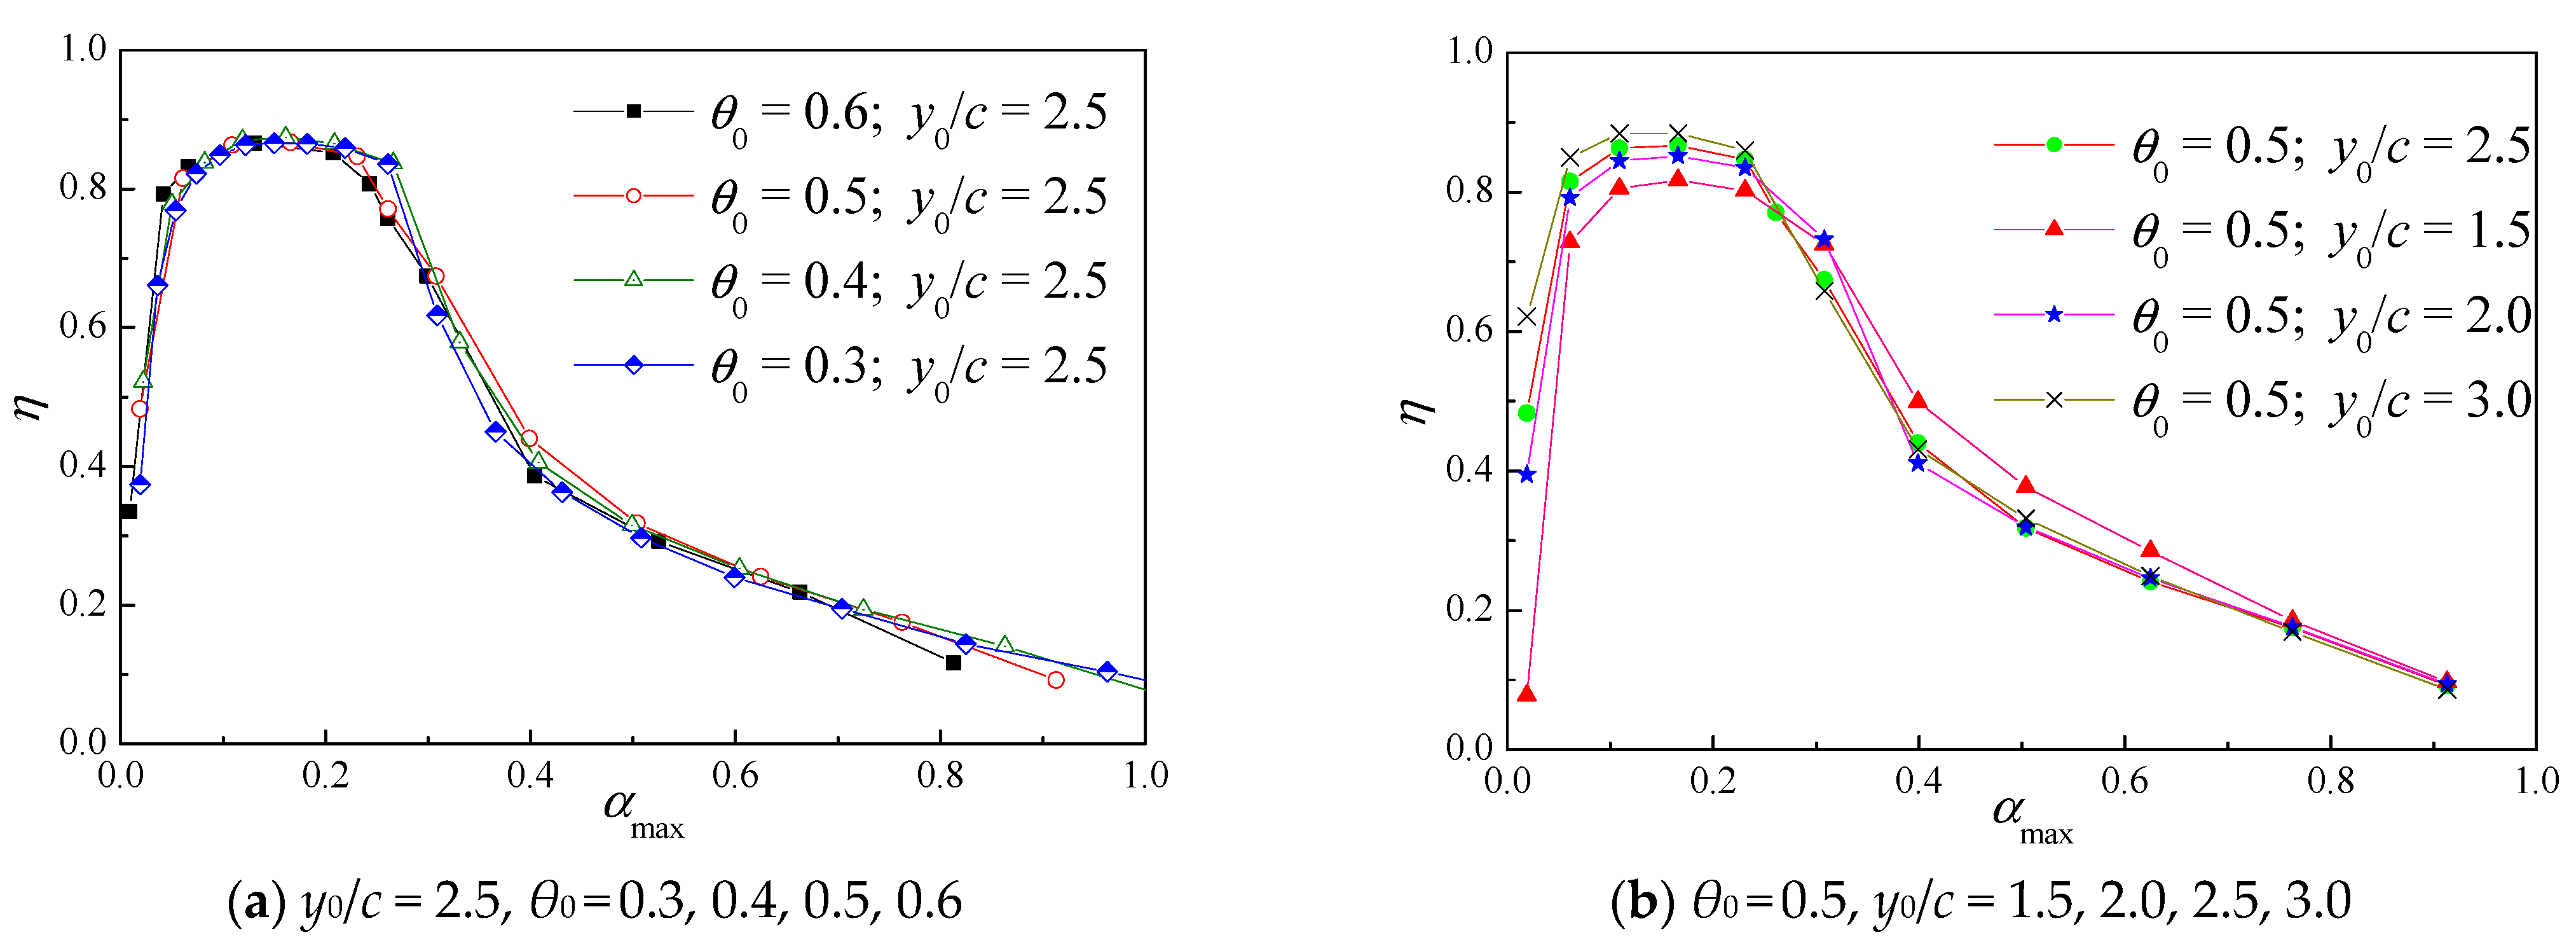
Figure 12 presents a parametric study for the effect of maximum AoAs on the efficiency with varying heave and pitch motions. The heave and pitch motions in this session are all simple harmonic with a 90° phase difference and the distance from the pitching center from the leading-edge of the foil,
S, is 0.
Through the analysis of many working conditions, a more universal relationship between the maximum AoA and efficiency is obtained in this paper. Firstly, from
Figure 12a, it appears that when the heave amplitude-to-chord ratio
y0/
c is fixed at 2.5, the efficiency curves under different pitching amplitude
θ0 almost coincide with each other. That is, pitching amplitude
θ0 has little impact on the highest efficiency point. Then, when pitching amplitude
θ0 is not changed,
Figure 12b shows that the maximum efficiencies increase obviously with the increase of the heave amplitude-to-chord ratio
y0/
c, although the four efficiency curves are basically the same. The maximum efficiency value gains an increase from 81.7% to 88.4%. Finally, through the analysis of many working conditions, a more universal relationship between the maximum angle of attack and efficiency is obtained. In
Figure 12, the curves trend of efficiency with the AoA are basically the same under various conditions. When the maximum AoA α
max is between 6° and 12°, the efficiency value reaches the maximum. The results show that α
max plays a more important role in foil efficiency than pitch and heave amplitude, which is in good agreement with previous research results [
3,
10,
18,
19,
28], and the regularity is clearer in this paper.
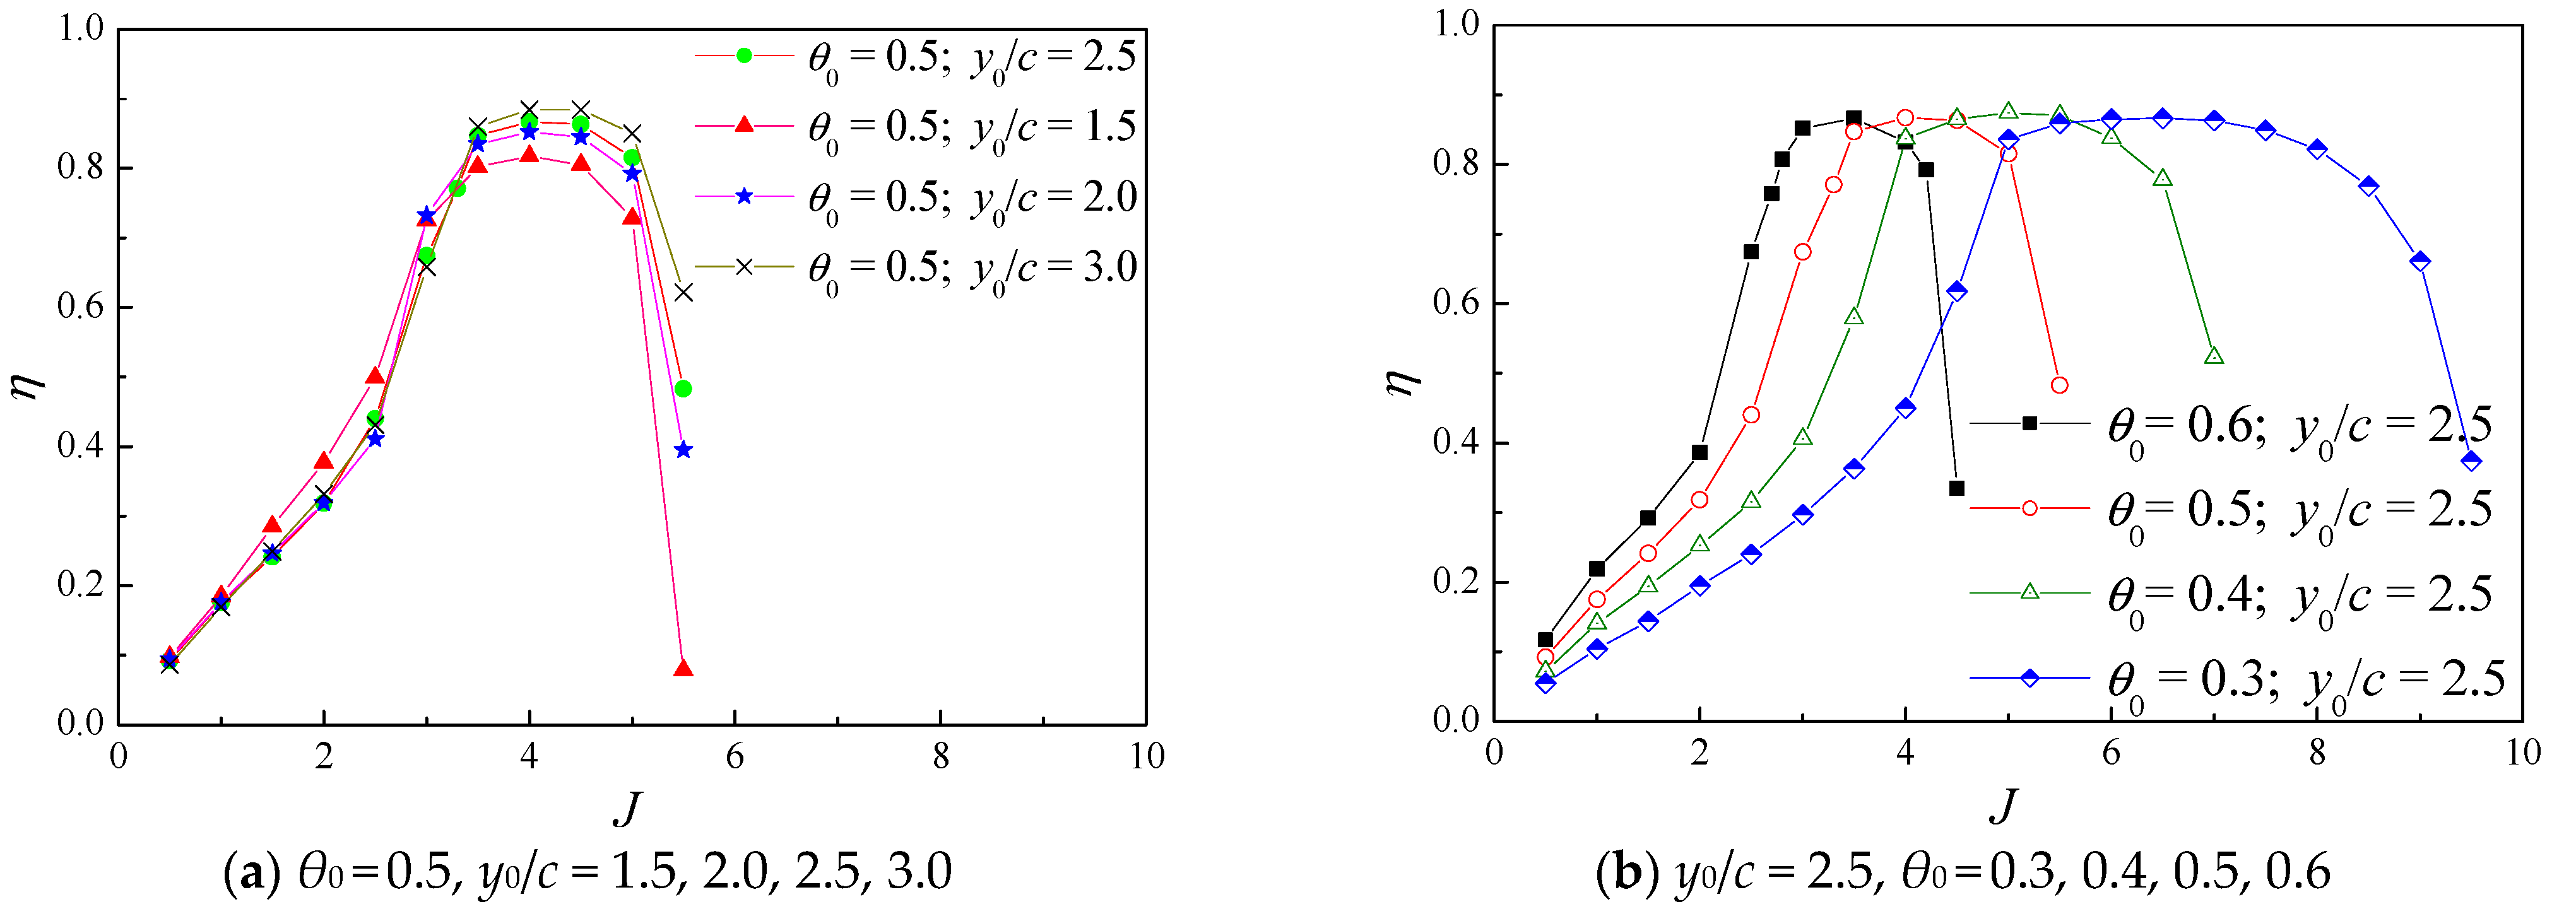
For the convenience of engineering application and comparison with the propeller, this part refers to the expression of Floc’h [
5] on the advance coefficient
J of the flapping foil propeller. The propulsion efficiency
η and advance coefficient
J under different heaving amplitudes and pitching angles are calculated according to Formula (5), as shown in
Figure 13. It can be seen from
Figure 13a that when the pitching amplitude
θ0 is constant as 0.5, the efficiency curves under different heave amplitude-to-chord ratio
y0/
c almost coincide with each other. That is, the influence of the heaving amplitude on the advance coefficient
J is small. However, in
Figure 13b, when the heave amplitude-to-chord ratio
y0/
c is fixed, the change of pitching amplitude
θ0 has a much larger influence on the advance coefficient
J. On one hand, when the pitching amplitude becomes smaller, the maximum efficiency point of the flapping foil propeller deviates to a higher advance coefficient
J. On the other hand, compared with the case of the larger pitching amplitude
θ0, the range of maximum efficiency with a smaller pitching amplitude
θ0 is much larger. Since the ship and vehicle usually work at a speed close to the propeller’s highest efficiency, a smaller pitching amplitude
θ0 means a larger working range.
To sum up, the existing research results of simple harmonic motion parameters in this part show that the maximum AoA αmax has the greatest impact on flapping foil efficiency, and the efficiency curves at different maximum AoA have obvious regularity.; Changing the heaving amplitude y0 can also contribute to the improvement of efficiency, while the pitching amplitude θ0 has little impact on the highest efficiency point, but it has practical significance for the speed and working range of the ship and vehicle in the actual working condition.
5.2. Effect of Phase Difference
Apart from the AoA and amplitude of heaving and pitching, the phase difference between the heaving and pitching motions and the pivot location are two other important parameters affecting the performance of flapping foils [
3,
11,
29,
30,
31,
32,
33,
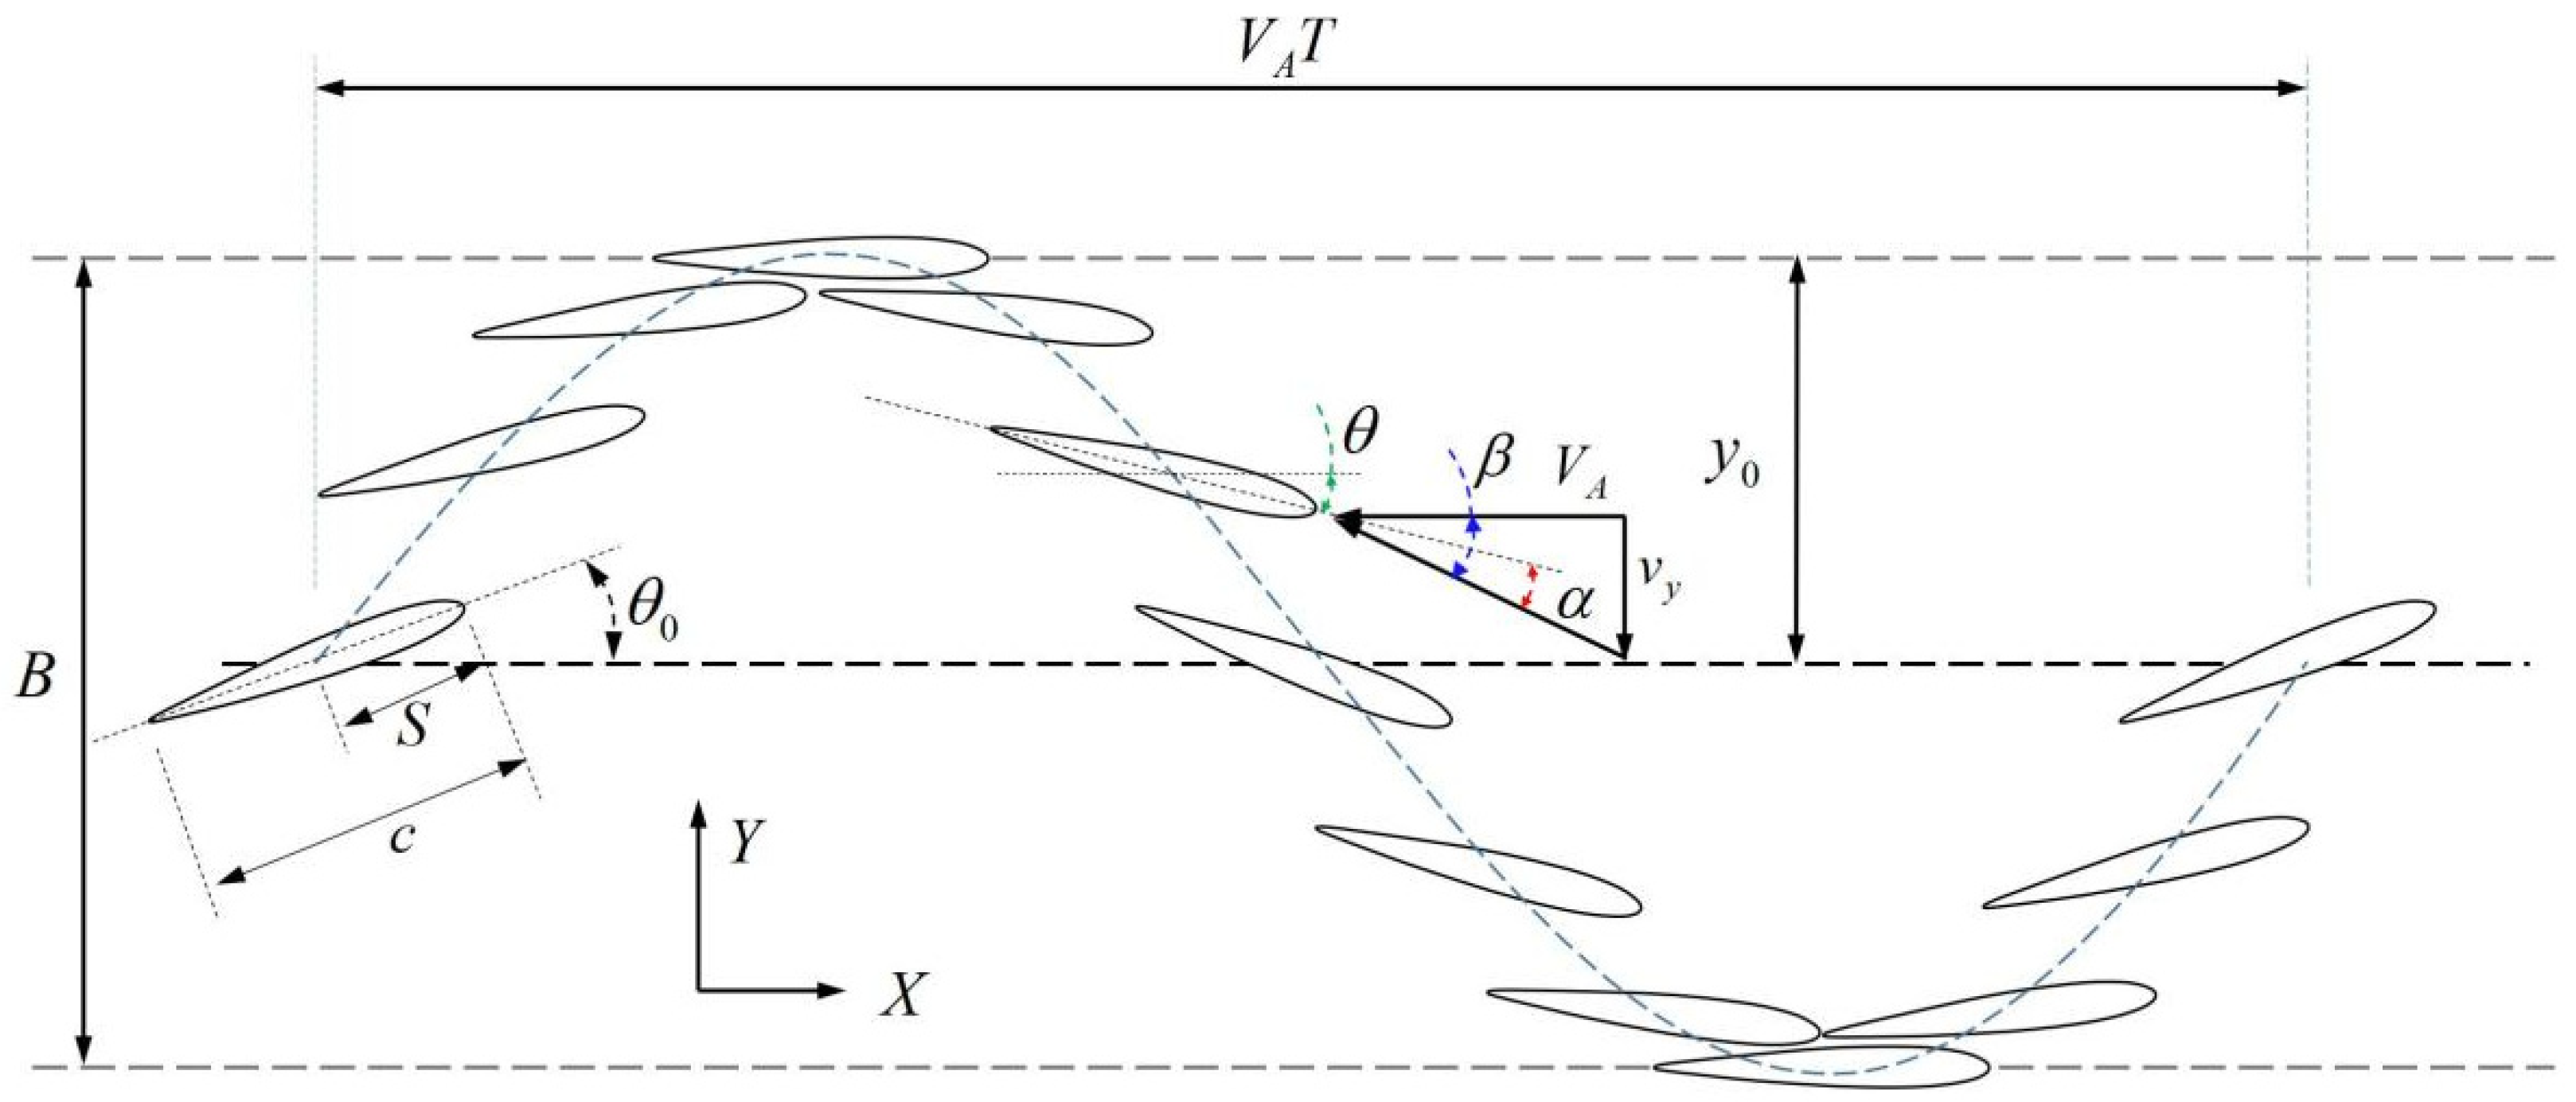
34]. However, most of the previous work only focused on these two parameters separately and ignored the relationship between them. Here, the phase difference is considered not only related to the heaving amplitude, but also to the pivot location of the foil. According to the motion of the flapping foil, the equivalent relations between phase difference and pivot location will be given in this section. In addition, a further set of numerical simulations were made to investigate the propulsive efficiency when the phase angle between the heave and pitch oscillations is varied.
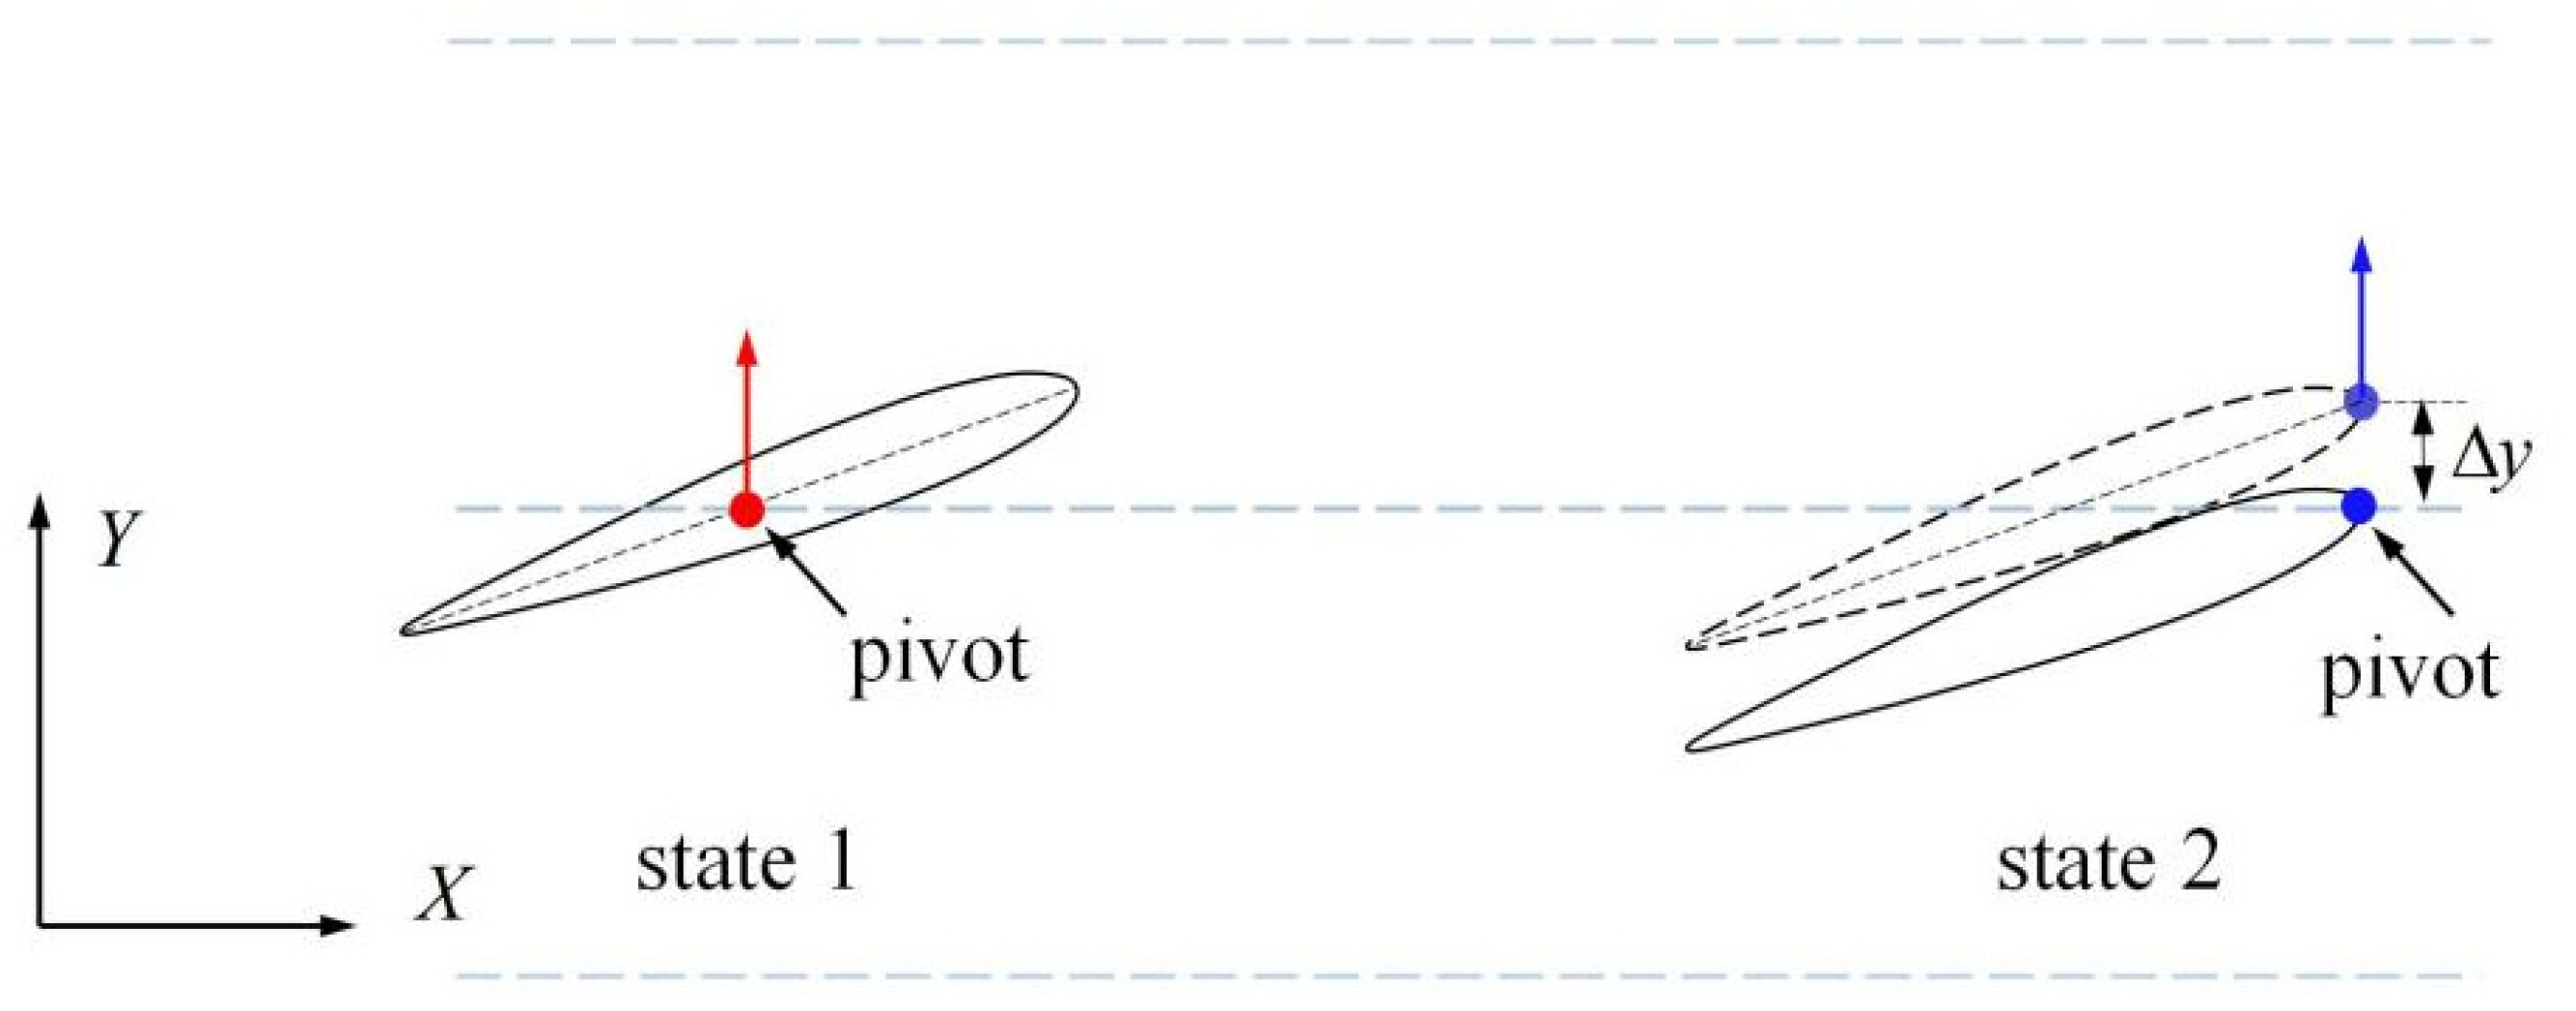
The phase difference is related to the pivot location of the flapping foil, and the relationship between them can be obtained from the geometric relationship. As shown in
Figure 14, there are two sample states. The first one is a flapping foil with a phase difference
φ = 90°, which is called “state 1”, and its pivot is located at the 1/2 chord length (as shown in the red dot). At this time,
t = n
T (whole period), the heaving amplitude
y = 0, and the pitching angle
θ is the maximum value (
θ =
θ 0). Under the assumption that the motion curves of each point on the foil are approximately harmonic, state 1 of the flapping foil can be also equated to another case. its pivot is at the leading edge (as shown in the blue dot in
Figure 14), but at this time, the heaving motion is at the time of
t = n
T + Δ
t, while the pitching motion is at the time of
t = (n + 1/4)
T. That is, at this time, the phase difference
φ = 90° − 2π
fΔ
t, which is called “state 2” here. The foils in these two states have different phase differences and pivot locations, but they are in the same state. According to the above analysis, reducing the phase difference could be equivalent to moving the pivot position towards the leading edge.
Δ
s is defined as the displacement of the pivot in the chordwise direction, and it is positive in the tailing edge direction. Δ
φ is defined as the change of the phase difference between the two states of the foil. Compared with state 1, state 2 is completely equivalent, but the change of phase difference Δ
φ = −2π
f Δt, and the pivot displacement Δ
s = −
c/2. The relationship between Δ
s and Δ
φ is derived from the geometric relationship as follows. As shown in
Figure 14, the distance between the leading edge and the center line Δ
y can be written as follows:
According to the heaving motion (Equation (1)), it can be obtained that Δ
t is
When Δ
y/y0 is small, there is an approximate relationship
That is, according to the motion law of the flapping foil, approximate relations of the four parameters including the phase difference, heave amplitude, pitching angle and rotation axis position are given as follows:
In order to verify the correctness of Equation (20), and based on this formula, we could further stimulate the propulsion efficiency, and eight groups of comparison conditions are set according to Equation (20), as shown in
Table 1.
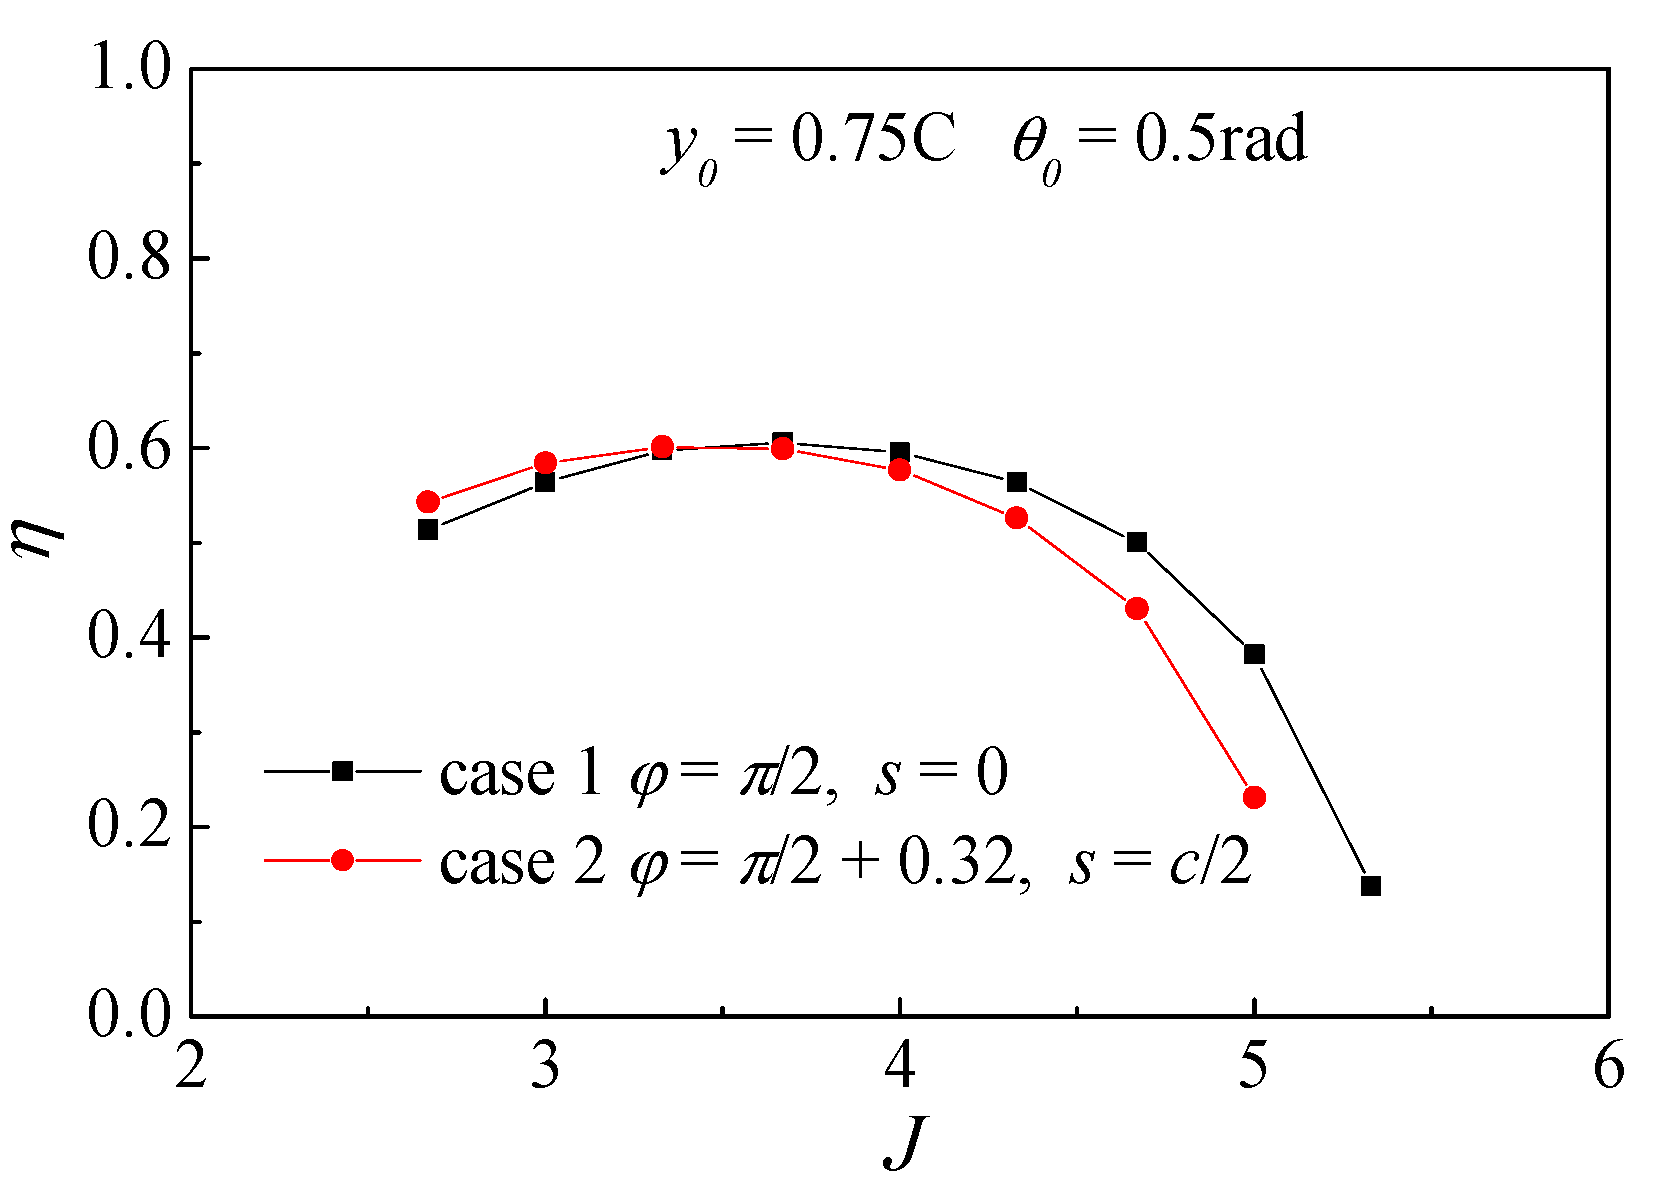
Firstly, the reliability of this formula is verified by comparing the first four working conditions. Case 1 and case 2 are compared to verify the accuracy of the equivalent formula under the condition of larger pitching angle and smaller heaving amplitude, which is shown in
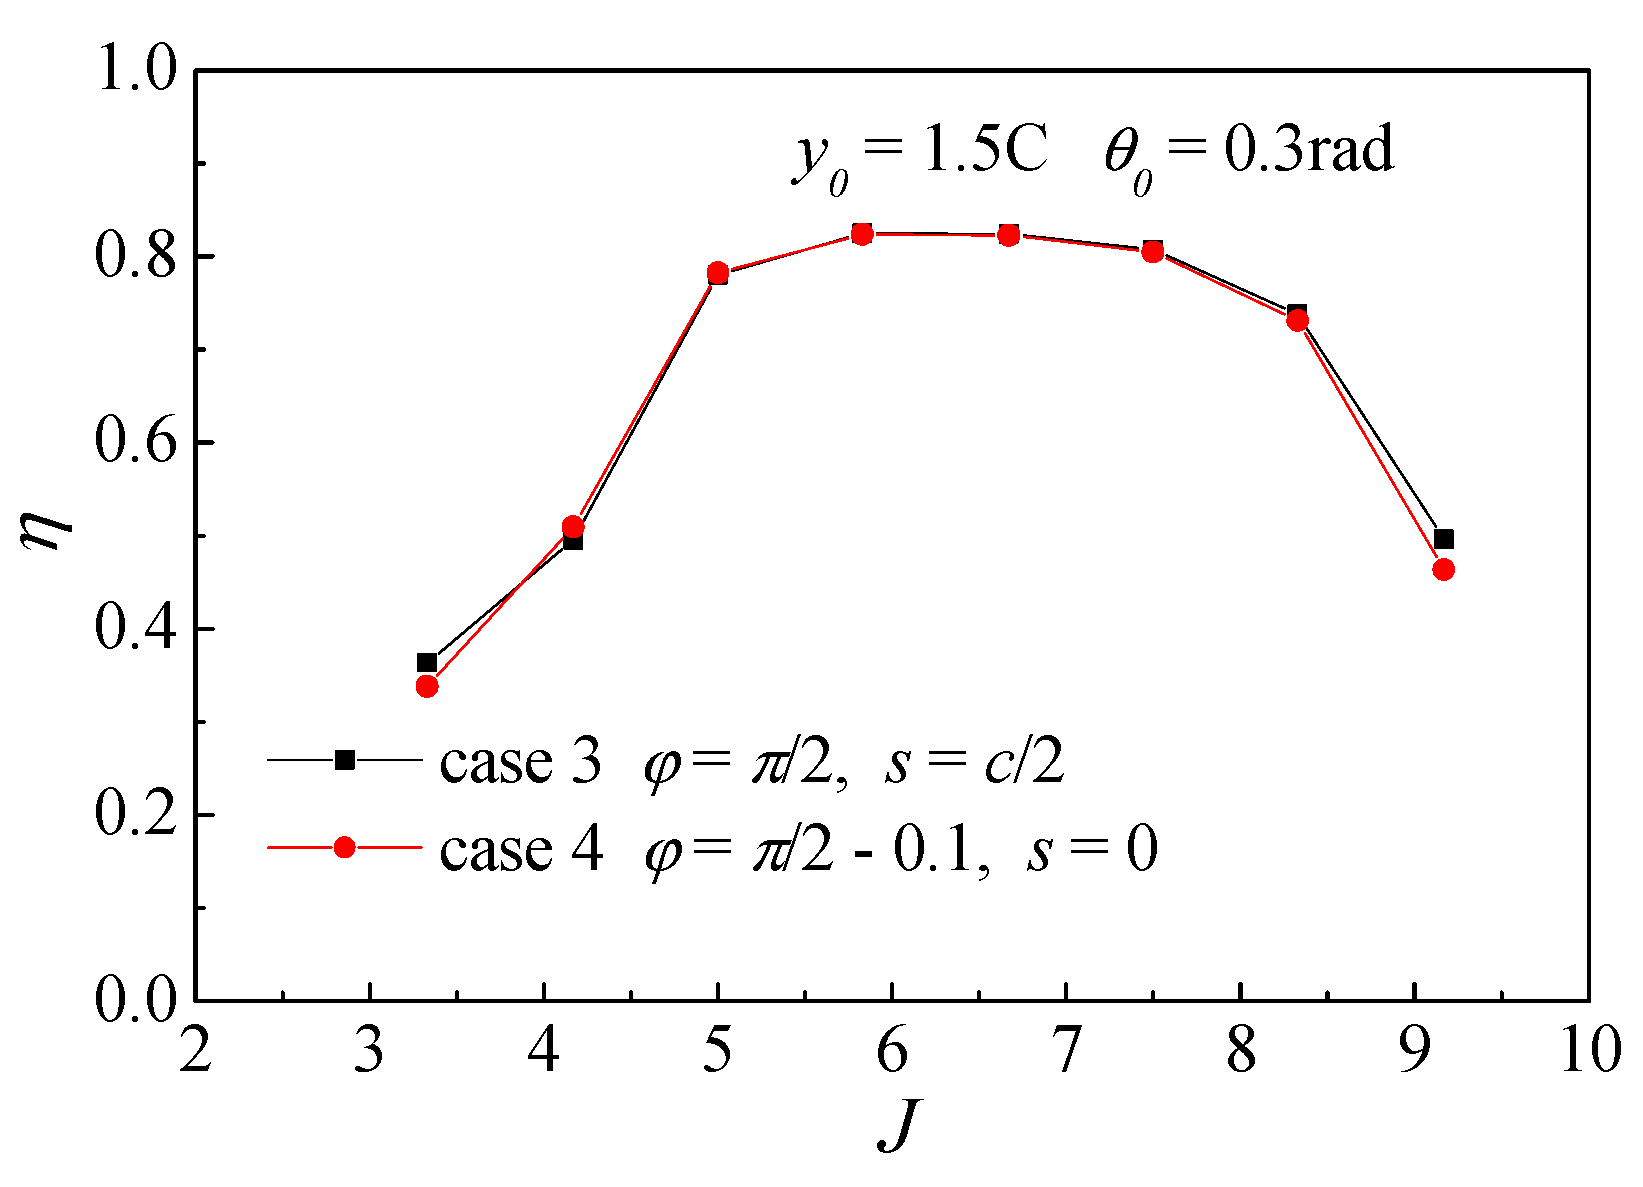
Figure 15. Case 3 and case 4 in
Figure 16 are chosen to verify the accuracy of the equivalent formula under the condition of smaller pitching angle and larger heaving amplitude. The propulsive efficiency curves of the first two cases are shown in
Figure 15. It is found that the efficiency curves of the two cases are slightly different, but the maximum efficiency value of them is the same. While, in the next two cases, the rotating axial moves toward the leading- edge direction, and the phase angle is reduced proportionally. It can be seen from
Figure 16 that the efficiency curves of the two are almost overlapped with each other, that is, the working conditions of Case 3 and Case 4 are practically identical.
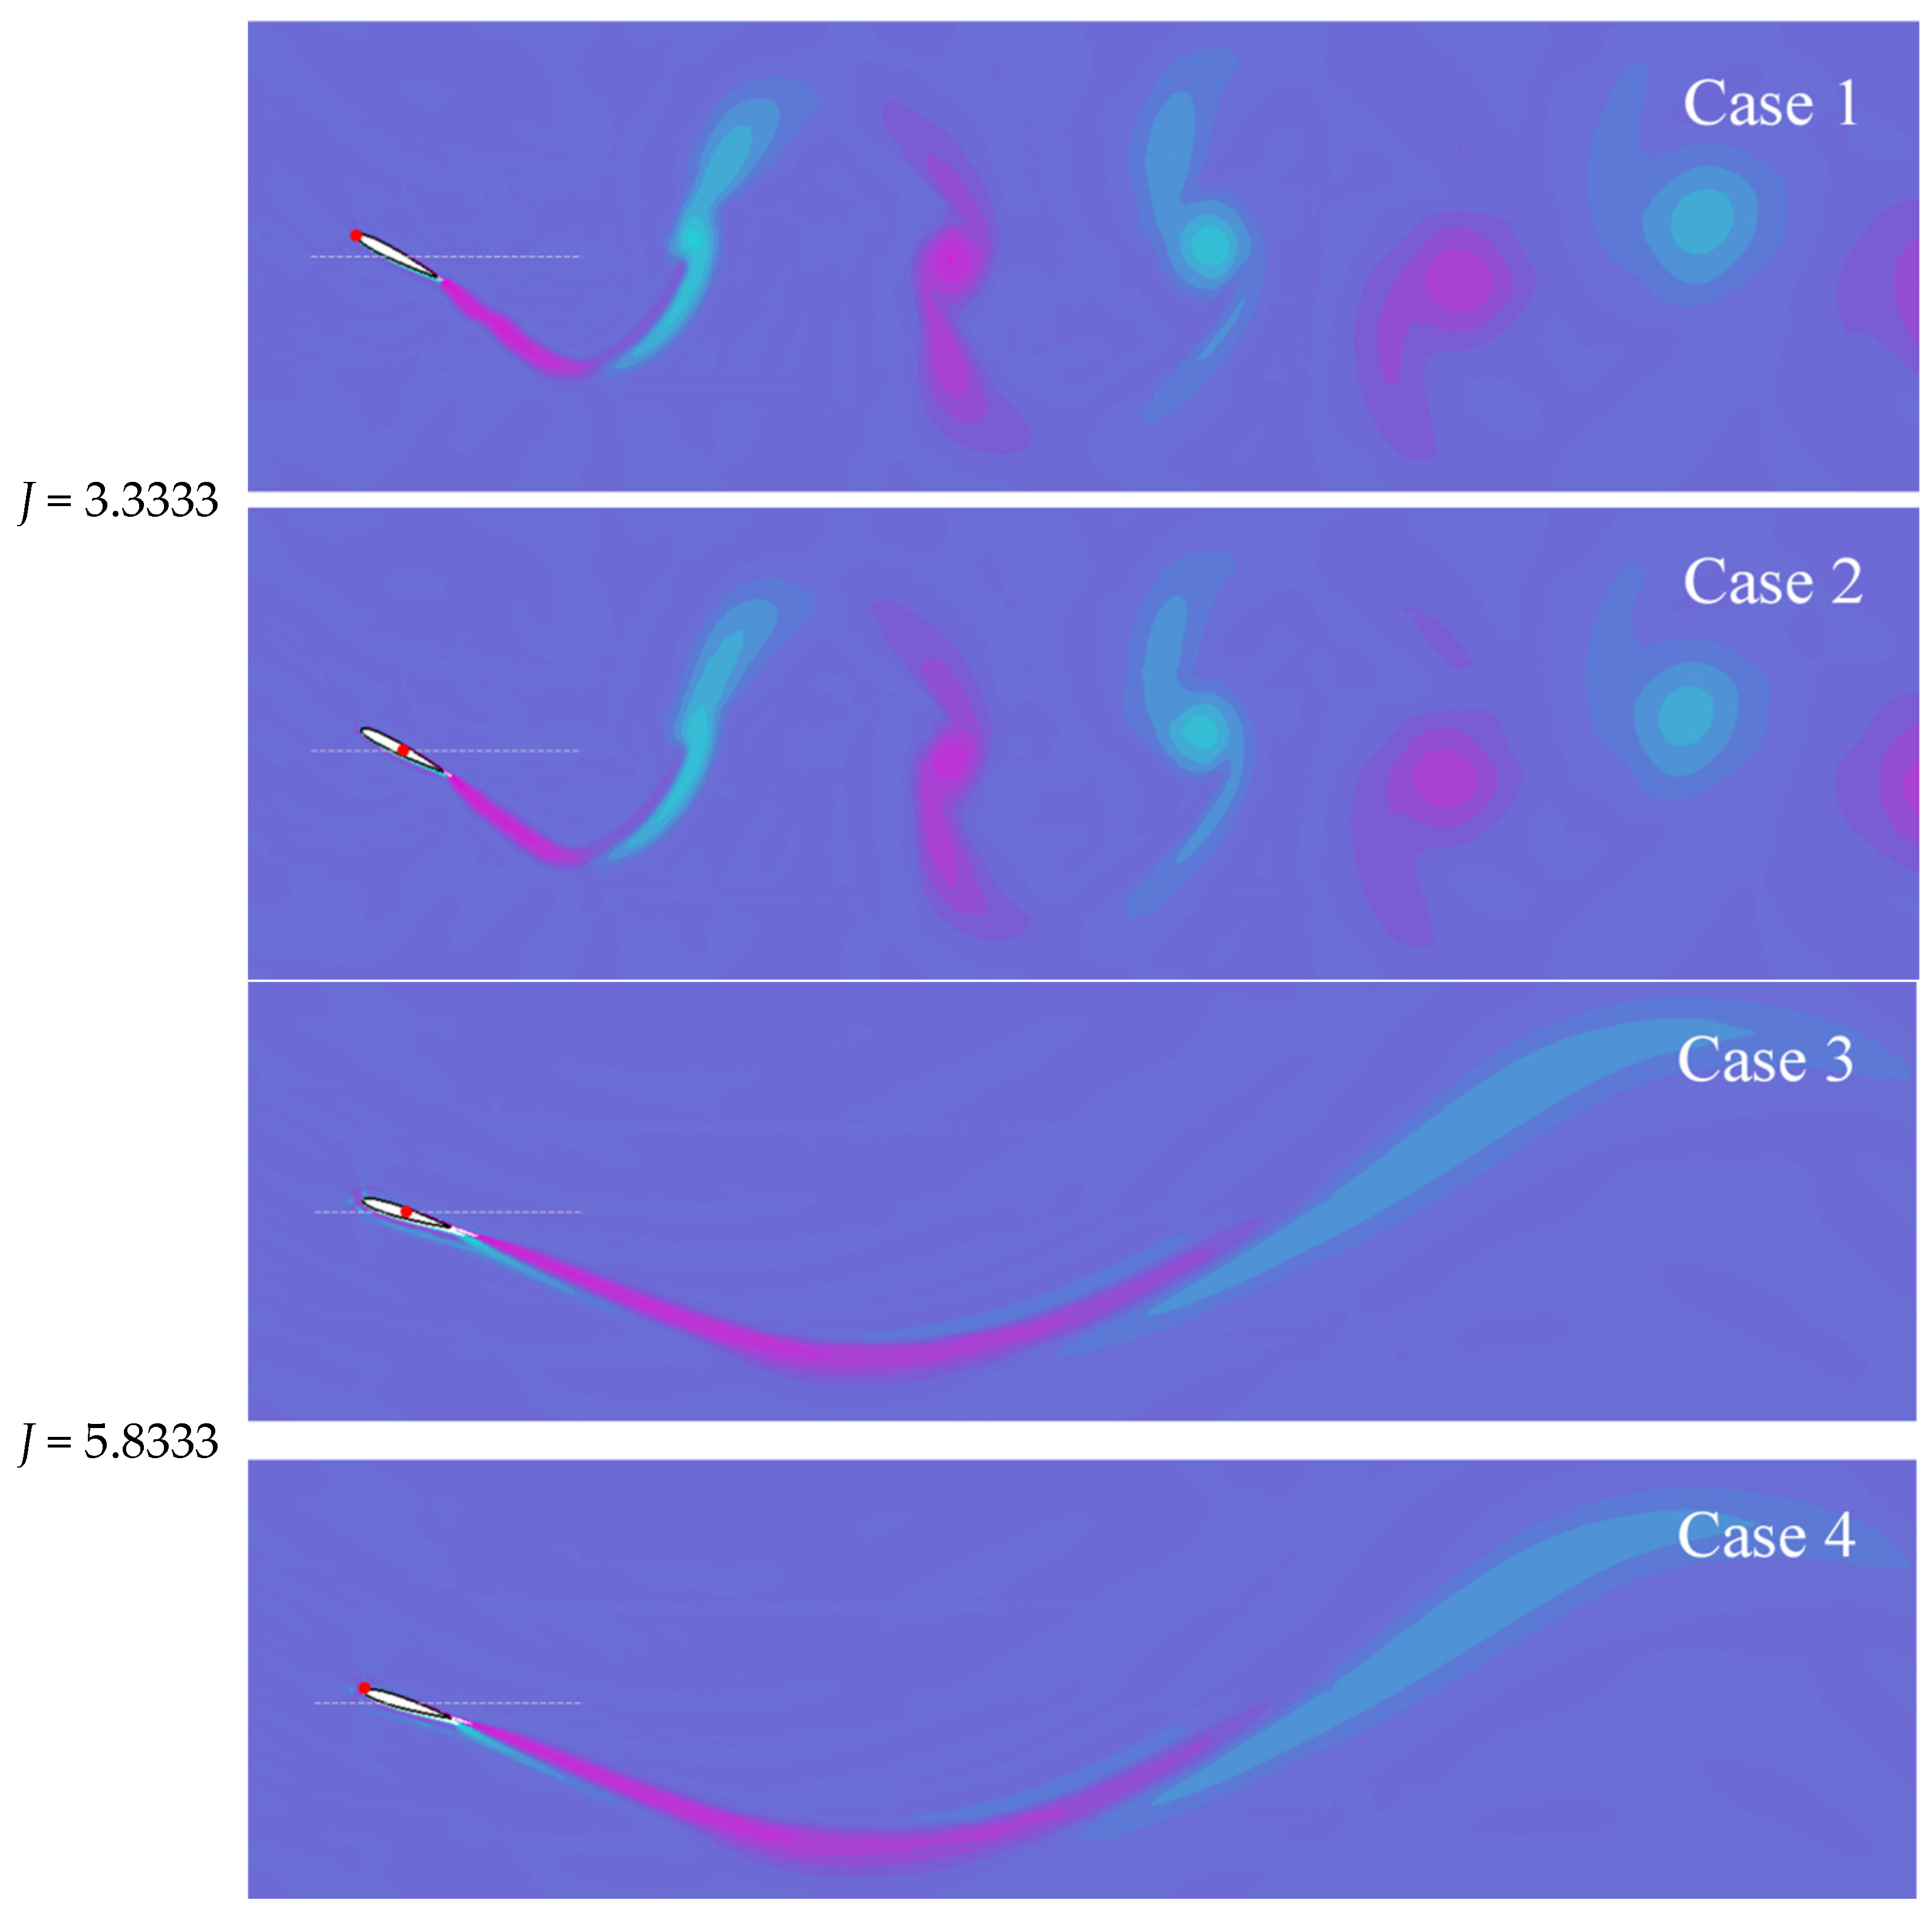
Figure 17 shows the wake flow field under these four verification conditions when the midpoint of the foil is at the equilibrium position. The red dot in the figure shows the pivot center position of the foil. As can be seen from
Figure 17, the wake flow fields of Case 1 and Case 2 with different pivot positions and phase difference obtained by formula 20 are almost the same. A comparison of the results of Case 3 and Case 4 also shows the consistency between the two foils. However, the foils of Case 3 and Case 4 are leaving a narrower wake comparing to the previous two cases, which is consistent with the conclusion that the propulsion efficiency of these two Cases is higher than that of the first two cases. From the comparison results above, it can be seen that Equation (20) which is constructed in this chapter is applicable for the four parameters, and it is more applicable and accurate when the pitching angle is smaller, and the heaving amplitude is larger.
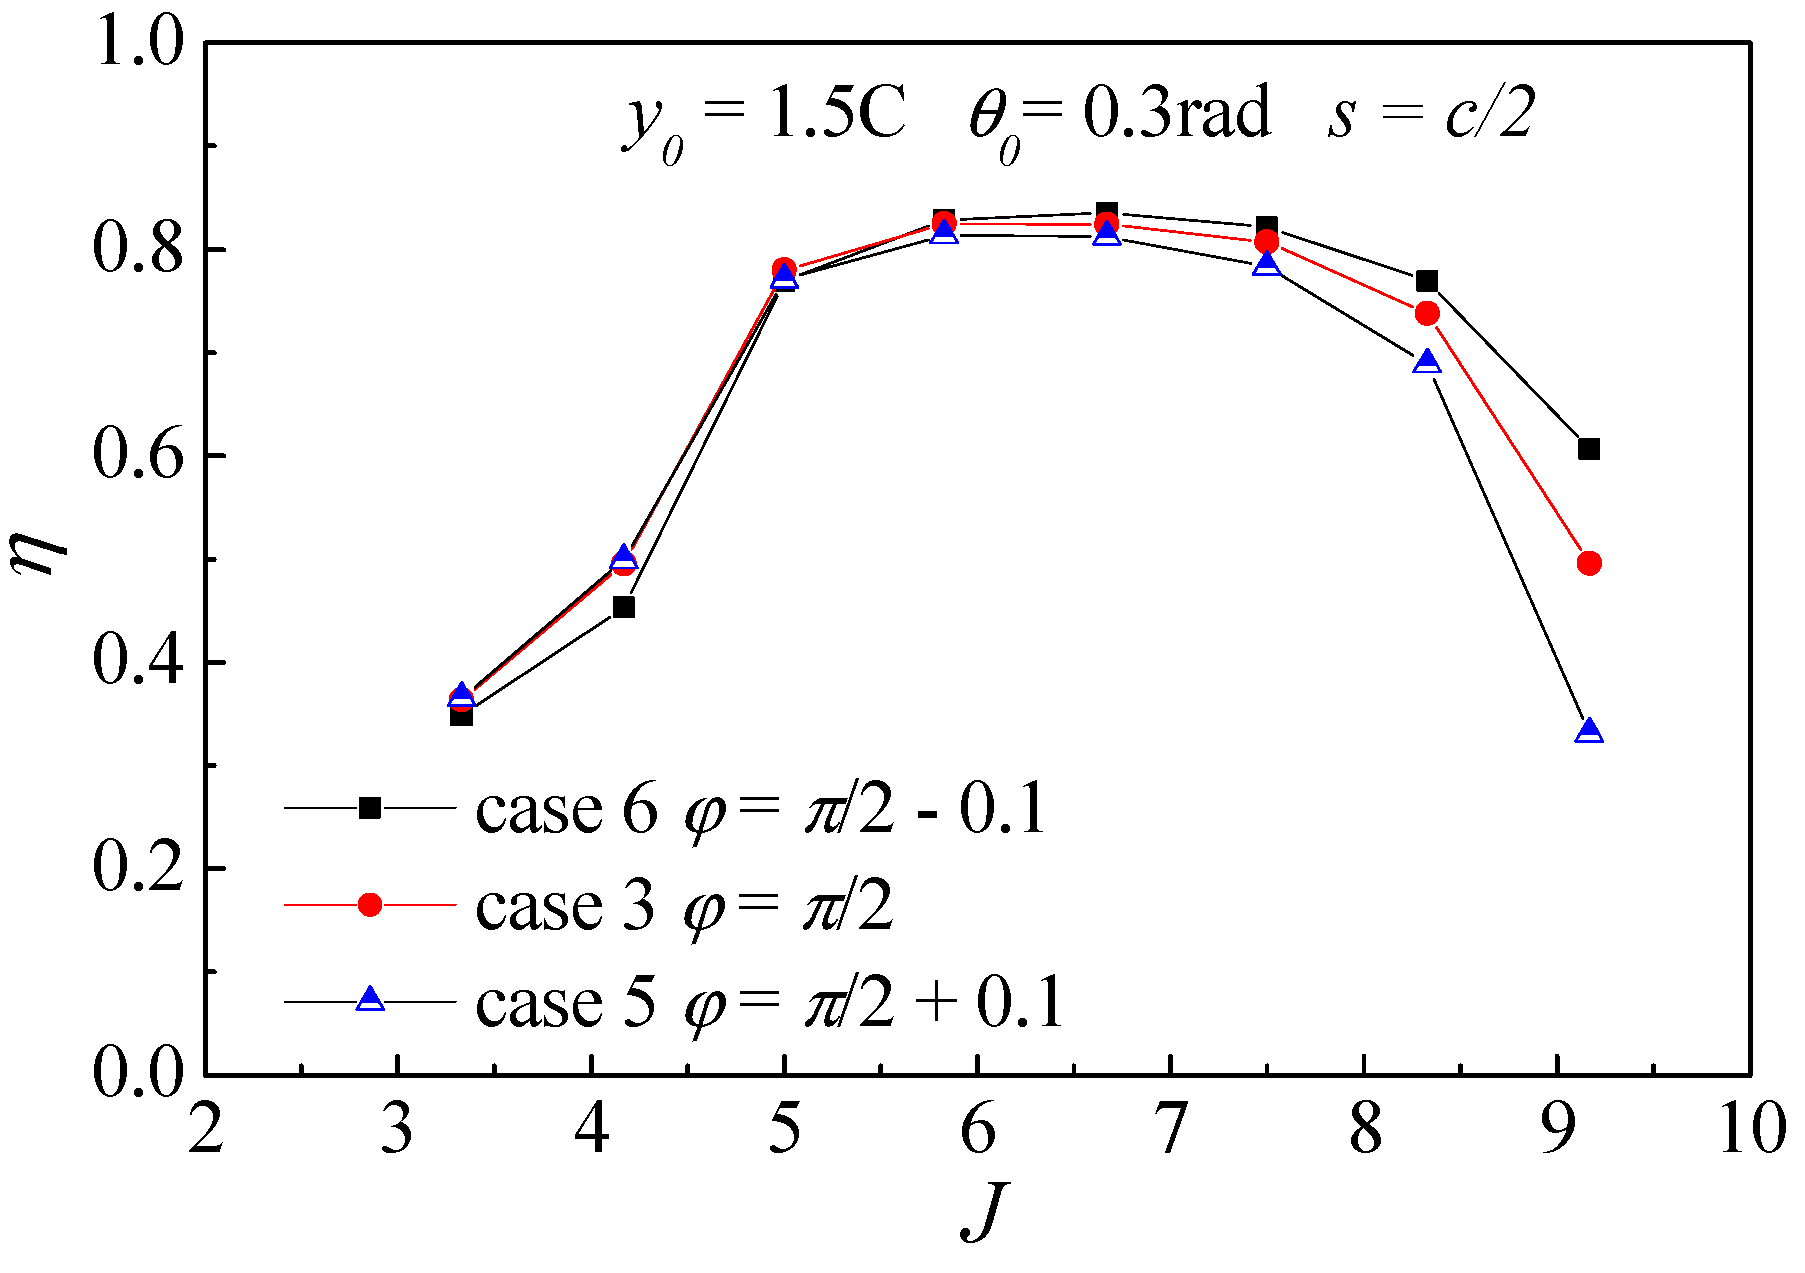
Then, the influence of phase difference on efficiency is further analyzed through the comparative study of the latter six cases. As shown in
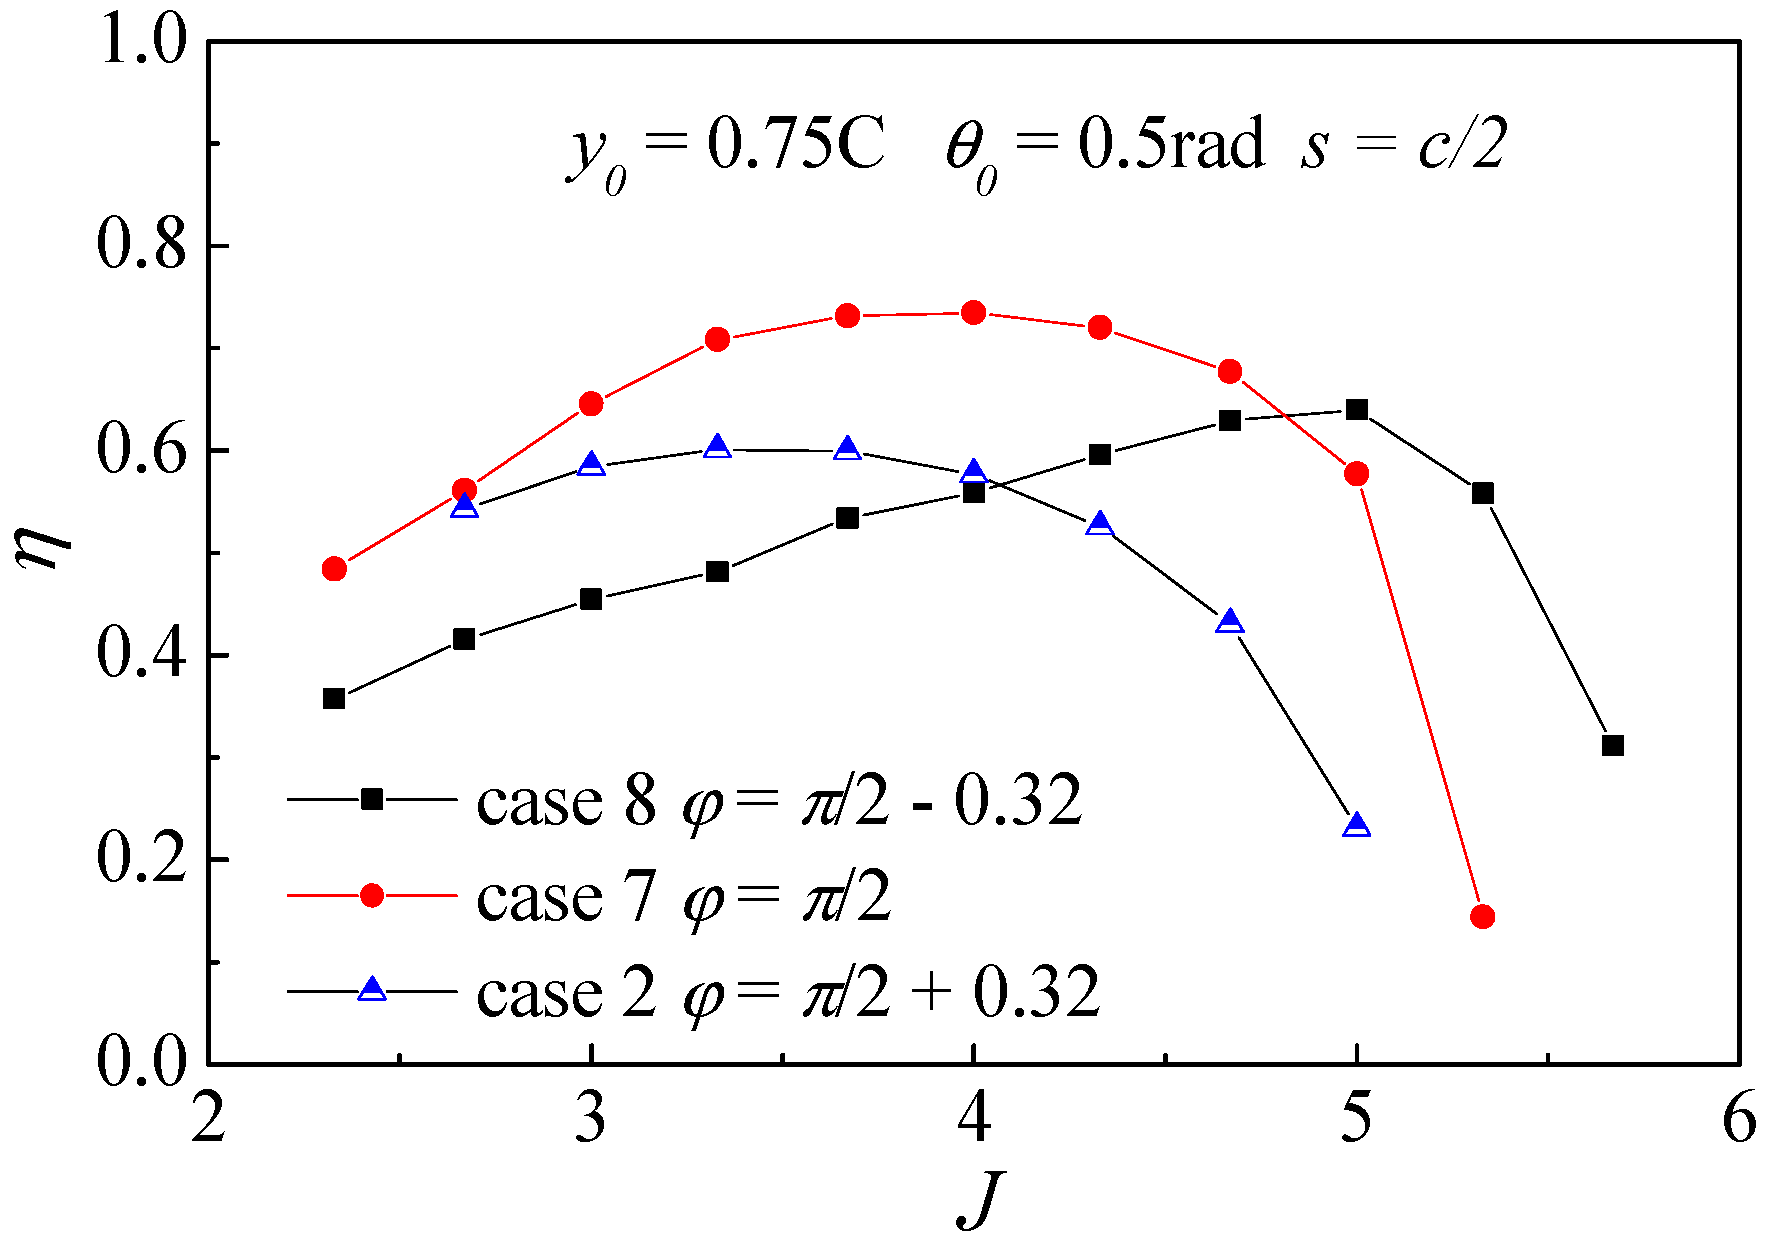
Figure 18, the comparison of Case 3, Case 5 and Case 6 shows the effect of phase difference on efficiency under smaller pitching angle and larger heaving amplitude; And Case 2, Case 7 and Case 8 are chosen for the comparative study of that under the condition of larger pitching angle and smaller heaving amplitude in
Figure 19. From
Figure 18, under the smaller pitching angle and larger heaving amplitude condition, the maximum efficiency of the three are almost the same, but the efficiency curve slightly deviates upward with the decrease of phase difference. That is, after exceeding the maximum efficiency point, under the same advance coefficient
J, a smaller phase difference is conducive to maintaining higher efficiency. From the comparison results shown in
Figure 19, It is found that the efficiency curve does not shift regularly with the increase of phase difference under large pitching angle and small heave amplitude condition. However, viewing the situation from a whole, the maximum efficiency point is gradually shifted to the left with the increase of phase difference, and when the phase difference is 90°, the peak efficiency is the highest. From the comparison of the above two groups, we can see that the effect of phase difference on efficiency is also related to the heaving amplitude and pitching angle, and there is no exact rule. Further analysis should be made according to the specific situation in the future.
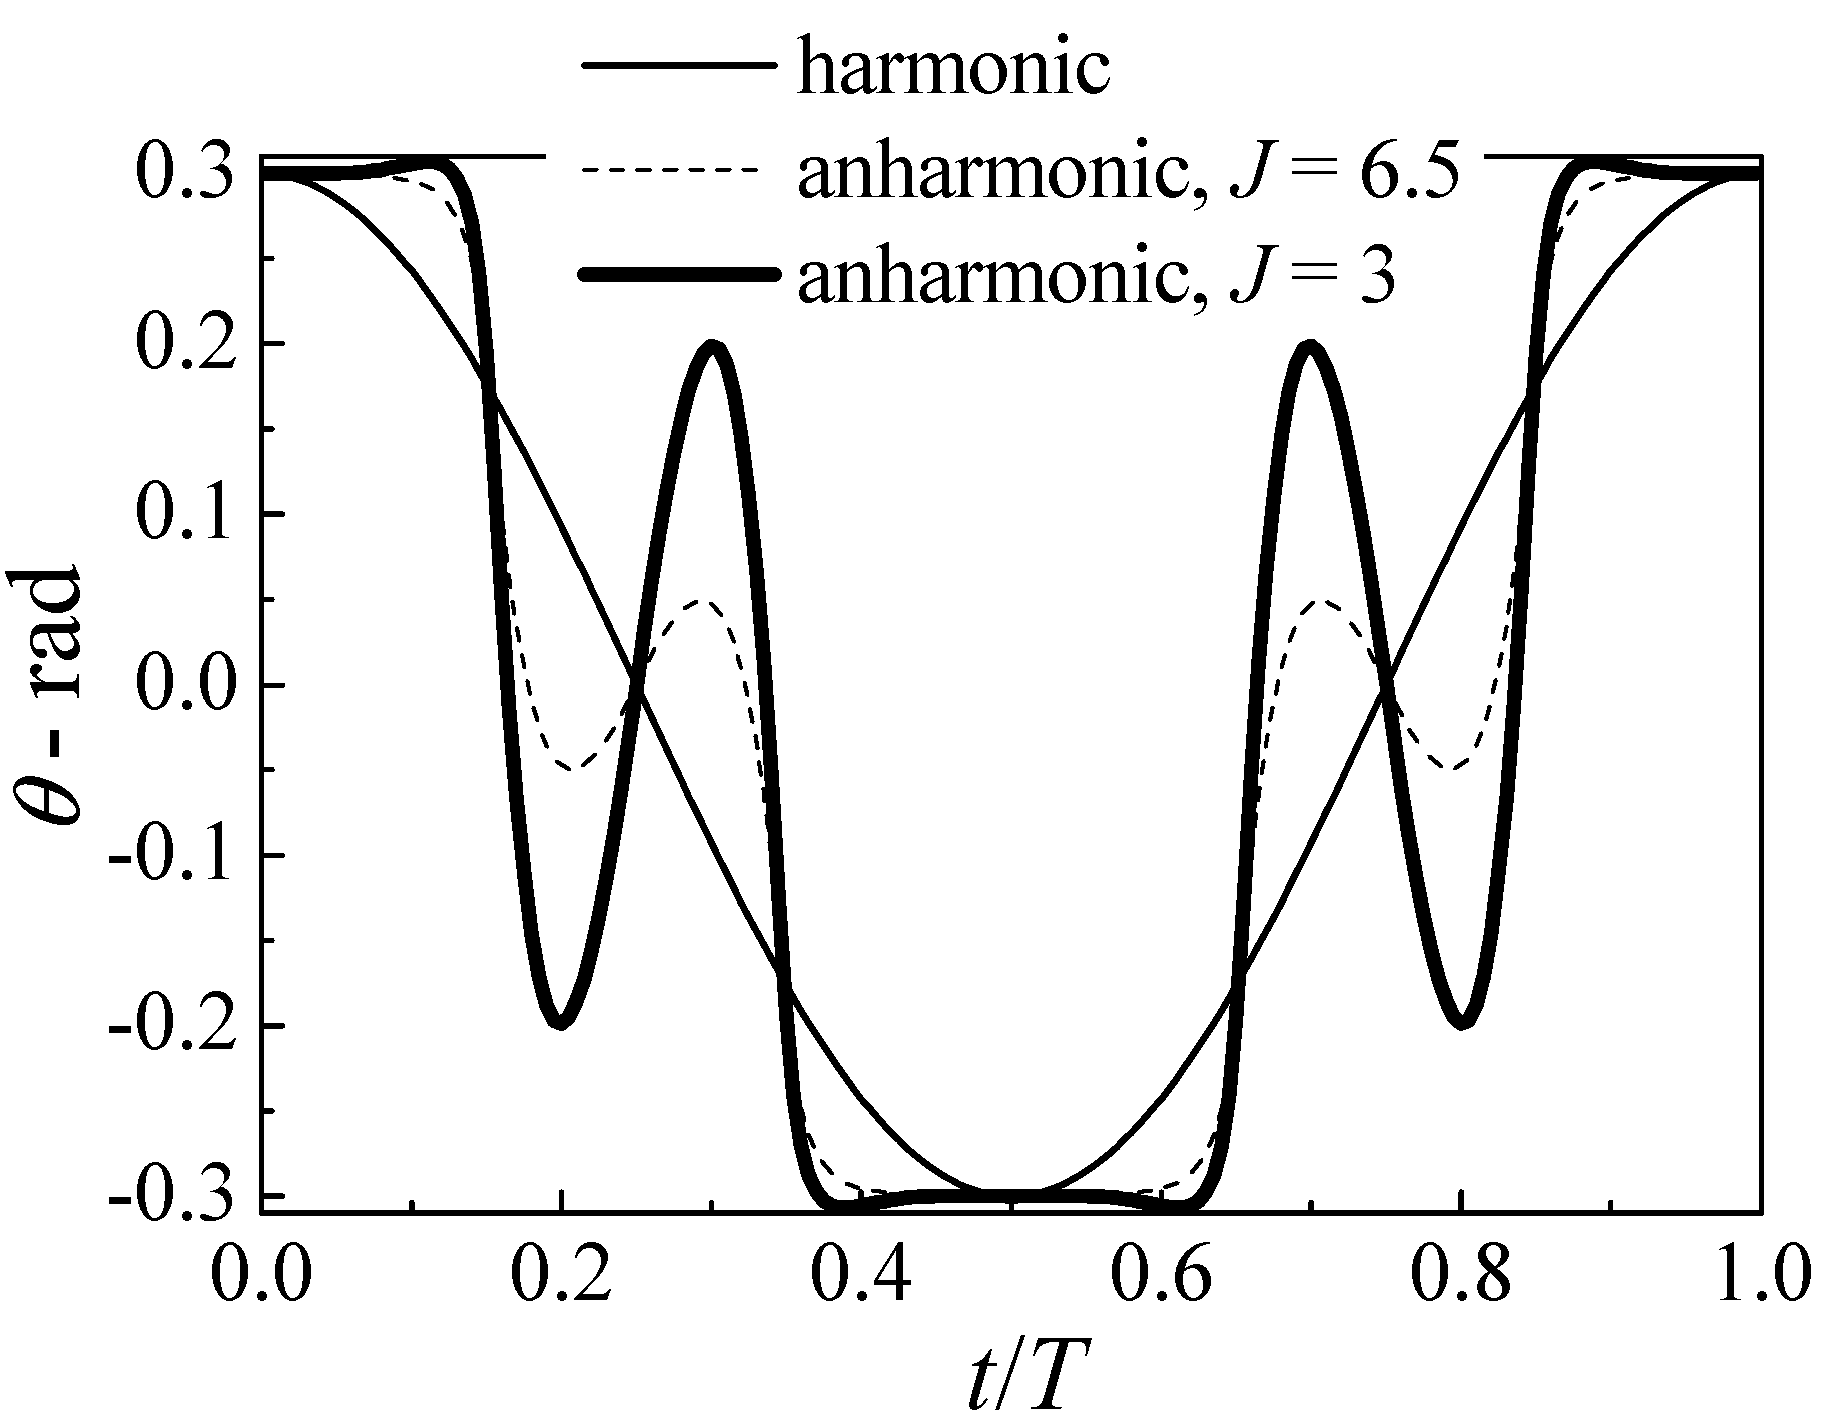
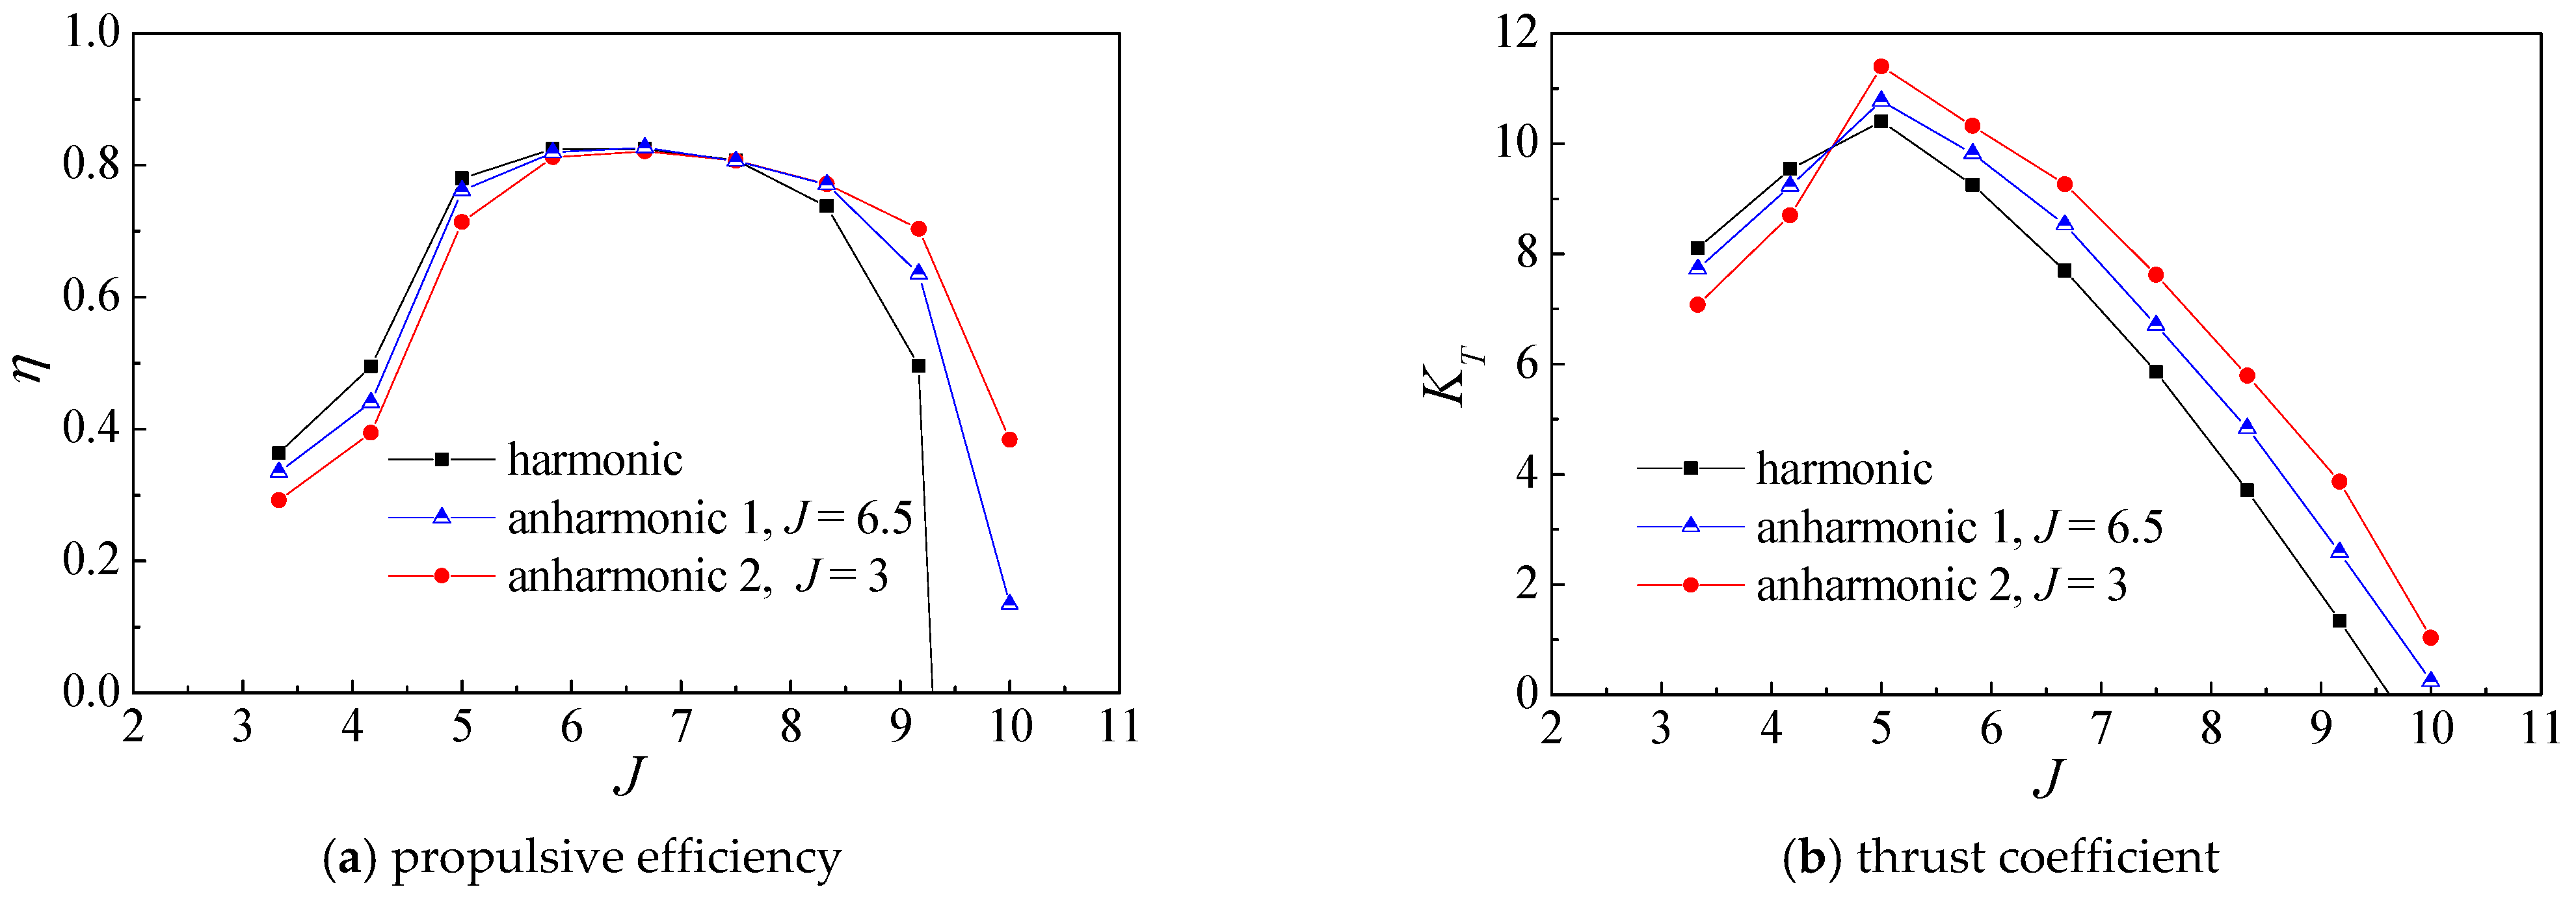
5.3. Effect of Anharmonic Motion
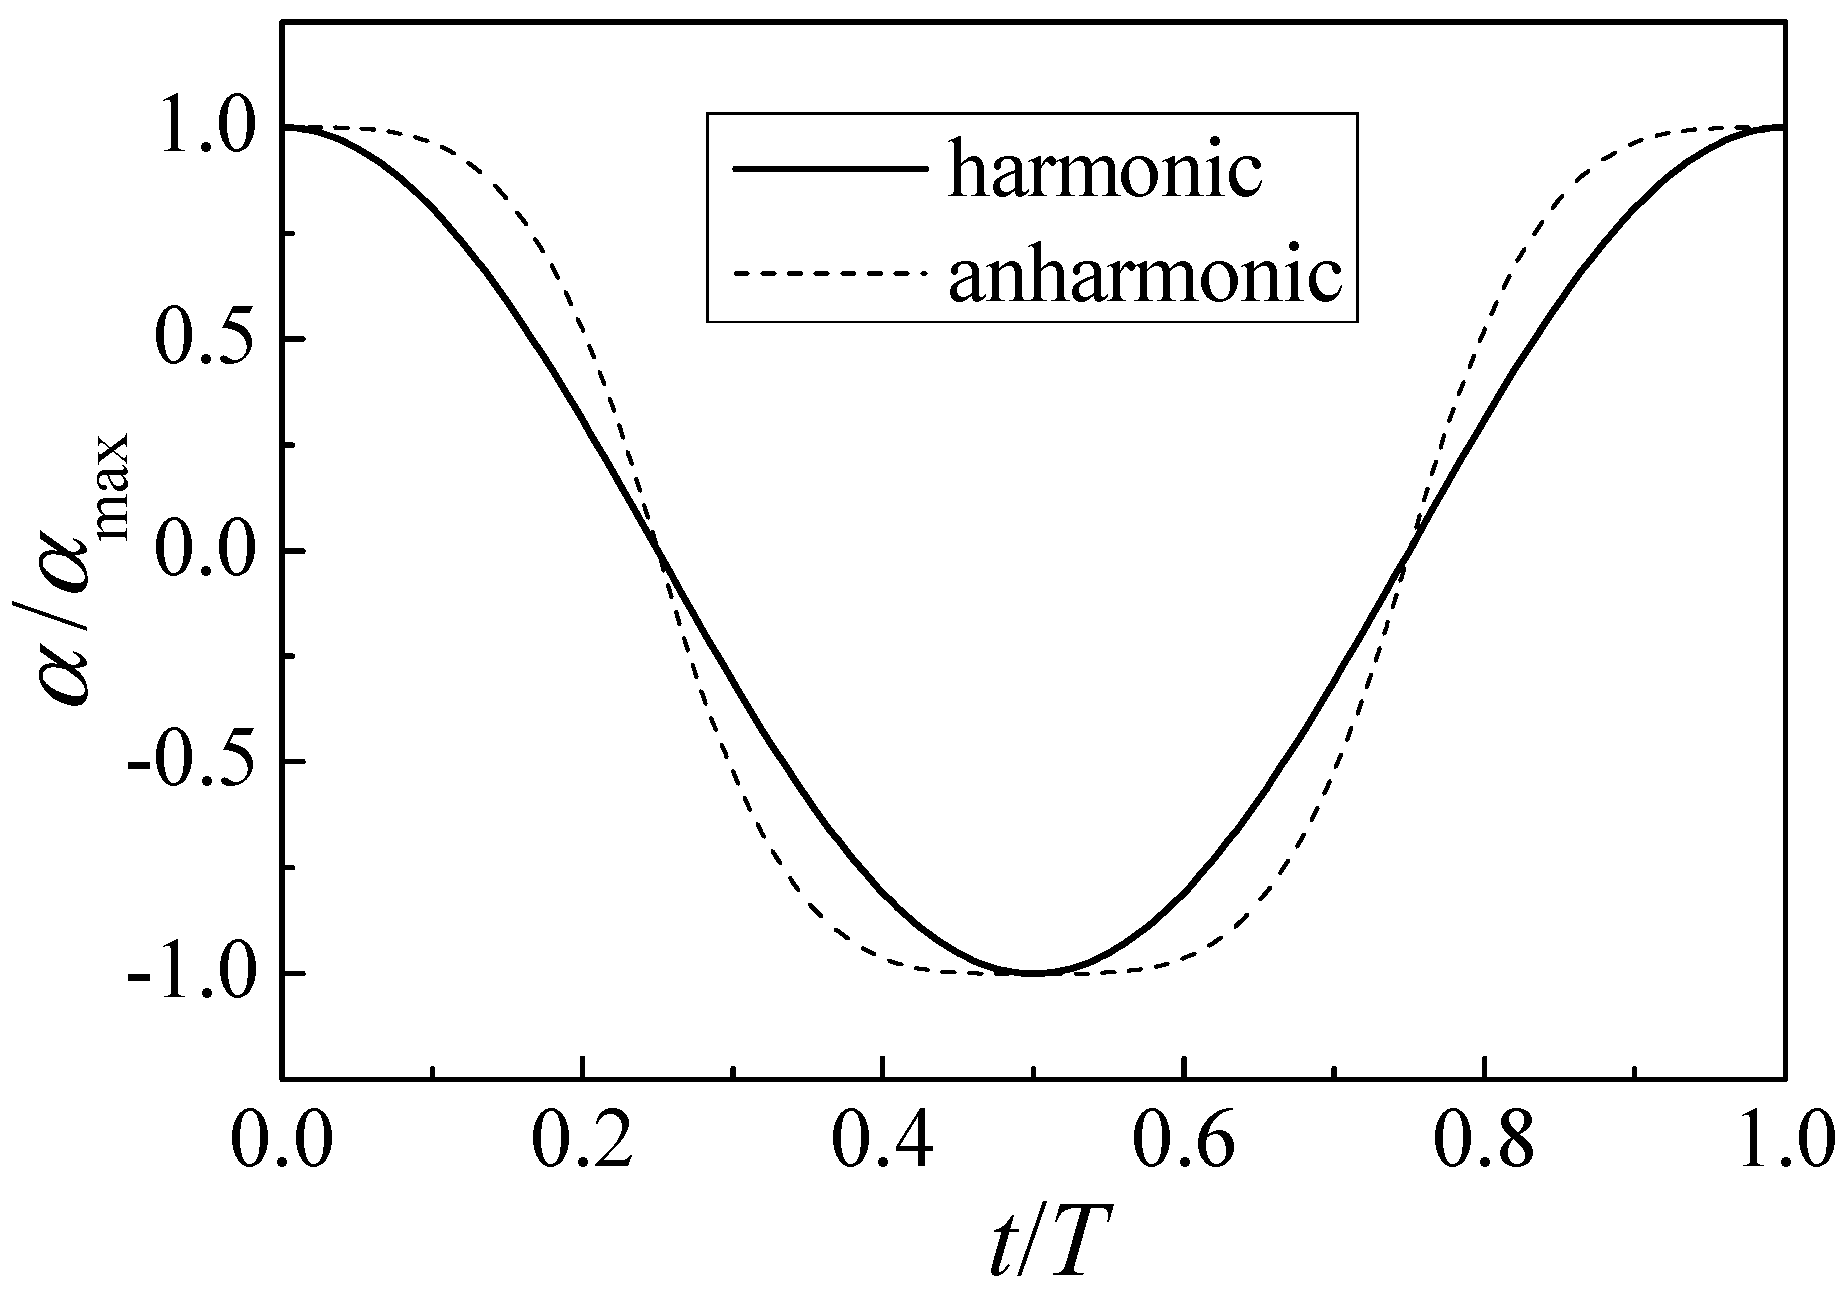
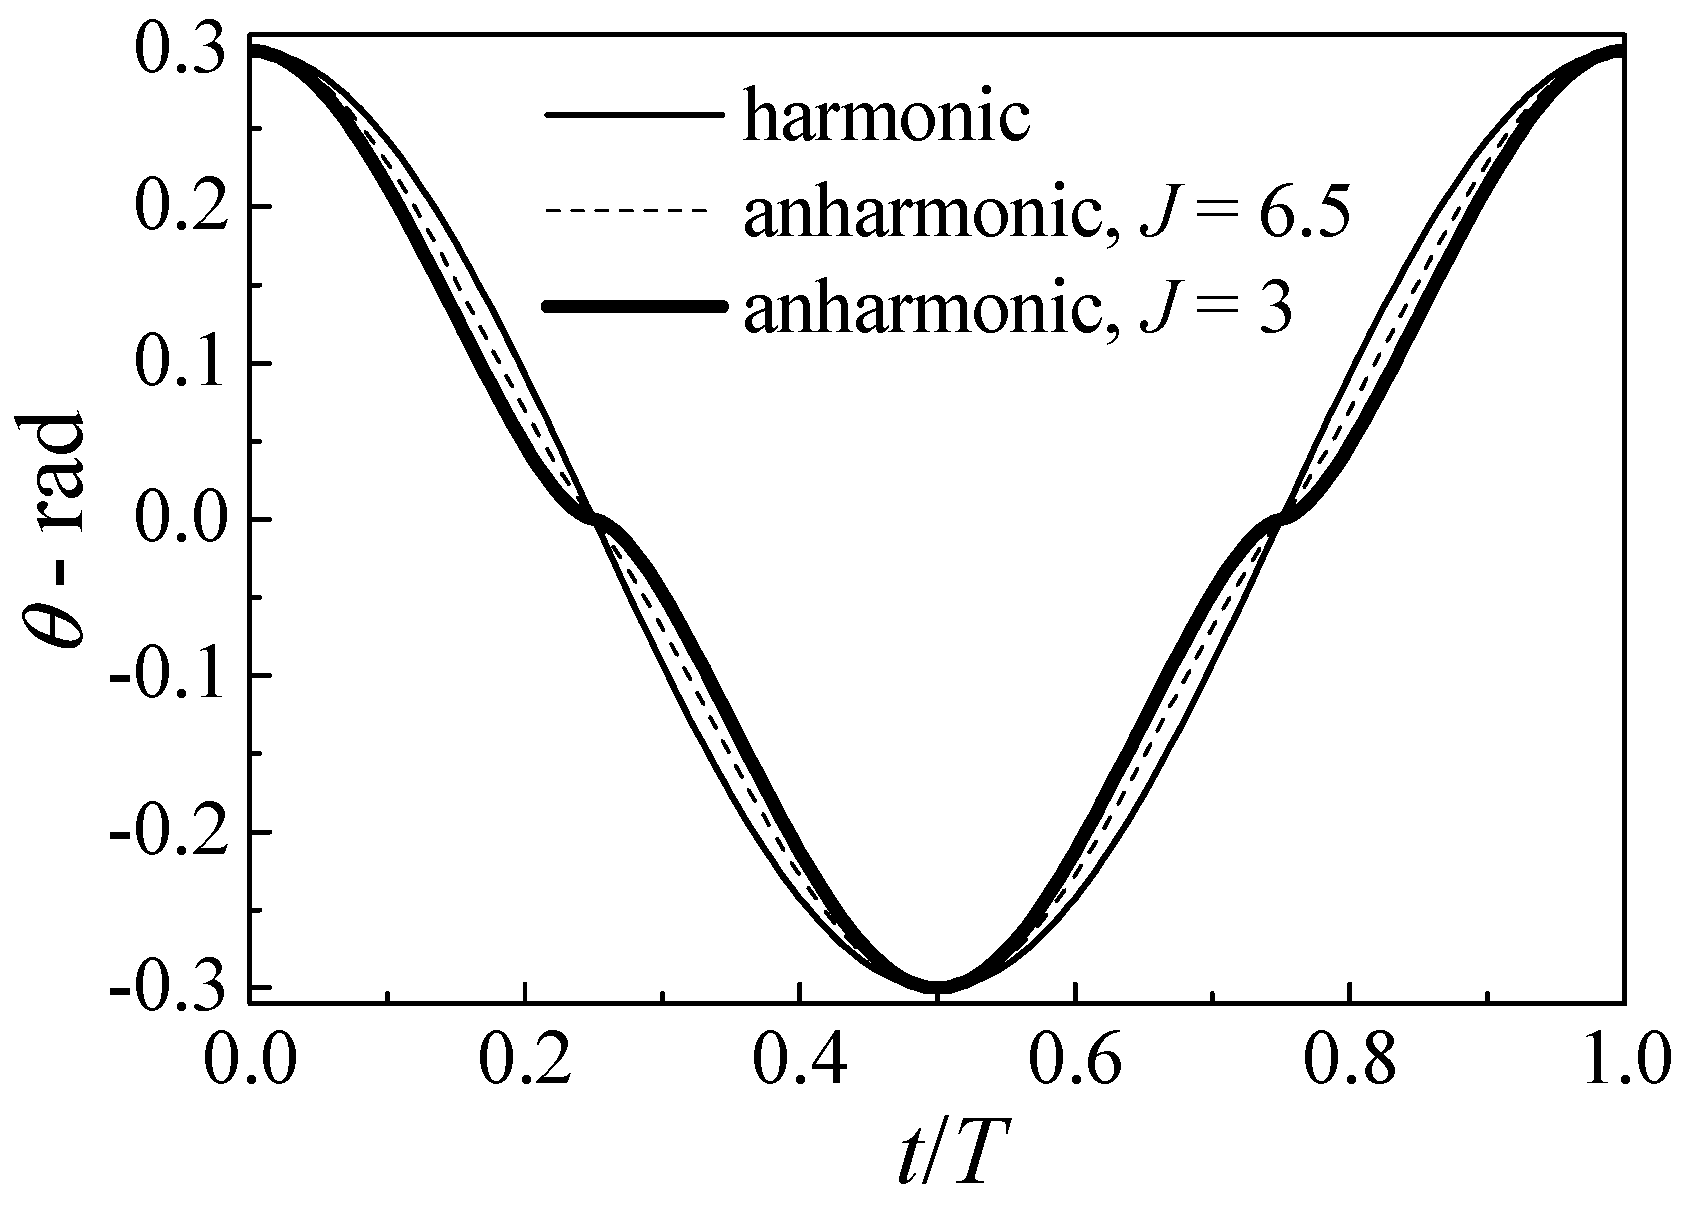
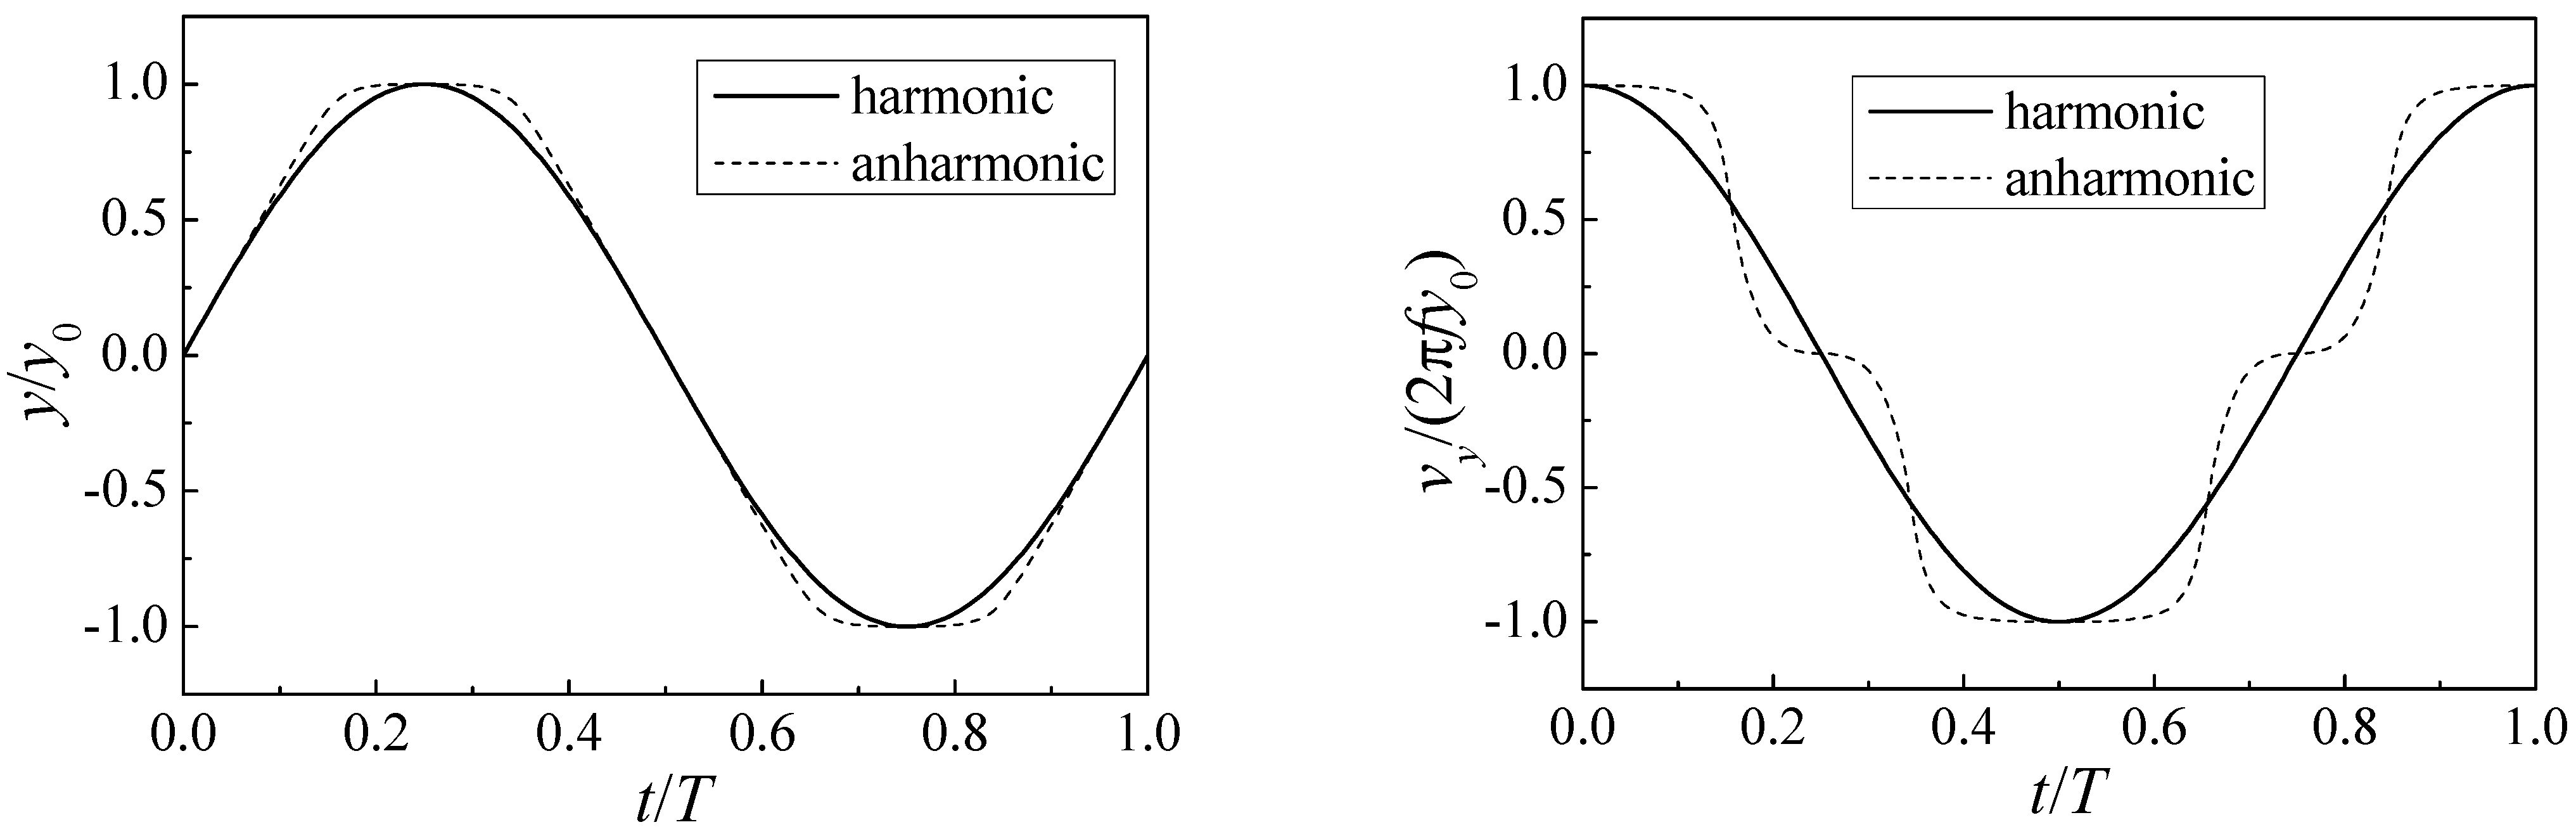
According to the previous analysis in
Section 2, two anharmonic pitch motion trajectories under the given heave motion curve and a plumper AoA curve are constructed in
Figure 3. The two anharmonic pitching angle trajectories are designed at the working points of
J = 6.5 and
J = 3, respectively. The parameters are set as follows:
y0/c = 1.5,
s = c/2,
φ= π/2,
θ0 = 0.3rad. The foil propulsive efficiency and thrust coefficient of these three different pitching angle trajectories are compared, and the results are shown in
Figure 19.
Firstly, it is found that from
Figure 20a, no matter what the designed trajectory is, the maximum efficiency values are almost the same. This means that even if some scholars have concluded that the anharmonic motion trajectory could improve the propulsion efficiency and thrust coefficient of the foil under a certain working condition [
19], the results of this paper show that this designed anharmonic motion is not helpful to further improve the foil propulsion efficiency under a series of working conditions close to the maximum propulsion efficiency 80%. Although the construction methods of anharmonic motion trajectories are different, similar conclusions have also been obtained in Hover’s research [
18]. He pointed out that in terms of maximum efficiency the cases of square and sawtooth AoA profiles are largely indistinguishable from the case of harmonic heave motion. However,
Figure 20b shows that the thrust coefficient of the anharmonic trajectory is higher than that of the simple harmonic trajectory under the condition of a large advance coefficient. It shows that the anharmonic trajectory design may be applied to the engineering which needs a large thrust.
It is worth mentioning that with an anharmonic trajectory the efficiency curve of the foil has a slow downward trend under the condition of a larger advance coefficient. And under the high advance coefficient
J, the anharmonic motion trajectory (equivalent to plumper AoA curve) corresponds to higher efficiency; while at low advance coefficient
J, the efficiency corresponding to the anharmonic motion trajectory is lower. The same conclusion can be drawn from the research results of Lu [
24]. In other words, compared with the foil with a simple harmonic trajectory, the foil with the anharmonic trajectory can maintain high efficiency with a relatively wider working range, and help to improve the efficiency and thrust coefficients under the condition of high advance coefficient
J.From the above analysis of the influence of several parameters on efficiency, it is found that the effect of heaving amplitude on the highest efficiency is the most obvious. Increasing heave amplitude can significantly improve the foil propulsive efficiency. Considering that it is difficult to achieve too large heaving amplitude in engineering, this paper only analyzes the case of heaving amplitude of 3.0. Secondly, phase difference also has a significant influence on efficiency, but this effect is related to the reference working condition, which needs further study. Then, the pitching angle amplitude has little effect on the maximum efficiency value of flapping foil, while it will affect its optimal speed range. At last, the influence of the anharmonic pitching angle trajectory on the maximum efficiency is very small. Considering that there are many parameters in the construction of anharmonic motion trajectory, and the construction methods of various researchers are also different, which may lead to the difficulty of unified parameter design in engineering application. At the same time, it is relatively difficult to realize the anharmonic motion of flapping wing by using crank connecting rod mechanism. Therefore, this paper holds that it is not of great practical significance to study the use of anharmonic motion to further improve the propulsion efficiency, especially under the working conditions near the highest efficiency point.
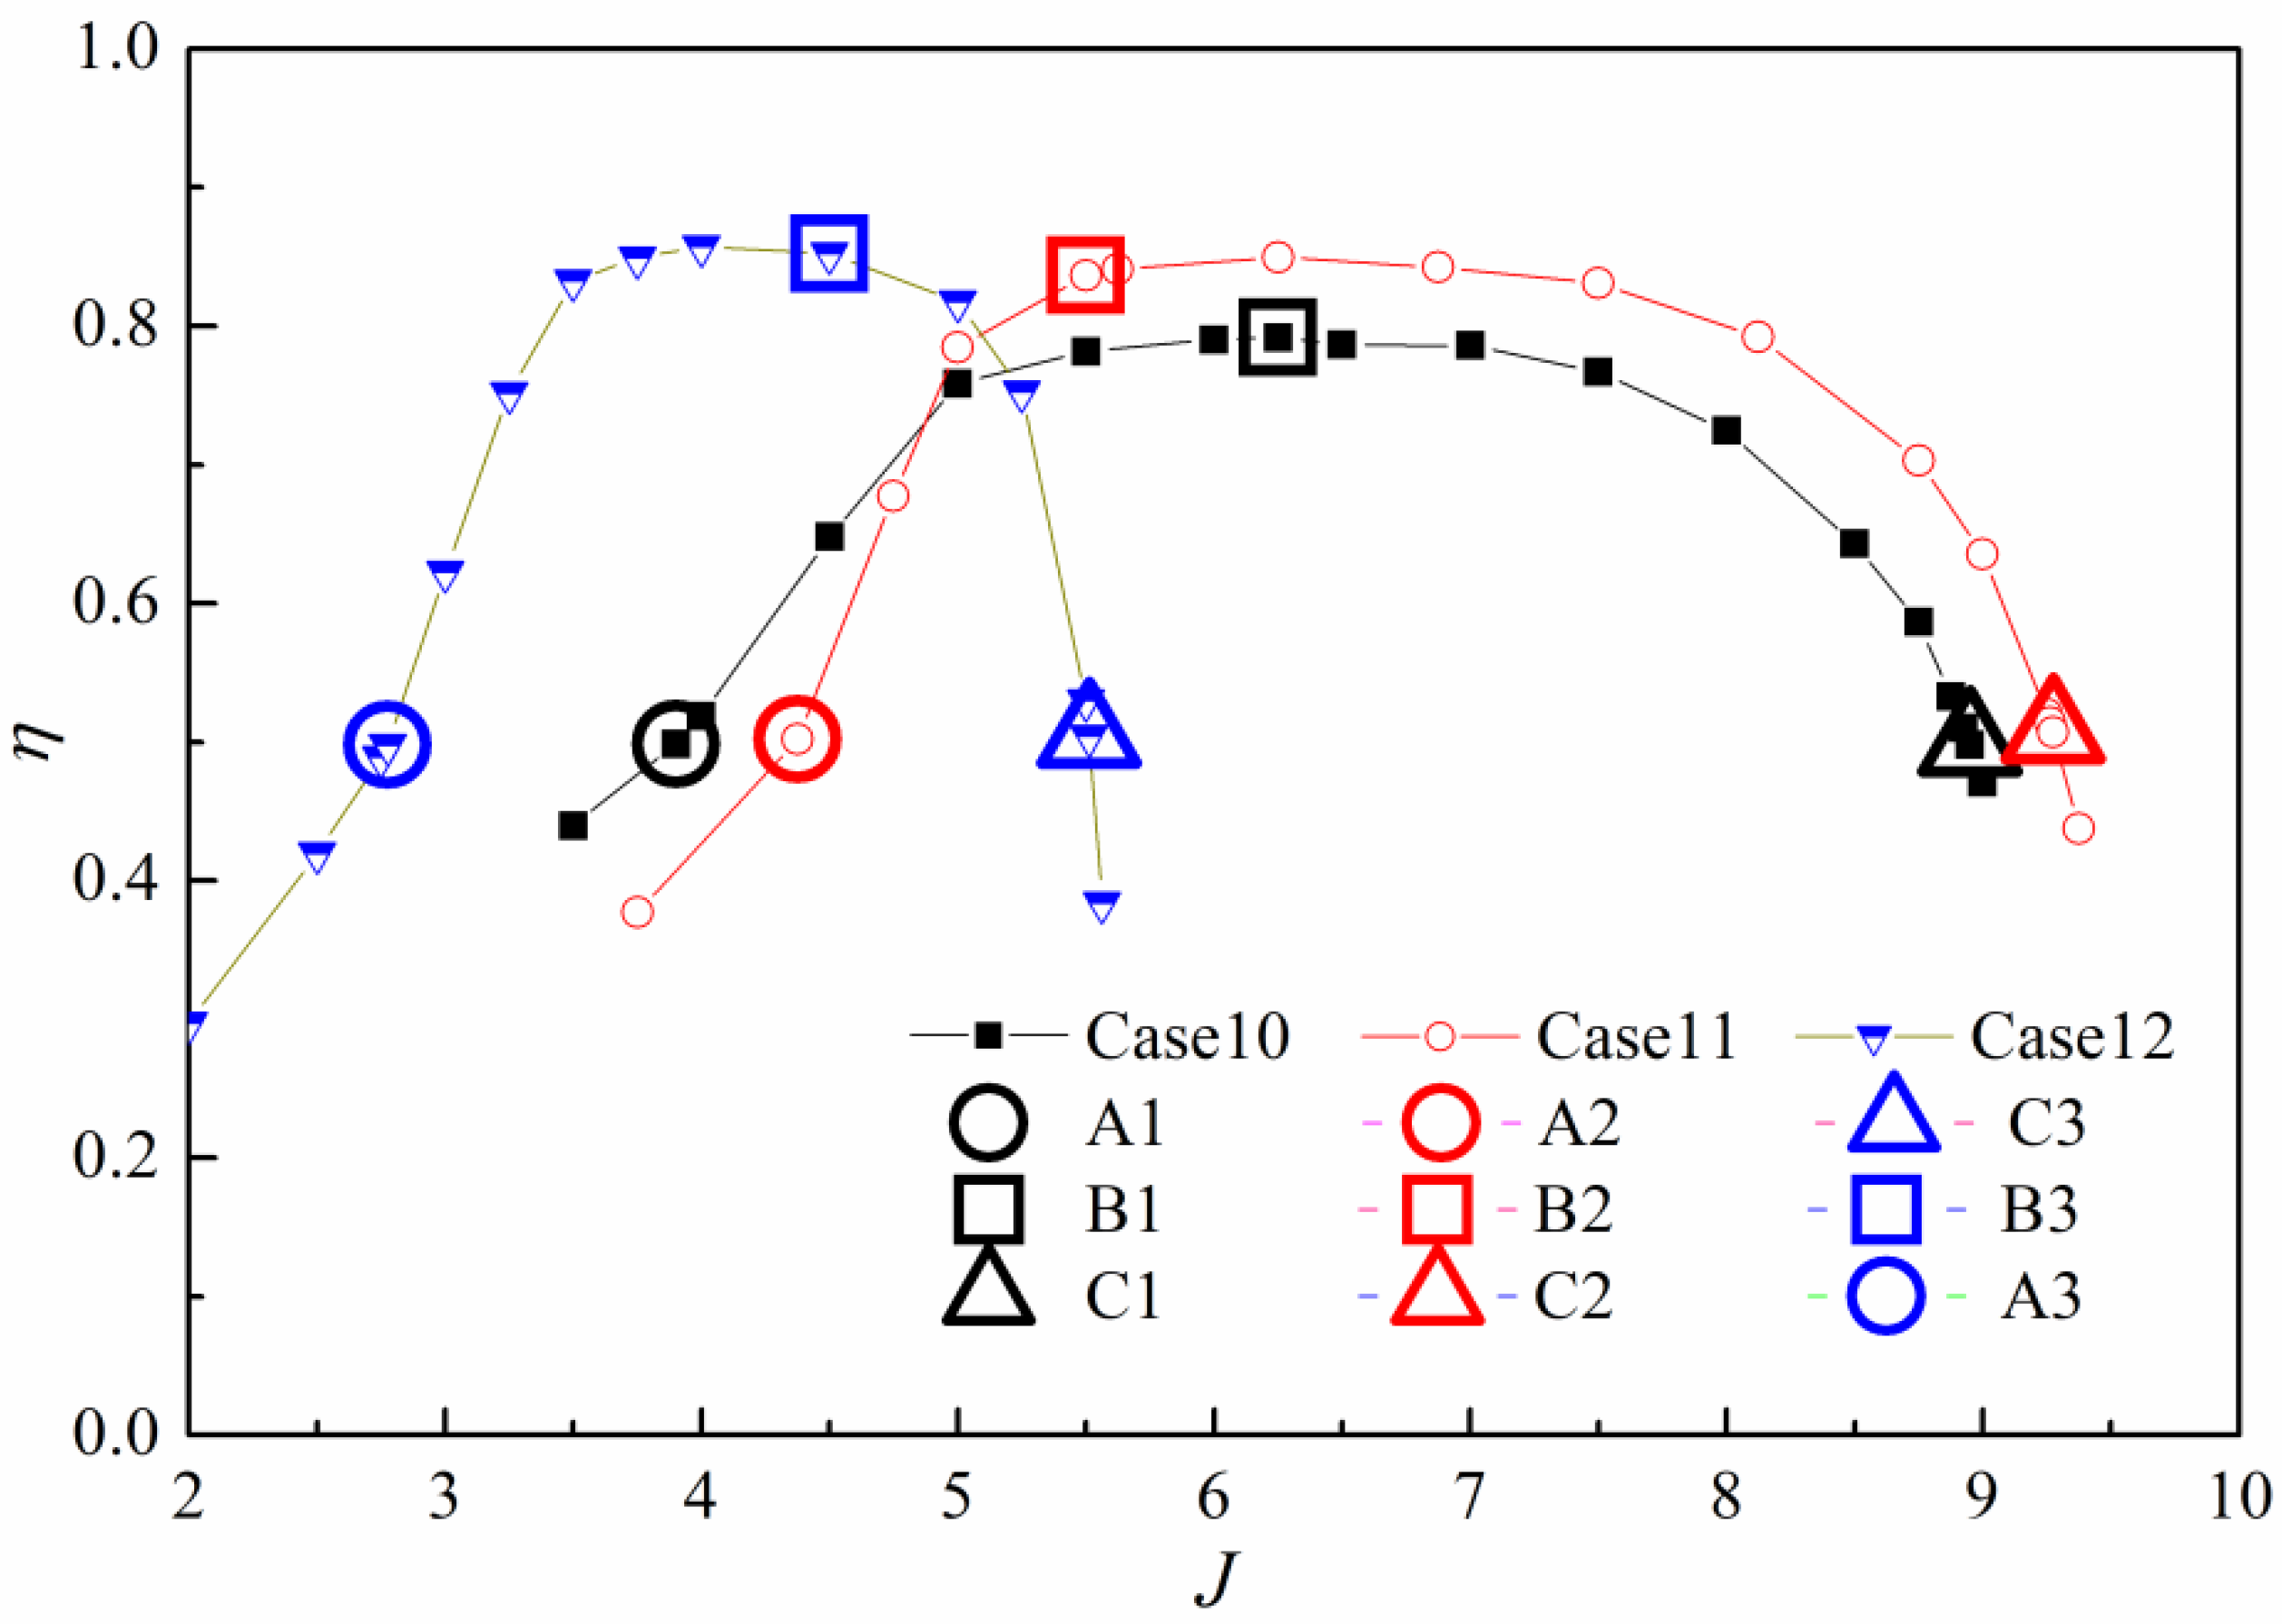
5.4. Wake Field and Force Analysis
In order to further analyze the high-efficiency reason of flapping foil, this part discusses the wake field and the force on the foil. Three groups of high-efficiency cases are selected in this section for further study according to the previous research results. At the same time, the highest efficiency point, 50% efficiency point on the left side of the highest efficiency point and 50% efficiency point on the right side of the highest efficiency point are selected for flow field and force analysis, respectively. The selected three groups of parameters are shown in
Table 2. Three efficiency curves and nine analysis points are shown in
Figure 21.
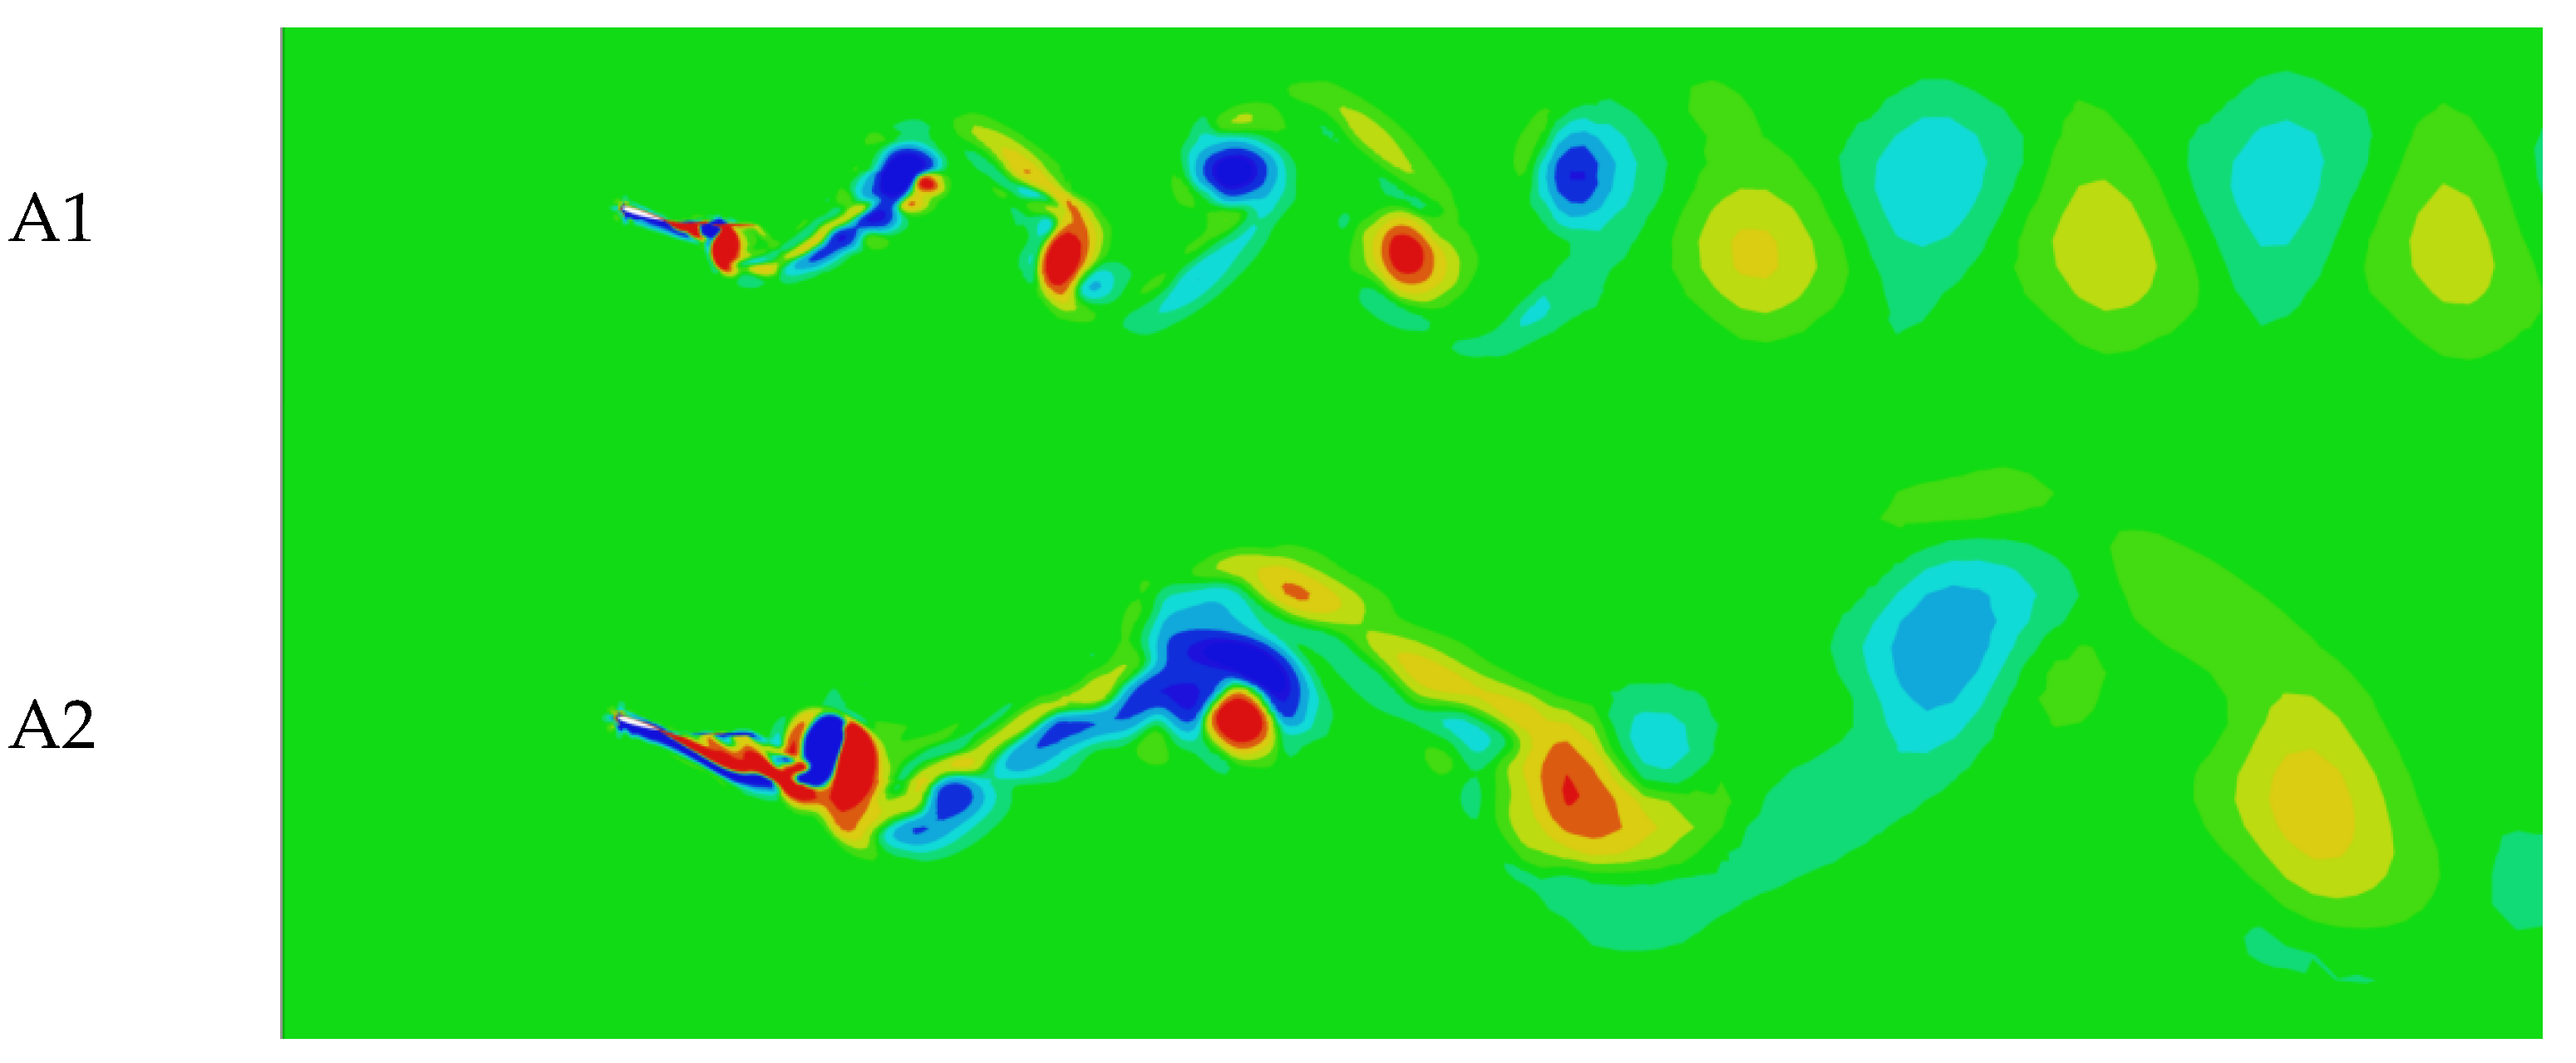
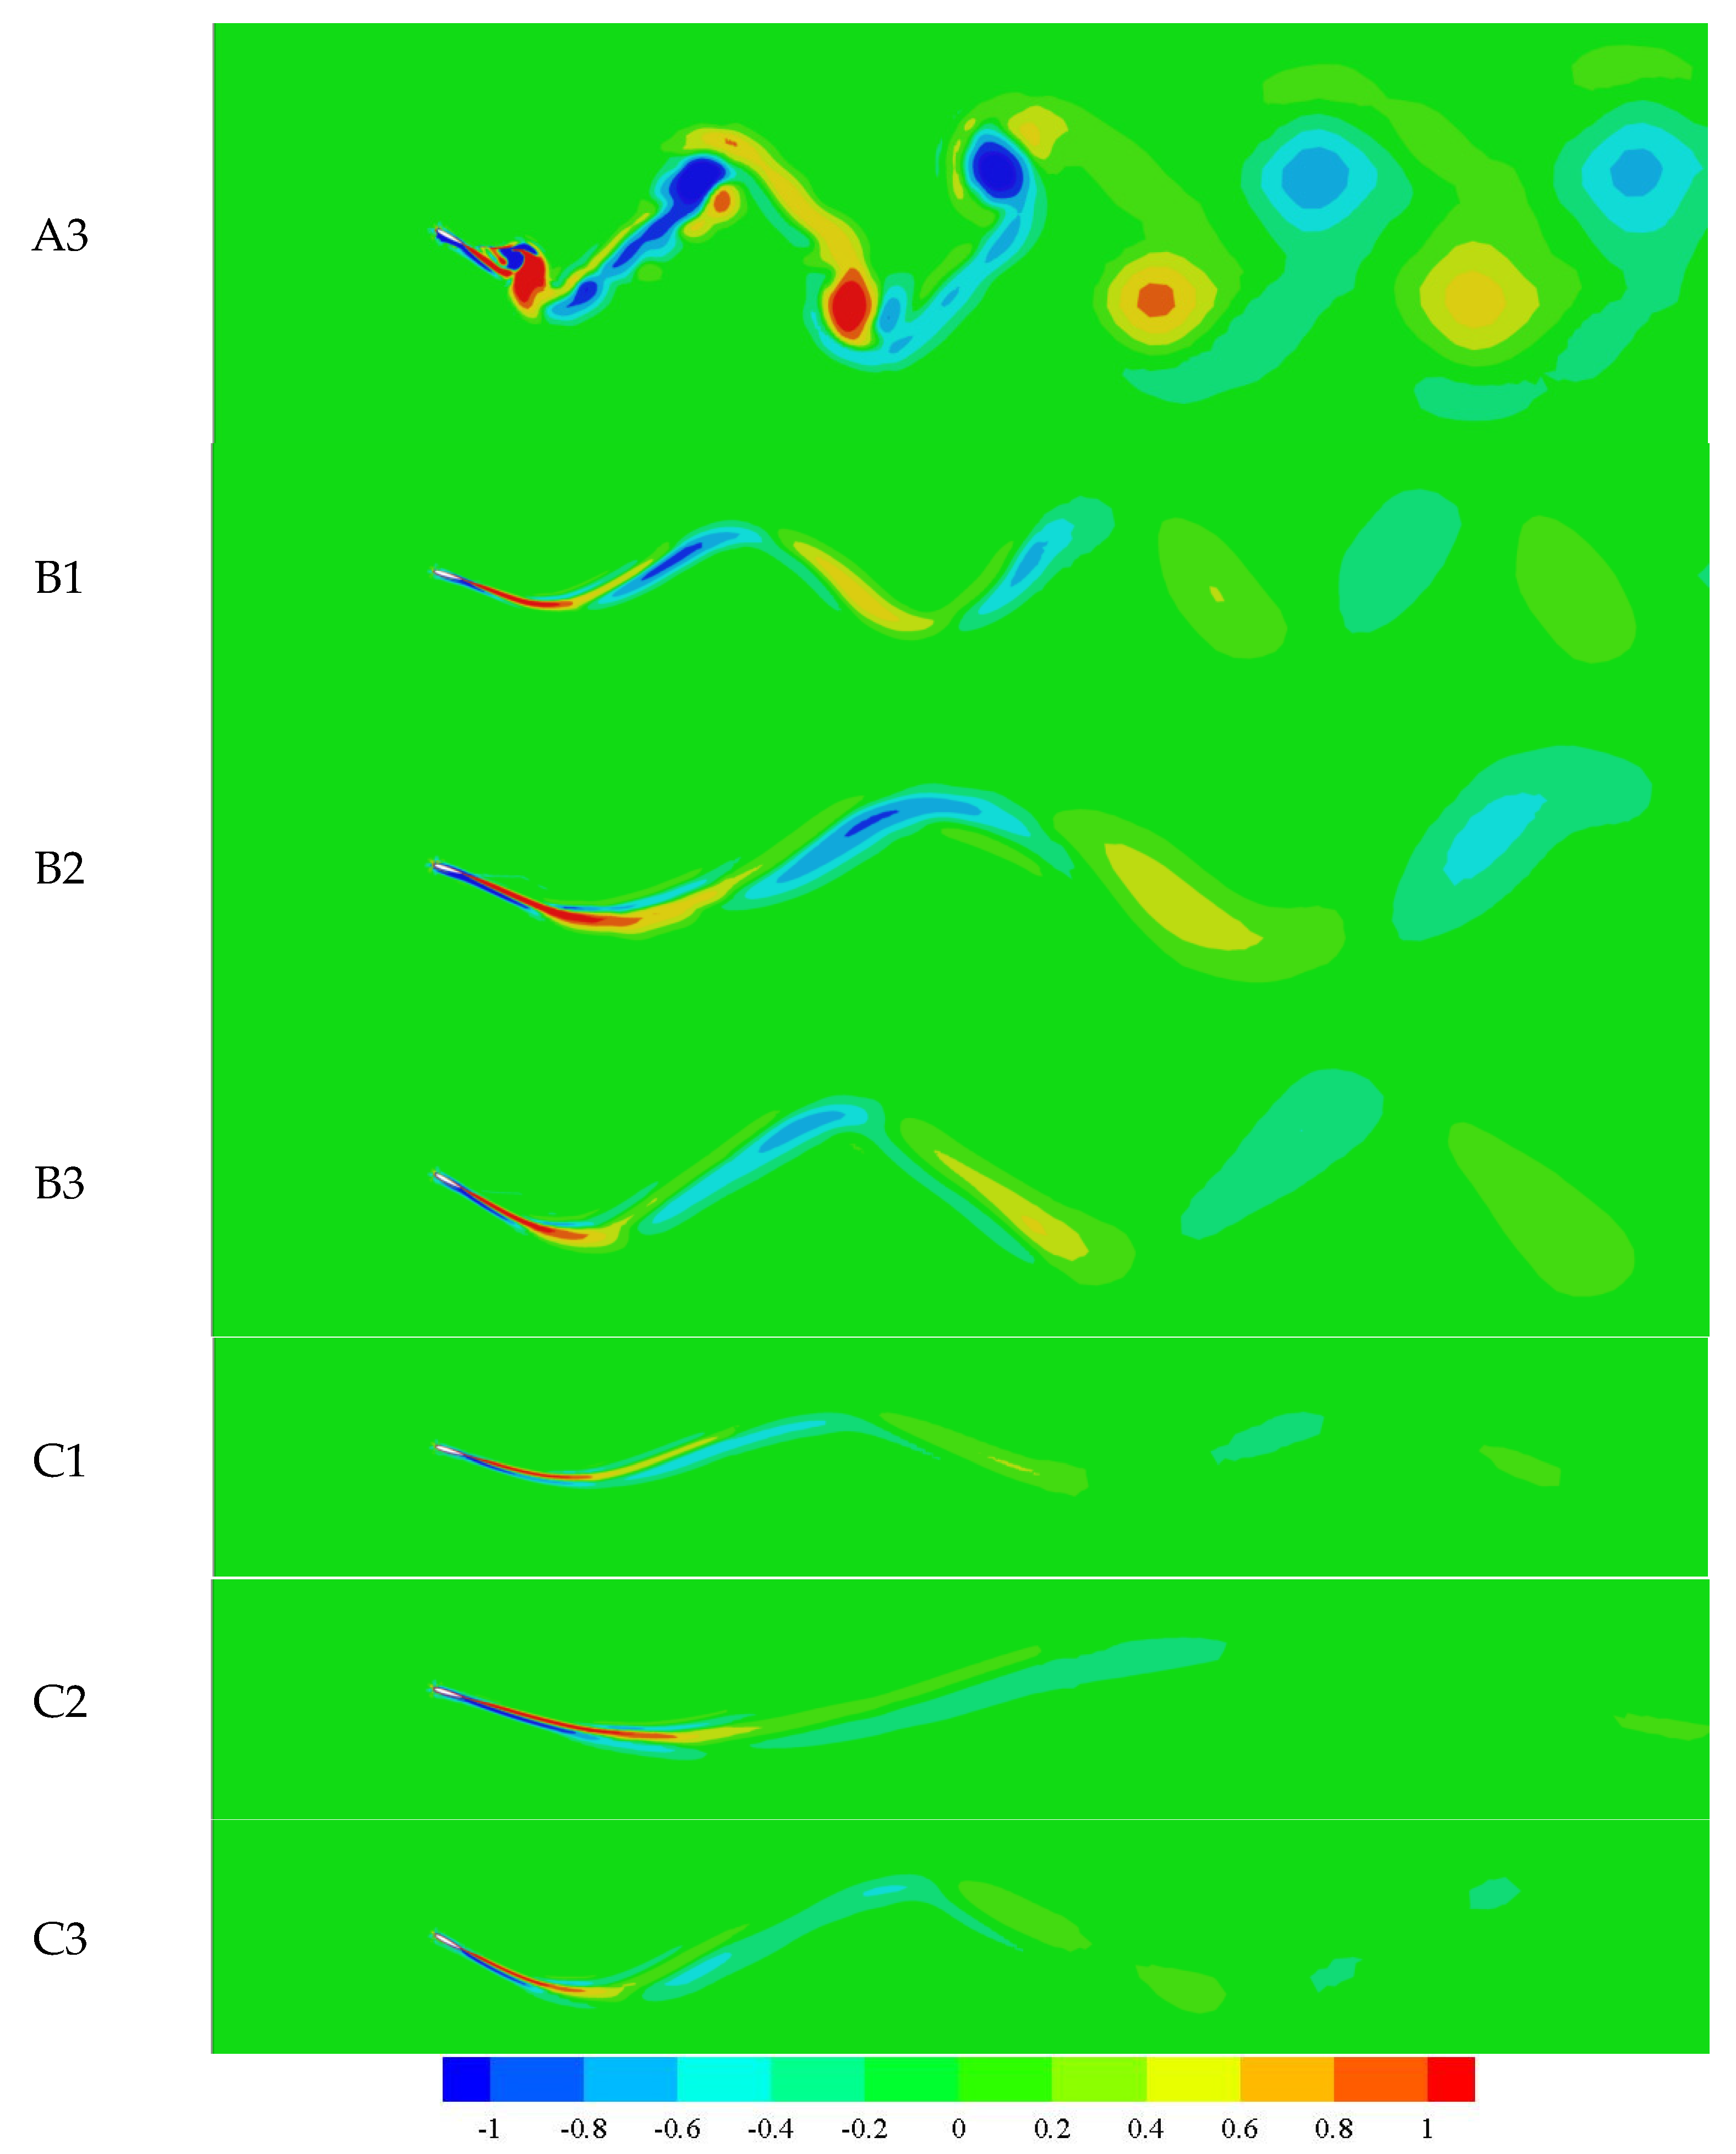
Firstly, the vorticity fields of nine analysis points from A1 to C3, which are shown in
Figure 21, are compared in this section. From vorticity distribution contours of nine analysis points shown in
Figure 22, it is easy to recognize that the wake vortex of A1, A2, and A3 points are stronger than that of the other six points, which may be the main reason for their low efficiency. In contrast, the wake loss of the other six points, B1 to B3 and C1 to C3, are smaller because of their narrow-banded tailing vortex structure. It should be noted that, although the tailing vortex structures of these six points are almost the same narrow-banded, the efficiencies of C1 to C3 are still not as high as that of B1 to B3, and their wake attenuation is much faster than points B1 to B3. The details remain to be discussed in the follow-up work.
Next, the phase difference between the mechanical parameters and the velocity parameters are discussed. When the flapping wing moves at a constant speed, the calculation parameters that affect the efficiency value include not only the mechanical parameters
Fx,
Fy and
Mz, but also the velocity parameters
vy and
ωz. These parameters fluctuate with time, so when calculating the product, the phase difference between the parameters has a great influence on the result.
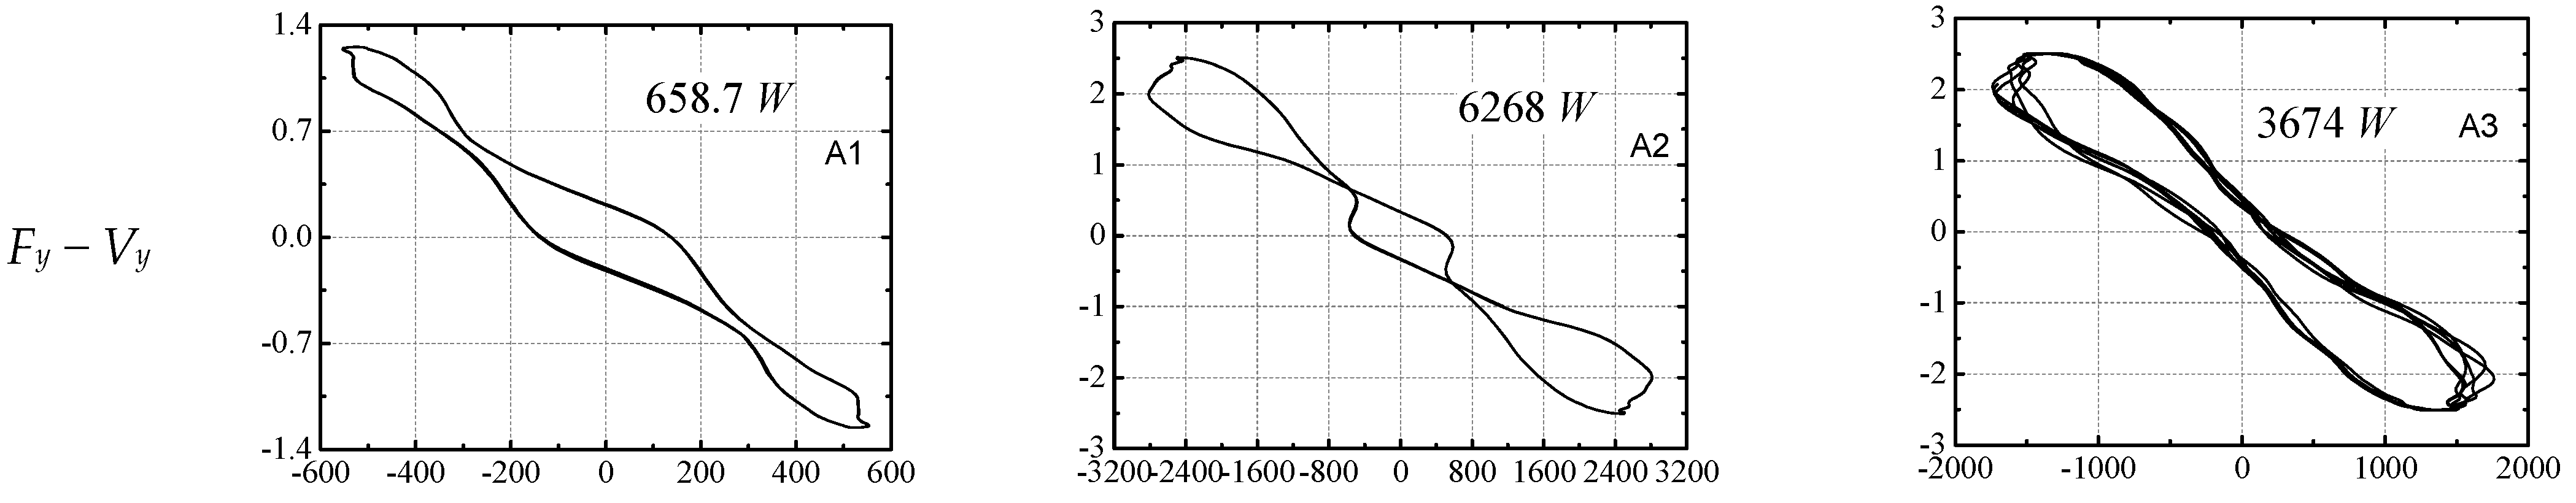
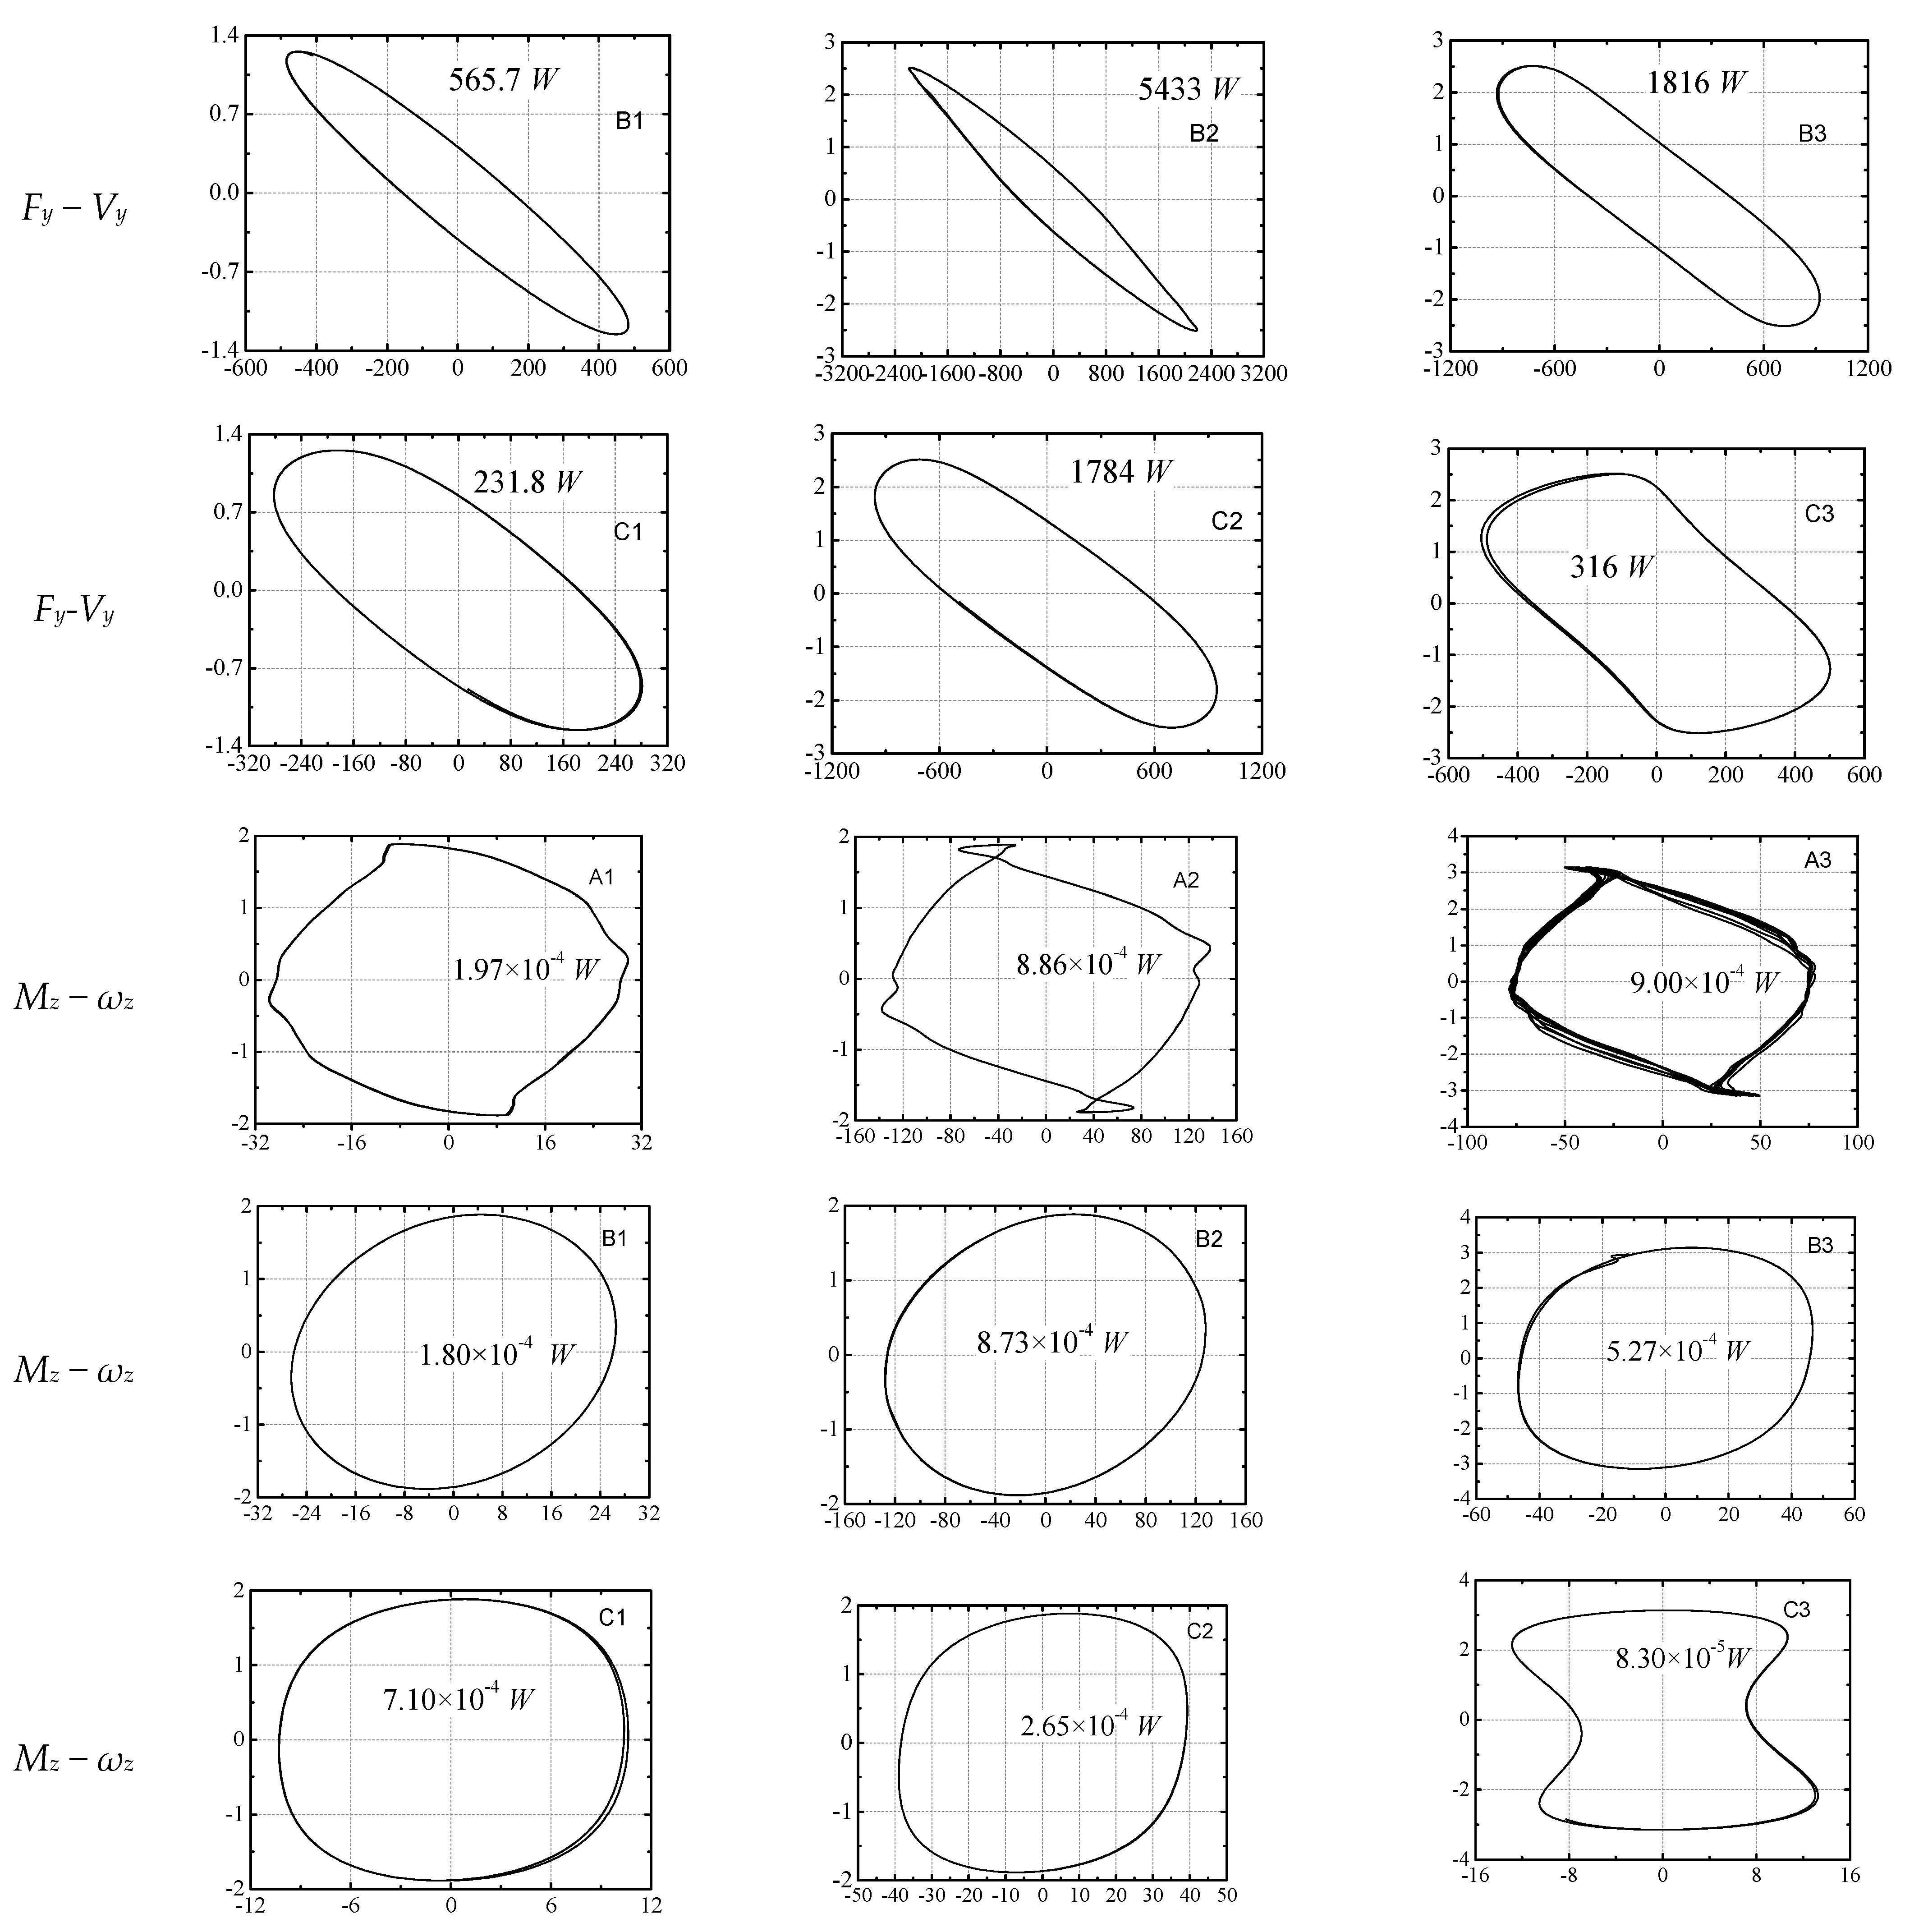
Figure 23 shows the
Fy − vy and
Mz − ωz phase diagrams of nine operating points, respectively. Viewing the situation from a whole, there is a certain phase difference between both
Fy − vy and
Mz − ωz. The phase difference between
Fy and
vy is small, while the phase difference between
Mz and ωz is large, which is close to 90°. At the same time, the magnitude of
Fyvy is much larger than that of
Mzωz. The above two points show that the y-direction force generates more power in the input power, while the torque around the
z-axis is almost no work. In order to compare the work performance more clearly, the average input powers in a period of nine operating points are also given in the
Figure 23. It can be seen more clearly from the data that compared with the Y-direction force, the input power of the torque around the
z-axis can be almost be ignored. Then, the
Fy − vy and
Mz − ωz phase diagrams of different working conditions are compared in detail. From the horizontal comparison of A1 to A3, not only their
Fy − vy phase diagrams, but
Mz − ωz phase diagrams are similar to each other. And the same phenomenon is also found in the phase diagrams of B1 to B3 and C1 to C3. It can be found that at the similar efficiency points the force characteristics of the flapping foil are similar. From the longitudinal comparison of A, B, and C, the phase diagram curve becomes smoother from A to C, that is, under the same motion parameter, with the increase of the speed coefficient, the time history curve of force is closer to the simple harmonic. At the same time, the phase difference between
Fy and
vy increases with the increase of the advance coefficient. However, efficiency is related to
Fx and
Fy, at the same time, we cannot draw specific conclusions from the analysis of
Fy here.
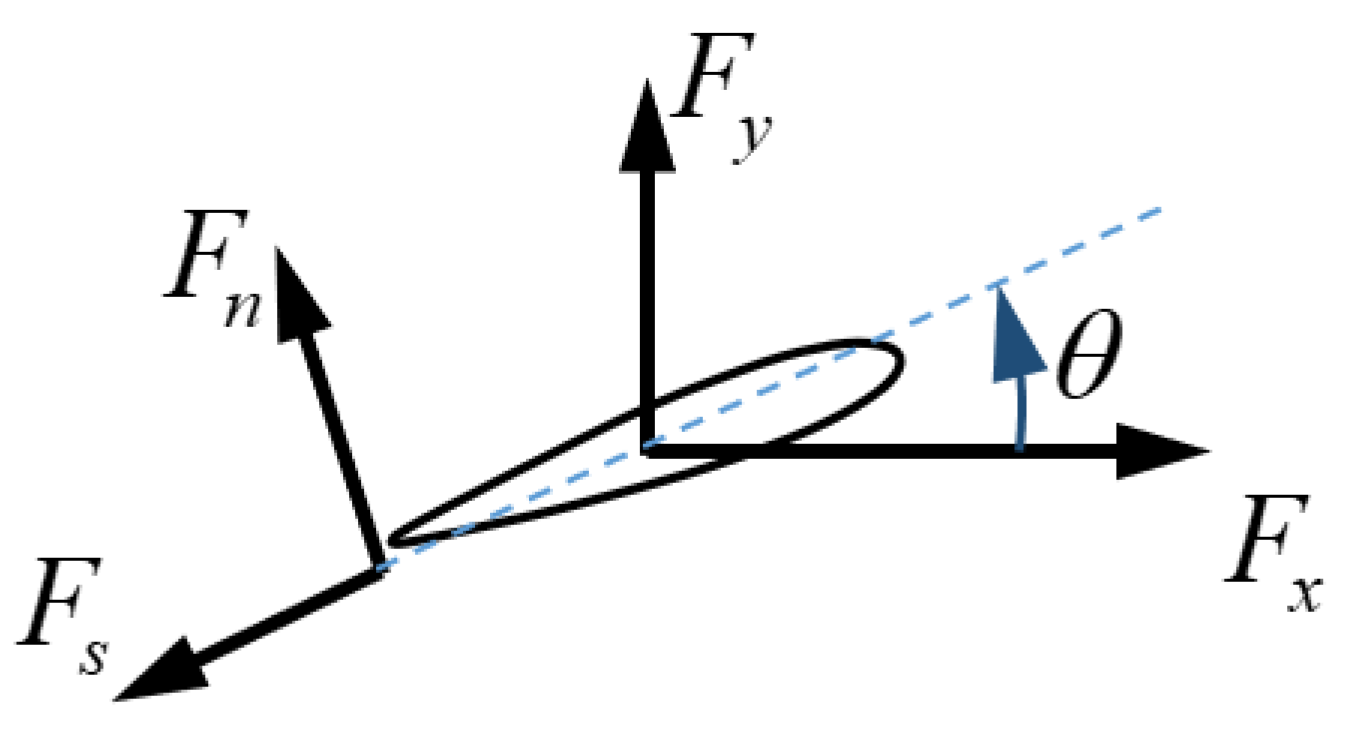
Then, according to the above analysis, when the parameters of the flapping foil are determined, the forces that affect the propulsion efficiency are only
Fx and
Fy. In previous studies, the forces on airfoil are usually divided into drag
R along the relative inflow and lift
L perpendicular to the relative inflow. However, since the inflow angle and attack angle of the flapping foil change at any time during the working process, its lift coefficient is also unstable, which is not only related to the AoA, but also related to the angular velocity of motion, so it is difficult to analyze according to the lift and resistance. In this paper, the forces on the airfoil are divided into
Fs along the chordwise direction and
Fn perpendicular to the chordwise direction for analysis. As shown in
Figure 24, the relationship between the forces is shown as follows:
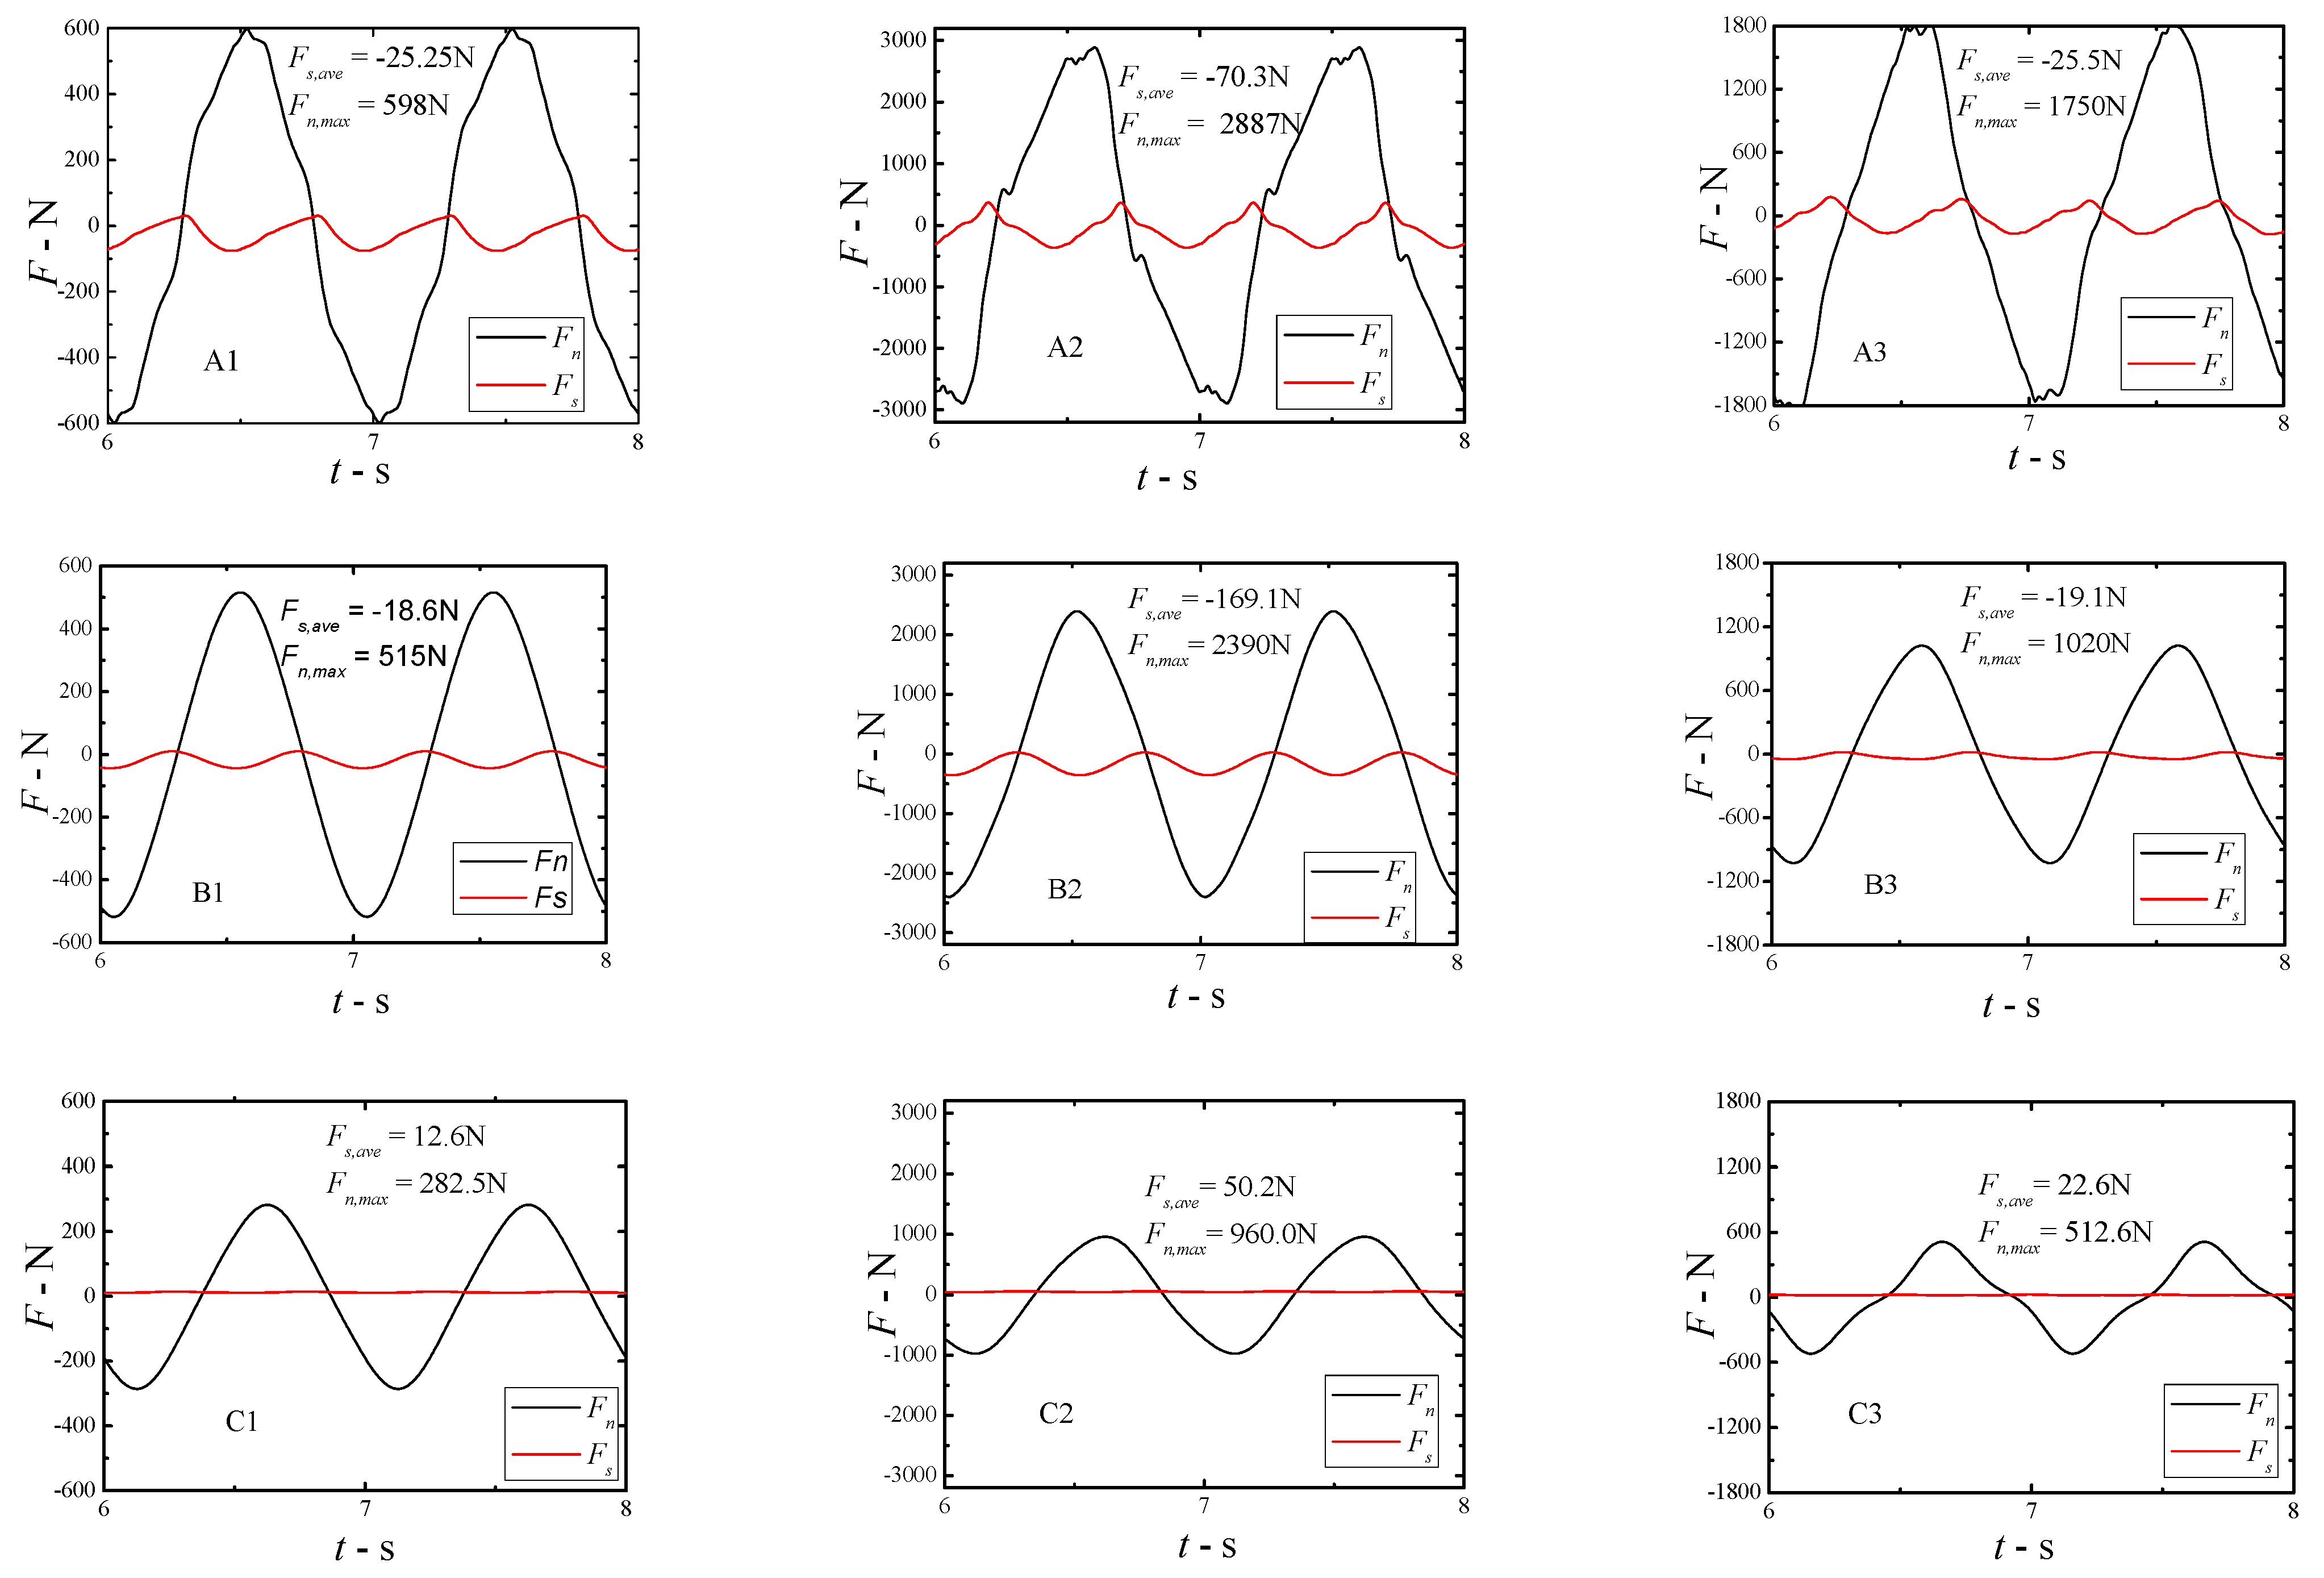
The
Fs and
Fn curves of nine working points calculated from the above formula are shown in
Figure 25. First of all, it can be seen intuitively from the results that under any working condition, compared with the normal force
Fn, the chord force
Fs is very small and can be ignored. At the same time, we also found that under the same motion parameters, when the working point moves from A to C, the normal force
Fn decreases gradually, while the efficiency does not decrease with the decrease of the normal force
Fn, but reaches the peak at point B. At the same time, compared with A and C, the phase difference of the two forces at point B is much closer to 90. Therefore, comparing the different operating points of the same flapping foil, this paper cannot clear the relationship between
Fn and the highest efficiency point yet. However, it can be determined that since
Fs is smaller than F
n, the resultant force of
Fx and
Fy is mainly determined by
Fn. Therefore, if the corresponding relationship between
Fn and motion parameters can be determined, the efficiency under the motion parameters can be directly obtained. However, because there are many motion parameters that affect
Fn, and the relationship between them is complex, this paper has not made an in-depth study; this part of the work will be gradually improved in future work. Finally, from the average value of
Fs and the maximum value of
Fn also given in
Figure 25, it can be seen that at point C, the average value of chord force
Fs is positive, which indicates the viscous resistance; while, at point A and point B, the average value of chord force
Fs is negative, that is, the chord force points to the leading edge, which is a special phenomenon. According to the conventional imagination, the chord force of the airfoil should be along the flow direction, which is the result of the viscous effect, but in the flapping foil, we found that the force may be against the flow direction.


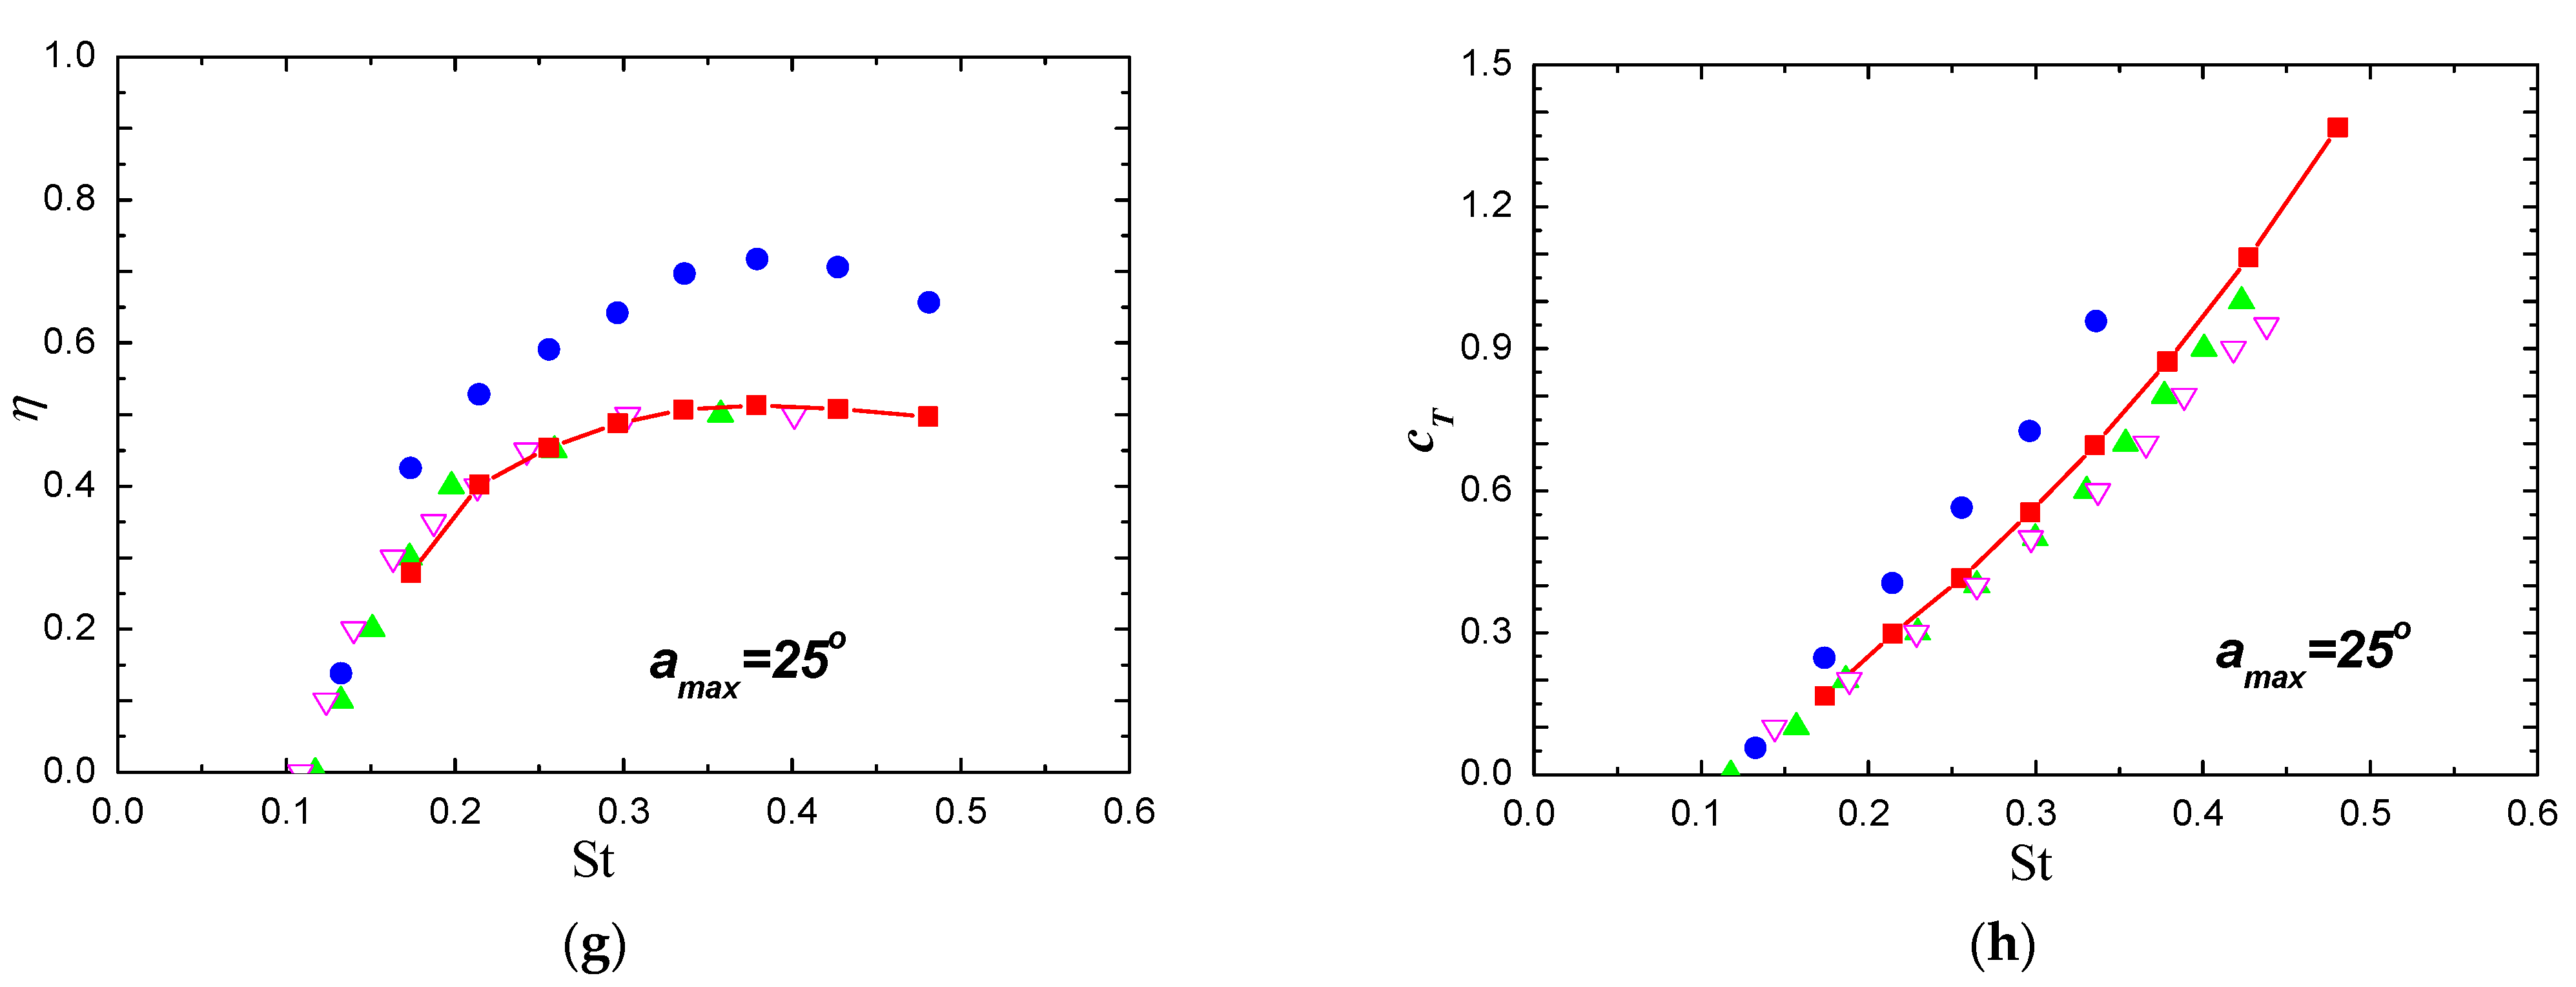
 is the CFD results of this paper,
  is the result of Anderson’sAnderson experiment,
  is the result of Read’sRead experiment,
  is the result of Schoveiler’sSchoveiler experiment).


