Article

Coupling Water Resources and Agricultural Practices for Sorghum in a Semiarid Environment

by
Ailton Alves de Carvalho
1,*,
Abelardo A. de A. Montenegro
1,*,
João L. M. P. de Lima
2,3,
Thieres George Freire da Silva
4,
Elvira Maria Regis Pedrosa
1 and
Thayná Alice Brito Almeida
1
1
Department of Agricultural Engineering, Federal Rural University of Pernambuco State, Recife 50910-130, Brazil
2
MARE—Marine and Environmental Sciences Centre, Department of Life Sciences, Faculty of Sciences and Technology, University of Coimbra, Rua da Matemática, 49, 3004-517 Coimbra, Portugal
3
Department of Civil Engineering, Faculty of Sciences and Technology, University of Coimbra, 3030-788 Coimbra, Portugal
4
Agrometeorology Laboratory, Unidade Acadêmica de Serra Talhada, Universidade Federal Rural de Pernambuco, Serra Talhada 56909-535, Brazil
*
Authors to whom correspondence should be addressed.
Water 2021, 13(16), 2288; https://doi.org/10.3390/w13162288
Submission received: 22 July 2021 / Revised: 16 August 2021 / Accepted: 17 August 2021 / Published: 21 August 2021
(This article belongs to the Special Issue Improving Agricultural Water Productivity in the Dry Areas)

Abstract

:
Water scarcity and changing rainfall distribution have caused uncertainties in relation to agricultural production in semiarid areas. In this context, water reuse for irrigation is a promising alternative, although requiring irrigation and agricultural management. Production of forage plants is strategic for semiarid areas due to their high tolerance to stresses and use as animal fodder. The objective of this work was to evaluate the combined performance of treated wastewater irrigation and mulching on forage sorghum and on soil attributes in Northeast Brazil. Sorghum was cropped in November 2018, three months before the beginning of the hydrologic year, and cultivated over three cycles until April 2019. The experiment was designed with five irrigation depths (60%, 80%, 100%, 120%, and 140% of crop evapotranspiration), and with four soil cover conditions (0% (witness), soil covered with native vegetation, with coconut coir, and with macerated moringa seeds), adopting four replications. Irrigation with treated wastewater promoted linear increases in forage sorghum yield at irrigation depths of up to 140% of crop evapotranspiration. Mulch promoted a 24% increase in productivity in relation to the area where conservation was not practiced, being able to control salinity while also contributing to the higher incorporation of organic matter. Irrigation with treated wastewater had no negative agronomic impacts on soil, once natural rainfall events typical of the Brazilian semiarid region allowed effective salt leaching from shallow sandy soils.

1. Introduction

The Brazilian semiarid region has great potential for agricultural production, with high solar radiation throughout the year [1]. Rainfall is remarkably irregular in time, however, usually occurring in high-intensity spells followed by long dry periods [2]. Water resources are very limited, and trends in reductions in the number of rainy days and rainfall amounts due to climate change have been reported [3]. Climate change in the region could severely impact water resources’ availability, recharge, and soil moisture [4]. Despite such limitations, total annual mean rainfall is usually greater than 600 mm year−1 [5], which is relevant for coping with water scarcity in a region where high evaporation is a challenge and where rainwater harvesting practices and wastewater reuse could play an important role [6,7,8].
In Brazil, about 93% of the urban population has access to treated water, but only 60.2% benefit from sewage collection and only 46% of the collected sewage is treated. Thus, the country presents a lack of adequate basic sanitation, generating several social and environmental problems [9]. Furthermore, political and ecological factors should be considered in water resources management, as is highlighted by [10], where research was conducted on crop production in Brazil, combining the economy of scale and the hydropolitics and geographic approaches. Using wastewater for irrigation is a promising alternative to improving food production in semiarid zones, as widely reported in the literature [11,12,13,14,15,16], although it requires soil management practices [8] and precise estimation of crop demands [17,18]. Of the various environmental and health hazards, salinity is one of the main threats of using wastewater for agriculture [19,20], particularly when deficit irrigation is adopted [21]. Long-term wastewater irrigation might cause salinization processes [22], and management practices such as leaching depths [23], drainage [20] are essential, as well as choosing crops that tolerate salinity [24]. Of the crops tolerant to salinity and water stress, Sorghum sudanense is one that has been widely adopted [8,14,25], particularly in the Brazilian semiarid region [14,26].
Moreover, selecting planting times to match periods of lower crop demand and agricultural practices such as mulching might play an important role in this, too [14]. Mulching significantly increases irrigation efficiency by enhancing soil moisture and reducing salt concentration in the root zone [27,28]. In addition, mulching helps to reduce irrigation amounts and hence could increase water use efficiency, particularly when deficit irrigation is adopted [29]. The effect of mulching on the temporal stability of soil moisture in an irrigated carrot field in the Brazilian semiarid region and verified that mulch significantly enhanced soil moisture throughout the crop cycle was evaluated [30]. The impact of different mulch densities on the infiltration of high-intensity rainfall associated with high return periods was investigated by [28]. Mulch successfully reduced runoff and soil erosion under severe rainfall scenarios for different hydrological rainfall patterns, thus contributing to rainwater harvesting. Similar findings were also observed by [31] in rainfed corn cultivation in the Brazilian semiarid region and by [2], considering cactus rows and coconut mulch as agricultural practices to enhance rainwater harvesting.
Water management based on in situ rainwater harvesting is always challenging [32], especially for crop cultivation in semiarid areas. Agricultural strategies based solely on rainwater are highly risky as several days may elapse between consecutive events, even in the rainy season [33]. Irrigation is thus required to meet crop demands and secure proper crop productivity. Rainwater harvesting is a promising alternative for agricultural irrigation, particularly when associated with conservation practices [7]. Although highly uncertain, monthly total rainfall could be estimated with reasonable precision, depending upon the desired return period [6].
The Brazilian semiarid region is the wettest semiarid region on Earth, with an area of almost 983,000 km2 [34]. These authors studied the rainfall patterns over the region and applied cluster analysis to identify homogenous zones in terms of total annual rainfall and the number of rainy days. Pernambuco State (Brazil) semiarid was classified as one of the driest zones, with an accumulated annual rainfall of 571 mm. The occurrence probability of monthly rainfall distribution in Pesqueira municipality (Pernambuco State; the same region adopted in this study), based on an observed time series from 1920 to 2010 [35]. The mean rainfall from February to July was 84.60 mm month−1 (hydrological year in the region). Exponential models presented the best fit for February and March total rainfall, while the gamma function was the best model for the total rainfall in April. For instance, for a 75% probability of exceedance, a total of 72 mm could be expected, while for a 70% probability, a total of 89 mm would occur from February to April. Such amounts could be highly beneficial to partially meet crop demands and also for salt leaching processes, especially when agricultural conservation practices are adopted. Field measurements and applied numerical modeling to simulate water and salt dynamics in a carrot plot was adopted by [14,36]. They used moderated saline irrigation water and confirmed that rainfall events were essential to supplement salt leaching from the soil profile. Despite this research, water management studies addressing the combined use of wastewater and rainwater are still rare.
Timing the planting date prior to the start of the rainy season is strategic as it allows the accumulated salts to be washed during the irrigation period, using lower quality water. Moreover, the time lag allows harvesting before the wetter months when waterlogging might occur, which would jeopardize crop productivity. Salt leaching due to rainfall depends on various factors, including rainfall patterns, soil properties, groundwater levels, and drainage efficiency. The ability of annual rainfall to leach salts originating from irrigation with brackish water has been investigated by [13,37], adopting columns filled with silt-loam soil in a Mediterranean climate. It was found that annual rainfall alone would not control salt build-up, and some additional leaching depths would be required. The efficacy of monsoon rainfall in salt leaching in a silt loam associated with sandy loam soil for different qualities of irrigation water was analyzed [38]. They concluded that water electrical conductivity higher than 4 dS m−1 caused salt accumulation, and washing with monsoon rains was not enough to control salinization in the irrigated fields. Investigating different soil textures, reference [39] highlighted the significant potential of sandy loam soil for salt leaching, particularly for a deep groundwater table. In fact, groundwater table levels play an important part in the salt distribution along the profile and could be controlled by subsurface drainage.
In this study, we explored the potential of treated wastewater irrigation and mulching on forage sorghum and on soil attributes. Our hypothesis was that the deficit irrigation, as well as leaching depths, associated with mulch can improve sorghum productive performance without affecting the sustainability in time of the agroecosystem irrigated with wastewater; deficit irrigation associated with soil cover in the production of sorghum in the semiarid region can increase the efficiency of water use and prevent soil salinization, and soil salinity in areas irrigated with wastewater can be minimized through management and by the natural rainfall events.
The present study aims to investigate sorghum productivity in an experimental area with subsurface drainage in the Brazilian semiarid region, assessing: (1) drip irrigation was adopted using wastewater from treated domestic effluents; (2) in these real-time experiments, the planting date was before the start of the hydrological year, and mulching was used as an agricultural management technique; and (3) soil salinity and carbon concentration analysis were also investigated throughout the cropping cycle.

2. Materials and Methods

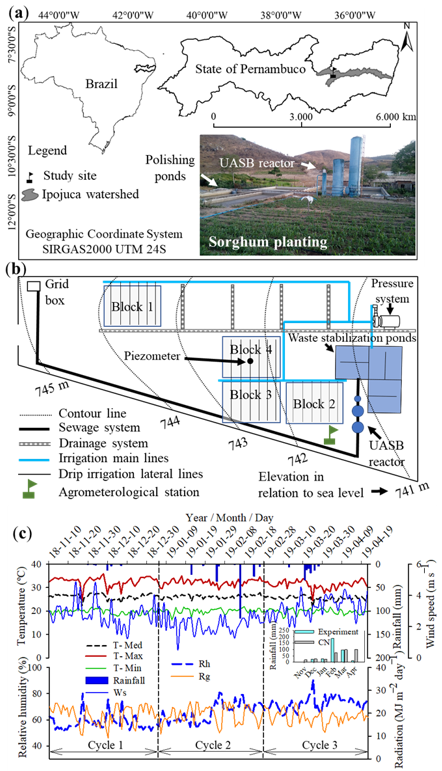
2.1. Experimental Site

The study was carried out in the experimental agricultural area of the effluent treatment station (ETS) in the Mutuca District, Pesqueira, Brazilian semiarid region, located near the Ipojuca River spring (Figure 1a). The climate is classified as As (with dry summer) according to the Köppen classification [40], with an average annual precipitation of 607 mm. In relation to the local climatological normal (CN) based on time series from 1981 to 2010 of the national meteorological organization of Brazil (INMET) (I, from November to April precipitation is 19.3, 20.2, 21.7, 75.8, 98.1, and 100.2 mm, respectively). The maximum (T—Max), average (T—Med), and minimum (T—Min) temperature showed high thermal fluctuation, strongly influenced by global radiation (Rg). The average temperature was 26.01 °C (Figure 1c).
The soil in the experimental area is classed as Hypereutric Albic Planosol, with a loamy sand texture of a wide representation of the Brazilian soil [41]. The physical and chemical characteristics of the soil (extract of the saturated paste) are shown in Table 1. Topography is very smooth, with slopes of less than 6%.
The wastewater from the district sewage collection network initially passes through a box with a grid to separate the coarse materials that are carried with the domestic effluent. After this stage, they are driven to the UASB reactors, treated and displaced in stabilization ponds, from where polished effluent is pumped for irrigation. In the area, there is a subsurface drainage system with a diameter of 65 mm and a space of 2 m between drainage lines, installed at an average depth of 0.65 m, with a slope higher than 1%. For drainage, high-density corrugated and perforated polyethylene pipes, with gravel around them and covered with a thin blanket and coarse sand, were used to enhance subsurface flow (Figure 1b). The Effluent treatment station (ETS) treats approximately 3 m3 day−1 of domestic effluent. The characteristics of the wastewater used for irrigation, after treatment at UASB reactors and polished, are shown in Table 2.

2.2. Agronomic Characteristics of the Sorghum Cultivar

The cultivar used was the IPA SUDAN 4202 (Sorghum sudanense (Piper) Stapf), also known as Sudan sorghum. It is of African origin and adapted to the semiarid mainly for its precocity, developed by the Agronomic Institute of Pernambuco State (IPA) with support from the Brazilian Agricultural Research Corporation (EMBRAPA). These are two important public companies responsible for the genetic improvement of crop varieties for Brazilian agriculture. The cultivar developed has high efficiency in water use since it has been adapted to the conditions of water stress and has considerable potential for forage production as hay and silage and for grazing. In addition, it has an average height of 230 cm and a high tillering and regrowth capacity. The harvest time ranges from 45 to 70 days after planting, and the plant is tolerant to salinity (up to 10 dS m−1) [42].

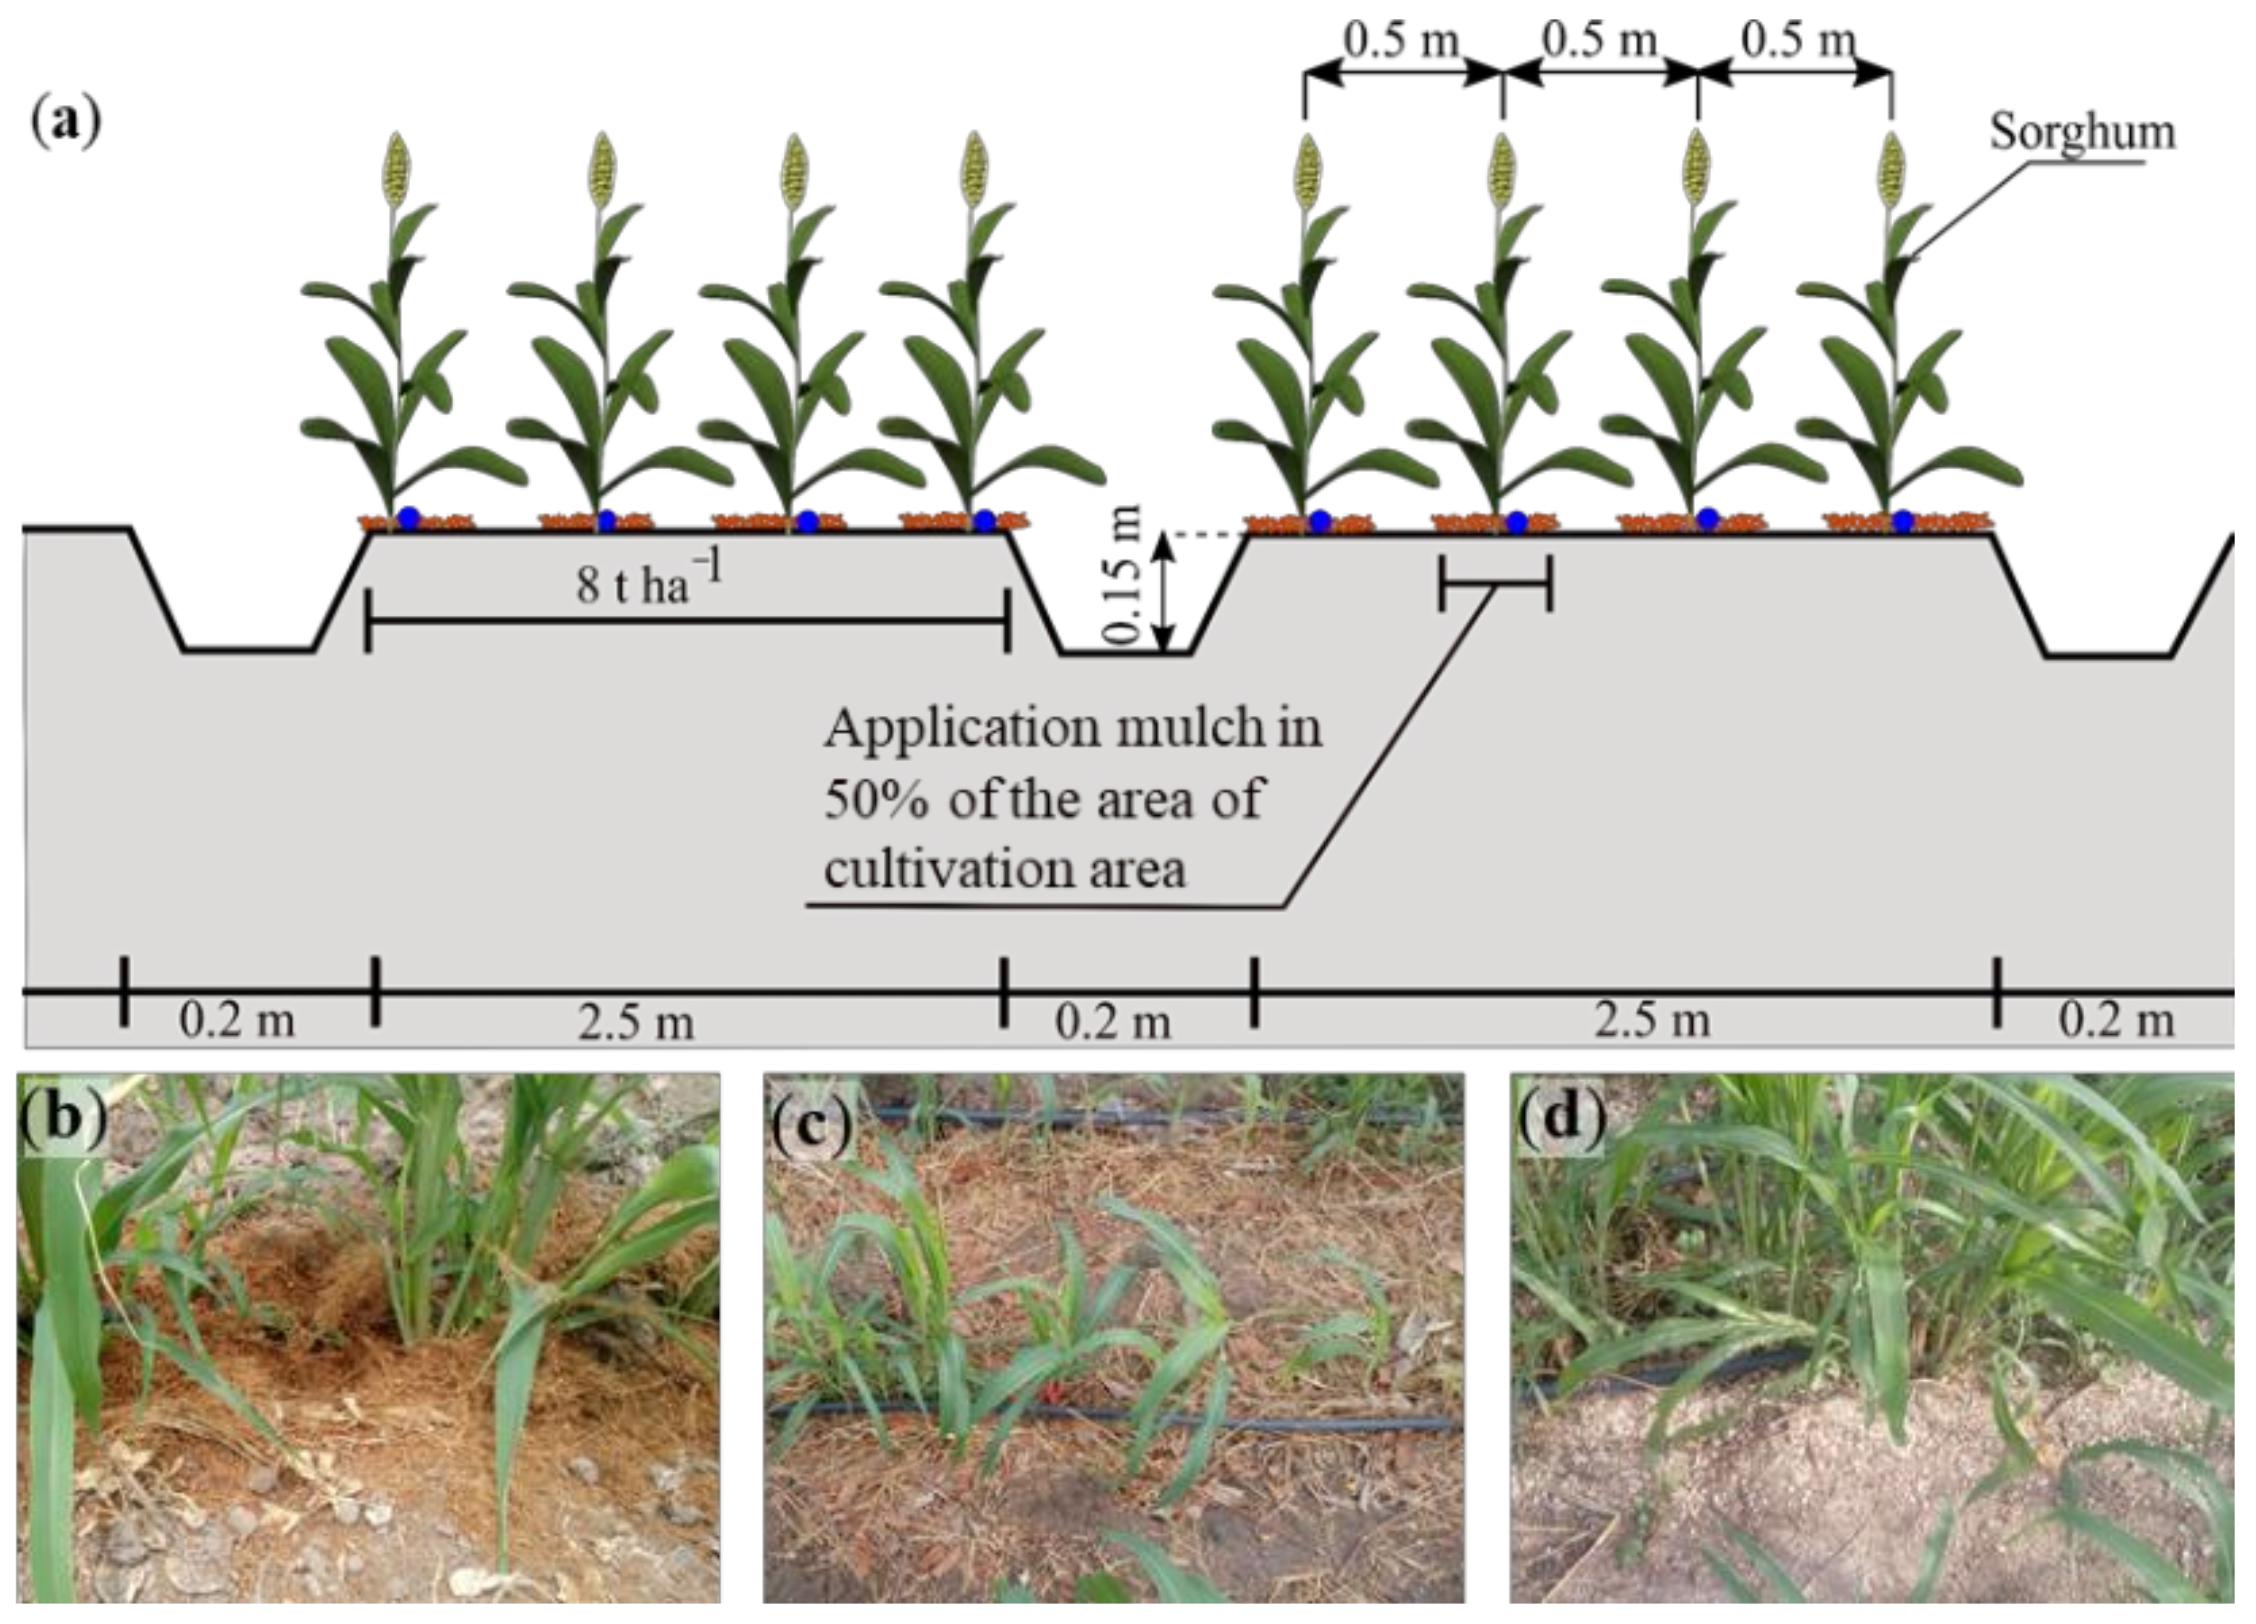
2.3. Treatments and Experimental Design

The adopted experimental design was in randomized blocks (RBD), with four replications, in a factorial scheme (5 × 4), with plots designed with 5 irrigation depths (ID) (60%, 80%, 100%, 120%, and 140% of the crop evapotranspiration—ETc), and the subplots with 4 soil cover conditions (0% (witness), soil covered with native vegetation, with coconut coir, and with macerated moringa seeds). Each subplot had a size of 5 m2 (2.5 × 2 m) of the total area and 2 m2 (2 × 1 m) of the experimental area. Each plot had 4 planting lines 0.5 m apart. The plants assessed were those in the central rows (experimental area). The adopted mulch density was equivalent to 8 Mg ha−1, according to [28].

2.4. Preparing the Area and Planting the Sorghum

Prior to planting, the experimental area was prepared by plowing, delimiting, and separating the plots with a 15 cm deep and 30 cm-wide furrow to prevent lateral flow between treatments (Figure 2). Mulch was applied after the sorghum germination.
The natural cover consisted of grasses (80%) (Carrapicho grass—Cenchrus echinatus L.; current grass—Urochloa mosambicensis Hack. Dandy) and legumes (20%) (Bredo—Amaranthus deflexus L.; Purslane—Portulaca oleracea L.) spontaneously growing in the study area. The plants were cut off and air-dried before application. Moringa seeds were crushed before being applied to the plots.
Coconut coir is an abundant product in the northeast region, resulting from the industrialization of coconut and is thus an alternative to reusing discarded coconut shells.
Moringa seeds, derived from a leguminous plant, have a high potential for cultivation in the semiarid region [43], with emphasis on their use in the environmental restoration of degraded areas [44].
Mulch was replaced at the beginning of each sorghum cycle.
Sorghum was planted in furrows 0.05 m deep, with the seeds arranged in a density of 12 plants per linear meter. Thinning was carried out in all plots to ensure uniformity of treatments.
Sowing occurred on 10 November 2018, with the cultivation lasting for 58 days, with harvesting on 6 January 2019, when the first cycle was completed. The second cycle started on 28 February 2019 (53 days after the first cycle). The third cycle started on 22 April 2019 (53 days after the second cycle).

2.5. Irrigation and Agricultural Management System

A low-cost drip system was used with 1.6 mm holes at intervals of 0.2 m. The water application efficiency was 90%, according to Christiansen’s Uniformity Coefficient (CUC) [45].
For the calculation of reference evapotranspiration (ETo) using the Penman–Monteith method [46], information from a complete automatic agrometeorological station (Onset Model—EAC-U30-900) located in the study area was used, providing temperature, relative air humidity, global solar radiation, atmospheric pressure, wind speed and direction, and rainfall records.
The cultivation coefficients (Kc) used to determine ETc (ETc = ETo × Kc) were based on the sorghum phenological phases: phase I—sowing until establishment (0.4); phase II—vegetative growth (1.1); phase III—flowering and production (1.00); and phase IV—maturation (0.7) [45]. Irrigation depths were estimated from the water budget between rainfall and crop evapotranspiration treatment and applied every 2 days, depending on rainfall events.

2.6. Biometric, Biomass, and Physiological Index Analyses

Plant height (measured from the stem base until the point of insertion of the highest leaf), basal stem diameter at 0.10 m in height, and total dry matter production [31,47] were evaluated.
For the dry biomass determination, three plants were collected in each plot, stored in paper bags, and transferred to a forced circulation oven at 65 °C for 72 h or until reaching constant weight [47].
The photosynthetically active radiation (PAR) determination and the leaf area index (LAI) were obtained from an Accupar LP-80 model Ceptometer, which allows a non-destructive estimation of LAI and produces reliable results. Measurements were carried out under the sorghum canopy, between 11 am and 2 pm, under a clear sky [48], at three locations within each plot.

2.7. Soil Salinity and Groundwater Assessment and Determination of Soil Total Organic Matter

For the soil electrical conductivity (EC), determined according to [47] the usual saturation-extract method for evaluating soil salinity at the experimental plots at the beginning and the end of each cycle. For the water table level and the EC monitoring, regular readings were carried out in a piezometer over the three cycles.
To assess the soil carbon and organic matter dynamics, the methodology proposed by [49] was adopted, which is based on the determination of K2Cr2O7- by titration with ammoniacal ferrous sulfate (0.4 mol L−1) for estimating concentrations of total organic carbon (TOC).

2.8. Statistical Analysis

Results were subjected to analysis of variance by the F Test for the irrigation depths and soil cover conditions.
Regression analysis was used to analyse the effects caused by the irrigation depths, with a linear or quadratic model being adopted. Models were selected after analysis of the equation parameters by the F Test, with significant effect for p < 0.05 (*) and p < 0.01 (**) of probability, and for the highest value of the coefficient of determination. For the effects on the variables studied as a function of the source of variation, “mulch”, data were analyzed considering the significance value given by the F Test at 5% probability. In addition, the treatments were analyzed using the Tukey test (considering the F test with a p-value < 0.05).
Spearman’s correlation coefficients among electrical conductivity, total organic carbon, and sorghum productivity were estimated over the 3 cycles. The principal component multivariate analysis (PCA) was used to identify the most relevant variables related to soil productivity and quality, including rainfall. All statistical, graphical, and correlation analyses were performed using the RStudio computational packages [50].

3. Results

3.1. Rainfall and Irrigation Depths during Sorghum Cultivation

The accumulated rainfall amounts over the experimental period were 23.0, 212.1, and 96.9 mm, distributed over 6, 9, and 7 rainy days, with a daily maximum of 12.5, 115.0, and 34.1 mm, during cycles 1, 2, and 3, respectively (Figure 3).
The daily ETo presented the greatest variation during the first cycle, a period in which the lowest water demand was recorded.
The total irrigation depths for 60%, 80%, 100%, 120%, and 140% of ETc were 104, 139, 174, 209, and 234 mm, 49, 65, 81, 97, and 113 mm, and 79, 105, 132, 158, and 184 mm, respectively. With the addition of rainfall, the total depths were 127, 162, 197, 232, and 257 mm, 261.1, 277.1, 293.1, 309.1, and 325.1 mm and 175.6, 201.6, 228.6, 254.6, and 280.6 mm, for cycles 1 (58 days), 2 (53 days), and 3 (53 days), respectively. The accumulated evapotranspiration (100% of ETc) was 194, 170, and 172 mm, for cycles 1, 2, and 3, respectively.
The total percentages of application of the irrigation depths in relation to ETc were 89.68%, 47.63%, and 76.48% of ETc for cycles 1, 2, and 3, respectively.

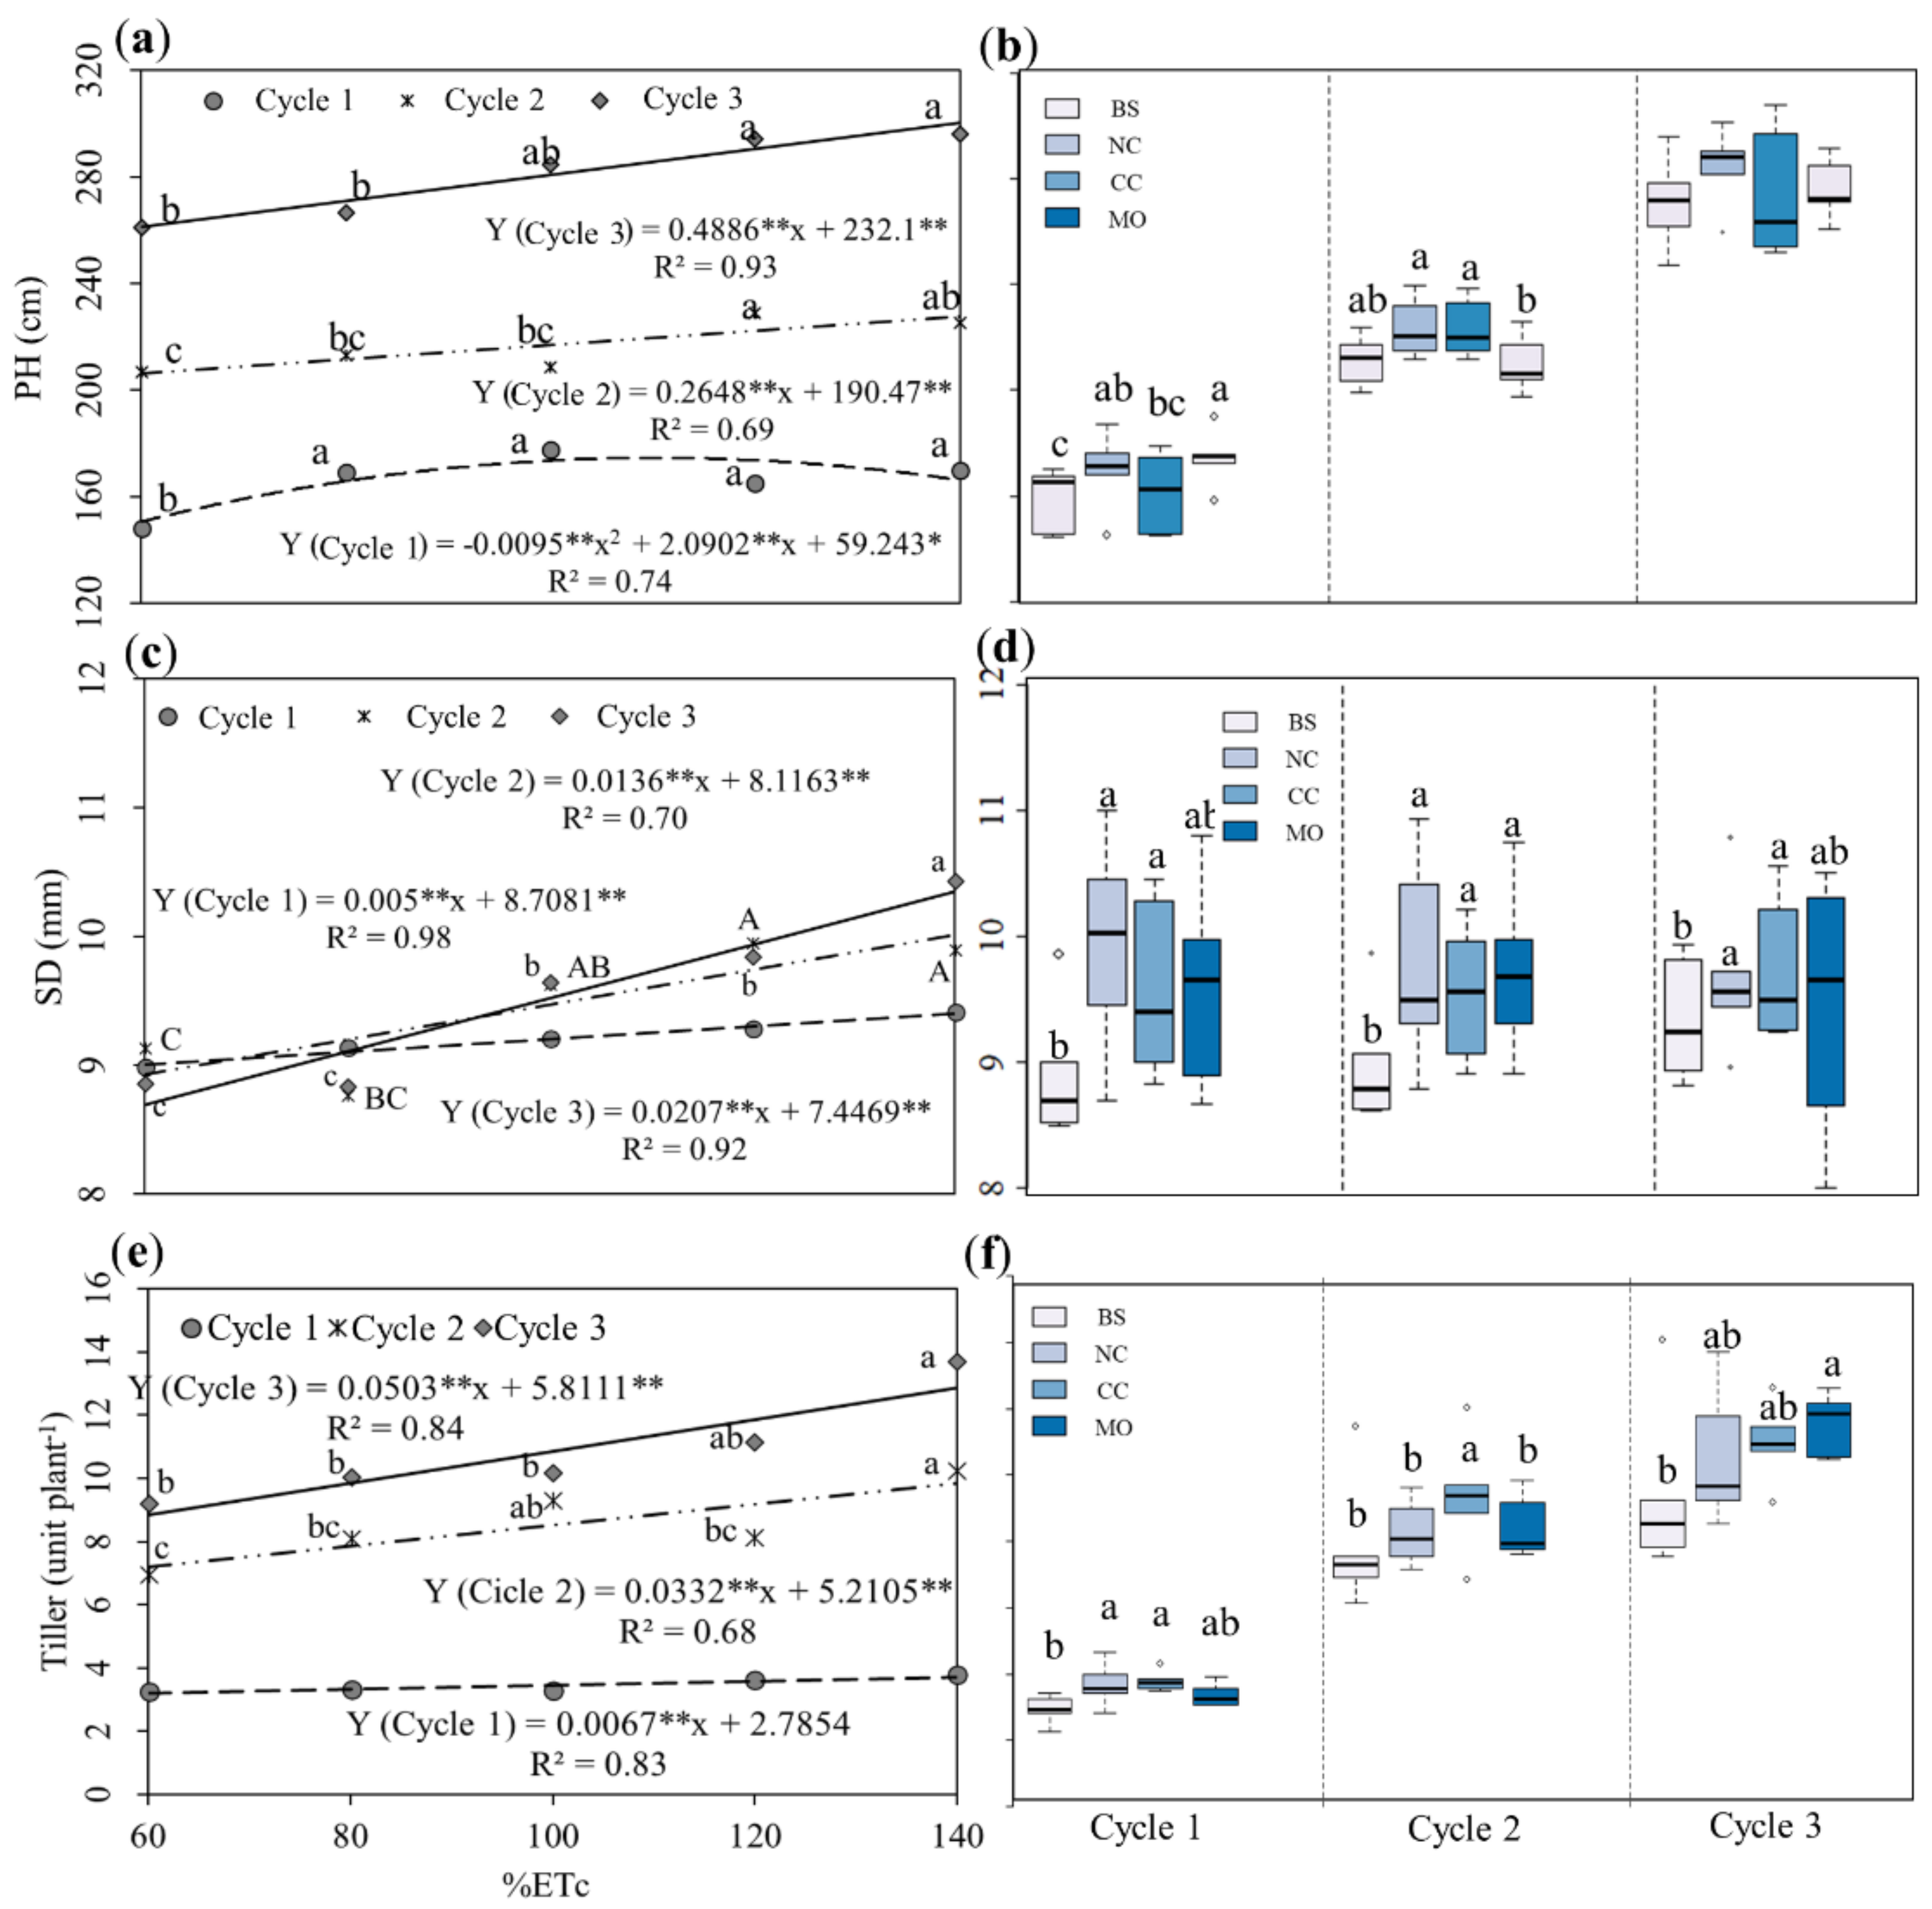
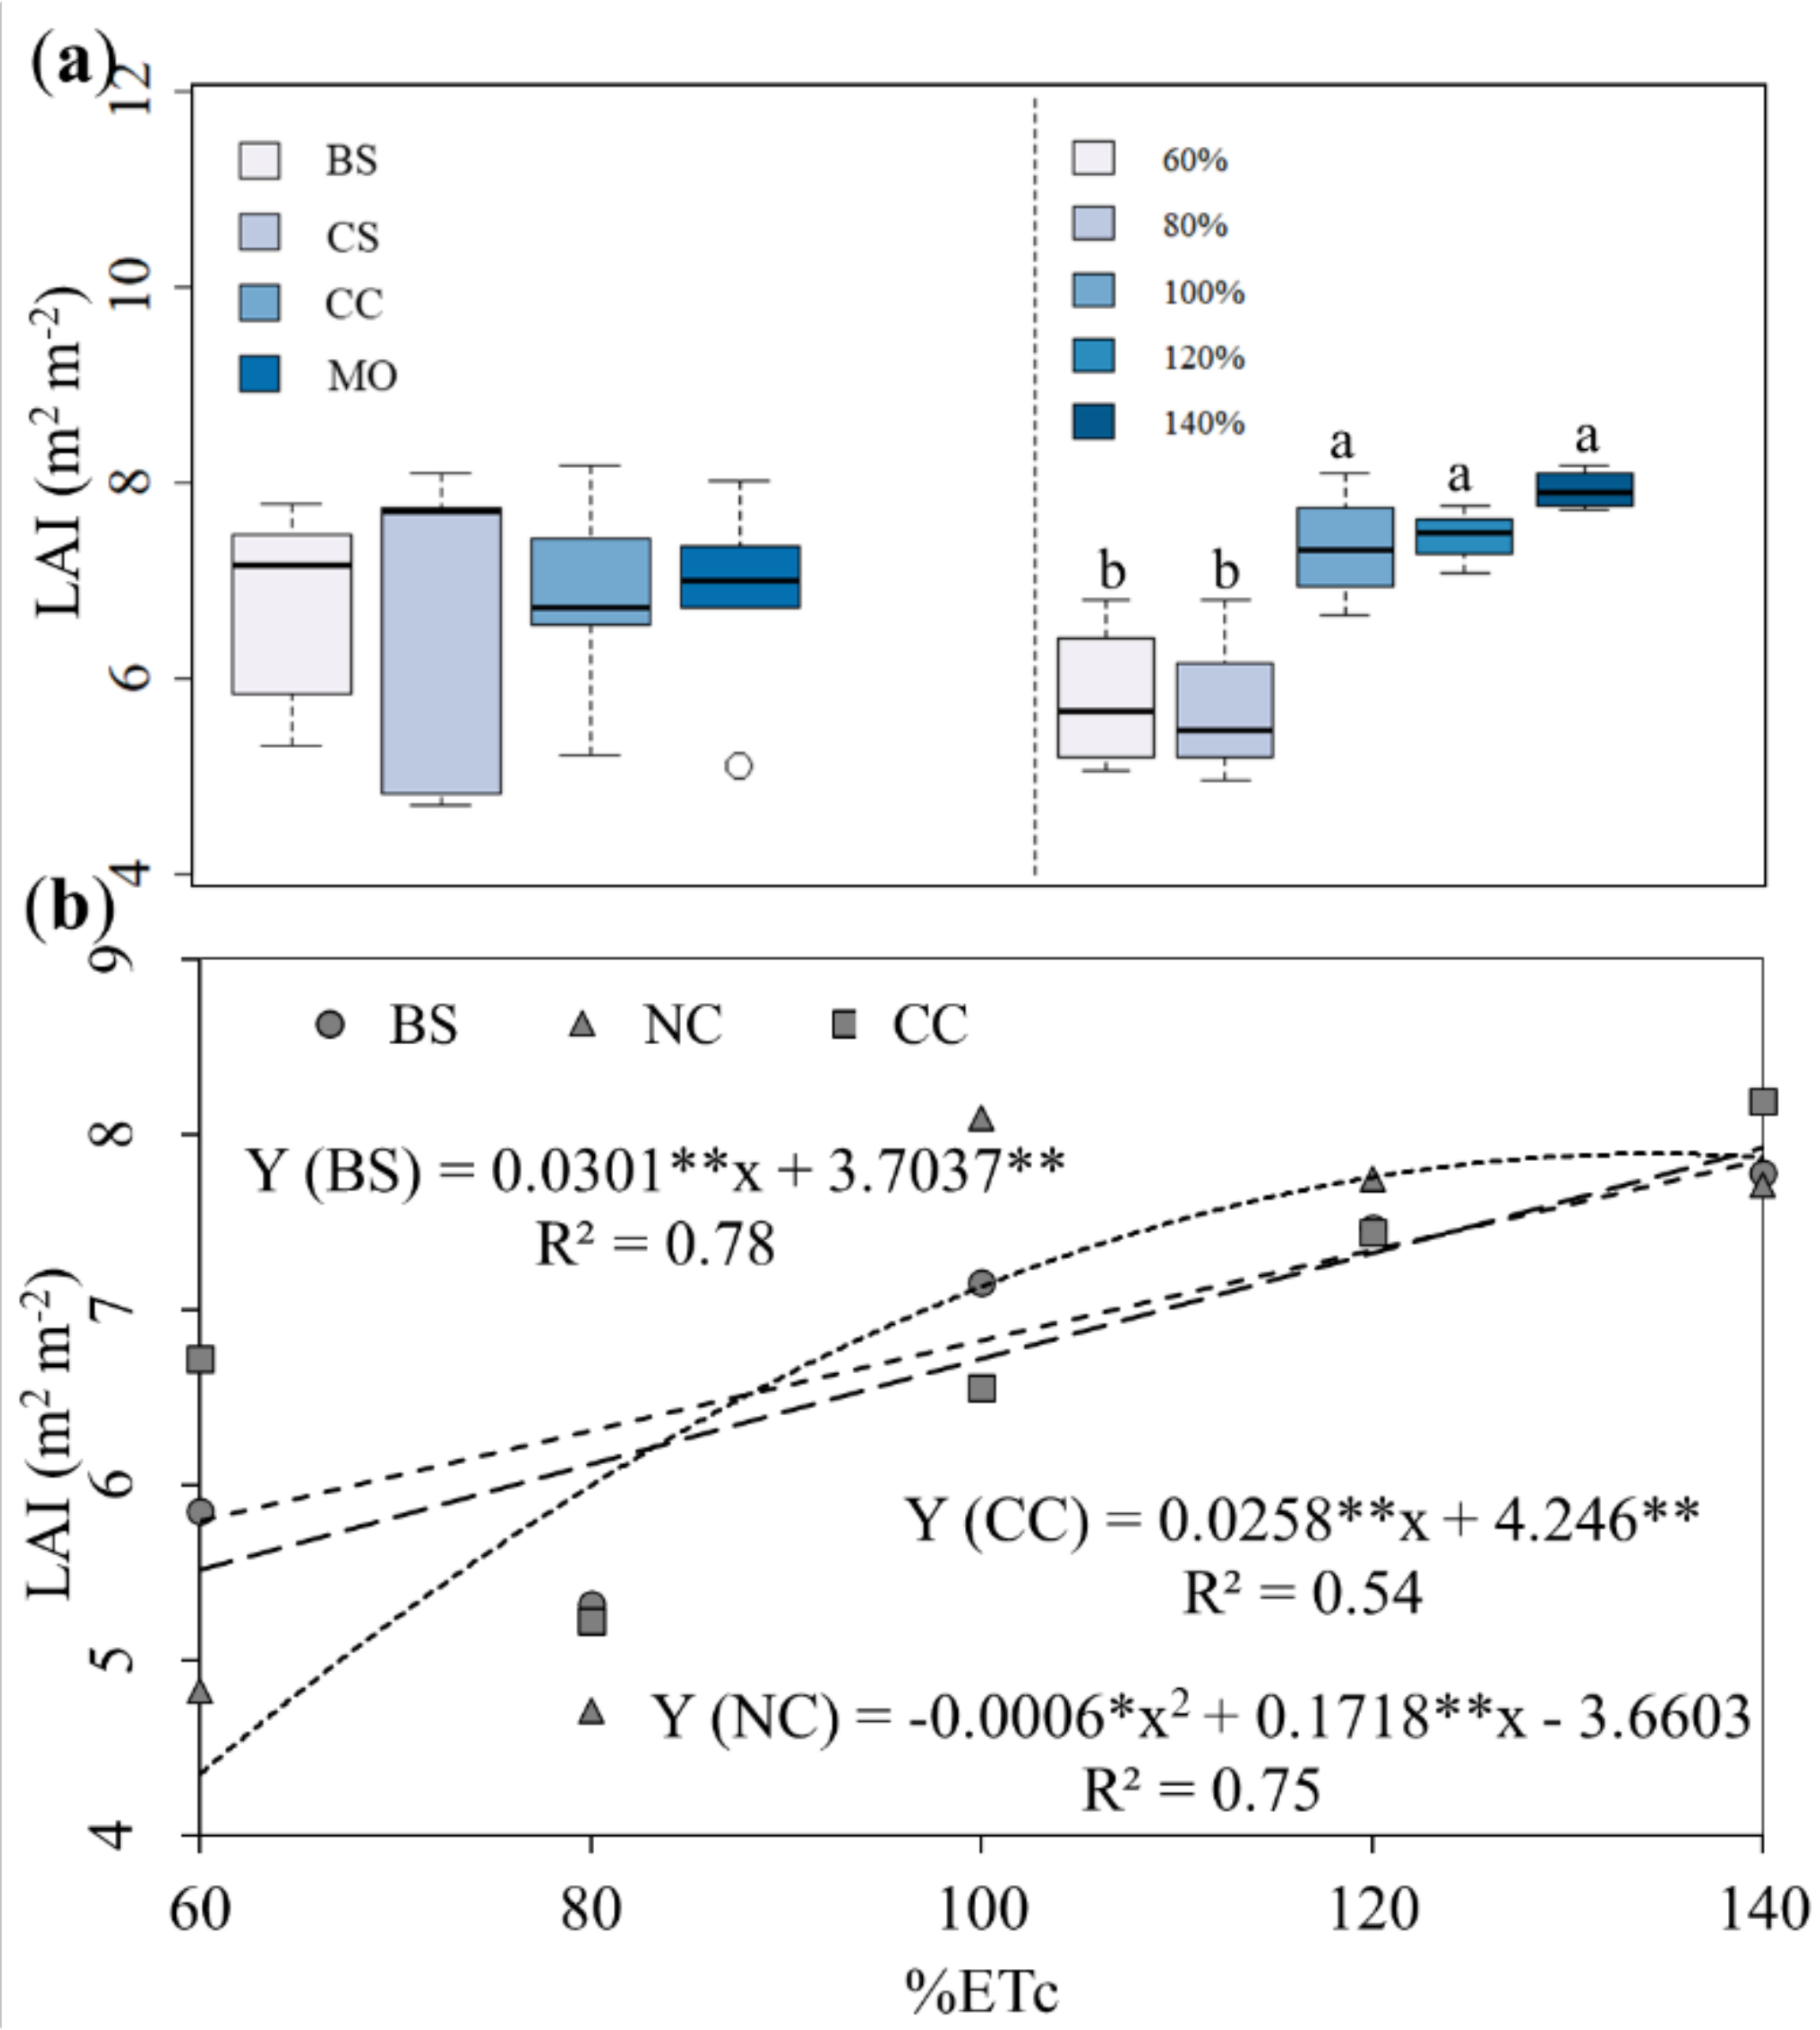
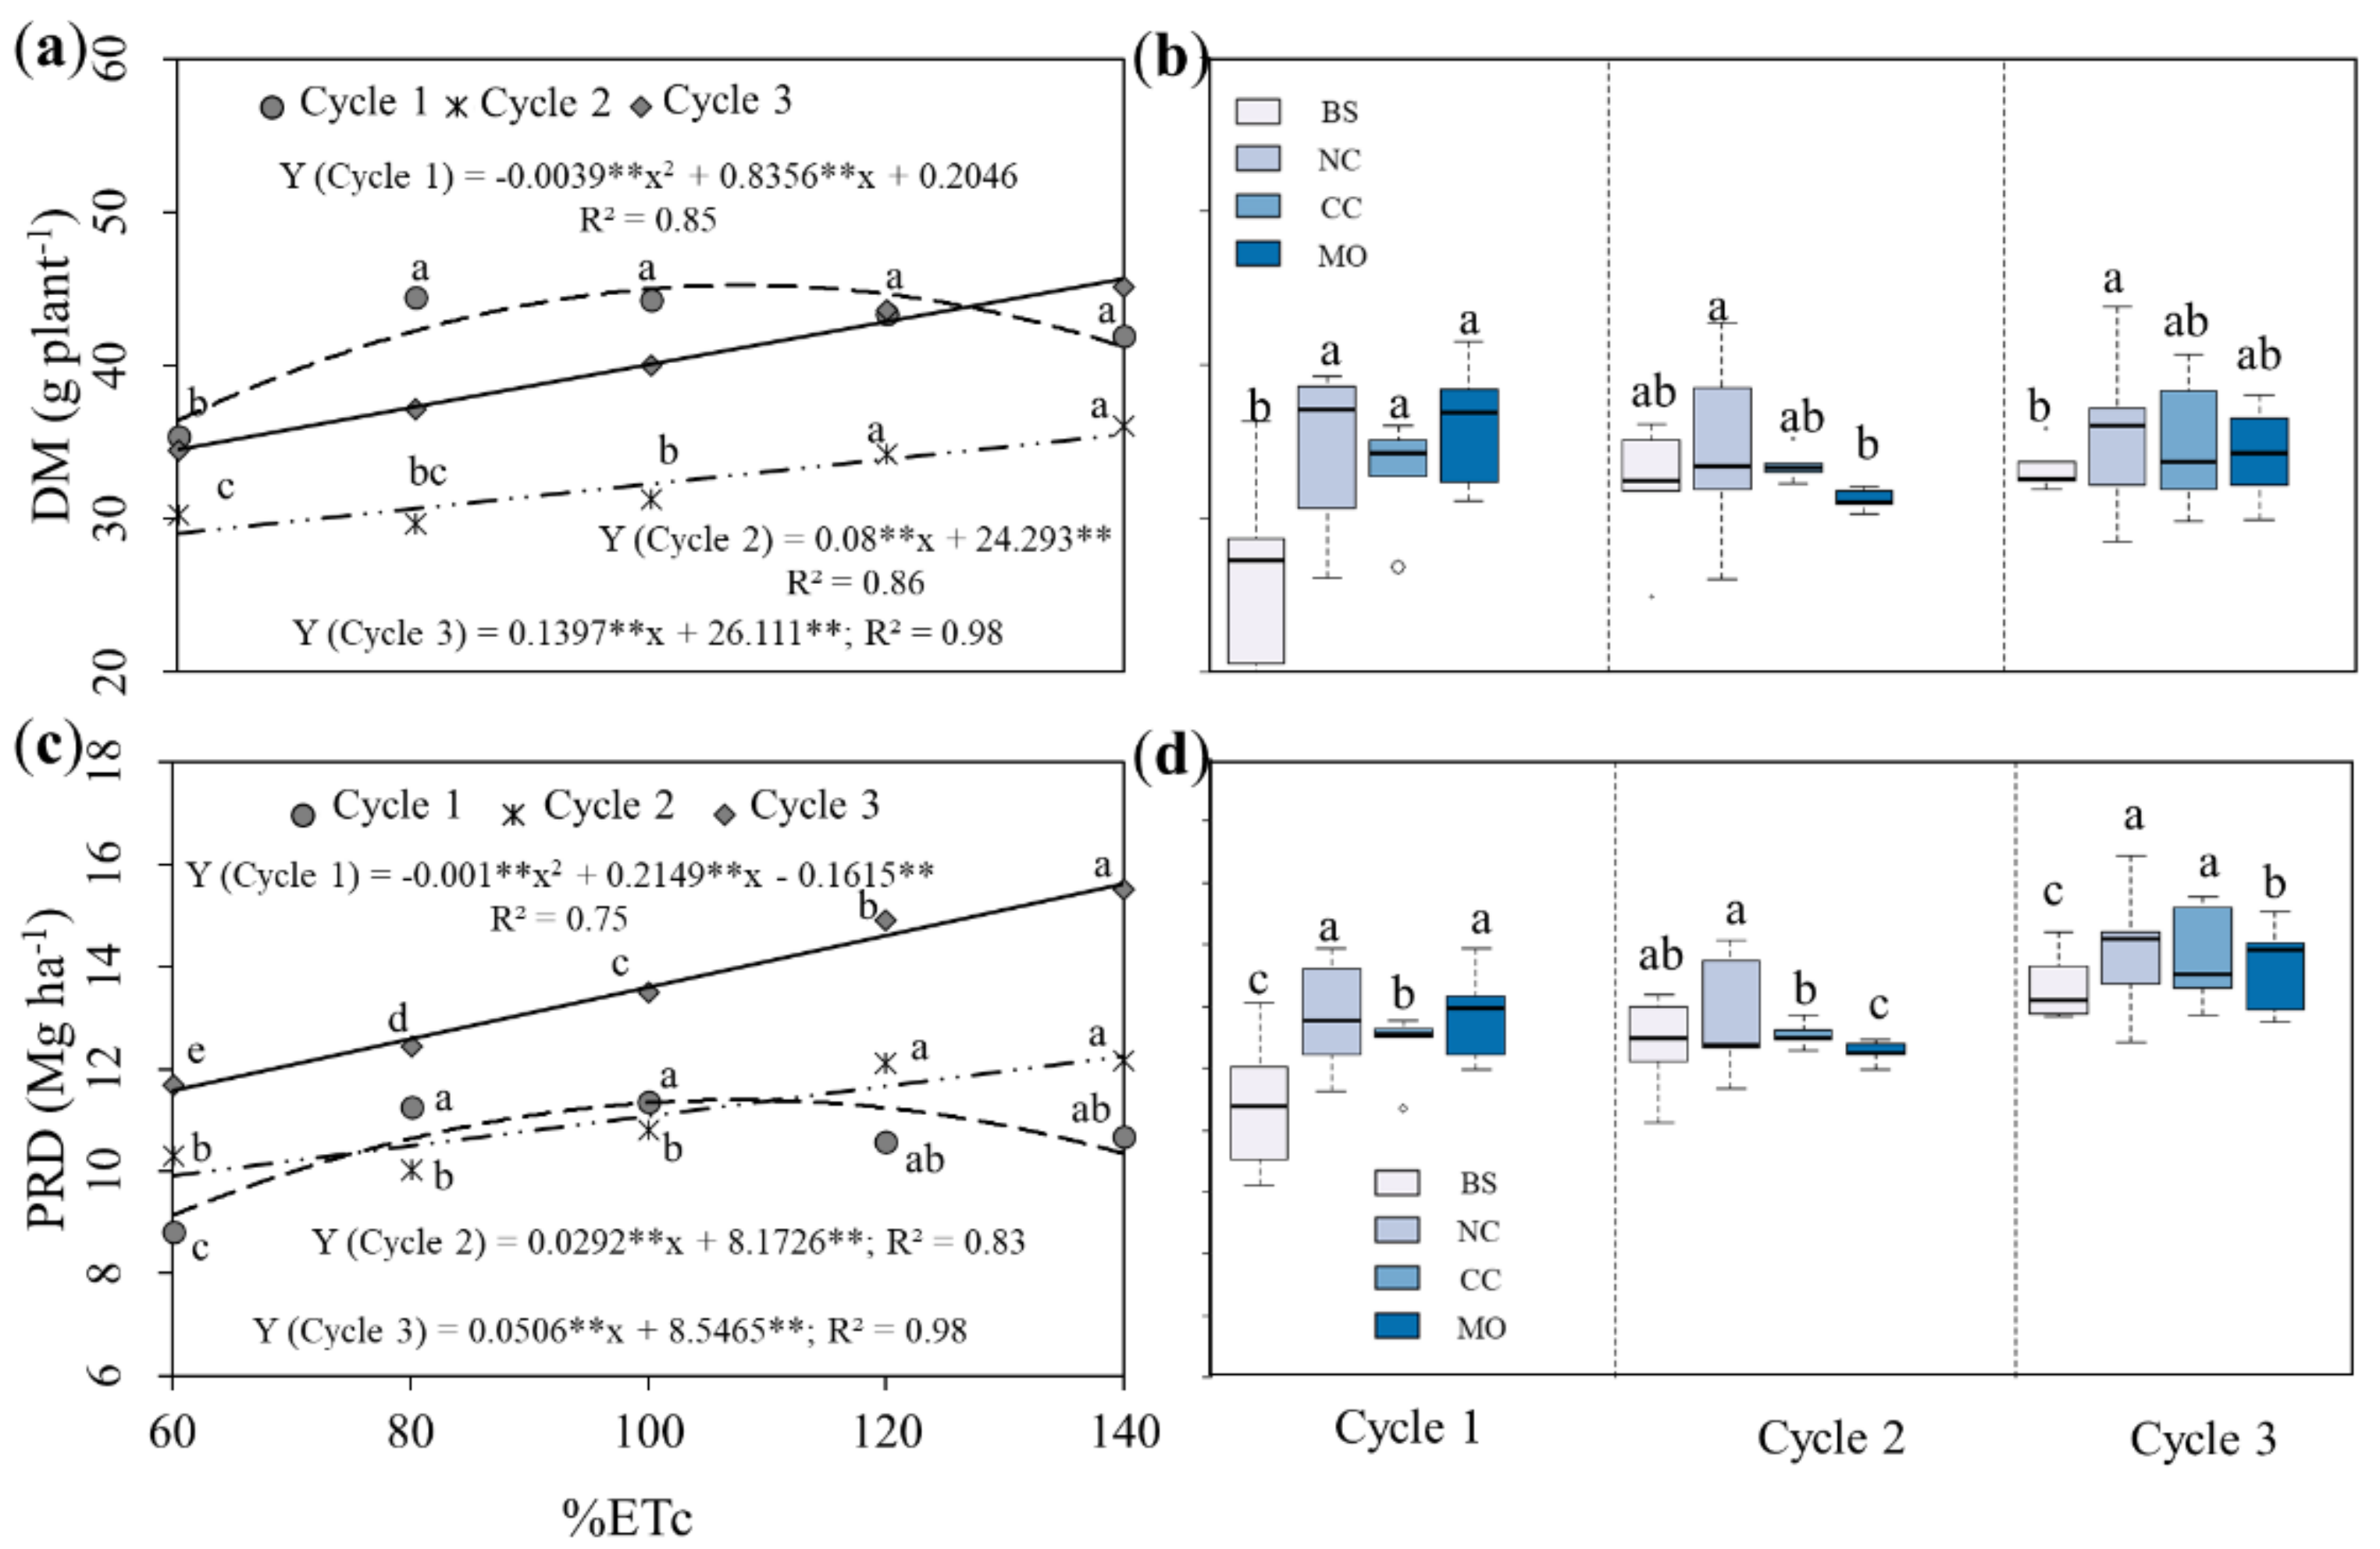
3.2. Growth and Sorghum Production under Different Water Regimes Using Wastewater

Based on the analysis of variance applied to the values of plant height (PH), stem diameter (SD), number of tillers (NT), leaf area index (LAI), dry mass (DM), and productivity (PRD), there was interaction ID × C (irrigation depth × cover condition) for all variables in cycle 1. No interaction (ID × C) was observed in PH in cycle 2 and PH, and NT in cycle 3, according to the significance of p < 0.01 and p < 0.05.
Significant effect of the isolated factor Irrigation depths (ID) was obtained for plant height (PH), stem diameter (SD), dry mass (DM), and productivity (PRD) in cycle 1, of plant height, stem diameter, number of tillers (NT), dry mass and productivity in cycle 2 and plant height, number of tillers, leaf area index (LAI), number of tillers, dry mass and productivity in cycle 3 (p < 0.01). Regarding cover condition (C), there was a significant isolated effect for plant height, number of tillers, dry mass, and productivity for cycles 1 and 2, while for cycle 3, it occurred for plant height, number of tillers, dry mass, and productivity (p < 0.01).
The maximum plant height estimated for cycle 1 was 175.2 cm for an ETc, corresponding to 110% of the ETc. For cycles 2 and 3, the maximum plant height estimated was for the depths corresponding to 140% of the ETc, showing values of 227.5 and 300 cm, corresponding to increases of 8.2% and 11.8% in relation to the 60% ETc, respectively.
Box plots in Figure 4 showed few outliers among the mulching types in all cycles. It is also possible to verify that the stem diameter was the cover condition that presented the distributed values closest to the median.
Based on the comparison of averages among soil cover conditions in plant height, a significant difference was found among treatments in cycle 1, with natural cover (NC) (169.6 cm) and moringa (MO) (174.2 cm) statistically equal and significantly higher than bare soil (BS) (158.7 cm). In Section 2, for NC and coconut coir (CC) treatments, mean values of 224 and 223.87 cm for plant height (PH) were confirmed, respectively, being higher than for MO (209.4 cm) (Figure 4b).
The stem diameter (SD) stood out in the third cycle for the irrigation depths (ID) of 140% of the ETc, showing an estimated diameter of 10.3 mm, being significantly higher than the others. In addition, for the ID of 140% of the ETc, the SD was the highest (uppercase letters) (p < 0.05) (Figure 4c). The irrigation depths did not influence the SD in cycle 1. The treatments NC and CC showed higher values for SD during the cycle of the sorghum, mainly in relation to BS (Figure 4d).
The number of tillers (NT) did not differ significantly among the irrigation depths (ID) treatments in cycle 1. For cycle 2, the NT for ID of 100% and 140% of ETc were higher than the others (p < 0.05), and in cycle 3, NT for ID of 120% and 140% (Figure 4e) were higher. The increasing linear regression model provided for the irrigated plants in Section 2 and Section 3 increases by 32.3% (9.4 units of NT) and by 32.7% (10.3 units of NT), estimated for the ETc of 140% compared to 60%, respectively.
Irrigation depths (ID) of 100%, 120%, and 140% of ETc resulted in LAI values of 7.29, 7.42, and 7.93 m2 m−2, respectively, being higher (p < 0.05) than those of ID of 60% and 80% of ETc (Figure 5a).
The ID variations resulted in a significant effect on leaf area index (LAI) for the bare soil (BS), natural cover (NC), and coconut coir (CC) treatments, with a maximum estimated LAI of 7.9 m2 m−2, according to the quadratic model for NC, applying an irrigation depth of 134.2% of the ETc. Regarding BS and CC conditions, they produced LAI of 7.8 m2 m−2, according to the linear model for a 140% ETc (Figure 5b).
Table 3 shows a statistical difference (p < 0.05) for all soil cover conditions (bare soil (BS), natural cover (NC), coconut coir (CC), and moringa (MO)) depending on the irrigation depths of 60%, 80%, and 100% of the ETc. Results indicate that mulch application promotes a relevant increase in LAI.
For the ID of 60% of ETc, CC stood out in relation to NC and MO, whereas for irrigation depth of 80% of ETc, LAI values for MO treatment were higher than those for NC and CC. When irrigation depth corresponding to 100% of ETc is considered, NC treatment produced higher LAI values than CC. A positive correlation could be observed between LAI and ID up to 140% of ETc for BS, CC, and MO treatments. Moreover, the IDs of 60% and 80% of ETc were the ones that promoted the lowest LAI for all soil cover conditions.
An increase in ID produced a quadratic effect on the DM production in Section 1, with a maximum value of 45 g plant−1, for an ETc of 107.1% (Figure 6a).
Cycles 2 and 3 showed a linear behavior between irrigation depth (ID) and dry mass DM. The ID of 140% of the ETc resulted in the highest yield for both cycles, with DM estimated values of 35.5 and 45.7 g plant−1, respectively.
The NC and CC mulch types stood out for DM productivity in relation to the MO and BS treatments (Figure 6b).

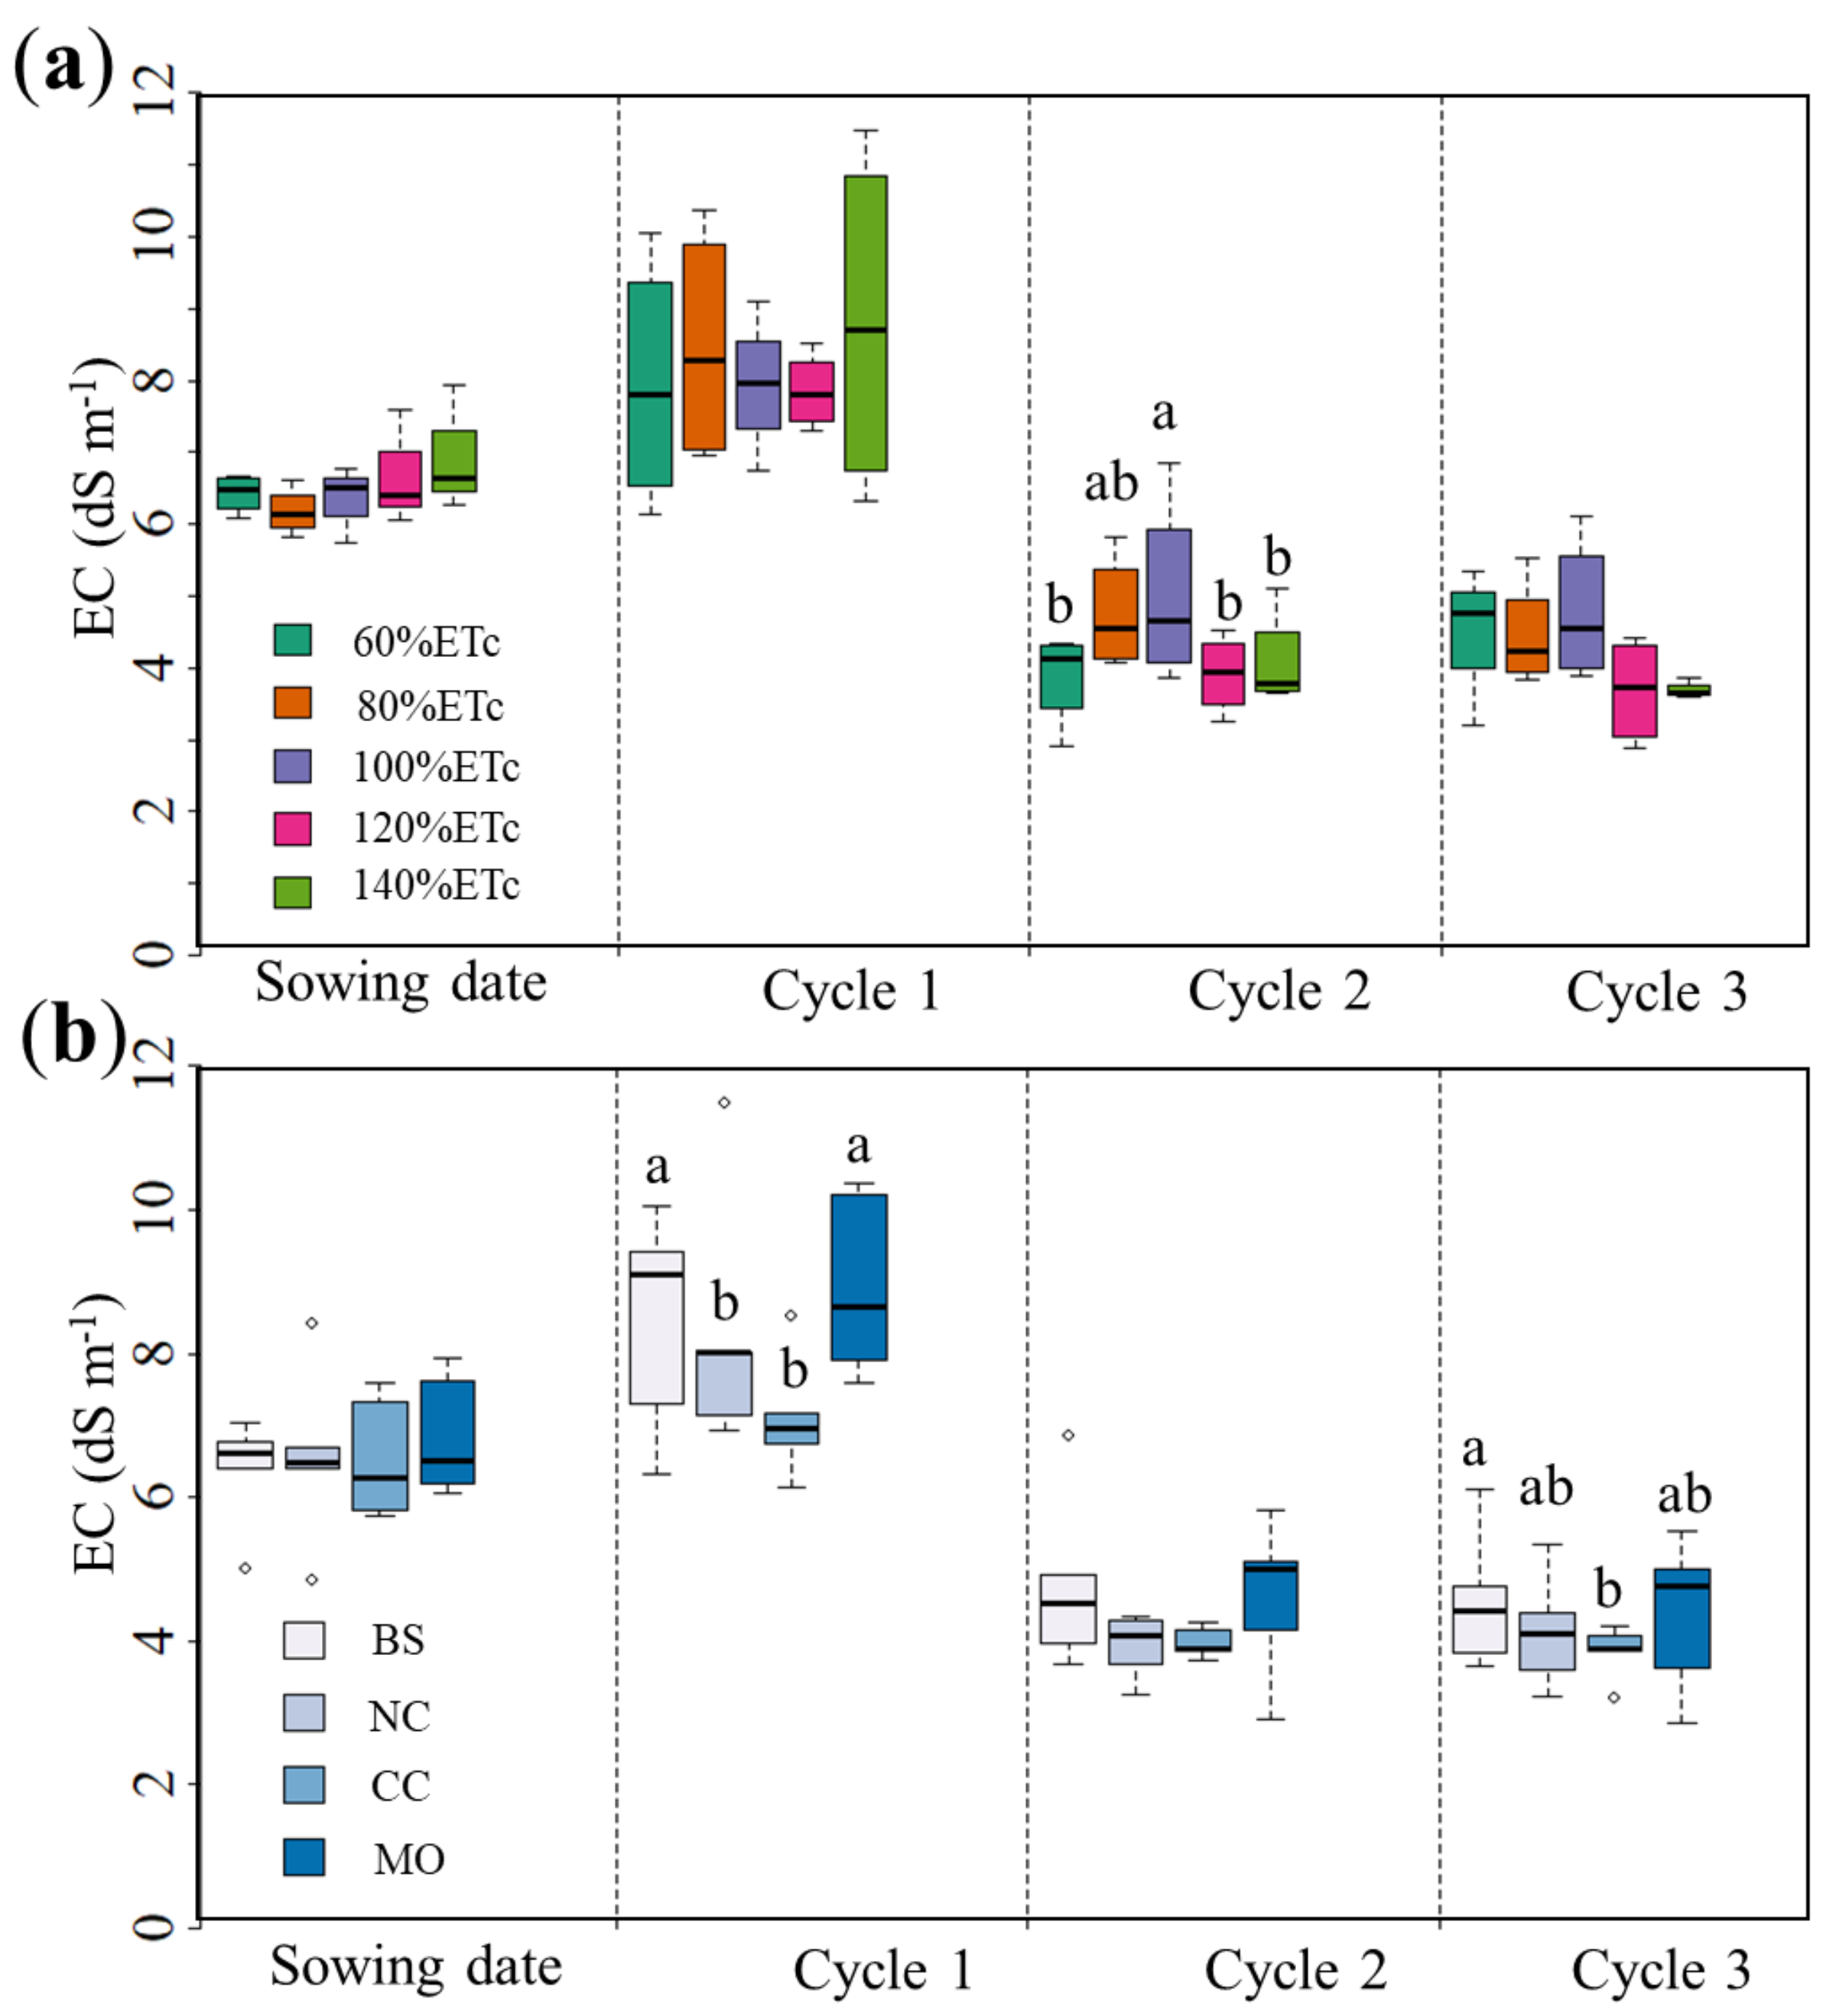
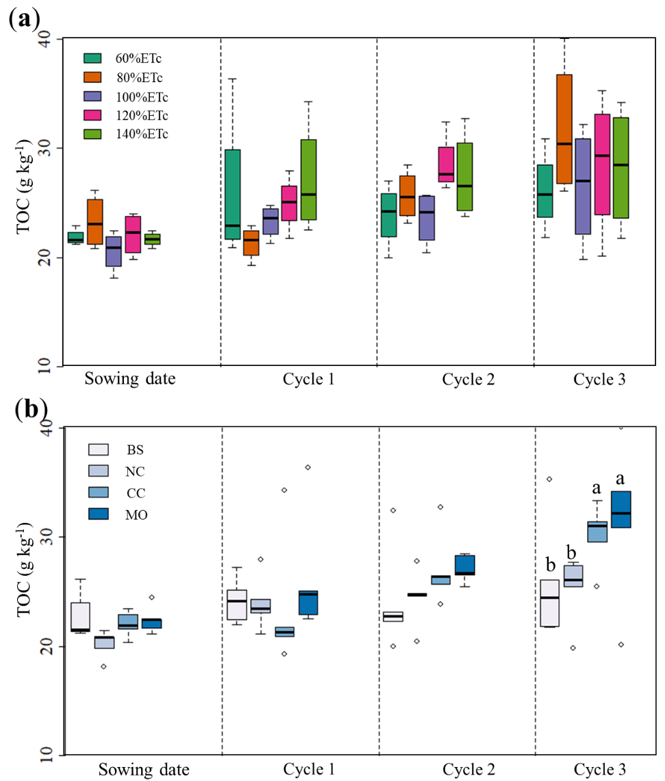
3.3. Effects of Wastewater Irrigation Depths and Mulch on the Soil Electrical Conductivity and Organic Matter

There was a significant isolated effect of EC (for the 0–20 cm layer) on soil cover conditions for cycles 1 and 3 and for total organic carbon (for the 0–20 cm layer) (TOC) in cycle 3. In relation to interactions between irrigation depths and cover, there was a significant effect on cycles 1, 2, and 3 in EC, with a significance level of p < 0.01 and p < 0.05.
Soil electrical conductivity (EC) at the beginning of the cultivation period, in relation to irrigation depths (60%, 80%, 100%, 120%, and 140% of ETc), presented low variation, as well as proximity between the medians, with magnitudes between 6 and 7 dS m−1. At the end of cycle 2, increments for soil EC occurred, with averages ranging from 8 to 9 dS m−1 (Figure 7a).
Areas with the BS and MO land-use systems showed higher mean values for EC in Section 1, being statistically different from both NC and CC (p < 0.05) (Figure 7b). Low variations among mean values were observed in Section 2, and there was no significant difference between treatments. However, for cycles 1 and 3, the treatment with coconut coir (CC) showed low values of EC, being statistically lower than BS, NC, and MO.
Mean values for EC at the beginning of the cropping period (initial conditions) were similar (Table 4).
The IDs of 60%, 80%, and 100% of the ETc in the BS treatment, in Section 1, resulted in higher mean EC values of 10.38, 9.7, and 9.33 dS m−1, respectively. For the MO cover treatment, the lowest EC was found for the 120% ETc depth. Still regarding cycle 1, the CC treatment was the one that had the lowest EC mean values, equal to 6.14, 7.02, and 7.26 dS m−1, for depths of 60%, 80%, and 140% of ETc, respectively.
In cycle 2, with EC values well below cycle 1, a higher EC value was found for the 100% of ETc treatment (6.93 dS m−1) in BS, being statistically higher than the others. The lowest EC (2.67 dS m−1) was found for the 60% ETc ID for MO. In relation to cycle 3, there was a remarkable EC reduction for the CC treatment for depths of 60%, 80%, and 100% of ETc, with averages of 2.99, 3.92, and 3.73 dS m−1.

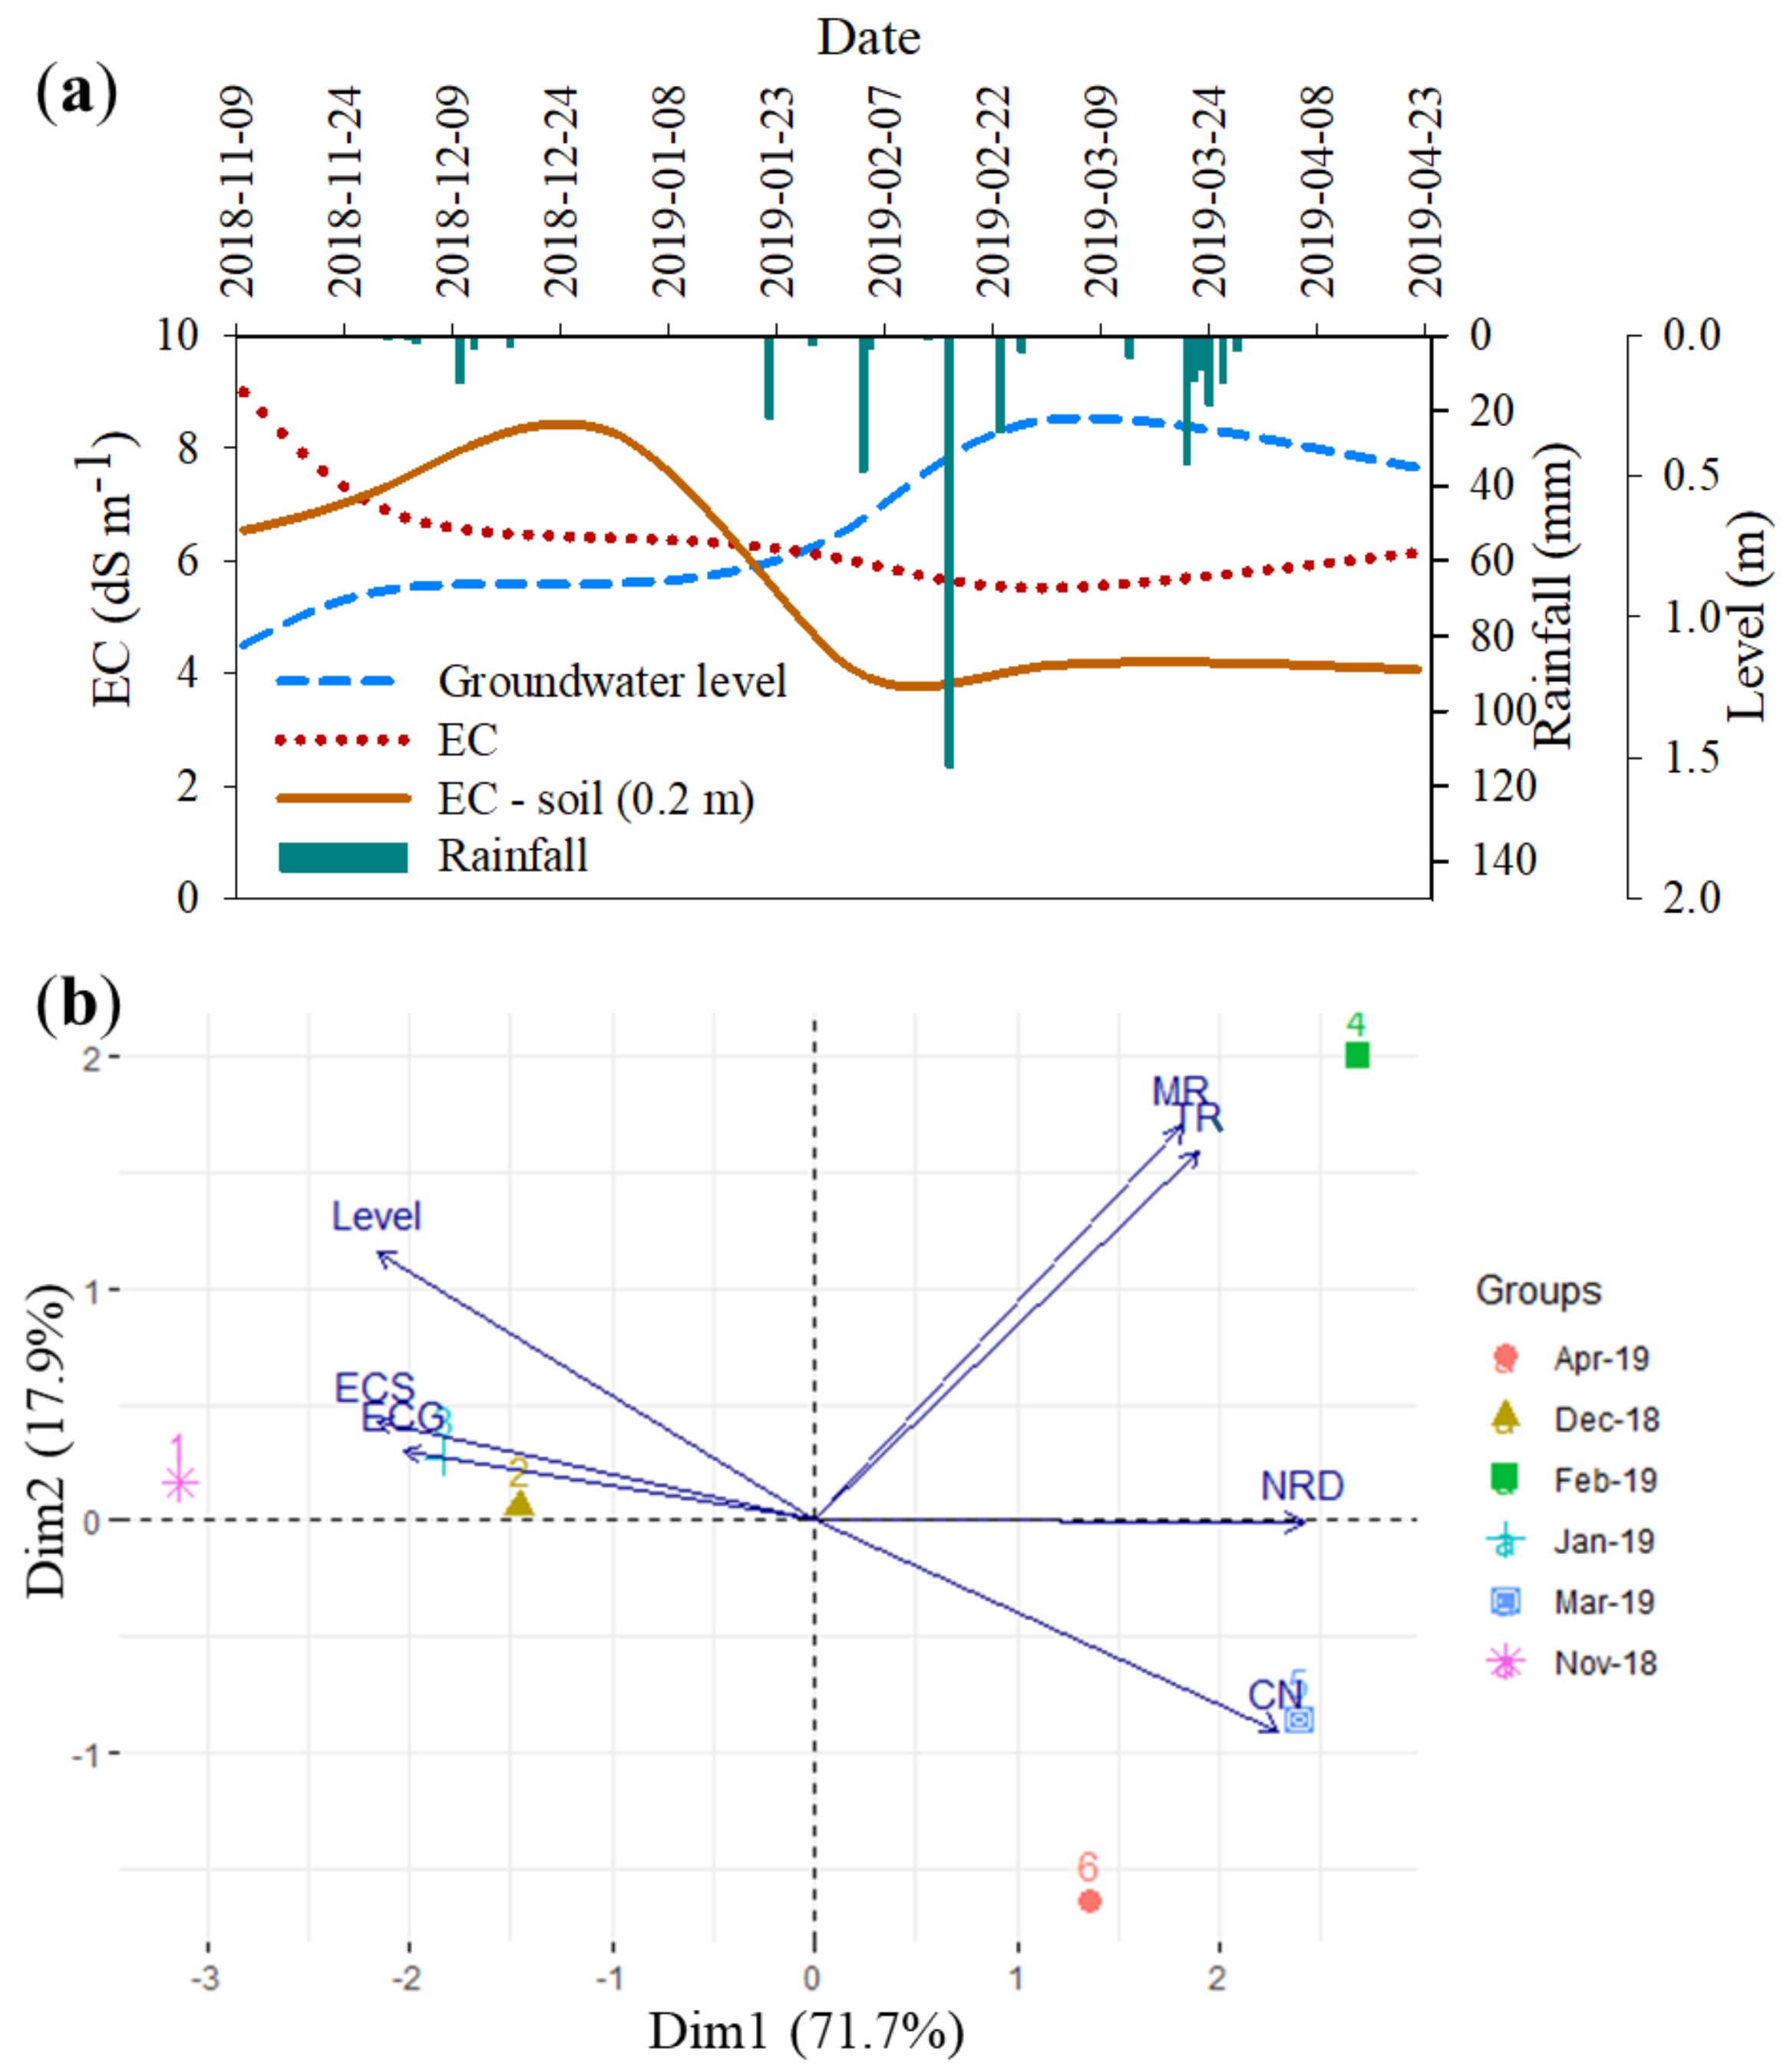
3.4. Water Table Levels and Salinity Dynamics at the Experimental Area

Water table EC showed values of 9.00, 6.83, 6.40, 6.03, 5.51, and 6.14 dS m−1, while soil EC values of 6.5, 7.4, 8, 2, 4.2, 4.1, and 4 dS m−1 have been observed monthly, from November 2018 to April 2019. In the same period, mean monthly values for water table depths were 1.1, 0.90, 0.88, 0.70, 0.30, and 0.67 m (Figure 8a).
Figure 8b shows the biplot of the principal component analysis (PCA) for the soil and groundwater electrical conductivity and water level, and their relationships with the maximum daily precipitation per month (mm day−1), the total rainfall (mm), and the normal climatological-CN (mm) value monthly, from November 2018 until April 2019, from the planting date to the experimental period end (cycle 3).
Main components Dim1 and Dim2 explained 89.6% of the total variance, with emphasis on Dim1, which by itself explained 71.7% of the total data variance. For this component, the variables related to precipitation (CN, NRD, MR, and TR during the experiment) were positively grouped and inversely influencing soil and groundwater salinities (ECS and ECG), as well as the water table level dynamics.

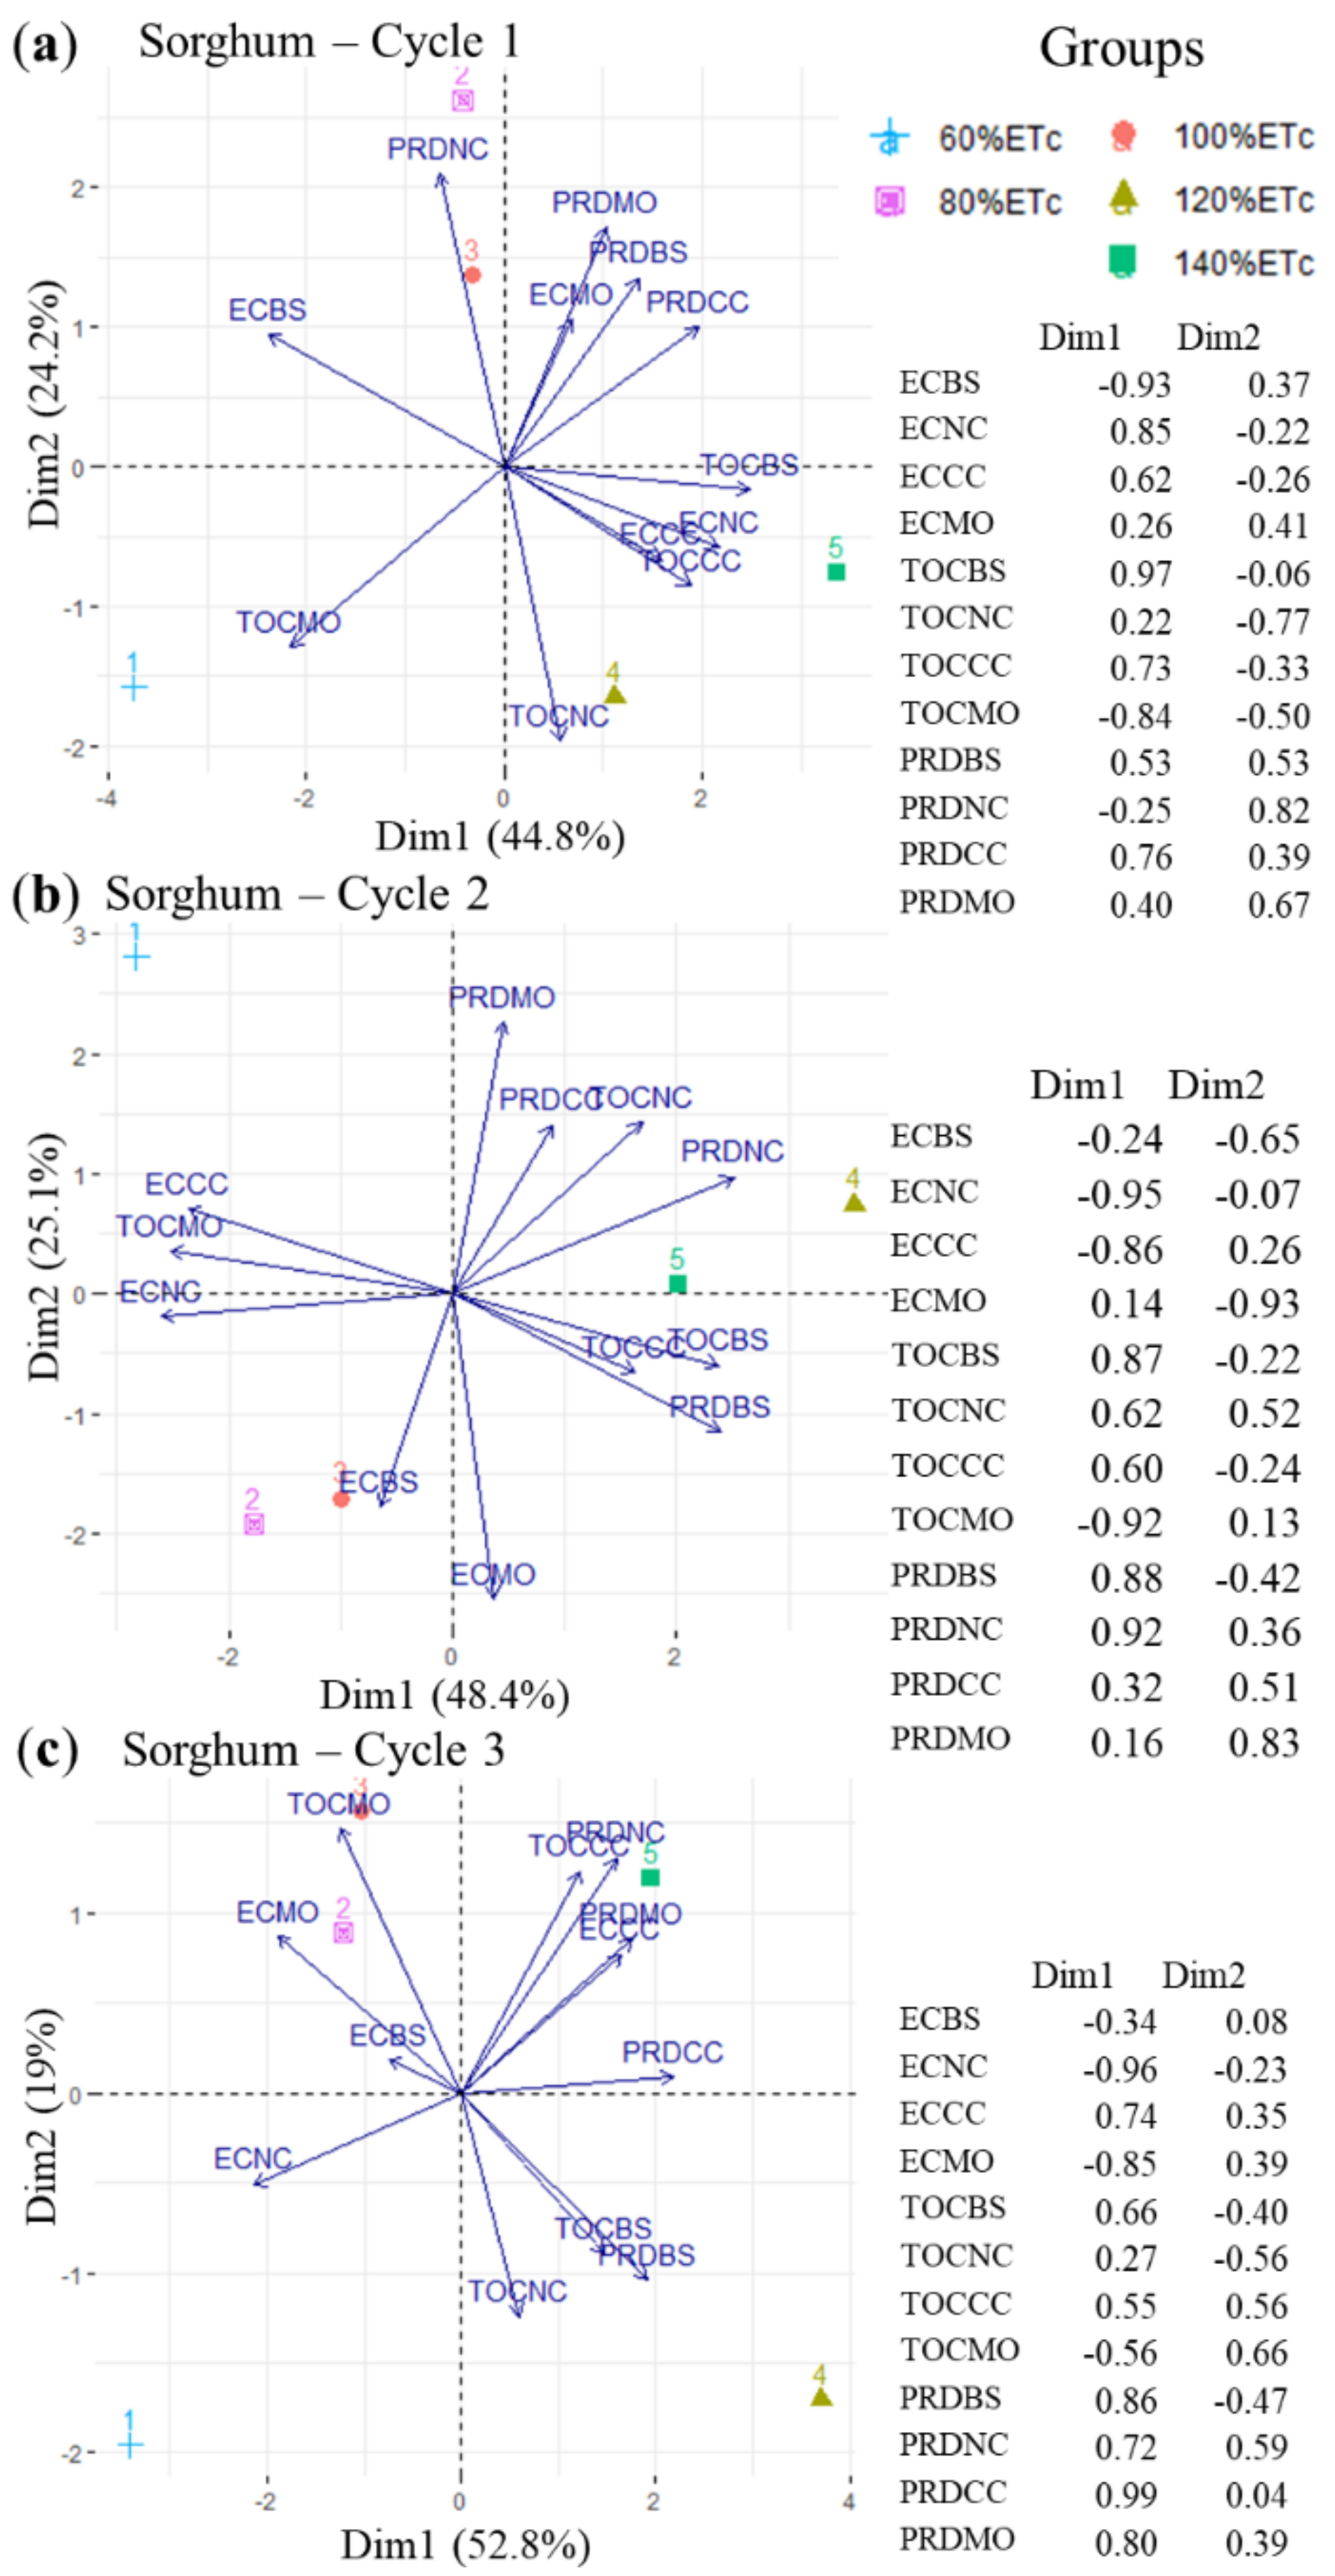
3.5. Soil Electrical Conductivity (EC) and Total Organic Carbon (TOC) Effects on Sorghum Productivity

Figure 9 shows box plots for the carbon and organic matter concentrations at the beginning of the experiment and at the end of the third cycle, according to the irrigation depths and the soil mulching conditions.
Initial conditions for TOC for all irrigation depths and soil cover conditions were similar (Figure 9a,b). A progressive increase in TOC can be observed during the course of the experiment, with significant differences between soil cover conditions. For TOC at the end of the experiment (cycle 3), there was a significant difference between the mean values (p < 0.05), with the highest values being observed for the treatments with coconut coir (CC) and moringa (MO), exhibiting increments of 15.1% and 18.9%, respectively, compared to the area without mulch application.
To assess the dynamics among EC, TOC, and productivity during sorghum cycles, Spearman’s correlation coefficients were calculated (Table 5).
It was found that EC exhibited a moderately negative correlation in relation to the soil condition without mulch, for cycle 1 (ECBS), influencing (0.6) the reduction in TOCBS. For such treatment, in Section 2 and Section 3, no correlation was detected (Table 5).
Experimental data relationships within the productivity group (PRD) related to soil salinity (EC) and total organic carbon (TOC) for bare soil (BS), natural cover (NC), coconut coir (CC), and moringa (MO) conditions were subjected to principal component analysis (PCA) (Figure 10).
In relation to cycle 2, there is a high association between productivity and mulching type, PRDNC, PRDBS, and PRDCC, according to the first component (Dim1), which was close to their respective values of total organic carbon TOC for 120% ETc and 140% ETc treatments (Figure 10b). For this component, the variables ECNC (95%), ECCC (86%), and TOCNC (92%) showed a high negative association in the group (Dim1) for the 60% ETc irrigation depth. Hence, it can be confirmed that the 60% of ETc irrigation depths negatively affected the sorghum crop productivity.
For cycle 3 (Figure 10c), Dim1 (52.8%) and Dim2 (19%) represented 71.8% of the total data variance. For Dim1 alone, ECNC (96%) negatively influenced 60% ETc, ECMO (85), and on the other hand, it had a strong negative influence on the total soil organic carbon, grouping the 80% ETc and 100% ETc layers.

4. Discussion

4.1. Rainfall and Irrigation Depths during Sorghum Cultivation

Heavy rainfall events can occur in the region, as already reported by [51], with a total of 120 mm in a single day, in February 2015. According to [3], there is a trend of climatic changes for the rainfall pattern for the Brazilian Northeast, with an increase in the number of extreme events being expected, as well as a reduction in the number of rainy days, which could result in a greater number of more intense and concentrated events. The climate change projections for Northeast Brazil suggest an increase in drought for the region, with reduced rainfall, higher temperature and water deficit, and longer drought periods, which are likely to prevail in the second half of the twenty-first century [52].
In this experiment, it was observed that rainfall could not supply the crop water demand (Figure 3) for the three cycles, mainly in cycle 1 (November–February), with a cumulative monthly total rainfall of 0.4, 23.1, and 25.2 mm, respectively, also close to the climatological normal (Figure 1c). Crop requirements in the aforementioned months were 60, 95, and 81 mm. Additionally, for the same region and analyzing a historical series from 1962 to 2016, [53] found that irrigation is required in the period from August to May because of a local water deficit studied a long time series (1963 to 2013) for the entire Agreste region of the Pernambuco State and noted an average rainfall of 20, 20, 51, 60, 105, and 100 mm [54], while a historical series from 1920 to 2010 found an average rainfall for the Pesqueira municipality of 23.46, 28.41, 43.98, 65.91, 90.21, and 103.13 mm, for November, December, January, February, March, and April, respectively [35]. These values are similar to those recorded at the study site during the experimental period (Figure 1c).
The total mean annual rainfall in the region is 600 mm. Found itself a total of 648.6 mm [54] and values ranging from 698 to 1208.4 mm [35]. Based on such high annual figures, it is expected that rainfall occurrence could play a significant role in salt leaching, and hence to land conservation, assuming that soil properties and drainage efficiency favor salinity control.
In addition to the monthly water deficits, recurrent droughts may occur, resulting in rainfall below the climatological normal value, particularly for the last two decades, with severe droughts occurring in the Brazilian Northeast and also in the Ipojuca Catchment [55]. Indeed, for the last two decades in the region, there were several negative impacts on the agricultural sector, with substantial losses for grains, cereals, legumes, fruit, and vegetable production. Livestock were also affected, with production losses for milk and its derivatives, in addition to social impacts, mainly related to rainfall below normal value (469.61 mm) in the rainy period (February to July) [54]. Hence, irrigation with treated wastewater for forage sorghum cultivation becomes essential to cope with water shortages and to supply agricultural production, one of the main income sources for the region.

4.2. Growth and Sorghum Production under Different Water Regimes with Wastewater

A linear increase in behavior for the variables plant height (PH), stem diameter (SD), and number of tillers (NT) with irrigation depth for the three sorghum sections had been observed, according to the regression analysis, except for the power pattern shown by the PH variable in Section 1 (Figure 4a). Such results highlight the sorghum’s potential response for higher irrigation depths, thus bearing out results reported by [56], who also found a positive linear response in plant height due to an increase in the irrigation depth for the sorghum crop to which mulch was applied.
NT was significantly higher for plants in the mulched areas than for those in areas without mulch application (BS) (Figure 4f). This indicates that plants under mulching were less susceptible to environmental stresses such as thermal variation of the soil, and so their productive tillers’ capacity and general productivity increased. According to [28] and [57], one of the main positive impacts of using mulch is that thermal fluctuation is reduced.
The 140% of ETc depth in sorghum cycle 3 promoted an increase of 23.3% in relation to the reference literature value (Figure 4a), which is 230 cm [42].
Evaluating the Sorghum sudanense growth under saline conditions, found that there was usually less growth in the first cycle since sorghum plants show greater sensitivity to salinity for the early cultivation periods [25].
In our study, better development was found for mulched areas, mainly for the first cycle when the crop is still getting established and adapting to environmental stresses, such as soil salinity.
Studies developed by [31] and [2] noted that mulch is a relevant conservation practice for semiarid regions since it enhances rainfall interception and infiltration and contributes to crop development.
Regarding the leaf area index (LAI) behavior, it can be seen that the sorghum crop performed better at irrigation depths of 100%, 120%, and 140% of the ETc (Figure 5), resulting in better development in terms of crop height (PH) (Table 3), and productivity (PRD) (Figure 6). High values for sorghum (LAI) reflect an adequate interception of photosynthetically active solar radiation, thereby promoting greater dry matter productivity [58]. However, when plants are under stress due to adverse soil, climate, or management conditions, transpiration and sap flow decrease, and thus a reduction in LAI would occur [59].
Addressing the irrigation depth factor, [60] found an increase in LAI for higher depths and adopted five values of IDs (60%, 80%, 100%, 120%, and 140% of ETo) for forage sorghum. The highest index of 4.806 m2 m−2 was reached for ID equal to 120% of ETo, in the south region of Brazil.
According to [61], the tillering potential (NT) is a highly important indicator for forage sorghum development, and it is directly related to LAI elevation and consequently to the plant biomass production. A similar relationship can also be seen in this study, with greater tillering being observed for the higher irrigation depths IDs (Figure 4e), as well as for areas where mulch cover was applied (Figure 4f), resulting in higher LAI.
A field investigation points out that high sorghum crop LAI values result from suitable crop management, where appropriate interception of solar radiation occurs, which reflects positively on crop productivity [60]. In their study with Sorghum bicolor L. (Moench) in the Rio Grande do Sul State, Brazil, over the 2014/2015 harvesting period, the authors obtained LAI of up to 4.8 for an ID of 120% of ETo. In Santa Catarina State, also in South Brazil, for the 2012/2013 harvesting period of Sorghum bicolor, the authors of [62] found an LAI of 7.09 m2 m−2 for an irrigation depth ID of 100% of the ETc.
Cycles 2 and 3 were the ones showing better crop performance, with the highest crop productivity being observed for an ETc of 140%, providing yields of 12.3 and 15.6 Mg ha−1, which were above production obtained for the ID of 60% of ETc in 15.3% and 24.7%, respectively (Figure 6c). Increased sorghum productivity for the second cycle was also observed by [60], working with irrigation depths of 60%, 80%, 100%, 120%, and 140% of ETo, as already mentioned.
Results for different mulch types (Figure 6d) indicate that the natural mulch NC yielded higher average productivity values. This effect can be attributed to the lower degradation of the natural cover over the course of cycles, with no replacement occurring during these periods, only at crop cutting time.
For cycles 1 and 3, crop productivity in areas under NC treatment was 24% and 8% higher than the BS area, respectively (Figure 6d). The mulch significantly increased dry matter production for forage sorghum cultivars by 62%, compared to areas without mulch [63]. This agricultural practice is essential in semiarid regions, according to [31] and [28], to maintain soil moisture and reduce soil temperature fluctuation, thus favoring crop development.

4.3. Effects of Irrigation Depths with Wastewater and Mulch on Soil Electrical Conductivity and Organic Matter

We can say that there was a significant reduction in soil EC for all treatments, for cycles 2 and 3, with mean reductions of 50% and 49% in relation to cycle 1, for the 0–20 cm layer (Figure 7a). This behavior is associated with the adopted irrigation management and is also influenced by the occurrence of intense rainfall events such as the 115 mm rainfall recorded on 16 February 2019, promoting the leaching of salts. In addition, there is a drainage system in the area, which also contributed to the soil EC reduction.
A study with saline soil from China’s coastal board, with a shallow water table (1.2 m deep), demonstrates that drainage is essential to improve crop development and that drains built with biological materials improve drainage performance [64].
Such reduction observed for soil EC was fundamental for the greater growth and for higher sorghum productivity in cycles 2 and 3, in response to the higher irrigation depths’ IDs (Figure 6c,d).
It should be mentioned that crops affected by salt stresses would face growth limitations, mainly as a consequence of the lower soil osmotic potential, hence restricting water availability and inducing excessive ions accumulation in plant tissues, which can also cause ionic toxicity and nutritional imbalances [65]. Thus, the lower heights that occurred for the first sorghum cycle (Figure 4a,b) could be associated with the higher soil conductivity in the mentioned period (Figure 7a).
Soil electrical conductivity (EC) represents an important variable to describe soil quality in relation to salts concentration. Regular EC monitoring is highly recommended to identify possible changes in areas where wastewater is applied [11,19,65]. From an agricultural point of view, soil quality is related to the soil’s ability to be productive and resilient in an economically feasible way, with physical, chemical, and biological structures within natural limits [14,66].
Thus, it can be assumed that irrigation using wastewater for sorghum cultivation associated with rainwater events can be carried out without affecting soil productivity capacity, provided that mulching and leaching irrigation depths are adopted as agricultural practices, wherever there is a subsurface drainage system.
Of the types of covering adopted, the coconut coir treatment showed a high potential for reducing soil salinity, enhancing salts leaching from the root zone, as observed for cycles 1 and 3, presenting statistically lower values than bare soil conditions. In semiarid regions, coconut coir has shown a high potential for aiding agricultural cultivation, also improving soil water infiltration capacity [31].
Evaluating the spatial variability of soil salinity in the same cultivation area where forage sorghum is grown, carried out at the end of July 2019, [14] found mean and standard deviation values for soil electrical conductivity of 2.25 and 1.89 dS m−1, and 0.80 and 0.76, respectively for 0–20 cm and 20–40 cm layers. No statistical differences were detected between the electrical conductivity values between the layers, according to Tukey’s test. Thus, it can be pointed out that the joint effect of agricultural practices, rainfall events, and the subsurface drainage efficiency properly controlled soil electrical conductivity at the irrigated field.
This result is reinforced by the fact that the irrigated field has been used for several crop cultivations since 2009, using wastewater from the local district. [67] presented results for color cotton cultivation, while [51] developed the cultivation of moringa, investigating soil and salinity dynamics using drainage lysimeters. Soil retention properties were analyzed, and similar salinity dynamics were confirmed for the 0–20 cm, 20–40 cm, and 40–60 cm layers. The mean electrical conductivity values were 3.0, 2.3, and 3.2 dS m−1, for layers 0–20 cm, 20–40 cm, and 40–60 cm, respectively, for the period from February to May 2015 [51]. Higher salinity values were measured for corn cultivation in the area from May to August 2016, with mean electrical conductivity of 6.72 dS m−1 [14], but similar to the soil electrical conductivity at the sorghum sowing. Hence, no tendency for soil salinity to increase has been detected in the experimental area for the ten-year period of irrigated cultivation with wastewater.

4.4. Water Table Level and Salinity Dynamics in the Experimental Area

Successive rainfall events of 22, 36.2, and 115 mm day−1, which occurred from the end of January until February 2019 (Figure 8a), led to a significant reduction in the water table electrical conductivity (−14%). Naturally, intense rainfall plays an important role in controlling salinity in both the soil profile and the water table. This effect is very beneficial for soil chemical properties since it prevents the accumulation of salts in the root zone, which contributes to the irrigated areas’ sustainability [68].
It was found in wheat verified that the soil salt content built up due to saline water irrigation was almost completely leached from the topsoil layer of 0–20 cm, at the end of the rainy season, even for irrigation water salinity of 13 dS m−1 [38]. Mean precipitation in the region reaches 1673 mm.
For our case study, the wastewater showed an electrical conductivity of 5.7 dS m−1, resulting in 9.33 dS m−1 soil electrical conductivity for the 100% ETc depth. It can be shown that rainfall events from February to April reduced soil electrical conductivity by 60%.
According to [39], salt leaching in areas with shallow groundwater may not be efficient. However, rainfall can play a key role in leaching soil salinity, as highlighted by [37], assessing the potential of rainfall to leach salts from the soil profile in the Mediterranean region. The authors found that using brackish water for crop irrigation led to salt accumulation in the soil profile, requiring additional freshwater depths for proper leaching. Ref. [68] also recommended leaching depths where precipitation is not enough to control salinity.
For our study, rainfall distribution that occurs in the Brazilian semiarid region, mainly from February to April, has a strong influence on reducing soil salinity from a sandy profile in a drained area. Intense rainfall is a feature in the Brazilian semiarid region [34].
Mulching is an important agricultural practice that helps to control salinity, attenuate soil drying, and consequently reduce the capillary rise from a shallow water table [69]. It can be stated that the NC and CC covering types were more efficient for controlling the aforementioned processes, thanks to their lower degradation over the course of the sorghum cropping cycles.
In our study, the root zone and the shallow water table salinities did not exceed the threshold salinity for the IPA sorghum (10 dS m−1). [8] irrigated forage sorghum with wastewater, and they also found that the soil profile remained appropriate for cultivation, below the threshold crop salinity (6.8 dS m−1), for two consecutive years. No significant changes in the EC dynamics occurred, comparing measurements in the area where wastewater was applied to a control area (irrigated with domestic water supply) in a semiarid region of the United States, where the mean total annual rainfall is 169 mm.
Intense rainfall events meant that there was a strong negative correlation of rainfall with the water table depth (−0.86), observing its rise, and a decrease in salinity ESD (−0.81) and ECS (−0.86), mainly for January, February and March, according to the PCA analysis (Figure 8b), with strong negative correlations between these variables (Dim1). According to [70], vector angles of 90° or wider indicate the absence of correlation or negative correlation. Thus, the obtained results make it clear that rainfall had a strong influence on soil and groundwater salinity control.
Irrigation with wastewater caused an increase in TOC for all coverage conditions (Figure 9a), although such increments were significantly lower for the BS treatment. According to [71], organic carbon losses due to erosion or leaching processes can be significantly higher in soils without mulch protection than in areas with mulching.
It can be said that high levels of TOC have occurred for plots where OM was applied (Figure 9b). This result is associated with the high mineralization that occurs for that vegetal covering material, characterized as a leguminous plant. Such behavior was also observed by [44], who found that mulching from Leguminosae family species had a remarkable effect on soil TOC increments compared with coverage materials from Poaceae family plants.
The different irrigation depths increased TOC throughout the cultivation period, but there was no statistical difference. Although IDs values do not result in differences in relation to TOC for the experiment, the authors of [72] indicate the important contributions of wastewater in supplying essential nutrients to the plants development, as well as adding organic matter to the soil, thus increasing its water retention capacity.

4.5. Impacts of Soil Electrical Conductivity (EC) and of Total Organic Carbon (TOC) on Sorghum Productivity

Despite the low to moderate negative correlations between EC and PRD, it was verified that salinity influenced the reduction in sorghum productivity, as shown in Table 5, particularly for the BS condition. For the cropping period in which EC was the highest (cycle 1), the effect was not very pronounced, as the sorghum has a threshold salinity of 10 dS m−1 [42]. Productions of 10 sorghum varieties under different irrigation water qualities (0, 2.5, 5.0, 7.5, 10, and 12.5 dS m−1) found a high correlation between the reduction in productivity and salinities of 10 and 12.5 dS m−1 [73]. In our study, the reduction in soil salinity for cycles 2 and 3 resulted in higher correlations with productivity compared to cycle 1, although still not significant. Values of Spearman’s coefficients close to 1 or −1 indicate strong dependence or high correlation, while those close to 0 represent instability or weak dependence [74]. Thus, it can be stated that there is a weak dependence between EC and PRD of forage sorghum for the three cropping cycles.
For the coconut coir (CC) condition, correlation values between electrical conductivity and productivity were always of low magnitude for the whole cycle (Table 5). Thus, even under higher soil EC, sorghum was produced properly with this treatment. Of the likely positive effects of coconut coir, the higher salt leaching capacity from the root zone should be noted; it is due to the induced increase in infiltration [30]. In addition, according to [75], the increase in soil water infiltration is an important effect associated with the use of coconut coir as a mulch cover on the soil surface. This effect is also consistent with the results shown in Figure 7b, at the end of the third cycle, when the CC condition had the lowest electrical conductivity values.
As for the total organic matter, a low correlation was observed between the TOC stock and productivity.
Regarding the principal components, Dim1 and Dim2 explained 69% of the total variation in cycle 1 (Figure 10a), 73.5% in cycle 2 (Figure 10b) and 71.8 in cycle 3 (Figure 10c). This high variance ratio is explained by the first two main components. It means that productivity and total organic carbon stock are strongly associated, according to the principal component analysis (PCA), showing a positive relationship mainly for the 120% and 140% of ETc irrigation depths. It should be noted that such association was not detected by the correlation analysis previously discussed.
In PCA graphs, vector angles lower than 90° indicate a positive correlation [70]. This means that significant positive correlations between productivity in CC (PRDCC) for all cycles indicate that this material performs well at maintaining TOC and PRO. According to [2], coconut coir mulch is also an important management alternative for maintaining soil moisture and raising productivity under rainfed conditions in the semiarid region.

5. Conclusions

Yields of forage sorghum irrigated with supplementary wastewater as described in our study were compatible with yields obtained when irrigation was carried out using suitable quality water, as reported in the literature. Elevation in the irrigation depths up to 140% of ETc promoted linear increases in sorghum development indexes of plant height, stem diameter, tiller number, leaf area index, dry mass, and productivity for cycles 2 and 3. The leaf area index was positively influenced by the increase in irrigation depths, as well as by the mulch application.
Mulch application led to better sorghum development, which can increase its productivity by up to 24% in relation to areas where this conservation practice is not employed. Additionally, of the investigated covering types, coconut coir had the greatest potential to control salinity in areas irrigated with wastewater while simultaneously facilitating higher incorporation of organic matter and thus increasing the plants’ capacity to overcome environmental stresses.
Irrigation with wastewater increased soil and groundwater salinity during the dry period. However, the occurrence of rainfall events reduced salinity and restored the productive capacity of the cultivated areas, thereby enabling reasonable cultivation development. For this washing process promoted by rainfall to be successful, it is highly recommended that a subsurface drainage system should be implemented. The principal component analysis clearly showed that precipitation had a strong negative relationship with reducing soil and groundwater salinity in the rainy months and that the irrigation depths of 120% and 140% of the ETc were grouped and significantly influenced sorghum productivity and soil carbon stocks.

Author Contributions

Formal analysis, Investigation, Interpretation of the results, Writing—original draft preparation, A.A.d.C. and T.A.B.A.; Conceptualization, Methodology, Interpretation of the results, Supported the analysis, Writing—original draft preparation, Supervision, Project administration, Funding acquisition, A.A.d.A.M.; Conceptualization, Writing—review and editing, Methodology, Supported the analysis, Supervision, J.L.M.P.d.L., T.G.F.d.S. and E.M.R.P. All authors have read and agreed to the published version of the manuscript.

Funding

Funding for this research is mentioned in the acknowledgments.

Institutional Review Board Statement

Not applicable.

Informed Consent Statement

Not applicable.

Data Availability Statement

Not applicable.

Acknowledgments

The authors would like to thank the following organizations for their support: the National Council for Scientific and Technological Development—CNPq (151969/2020-5); the Brazilian Funding Authority for Studies and Projects—FINEP; the Foundation of Science and Technology Support for Pernambuco State—FACEPE (IBPG-1758-5.03/15 Scholarship and “Tecnologias Hídricas para o semiárido” Project—Grant APQ 0300-5.03/17); the Coordination for the Improvement of Higher Education Personnel (CAPES, Finance code 001; the CAPES/PrInt–UFRPE Programme for internationalization) to the Agronomic Institute of Pernambuco—IPA; and also the Federal Rural University Postgraduate Programme in Agricultural Engineering. The authors are also grateful for financial support from the Portuguese Foundation for Science and Technology (FCT) through the Projects GOLis (PDR2020-101-030913, Partnership nr. 344/Initiative nr. 21), ASHMOB (CENTRO-01-0145-FEDER-029351), and MEDWATERICE (PRIMA/0006/2018). In addition, the authors would like to thank the two anonymous reviewers for their suggestions and comments.

Conflicts of Interest

The authors declare no conflict of interest.

References

  1. Da Silva, L.C.; Da Silva, J.L.B.; Moura, G.B.D.A.; Silva, D.A.D.O.; Lopes, P.M.O.; Nascimento, C.R.; Da Silva, M.V.; Batista, P.H.D. Índices biofísicos e o saldo de radiação à superfície via sensoriamento remoto no semiárido pernambucano. J. Environ. Anal. Prog. 2021, 6, 12–23. [Google Scholar] [CrossRef]
  2. Montenegro, A.; Almeida, T.; Lima, C.; Abrantes, J.; de Lima, J. Evaluating mulch cover with coir dust and cover crop with Palma cactus as soil and water conservation techniques for semiarid environments: Laboratory soil flume study under simulated rainfall. Hydrology 2020, 7, 61. [Google Scholar] [CrossRef]
  3. De Carvalho, A.A.; Montenegro, A.A.D.A.; Da Silva, H.P.; Lopes, I.; De Morais, J.E.F.; Da Silva, T.G.F. Trends of rainfall and temperature in Northeast Brazil. Rev. Bras. Eng. Agrícola Ambient. 2020, 24, 15–23. [Google Scholar] [CrossRef] [Green Version]
  4. Montenegro, S.G.; Montenegro, A.; Ragab, R. Improving agricultural water management in the semi-arid region of Brazil: Experimental and modelling study. Irrig. Sci. 2009, 28, 301–316. [Google Scholar] [CrossRef]
  5. Lopes, I.; Montenegro, A.A.A.; de Lima, J.L.M.P. Performance of conservation techniques for semiarid environments: Field observations with Caatinga, mulch, and cactus forage palma. Water 2019, 11, 792. [Google Scholar] [CrossRef] [Green Version]
  6. Velasco-Muñoz, J.F.; Aznar-Sánchez, J.A.; Batlles-Delafuente, A.; Fidelibus, M.D. Rainwater harvesting for agricultural irrigation: An analysis of global research. Water 2019, 11, 1320. [Google Scholar] [CrossRef] [Green Version]
  7. Zhang, Y.; Li, X.; Šimůnek, J.; Shi, H.; Chen, N.; Hu, Q.; Tian, T. Evaluating soil salt dynamics in a field drip-irrigated with brackish water and leached with freshwater during different crop growth stages. Agric. Water Manag. 2020, 244, 106601. [Google Scholar] [CrossRef]
  8. Chaganti, V.N.; Ganjegunte, G.; Niu, G.; Ulery, A.; Flynn, R.; Enciso, J.; Meki, M.N.; Kiniry, J.R. Effects of treated urban wastewater irrigation on bioenergy sorghum and soil quality. Agric. Water Manag. 2019, 228, 105894. [Google Scholar] [CrossRef]
  9. Valente, S.R.D.P. Direito e políticas públicas: Uma visão jurídico-institucional sobre o caso do saneamento básico no Brasil. REI Rev. Estud. Inst. 2019, 5, 1064–1092. [Google Scholar] [CrossRef]
  10. da Silva, L.P.B.; Hussein, H. Production of scale in regional hydropolitics: An analysis of La Plata River Basin and the Guarani aquifer system in South America. Geoforum 2019, 99, 42–53. [Google Scholar] [CrossRef]
  11. Adhikari, P.; Shukla, M.K.; Mexal, J.G. Spatial variability of electrical conductivity of desert soil irrigated with treated wastewater: Implications for irrigation management. Appl. Environ. Soil Sci. 2011, 2011, 1–11. [Google Scholar] [CrossRef] [Green Version]
  12. Flörke, M.; Schneider, C.; McDonald, R.I. Water competition between cities and agriculture driven by climate change and urban growth. Nat. Sustain. 2018, 1, 51–58. [Google Scholar] [CrossRef]
  13. Libutti, A.; Gatta, G.; Gagliardi, A.; Vergine, P.; Pollice, A.; Beneduce, L.; Disciglio, G.; Tarantino, E. Agro-industrial wastewater reuse for irrigation of a vegetable crop succession under Mediterranean conditions. Agric. Water Manag. 2018, 196, 1–14. [Google Scholar] [CrossRef]
  14. Carvalho, A.A.; Montenegro, A.A.D.A.; Tabosa, J.N.; Almeida, T.A.B.; Da Silva, A.G.O.; Silveira, A.V.M. Reuso hidroagrícola: Uma solução para convivência com a escassez hídrica no Sertão e Agreste pernambucano. J. Environ. Anal. Prog. 2020, 5, 140–150. [Google Scholar] [CrossRef]
  15. Feder, F. Irrigation with treated wastewater in humid regions: Effects on Nitisols, sugarcane yield and quality. Agric. Water Manag. 2021, 247, 106733. [Google Scholar] [CrossRef]
  16. de Lemos, M.; Ferreira-Neto, M.; Fernandes, C.D.S.; de Lima, Y.B.; Dias, N.D.S.; de Medeiros, J.F.; de Brito, R.F.; Sá, F.V.D.S. The effect of domestic sewage effluent and planting density on growth and yield of prickly pear cactus in the semiarid region of Brazil. J. Arid. Environ. 2020, 185, 104372. [Google Scholar] [CrossRef]
  17. Ungureanu, N.; Vlăduț, V.; Voicu, G. Water scarcity and wastewater reuse in crop irrigation. Sustainability 2020, 12, 9055. [Google Scholar] [CrossRef]
  18. Schwaller, C.; Keller, Y.; Helmreich, B.; Drewes, J.E. Estimating the agricultural irrigation demand for planning of non-potable water reuse projects. Agric. Water Manag. 2020, 244, 106529. [Google Scholar] [CrossRef]
  19. Dias, N.S.; Blanco, F.F.; Souza, E.R.; Ferreira, J.F.S.; Souza Neto, O.N. Efeitos Dos Sais Na Planta e Tolerância Das Culturas à Salinidade. Manejo Da Salinidade Na Agricultura: Estudos Básicos e Aplicados, 2nd ed.; INCTSal: Fortaleza, Brazil, 2016. [Google Scholar]
  20. Elgallal, M.; Fletcher, L.; Evans, B. Assessment of potential risks associated with chemicals in wastewater used for irrigation in arid and semiarid zones: A review. Agric. Water Manag. 2016, 177, 419–431. [Google Scholar] [CrossRef]
  21. Nagaz, K.; Masmoudi, M.M.; Ben Mechlia, N. Impacts of irrigation regimes with saline water on carrot productivity and soil salinity. J. Saudi Soc. Agric. Sci. 2012, 11, 19–27. [Google Scholar] [CrossRef] [Green Version]
  22. Abd-Elwahed, M.S. Influence of long-term wastewater irrigation on soil quality and its spatial distribution. Ann. Agric. Sci. 2018, 63, 191–199. [Google Scholar] [CrossRef]
  23. Yang, T.; Šimůnek, J.; Mo, M.; Mccullough-Sanden, B.; Shahrokhnia, H.; Cherchian, S.; Wu, L. Assessing salinity leaching efficiency in three soils by the HYDRUS-1D and -2D simulations. Soil Tillage Res. 2019, 194. [Google Scholar] [CrossRef] [Green Version]
  24. Lopez, J.R.; Winter, J.M.; Elliott, J.; Ruane, A.C.; Porter, C.; Hoogenboom, G. Integrating growth stage deficit irrigation into a process-based crop model. Agric. For. Meteorol. 2017, 243, 84–92. [Google Scholar] [CrossRef]
  25. Oliveira, V.P.; Marques, E.C.; Lacerda, C.F.; Prisco, J.T.; Gomes-Filho, E. Physiological and biochemical characteristics of sorghum bicolor and sorghum Sudanese subjected to salt stress in two stages of development. Afr. J. Agric. Res. 2013, 8, 660–670. [Google Scholar] [CrossRef]
  26. Jardim, A.M.D.R.F.; da Silva, T.G.F.; de Souza, L.S.B.; Júnior, G.D.N.A.; Alves, H.K.M.N.; Souza, M.D.S.; de Araújo, G.G.L.; de Moura, M.S.B. Intercropping forage cactus and sorghum in a semi-arid environment improves biological efficiency and competitive ability through interspecific complementarity. J. Arid. Environ. 2021, 188, 104464. [Google Scholar] [CrossRef]
  27. Karlberg, L.; Rockström, J.; Annandale, J.G.; Steyn, M. Low-cost drip irrigation—A suitable technology for southern Africa? An example with tomatoes using saline irrigation water. Agric. Water Manag. 2007, 89, 59–70. [Google Scholar] [CrossRef]
  28. Montenegro, A.; Abrantes, J.; de Lima, J.; Singh, V.; Santos, T. Impact of mulching on soil and water dynamics under intermittent simulated rainfall. Catena 2013, 109, 139–149. [Google Scholar] [CrossRef]
  29. Yang, H.; Liu, H.; Zheng, J.; Huang, Q. Effects of regulated deficit irrigation on yield and water productivity of chili pepper (Capsicum annuum L.) in the arid environment of northwest China. Irrig. Sci. 2017, 36, 61–74. [Google Scholar] [CrossRef]
  30. De Souza, E.R.; Montenegro, A.A.D.A.; Montenegro, S.M.G.; Matos, J.D.A.D. Temporal stability of soil moisture in irrigated carrot crops in northeast Brazil. Agric. Water Manag. 2011, 99, 26–32. [Google Scholar] [CrossRef]
  31. Borges, T.K.D.S.; Montenegro, A.A.D.A.; Dos Santos, T.E.M.; Da Silva, D.D.; Junior, V.D.P.E.S. Influência de práticas conservacionistas na umidade do solo e no cultivo do milho (Zea mays L.) em semiárido nordestino. Rev. Bras. Ciênc. Solo 2014, 38, 1862–1873. [Google Scholar] [CrossRef] [Green Version]
  32. Gebru, T.A.; Brhane, G.K.; Gebremedhin, Y.G. Contributions of water harvesting technologies intervention in arid and semi-arid regions of Ethiopia, in ensuring households’ food security, Tigray in focus. J. Arid. Environ. 2020, 185, 104373. [Google Scholar] [CrossRef]
  33. Dos Santos, S.M.; de Farias, M.M.M. Potential for rainwater harvesting in a dry climate: Assessments in a semiarid region in northeast Brazil. J. Clean. Prod. 2017, 164, 1007–1015. [Google Scholar] [CrossRef]
  34. Tinôco, I.C.M.; Bezerra, B.G.; Lucio, P.S.; Barbosa, L.M. Characterization of rainfall patterns in the semiarid Brazil. Anuário Inst. Geociências 2018, 41, 397–409. [Google Scholar] [CrossRef]
  35. Silva, A.; Montenegro, A.; Moura, G.; Silva, J.; Souza, L. Chuva mensal provável para o Agreste de Pernambuco. Rev. Bras. Ciências Agrárias 2013, 8, 287–296. [Google Scholar] [CrossRef] [Green Version]
  36. Monteiro, A.L.N.; Montenegro, A.A.D.A.; Montenegro, S.M.G.; Dos Santos, F.X. Avaliação de lavagem parcial de sais em neossolo flúvico irrigado, utilizando modelagem computacional. Eng. Agrícola 2009, 29, 207–220. [Google Scholar] [CrossRef] [Green Version]
  37. Monteleone, M.; Libutti, A. Salt leaching due to rain in Mediterranean climate: Is it enough? Ital. J. Agron. 2012, 7, 6. [Google Scholar] [CrossRef] [Green Version]
  38. Mojid, M.A.; Acharjee, T.K. Efficacy of monsoon rainfall in salt leaching through a field soil after wheat cultivation under saline water irrigation. Environ. Control Biol. 2013, 51, 35–39. [Google Scholar] [CrossRef] [Green Version]
  39. Gelaye, K.K.; Zehetner, F.; Loiskandl, W.; Klik, A. Effects of soil texture and groundwater level on leaching of salt from saline fields in Kesem irrigation scheme, Ethiopia. Soil Water Res. 2019, 14, 221–228. [Google Scholar] [CrossRef] [Green Version]
  40. Alvares, C.A.; Stape, J.L.; Sentelhas, P.C.; Gonçalves, J.L.M.; Sparovek, G. Köppen’s climate classification map for Brazil. Meteorol. Z. 2013, 22, 711–728. [Google Scholar] [CrossRef]
  41. Santos, H.; Carvalho, W.; Dart, R.; Aglio, M.; Sousa, J.; Peres, J.; Fontana, A.; Martins, A.; De Oliveira, A. O Novo Mapa de Solos Do Brasil—Legenda Atualizada—Escala 1:5.000.000. 2017. Available online: http://www.infoteca.cnptia.embrapa.br/infoteca/handle/doc/920267 (accessed on 20 August 2021).
  42. Instituto Agronômico de Pernambuco (IPA). Sorgo Sudão: Sudan 4202—Cultivar Tolerante a Salinidade e Com Aptidão Para Feno. 2007. Available online: http://www.infoteca.cnptia.embrapa.br/infoteca/handle/doc/487334 (accessed on 20 August 2021).
  43. Carvalho, A.A.; Montenegro, A.A.D.A.; Santos, C.S.; Silva, T. Zoneamento agrometeorológico da moringa para o Estado de Pernambuco em condições atuais e projeções futuras. J. Environ. Anal. Prog. 2017, 2, 194–202. [Google Scholar] [CrossRef]
  44. Qian, X.; Gu, J.; Pan, H.-J.; Zhang, K.-Y.; Sun, W.; Wang, X.-J.; Gao, H. Effects of living mulches on the soil nutrient contents, enzyme activities, and bacterial community diversities of apple orchard soils. Eur. J. Soil Biol. 2015, 70, 23–30. [Google Scholar] [CrossRef]
  45. Costa, J.P.N.; Medeiros, J.F.; Nunes, R.M.D.A.; Junior, E.G.C.; Lira, J.F.B. Crescimento e produção da primeira rebrota de cultivares de sorgo sob diferentes lâminas de irrigação. Rev. Bras. Milho Sorgo 2017, 16, 449–459. [Google Scholar] [CrossRef] [Green Version]
  46. Allan, R.; Pereira, L.; Dirk, R.; Smith, M. Crop Evapotranspiration—Guidelines for Computing Crop Water Requirements—FAO Irrigation and Drainage Paper. 1998. Available online: http://www.avwatermaster.org/filingdocs/195/70653/172618e_5xAGWAx8.pdf (accessed on 20 August 2021).
  47. Empresa Brasileira de Pesquisa Agropecuária (EMBRAPA). Manual de Análises Químicas de Solos, Plantas e Fertilizantes, 1st ed.; Empresa Brasileira de Pesquisa Agropecuária (EMBRAPA): Santa Catarina, Brazil, 1999; ISBN 978-85-7383-430-7. [Google Scholar]
  48. Padilla, F.; Maas, S.; González-Dugo, M.; Mansilla, F.; Rajan, N.; Gavilán, P.; Domínguez, J. Monitoring regional wheat yield in Southern Spain using the GRAMI model and satellite imagery. Field Crop. Res. 2012, 130, 145–154. [Google Scholar] [CrossRef]
  49. Yeomans, J.C.; Bremner, J.M. A rapid and precise method for routine determination of organic carbon in soil. Commun. Soil Sci. Plant. Anal. 1988, 19, 1467–1476. [Google Scholar] [CrossRef]
  50. R Core Team. R: A Language and Environment for Statistical Computing; R Foundation for Statistical Computing: Vienna, Austria, 2018. [Google Scholar]
  51. Dos Santos, C.S.; Montenegro, A.A.D.A.; Dos Santos, M.A.L.; Pedrosa, E.M.R. Evapotranspiration and crop coefficients of Moringa oleifera under semi-arid conditions in Pernambuco. Rev. Bras. Eng. Agrícola Ambient. 2017, 21, 840–845. [Google Scholar] [CrossRef] [Green Version]
  52. Marengo, J.A.; Bernasconi, M. Regional differences in aridity/drought conditions over northeast Brazil: Present state and future projections. Clim. Chang. 2014, 129, 103–115. [Google Scholar] [CrossRef]
  53. De França, M.V.; De Medeiros, R.M.; De Holanda, R.M.; Silva, V.D.P.; Ferraz, J.X.V.; Sobral, D.D.M. Aptidão climática para o cultivo da banana em Caruaru-PE, Brasil. J. Environ. Anal. Prog. 2018, 3, 265–274. [Google Scholar] [CrossRef]
  54. Pereira, M.L.T.; Soares, M.P.A.; Silva, E.; Montenegro, A.A.D.A.; De Souza, W.M. Variabilidade climática no Agreste de Pernambuco e os desastres decorrentes dos extremos climáticos. J. Environ. Anal. Prog. 2017, 2, 394–402. [Google Scholar] [CrossRef] [Green Version]
  55. Marengo, J.A.; Alves, L.M.; Alvala, R.C.; Cunha, A.P.M.; Brito, S.; Moraes, O. Climatic characteristics of the 2010–2016 drought in the semiarid northeast Brazil region. An. Acad. Bras. Ciências 2018, 90, 1973–1985. [Google Scholar] [CrossRef]
  56. Alcântara, P.; Sousa, P.G.R.; Brasil, S.O.S.; Sousa, J.P.F.; Bastos, R.L.G.; Viana, T.V.A. Desempenho agronômico do sorgo em função de lâminas de irrigação e cobertura do solo. Rev. Bras. Agric. Irrig. 2017, 11, 2194. [Google Scholar] [CrossRef] [Green Version]
  57. Abrantes, J.; Prats, S.A.; Keizer, J.J.; de Lima, J.L. Effectiveness of the application of rice straw mulching strips in reducing runoff and soil loss: Laboratory soil flume experiments under simulated rainfall. Soil Tillage Res. 2018, 180, 238–249. [Google Scholar] [CrossRef]
  58. Schneider, J.R.; Caron, B.O.; Elli, E.F.; Schwerz, F.; Engroff, T.D. Solar radiation use efficiency and gross protein of sorghum forage are modified by the cutting management. Ciência Anim. Bras. 2019, 20. [Google Scholar] [CrossRef]
  59. Taiz, L.; Zeiger, E.; Møller, I.M.; Murphy, A.; Oliveira, P.L.; Mastroberti, A.A.; Junior, A.M.D.; Santarém, E.R.; Mariath, J.E.; Lima, J.C.; et al. Fisiologia e Desenvolvimento Vegetal, 6th ed.; Artmed: Guelph, ON, Canada, 2016; ISBN 978-85-8271-366-2. [Google Scholar]
  60. Jardel, H.K.; Adroaldo, D.R.; Marcia, X.P.; Wellington, M.; Rogério, R.T.; Leonita, B.G.; Bruna, D.P.; Ricardo, B.R.; Anderson, C.P.; Marcos, V.L.; et al. Variation of leaf area index of the forage sorghum under different irrigation depths in dynamic of cuts. Afr. J. Agric. Res. 2017, 12, 111–124. [Google Scholar] [CrossRef] [Green Version]
  61. Kuraparthy, V.; Sood, S.; Gill, B.S. Genomic targeting and mapping of tiller inhibition gene (tin3) of wheat using ESTs and synteny with rice. Funct. Integr. Genom. 2007, 8, 33–42. [Google Scholar] [CrossRef] [PubMed]
  62. Zwirtes, A.L.; Carlesso, R.; Petry, M.T.; Kunz, J.; Reimann, G.K. Desempenho produtivo e retorno econômico da cultura do sorgo submetida à irrigação deficitária. Eng. Agrícola 2015, 35, 676–688. [Google Scholar] [CrossRef] [Green Version]
  63. Costa, E.; Souza, E.; Junior, G.B.; Filho, J.N.; Souza, J.; Tabosa, J.; Leite, M. Cultivo de sorgo em sistema de vazante com e sem cobertura do solo. Rev. Bras. Milho Sorgo 2015, 14, 182–195. [Google Scholar] [CrossRef]
  64. Lu, P.; Zhang, Z.; Feng, G.; Huang, M.; Shi, X. Experimental study on the potential use of bundled crop straws as subsurface drainage material in the newly reclaimed coastal land in eastern China. Water 2018, 10, 31. [Google Scholar] [CrossRef] [Green Version]
  65. Travis, M.J.; Wiel-Shafran, A.; Weisbrod, N.; Adar, E.; Gross, A. Greywater reuse for irrigation: Effect on soil properties. Sci. Total Environ. 2010, 408, 2501–2508. [Google Scholar] [CrossRef] [PubMed]
  66. Thoumazeau, A.; Bessou, C.; Renevier, M.-S.; Trap, J.; Marichal, R.; Mareschal, L.; Decaëns, T.; Bottinelli, N.; Jaillard, B.; Chevallier, T.; et al. Biofunctool®: A new framework to assess the impact of land management on soil quality. Part A: Concept and validation of the set of indicators. Ecol. Indic. 2018, 97, 100–110. [Google Scholar] [CrossRef]
  67. Miranda, R.J.A. Lâminas de Irrigação com Água Residuária e Adubação Orgânica na Cultura do Algodão BRS Safira. 2010. Available online: http://dspace.sti.ufcg.edu.br:8080/jspui/handle/riufcg/9781 (accessed on 20 August 2021).
  68. Shahrokhnia, H.; Wu, L. SALEACH: A new web-based soil salinity leaching model for improved irrigation management. Agric. Water Manag. 2021, 252, 106905. [Google Scholar] [CrossRef]
  69. TishehZan, P.; Naseri, A.; Hasanoghli, A.; Mesgarbashi, M. Determine the effect of groundwater depth and salinity on its contribution to the water requirement and the growth of palm seedlings with the use of mulch. Iran. J. Soil Water Res. 2017, 48, 533–541. [Google Scholar] [CrossRef]
  70. Yavuz, D.; Seymen, M.; Süheri, S.; Yavuz, N.; Türkmen, Ö.; Kurtar, E.S. How do rootstocks of citron watermelon (Citrullus lanatus var. citroides) affect the yield and quality of watermelon under deficit irrigation? Agric. Water Manag. 2020, 241. [Google Scholar] [CrossRef]
  71. Montenegro, A.; Junior, S.; Montenegro, S.M.G.L.; Santos, T.; Paula, V.; Ant, A. Erosão hídrica e perda de carbono orgânico em diferentes tipos de cobertura do solo no semi-árido, em condições de chuva simulada. RBRH 2008, 13, 113–125. [Google Scholar] [CrossRef]
  72. Urra, J.; Alkorta, I.; Mijangos, I.; Epelde, L.; Garbisu, C. Application of sewage sludge to agricultural soil increases the abundance of antibiotic resistance genes without altering the composition of prokaryotic communities. Sci. Total Environ. 2018, 647, 1410–1420. [Google Scholar] [CrossRef] [PubMed]
  73. Coelho, D.S.; Simões, W.L.; Mendes, A.M.S.; Dantas, B.F.; Rodrigues, J.A.S.; De Souza, M.A. Germinação e crescimento inicial de variedades de sorgo forrageiro submetidas ao estresse salino. Rev. Bras. Eng. Agrícola Ambient. 2014, 18, 25–30. [Google Scholar] [CrossRef] [Green Version]
  74. Heathman, G.C.; Cosh, M.; Han, E.; Jackson, T.J.; McKee, L.; McAfee, S. Field scale spatiotemporal analysis of surface soil moisture for evaluating point-scale in situ networks. Geoderma 2012, 170, 195–205. [Google Scholar] [CrossRef]
  75. Jeronimo, C.E.; Silva, G.O. Estudo de alternativas para o aproveitamento de resíduos sólidos da industrialização do coco. Rev. Monogr. Ambient. 2013, 10, 2193–2208. [Google Scholar] [CrossRef] [Green Version]
Figure 1. Location of the Ipojuca River catchment (a), sewage treatment station (STS), showing the area cultivated with forage sorghum (b), and agroclimatological information of the cultivation period over the three conducted cycles (c).
Water 13 02288 g001
Figure 2. Sketch (not to scale) of the experimental plots (a) and images for the coconut coir (b), natural cover (c), and moringa seeds (d) treatments.
Water 13 02288 g002
Figure 3. Temporal variation of precipitation, accumulated crop evapotranspiration (ETc) for 60%, 80%, 100%, 120%, and 140% of ETc depths, and daily reference evapotranspiration (ETo) for the forage sorghum in cycle 1 (a), cycle 2 (b) and cycle 3 (c).
Water 13 02288 g003
Figure 4. Behavior of sorghum plant height (PH), stem diameter (SD), and number of tillers (NT) as a function of irrigation depths with wastewater (a,c,e). Box plots for PH, SD, NT under different soil cover conditions (b,d,f), for cycles 1, 2, and 3 of sorghum. Averages were compared using Tukey’s test (p < 0.05) and are indicated by lowercase letters. The significant regression coefficients are for p < 0.01 (**) and p < 0.05 (*).
Water 13 02288 g004
Figure 5. Box plot of the sorghum leaf area index (LAI), depending on the soil cover (C), the irrigation depths (ID) with wastewater (a), and the interaction (C × ID) (b). Averages were compared using Tukey’s test (p < 0.05) and are indicated by lowercase letters. The significant regression coefficients are for p < 0.01 (**) and p < 0.05 (*).
Water 13 02288 g005
Figure 6. Dry mass (DM) (a) and productivity (PRD) (c) of sorghum as a function of irrigation depths using wastewater. Box plot for DM (b) and PRD (d) under different soil cover conditions. Mean values were compared using Tukey’s test (p < 0.05) and are indicated by lowercase letters. The significant regression coefficients are for p < 0.01 (**).
Water 13 02288 g006
Figure 7. Box plot for soil electrical conductivity (EC) as a function of irrigation depths with wastewater (a) and soil use conditions (b). The means were compared using Tukey’s test (p < 0.05) and are indicated by lowercase letters.
Water 13 02288 g007
Figure 8. Groundwater level and electrical conductivity (EC) for the water table and for the soil (EC–soil (0.2 m)) and daily rainfall (a). Principal components analysis using Dim1 and Dim2 for groundwater level (Level). Groundwater electrical conductivity (ECG) and soil electrical conductivity (ECS). Number rainy days (NRD), total rainfall (TR), maximum rainfall (MR), and climatological normal (CN), and results for the variance of Dim1 and Dim2 (b) for sorghum cultivation.
Water 13 02288 g008
Figure 9. Boxplot of total organic carbon concentration (TOC) as a function of irrigation depths (for 60%, 80%, 100%, 120%, and 140% ETc) with wastewater (a), and as a function of the soil cover conditions, bare soil (BS), natural cover (NC), coconut coir (CC), and moringa (MO) (b). Mean values were compared using Tukey’s test (p < 0.05) and are indicated by lowercase letters.
Water 13 02288 g009
Figure 10. Biplots of multivariate analysis using the principal components 1 (Dim1) and 2 (Dim2) for soil electrical conductivity (EC), total organic carbon (TOC), and productivity (PRD), under different soil cover conditions: bare soil (BS), natural cover (NC), coconut coir (CC) and moringa (MO), for the following combinations: ECBS, ECNC, ECCC, ECMO, TOCBS, TOCNC, TOCCC, MOTMO, TOCMO, PRDBS, PRDNC, PRDCC, and PRDMO, as a function of wastewater irrigation depths (60%, 80%, 100%, 120% and 140% of ETc), and the results of the principal component analysis (PCA) for cycle 1 (a), 2 (b), and 3 (c).
Water 13 02288 g010
Table 1. Soil physical-chemical characteristics at the experimental area cultivated with forage sorghum, Pesqueira—PE-Brazil.
Soil Physical CharacteristicsLayer (0–20 cm)Layer (20–40 cm)
Sand (%)84.084.2
Silt (%)3.63.0
Clay (%)12.412.8
Density (g cm−3)1.41.5
Field Capacity (cm³ cm−3)0.30.3
Wilting Point (cm³ cm−3)0.20.2
Saturated paste extract
pH8.08.2
EC (dS m−1)6.97.2
P (ppm)264.0326.0
Na2+ (cmolc dm−3)0.40.9
Ca2+ (cmolc dm−3)5.05.1
Mg2+ (cmolc dm−3)0.51.1
K+ (cmolc dm−3)0.81.0
AluminumNot presentNot present
Table 2. Chemical parameters of treated wastewater used for cultivation.
Parameter (Unit)Values
pH8.3
EC (dS m−1)5.7
BOD (mg L−1)30.0
QOD (mg L−1)125.0
TOC (mg L−1)12.1
TDS (mg L−1)2869.0
N-Total (mg L−1)23.6
P-Total (mg L−1)2.0
K+ (mg L−1)85.8
Ca2+ (mg L−1)34.5
Mg2+ (mg L−1)50.9
Na+ (mg L−1)782.0
Nitrate (mg L−1)42.4
Chloride (mg L−1)950.0
Sulfate (mg L−1)103.7
Bicarbonate (mg L−1)647.2
Table 3. Mean leaf area index (LAI) for sorghum, for bare soil conditions (BS), natural cover (NC), coconut coir (CC), and moringa (MO), and for irrigation depths of 60%, 80%, 100%, 120%, and 140% of ETc.
LAI (m2 m−2)
ETc (%)
Cover Types6080100120140
BS5.84 ab BC5.32 ab C7.15 ab AB7.47 A7.78 A
NC4.82 b B4.7 b B8.09 a A7.74 A7.71 A
CC6.72 a ABC5.22 b C6.55 b BC7.43 AB8.19 A
MO5.1 b B6.71 a A7.35 ab A7.01 A8.03 A
Means in the same columns followed by the same lowercase letters, and in the lines by the upper case letters, did not differ according to the Tukey’s test (p < 0.05), in relation to the soil use conditions and in the lines, in relation to irrigation depths applied.
Table 4. Means of the soil electrical conductivity (EC) for forage sorghum cultivation, for bare soil conditions (BS), natural cover (NC), coconut coir (CC), and moringa (MO) depending on the irrigation depths (60%, 80%, 100%, 120%, and 140% of ETc).
Start
ETc (%)
Soil Cover Condition6080100120140
BS6.606.606.786.416.62
NC6.106.106.486.416.68
CC6.365.835.736.596.28
MO6.676.196.526.056.94
Cycle 1
BS10.38 a A9.70 ab AB9.33 AB7.41 BC6.33 b C
NC6.99 b A7.24 b B8.18 B8.17 B11.91 a A
CC6.14 b7.02 b6.818.727.26 b
MO8.87 ab AB10.7 a AB8.04 AB7.71 B10.54 a A
Cycle 2
BS3.81 B4.82 AB6.93 a A4.41 B 3.48 B
NC4.213.924.15 b3.033.49
CC4.124.023.68 b3.563.71
MO2.67 B5.81 A4.92 ab AB4.01 AB5.04 AB
Cycle 3
BS4.67 ab AB3.65 b B6.12 a A4.28 AB3.47 B
NC5.29 a A4.26 a B3.95 b AB3.00 AB3.41 B
CC2.99 b3.92 ab3.73 b4.073.68
MO4.66 ab AB5.48 a A4.90 ab AB2.62 A3.42 BC
Mean values in the same columns followed by the same lowercase letters and on the lines, capital letters did not differ according to Tukey’s test (p < 0.05) in relation to the soil cover conditions and in the lines in relation to the applied irrigation depths.
Table 5. Spearman correlation matrix. Among soil electrical conductivity (EC), total organic carbon (TOC) and productivity (PRD), under different soil cover conditions, bare soil (BS), natural cover (NC), coconut coir (CC), and moringa (MO), for the following combinations: ECBS, ECNC, ECCC, ECMO, TOCBS, TOCNC, TOCCC, MOTMO, TOCMO, PRDBS, PRDNC, PRDCC, and PRDMO. The significance for the correlation coefficient is based on (p < 0.001 (***); p < 0.01 (**) and p < 0.05 (*)), for cycle 1 (light gray), 2 (gray) and 3 (dark grey).
ECNCECCCECMOTOCBSTOCNCTOCCCTOCMOPRDBSPRDNCPRDCCPRDMO
CEBS−0.2−0.10.1−0.6 *−0.2−0.5 *0.1−0.30.3−0.5 *−0.2
0.00.00.10.0−0.1−0.40.3−0.2−0.4−0.4 *−0.4
0.2−0.20.30.2−0.10.20.0−0.3−0.1−0.2−0.1
ECNC0.20.30.40.20.5 *−0.30.2−0.30.20.4
0.3−0.1−0.4−0.2−0.2−0.5*−0.3−0.40.2−0.1
0.10.5 *−0.10.2−0.1−0.5 *−0.4−0.5*−0.6 **−0.7 **
ECCC0.00.4−0.2−0.2−0.40.20.10.40.0
−0.1−0.40.0−0.3−0.30.10.10.5 *−0.1
−0.20.20.30.00.00.10.20.40.0
ECMO0.10.00.40.10.2−0.3−0.2−0.5
Cycle 1 0.10.00.40.10.2−0.3−0.2−0.5 *
Cycle 2 −0.20.10.10.1−0.9 ***−0.4−0.6*−0.5 *
Cycle 3 TOCBS0.00.30.00.1−0.10.20.3
0.30.00.10.5 *0.5*−0.10.1
0.3−0.20.10.4−0.20.2−0.2
TOCNC0.5 *0.5 *−0.1−0.20.1−0.1
0.00.30.10.30.00.1
0.10.10.2−0.10.2−0.3
TOCCC0.10.0−0.5*0.10.2
0.30.20.1−0.10.2
0.5 *−0.10.30.10.2
TOCMO−0.4 *−0.1−0.4−0.4
−0.1−0.3−0.7 ***0.1
0.00.20.30.2
PRDBS0.30.40.3
0.7***0.40.0
0.30.6 *0.4
PRDNC0.10.3
0.5 *0.4
0.8 ***0.9 ***
PRDCC0.4
0.1
0.8 ***
Publisher’s Note: MDPI stays neutral with regard to jurisdictional claims in published maps and institutional affiliations.

