Article

Spatial Pattern of Dissolved Nitrogen in the Water on Receiving Agricultural Drainage in the Sanhuanpao Wetland in China

1
College of Geographical Sciences, Changchun Normal University, Changchun 130032, China
2
College of Tourism and Geographical Science, Jilin Normal University, Siping 136000, China
3
Northeast Institute of Geography and Agroecology, Chinese Academy of Sciences, Changchun 130102, China
*
Author to whom correspondence should be addressed.
Water 2021, 13(19), 2683; https://doi.org/10.3390/w13192683
Submission received: 3 September 2021 / Revised: 23 September 2021 / Accepted: 23 September 2021 / Published: 28 September 2021

Abstract

:
The total nitrogen (TN) increases and the water quality deteriorates when a large amount of nitrogen-containing water is discharged from farmlands into wetlands. This research on the relationship between the TN, ammonia nitrogen (NH4-N), and nitrate nitrogen (NO3-N) concentrations in water has a certain reference significance for understanding the spatial pattern of nitrogen removal in wetlands. Taking the Sanhuanpao wetland in northeast China as the research object, 24 sampling plots in the study area were sampled in the spring and summer of 2017 to test the concentrations of TN, NH4-N, and NO3-N. Based on the calculations of the change rates of the TN, NH4-N, and NO3-N in spring and summer, a step-by-step elimination analysis was carried out and the spatial pattern of the TN, NH4-N, and NO3-N removals were revealed by gradual buffer extrapolations, combined with stepwise fitting functions. The results show that the removal capacity of NH4-N is strong within the range of 14.55 km–20 km and 26.93 km–35.96 km from the wetland inlet, and the removal capacity of NO3-N is relatively strong within the range of 26.93 km–35.96 km. The strong NH4-N and NO3-N removal areas in the wetland are not in the geometric center of the wetland, but in separate narrow areas around the center. The TN removal along water channel direction is only 0.25 times higher than that direction perpendicular to the channel, indicating that regardless of whether wetlands are expanded along the water channel or perpendicular to the water channel, the difference to the TN removal is small. Effectively monitoring and managing the reception of agricultural drainage is extremely important for maintaining the water-purification function of wetlands. The aim of the research is to reveal a spatial law of nitrogen removal in wetland water, and provide a framework for studying the mechanism of spatial difference of nitrogen.

1. Introduction

As a large number of wetlands have been reclaimed and are gradually being surrounded by farmland, the agricultural drainage is discharged into the wetlands, which increases the difficulty of fully removing the total nitrogen (TN) [1,2]. Research on the spatial relationship of ammonia nitrogen (NH4-N), nitrate nitrogen (NO3-N), and TN is important for studying the spatial patterns of the wetlands’ TN removal ability when receiving agricultural drainage [3,4,5]. Because the distances from the water inlet are different, the interior and edge areas also differ. Some ecological functions of wetlands, e.g., bird-breeding sites, are often in the interior of the wetlands, and are easily identified [6]. However, the main areas of water purification are very difficult to recognize with the naked eye in different parts of the wetland. The main TN-removal areas are very important for further analyses of the spatial pattern of wetland ecological functions [7].
The rapid increase of the TN concentration is closely related to the changing amounts of NH4-N and NO3-N in wetland water, with the agricultural return flow in the Wuliangsuhai wetland in China [8]. The water quality worsens in the disturbed areas of Chagan Lake, China, and the increased concentrations of NH4-N and NO3-N visibly increase the difference of the TN concentration in different parts in the Chagan Lake wetland, with the increased amount of farmland recession water [9]. In southwest China, there are nine different spatial types of NH4-N and NO3-N in the wetlands, resulting in the spatial differentiation of the TN, while the regressive water of farmlands flows into Erhai Lake, which has 10 rivers around it [10].
The absorption rates of NH4-N and NO3-N range from 0.004 to 1.42 μmol/L h in 16 sampling plots in different parts of the Chilika wetlands in India, which lead to significant differences in the TN concentrations [11]. In the black-soil distribution area of northeast China, the water quality is heterogeneous and the spatial differentiation of the TN concentration is significantly enhanced, as a result of the entry of NH4-N and NO3-N into the wetland [12]. Owing to the spatial changes of farmland distribution, there are differences in the inflow of farmland recession water into Petrola Lake, Spain. The NO3-N concentration ranges from 38.5 mg/L to 99.2 mg/L, and the change of spatial pattern of NO3-N removal causes the spatial differentiation of TN in different locations of the wetland [13].
The results of these studies indicate that the excess irrigation water from farmlands containing NH4-N and NO3-N change the spatial pattern of TN in wetland water [14,15,16]. However, studies on the spatial expression of this pattern are not sufficiently clear. Therefore, we use step-by-step elimination combined with a buffer analysis to reveal the spatial pattern of TN removal, related to NH4-N and NO3-N.
The main scientific problems to be solved in this study are as follows: (1) to reveal the spatial pattern of TN removal in the Sanhuanpao wetland; (2) to use step-by-step elimination and buffer analysis to analyze the spatial correlation between TN, NH4-N, and NO3-N removal; and (3) to seek the main areas of NH4-N and NO3-N removal by the changing results of function curves for the elimination correlation coefficient (ER) (NH4-N, NO3-N, and TN) and the buffer distance. We study the spatial matching relationship between NH4-N, NO3-N, and TN in the Sanhuanpao wetlands, reveal the spatial characteristics of TN removal, and provide a reference for research on the water-purification function of wetlands.

2. Materials and Methods
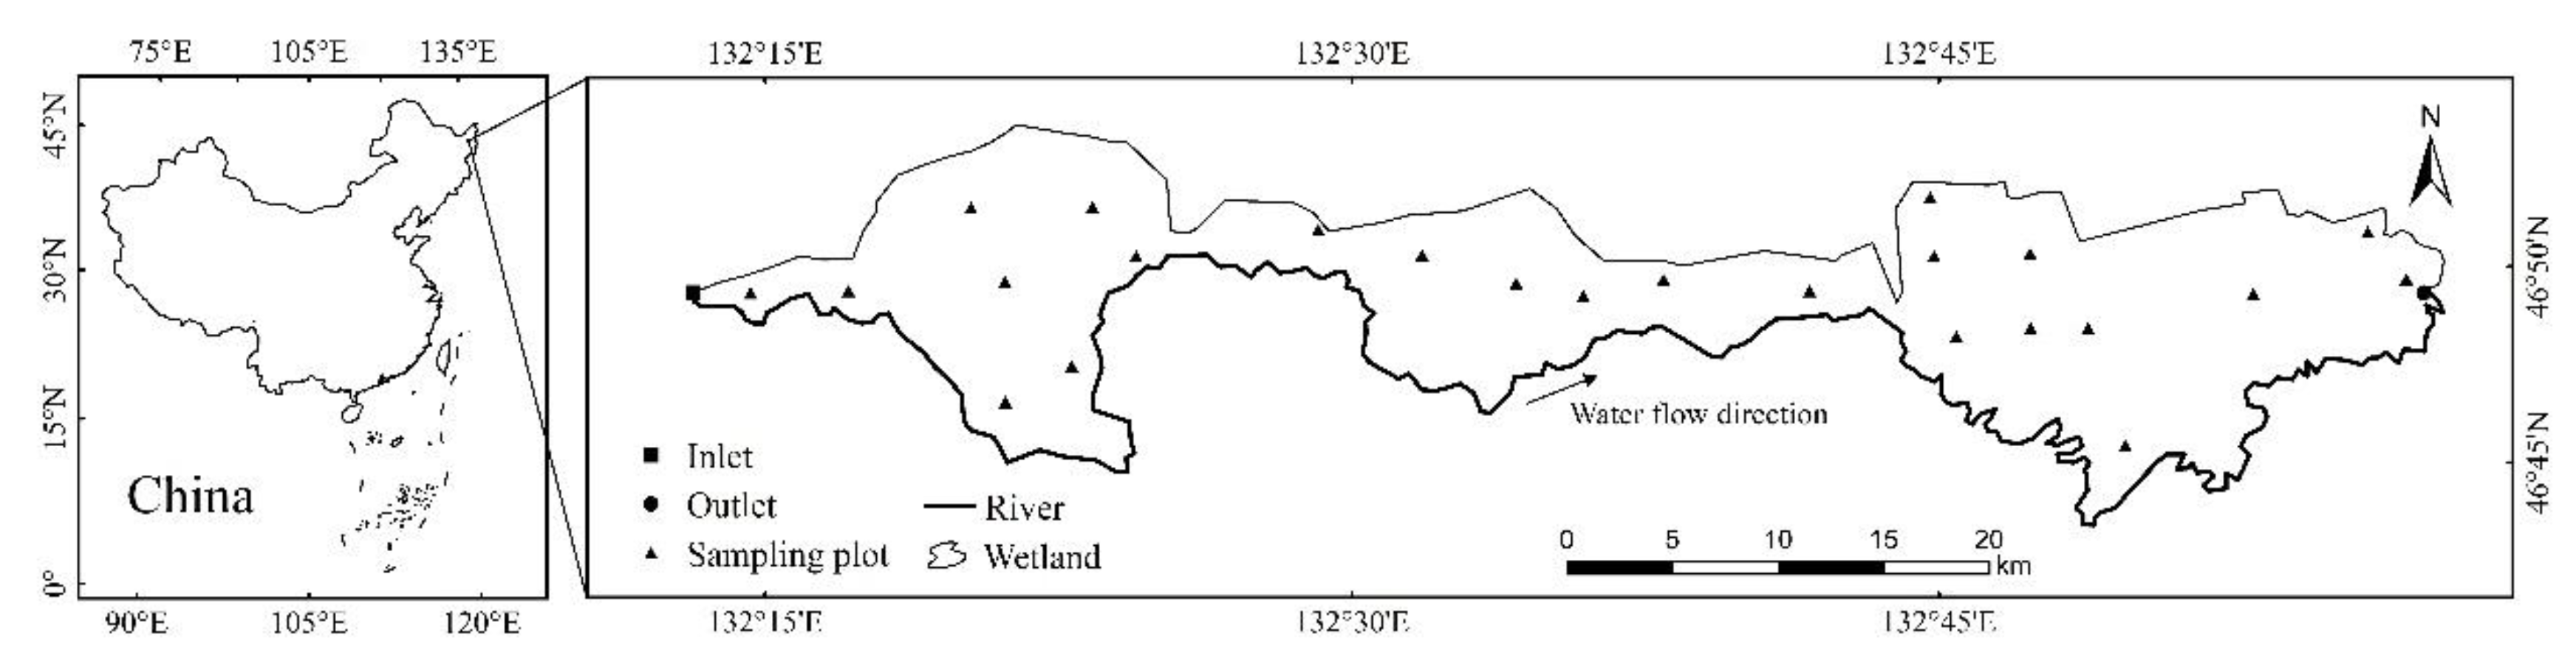
2.1. Study Area

The Sanhuanpao wetlands (132°12′–132°58′ E, 46°46′–46°52′ N) is located in the hinterland of Naoli river wetlands in the Sanjiang Plain, China, and are typical wetlands [17]. The Qixing river, the main tributary of Naoli river, flows through the whole wetland from west to east. The watershed is low and flat, and the surface runoff is not smooth, forming a large area of marsh wetlands [18]. The main channel of Qixing river is extended by 100 km, with an average annual runoff of 1.75 × 10⁸ m3 [19,20]. Due to the large area of wetland being reclaimed as farmland, it has become an important commodity grain base in China [21]. At present, the wetland area is only more than 30,000 ha. The low wetland receives a large amount of farmland recession water, while the wetland is gradually surrounded by farmland. The farmland recession water of Qixinghe in 2005 was 5.2 × 10⁷ m3, reaching 7.6 × 10⁷ m3 in 2018 [22]. The increase of farmland has resulted in an increase in the amount of chemical fertilizer and the annual use of nitrogen fertilizer reached 16.5 t/km2 in 2012 [23]. The concentration of TN in water increases rapidly, and appears spatial differentiation in the wetlands [24].

2.2. Water Sampling and Determination

From 12–18 May (spring) and 20–27 August (summer) in 2018, the water was sampled at 24 sampling plots, distributed as evenly as possible from upstream to downstream along the Sanhuanpao wetland. The sampling plots from upstream to downstream along the Qixing River were consecutively numbered from 1 to 24 (Figure 1, Table 1). At each sampling plot, the water in the wetlands was sampled three times; each time, 250 mL of water was sampled at the water surface (0.5 m) with a polyethylene sampling bottle that was previously cleaned with deionized water. A total of 72 samples were collected, and the samples were placed in a FYL-YS-50L type cooler (Fuyilian factory: Beijing, China) to maintain water quality [25].
The obtained samples were returned to the laboratory, and the TN concentration was measured using an alkaline potassium persulfate digestion-UV spectrophotometric method, the NH4-N concentration was measured using Nessler’s reagent colorimetry, and the NO3-N concentration was measured using phenol disulphonic acid spectrophotometry [26]. For each sampling plot, the average concentration of TN on the three samples were calculated as NH4-N and NO3-N (Table 1).

2.3. Remote-Sensing Interpretation

Mesoscale Landsat 8 Operational Land Imager (OLI) satellite-image data were selected as the main remote-sensing data. The imaging period was during August 2016, which coincided with the water-quality sampling period. At this time of year, the vegetation was vigorous, making it the best time to capture the vegetation coverage of the wetland. After geometric correction, the remote-sensing data were pre-processed, which included data importing, color synthesis of multi-band images (Utilities), image cropping (Subset), and geometric correction of the images. Next, the Gram–Schmidt pan-sharpening algorithm was used in the environment to enhance the spatial resolution of the multi-spectral bands. The spatial resolution was increased to 15 m. Other supplemental data include Advanced Spaceborne Thermal Emission and Reflection Radiometer Global Digital Elevation Model (Aster DEM) V2 data at a 30 m resolution and Normalized Difference Vegetation Index (NDVI) data.
The random-forest method was used as the classification method for object-oriented segmentation. It extracts data, based on the type and target weight, and integrates the terrain data, NDVI data, and remote-sensing data into raster datasets. It was used to classify the wetland vegetation community. The accuracy was tested by comparing the field-observation results of sample plots with the interpretation of corresponding indoor samples. The overall accuracy was 91%. Water had the highest accuracy of 100%, and forest land had the lowest overall classification accuracy of 80% (Table 2). This was mainly due to its close similarity to wetlands in terms of spectral and shape characteristics.

2.4. Data Analysis

2.4.1. The Calculation of Change Rate of TN, NH4-N and NO3-N in Spring and Summer of the Sampling Plots

The change rates of TN, NH4-N, and NO3-N in spring and summer were calculated for the same sampling plots, to analyze the spatial pattern of the TN-removal ability when receiving farmland-recession water. Because the wetlands did not receive farmland return water in the spring, it was assumed that the concentrations of TN, NH4-N, and NO3-N in the water were the base values in the wetlands.
The three wetland water indices changed after the wetlands received the farmland return water in the summer. Therefore, the concentration ratios of summer to spring of the three indices in the same sampling plot were used as the change rates of the three indices. The change rates of the three indices of 24 sampling points were calculated using the following three formulas.
TNCR = (TNSUM − TNSPR)/TNSPR
where TNCR was the change ratio of the TN concentration, TNSUM was the TN concentration in summer on a sampling plot, and TNSPR was the TN concentration in spring at the same sampling plot.
NH4-NCR = (NH4-NSUM − NH4-NSPR)/NH4-NSPR
where NH4-NCR was the change ratio of the NH4-N concentration, NH4-NSUM was the NH4-N concentration in summer on a sampling plot, and NH4-NSPR was the NH4-N concentration in spring at the same sampling plot.
NO3-NCR = (NO3-NSUM − NO3-NSPR)/NO3-NSPR
where NO3-NCR was the change ratio of the NO3-N concentration, NO3-NSUM was the NO3-N concentration in summer on a sampling plot, and NO3-NSPR was the NO3-N concentration in spring at the same sampling plot.

2.4.2. The Calculation of TNCR and the Other Two ERs for the TNCR and NH4-NCR, TNCR and NO3-NCR

We analyzed the significance of difference between the TNCR and NH4-NCR using Tukey’s HSD test of one-way analysis of variance (ANOVA), and the significance of difference between the TNCR and NO3-NCR. The correlation coefficient (R) was 0.40 between TNCR and NH4-NCR and 0.28 between TNCR and NO3-NCR, based on the change rates of the three indices in the spring and summer at 24 sampling points. The two Rs did not reach a significant level (p > 0.05). Then, a step-by-step elimination analysis was used for further calculation.
The data of the 24 sampling plots were eliminated in turn. The calculation process was as follows: we removed the data of No. 1, and calculated the R between TNCR and NH4-NCR from the second to the 24th sampling plots. Then, we replaced the data of No. 1 and removed the data of No. 2, and calculated the R between TNCR and NH4-NCR for the remaining 23 sampling points. The rest were done in the same manner. When all 24 Rs were calculated, the first round of calculations was completed.
The largest R was the elimination correlation coefficient (ER) of the worst sampling plot. Therefore, it was eliminated in the first round. Then, the second round of elimination was carried out, using the same method, and the remaining 23 sampling plots were screened in turn, with one sampling plot eliminated in each round. One sampling plot was left at the last round to complete the screening (Table 3). The step-by-step elimination analysis also used for NH4-NCR calculation was applied to the NO3-NCR. The ER was calculated between TNCR and NO3-NCR for each sampling plot (Table 3).

2.4.3. Spatial Interpolation and Area Calculation of Different Groups of TNCR and the Other Two ERs for the TNCR and NH4-NCR, TNCR and NO3-NCR

A Kriging interpolation was applied to the ArcGIS geographic information system to create three raster layers to cover the entire wetland. They were TNCR and the other two ERs for TNCR and NH4-NCR, TNCR and NO3-NCR. The mean errors of five layers were from 16 m to 21 m (Table 4), which were less than 30 m. In addition, the root-mean-square/average standard error (RMS/ASE) of the five raster layers were from 1.0375 to 1.0544 (Table 4). Therefore, the three layers can be used for our research.
The TNCRs were classified into the following four groups, based on the mean and 1STD of TNCR:
  • <mean − 1STD (TNCR = 2.76);
  • From mean − 1STD (TNCR = 2.76) to mean (TNCR = 3.85);
  • From mean (TNCR = 3.85) to mean +1STD (TNCR = 4.94); and
  • >mean + 1STD (TNCR = 4.94).
The spatial distribution of TN removal in the water of wetlands was analyzed according to the area of each type and its proportion to the total area. The ERs between TNCR and NH4-NCR were classified into the following three groups, based on the significance level of the ERs:
  • Positive correlation (0 to 0.60);
  • Significant positive correlation (0.60 to 0.77 (p < 0.05)); and
  • Extremely significant positive correlation (ER ≥ 0.77 (p < 0.01)).
The ERs between the TNCR and NO3-NCR were classified into the following three groups, based on the significance level of the ERs:
  • Positive correlation (0 to 0.60);
  • Significant positive correlation (0.60 to 0.76 (p < 0.05)); and
  • Extremely significant positive correlation (ER ≥ 0.76 (p < 0.01)).
The total area and percentage of area for each group were calculated to determine the relationship of NH4-N, NO3-N, and TN.

2.4.4. The Spatial Analysis of TNCR and the Other Two ERs for the TNCR and NH4-NCR, TNCR and NO3-NCR

The Sanhuanpao wetland is located north of water channel of the Qixing River. We used water channel as the starting line, and gradually buffer extrapolate wetland to the north, until the northernmost side of the wetland. Because the spatial resolution of the image was 30 m, the buffer used 30 m as the basic unit. That is, the first time, the water channel was used as the baseline to buffer 30 m northward. The next time, a line 30 m away from the north side of the water channel was used as the baseline, and the buffer zone was buffered 30 m northward again, and so on for 8 km (the northernmost side of the wetland) in three raster layers, including TNCR and the other two ERs for TNCR and NH4-NCR, TNCR and NO3-NCR, respectively.
In each buffer zone, the means and standard deviations (STDs) were calculated for TNCR and the two ERs of TNCR and NH4-NCR, TNCR and NO3-NCR. Then, the buffer-zone analysis was carried out from the western side to the eastern side of the wetlands (linear extension, 57 km from east to west in the wetland) with 30 m as the basic unit, using the same method as for channel extrapolation. The means and STDs of TNCR and the two ERs for TNCR and NH4-NCR, TNCR and NO3-NCR were calculated in each buffer zone.
Finally, the fitting functions were used to analyze the spatial pattern of the removal relationship among TNCR, NH4-NCR and NO3-NCR. The means and STDs of TNCR and the two ERs for TNCR and NH4-NCR, TNCR and NO3-NCR were the dependent variables, and the distance from the water channel (km) and the east-west length (km) of the wetland were the independent variables. Each function was fitted from the first to the sixth power, and the function with the largest added values of R2 (R2+) was selected for revealing the spatial pattern. There were 12 cases in total (Table 5), as follows:
The sixth power function was selected between the mean of TNCR and the distance from water channel (R2+: 0.2782) (Figure 2L);
The sixth power function between the STD of TNCR and the distance from the water channel (R2+: 0.1684) (Figure 2R);
The third power function between the mean of ER for TNCR and NH4-NCR and the distance from the water channel (R2+: 0.0698) (Figure 3L);
The third power function between the STD of ER for TNCR and NH4-NCR and the distance from the water channel (R2+: 0.1087) (Figure 3R); The sixth power function between the mean of ER for TNCR and NO3-NCR and the distance from the water channel (R2+: 0.2479) (Figure 4L); and
The sixth 6th power function between the STD of ER for TNCR and NO3-NCR and the distance from the water channel (R2+: 0.2379) (Figure 4R).
The sixth power function is selected between the mean of TNCR and the east-west length from the eastern side to the western side of the wetland (taking the water inlet as the starting line) (R2+: 0.2717) (Figure 5L);
The sixth power function between the STD of TNCR and the east–west length (R2+: 0.0481) (Figure 5R);
The sixth power function between the mean of ER for TNCR and NH4-NCR and the east–west length (R2+: 0.0412) (Figure 6L);
The fifth power function between the STD of ER for TNCR and NH4-NCR and the east–west length (R2+: 0.1087) (Figure 6R);
The fourth power function between the mean of ER for TNCR and NO3-NCR and the east–west length (R2+: 0.0894) (Figure 7L); and
The fourth power function between the STD of ER for TNCR and NO3-NCR and the east–west length (R2+: 0.0770) (Figure 7R).
The TN spatial changes of the water, caused by the spatial pattern of the NH4-N and NO3-N removals, were analyzed, according to the extreme values of the variation characteristics of the curves of these functions.

3. Results

3.1. Areas of Different Groups of TNCR and the Two ERs for TNCR and NH4-NCR, TNCR and NO3-NCR

3.1.1. The Area of Different Groups on TNCR

The mean of TNCR is 3.85, which is greater than 0, indicating that a large amount of nitrogen-containing water enters the wetland in the summer, and the wetland cannot effectively remove the TN from the water. The STD of TNCR is 1.09, and the difference is large in different parts in the wetland. The area of the third group is the largest (11,661 ha, 46.51%), followed by the second group (6480 ha, 25.84%) among four groups (Table 6). The results indicate that the TN could not be removed in almost any part of the wetland. The ratio is 27.65% on the total area of the first group (4143 ha, 16.52%) and the fourth group (2790 ha, 11.13%), which indicate that there is difference on the TN-removal ability in the different part in the wetland.

3.1.2. The Different Significant Areas of the Two ER for TNCR and NH4-NCR, TNCR and NO3-NCR

The area of the third group (ER > 0.77, p < 0.01) is 22,249 ha, accounting for 88.73% of the total area of the ER between TNCR and NH4-NCR (Table 6); the area of the third group (ER > 0.76, p < 0.01) is 23,574 ha, accounting for 94.01% of the total area of the ER between TNCR and NO3-NCR (Table 6). This indicates that a large amount of farmland-retreated water containing NH4-N and NO3-N enters the wetland, exceeding the wetland’s removal capacity and resulting in a rapid increase of the TN concentration in the water.
The area of the second group (0.60 < ER < 0.77, p < 0.05) is 1768 ha, accounting for 7.05% of the total area of the ER between TNCR and NH4-NCR (Table 6); the area of the second group (0.60 < ER < 0.77, p < 0.05) is 1768 ha, accounting for 7.05 % (Table 6) of the total area of the ER between TNCR and NO3-NCR (Table 6), indicating that the correlations for TNCR and NH4-NCR and NO3-NCR are slightly poor in some parts of the wetlands.
The area of the first group (ER < 0.60, p > 0.05) is 1058 ha, accounting for 4.22% of the total area of the ER between TNCR and NH4-NCR (Table 6); the area of the first group (ER < 0.60, p > 0.05) is 27 ha, accounting for 0.11% (Table 6), indicating that the correlations between TNCR and NH4-NCR and NO3-NCR are very poor in very few parts. In addition, the significant area of the ER between TNCR and NH4-NCR is smaller than that of the ER between TNCR and NO3-NCR, which indicates a certain difference in the wetland’s removal ability of NH4-N and NO3-N.

3.2. Change of Spatial Relationships of TNCR and the Two ERs for TNCR and NH4-NCR, TNCR and NO3-NCR during the Gradual Buffer Extrapolation from Water Channel

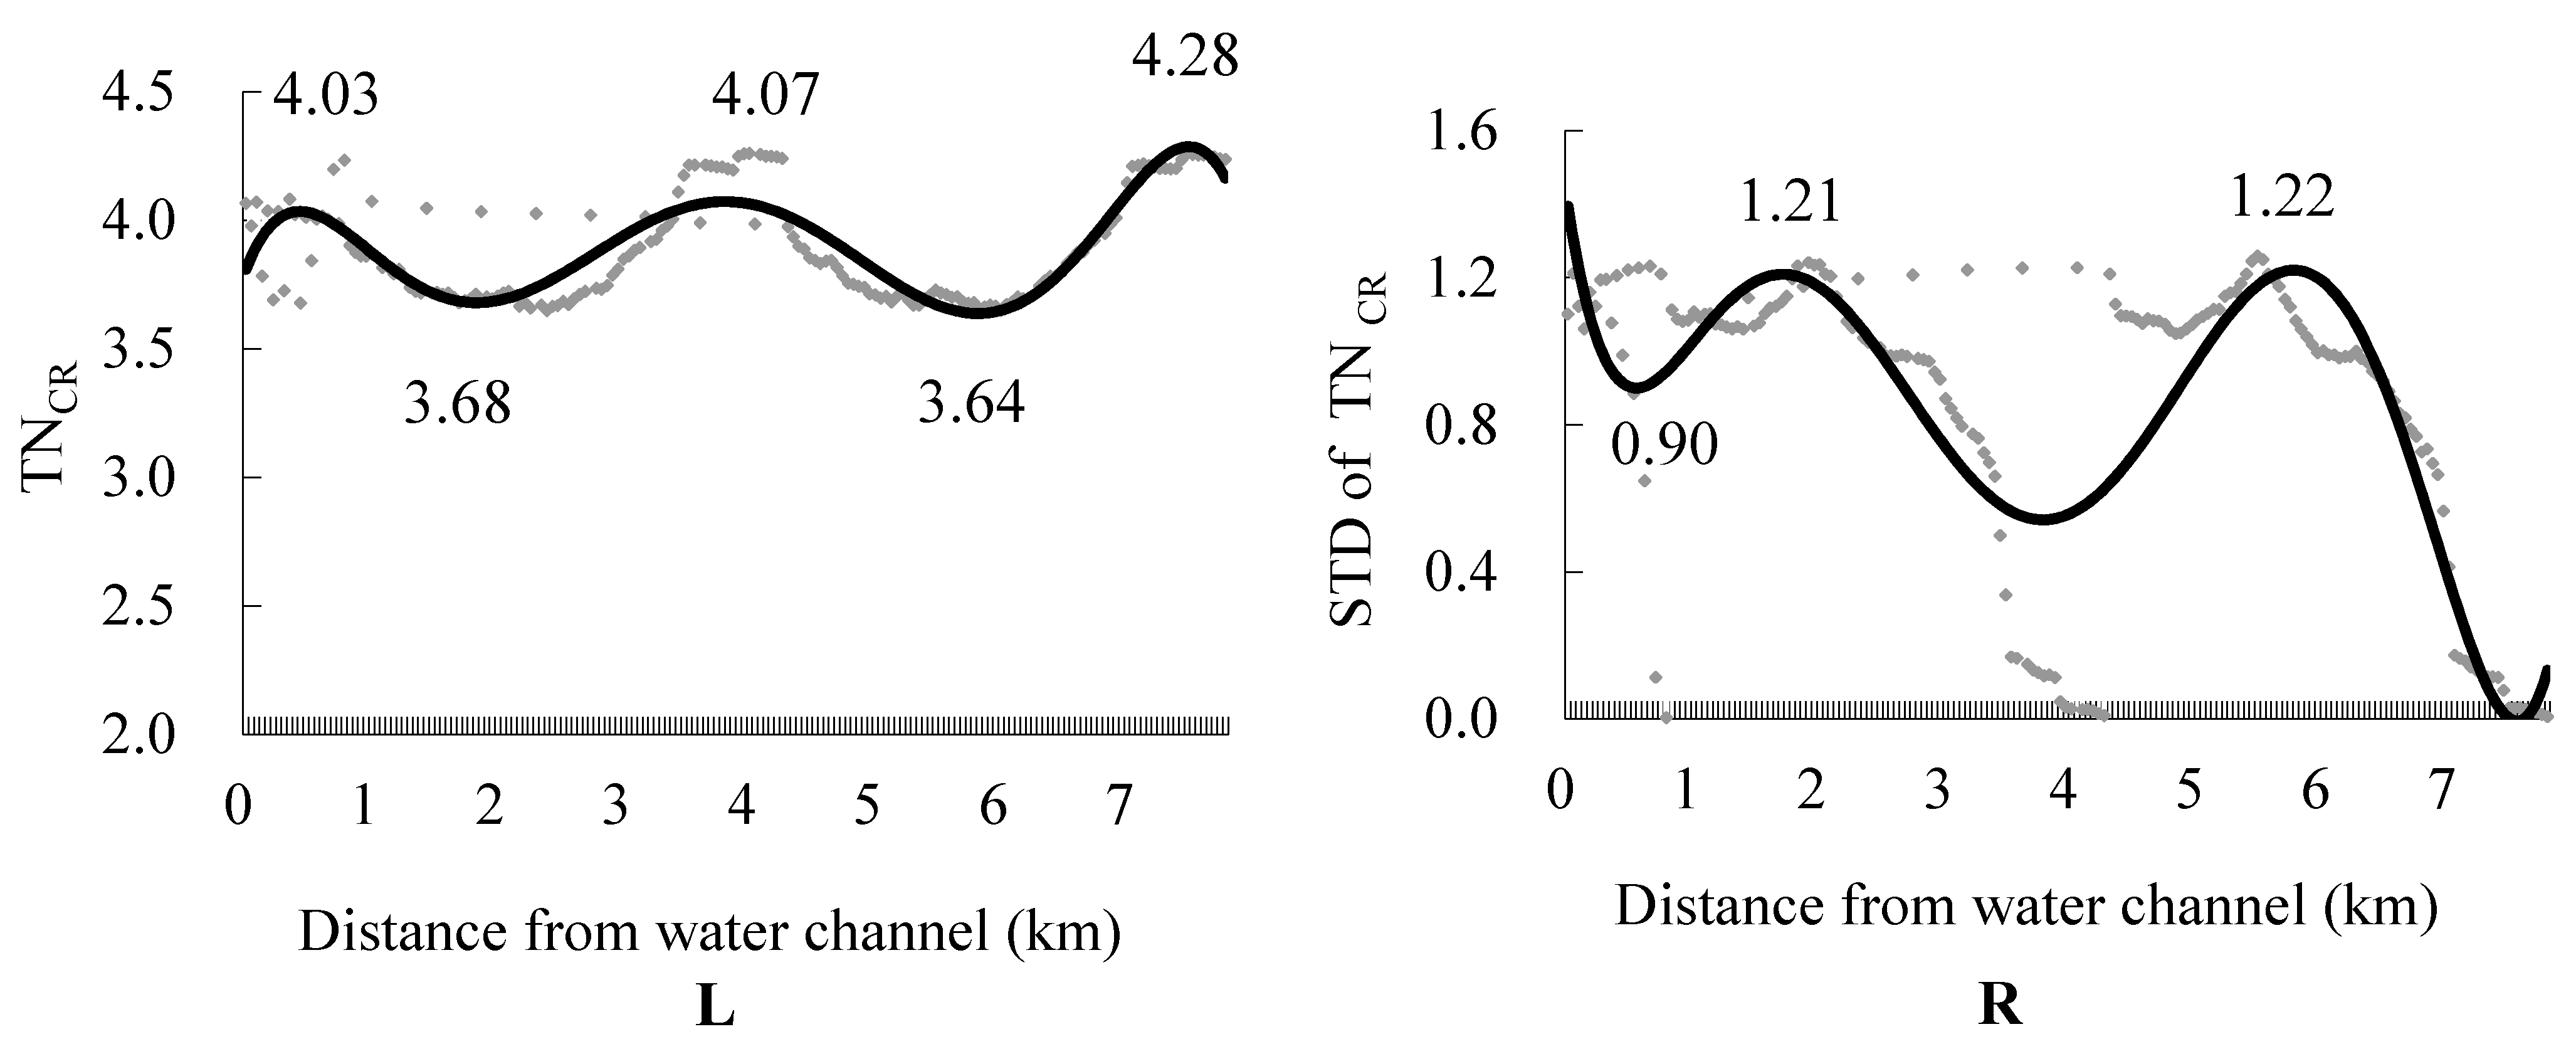
3.2.1. The Change of TNCR from Water Channel

The TNCR values gradually gather from the water channel to the center of the wetland (4 km from the channel), according to the dispersion degree of the mean of TNCR extrapolated from the water channel (Figure 2L), indicating that the TN in the water mainly enters the wetland from the water channel. The difference of TNCR gradually decreases from the water channel to the center of the wetland, which is close to the same in the center of the wetland. One maximum value of the fitting function of the mean of TNCR is located 0.44 km (maximum value: 4.03) from the water channel, and is adjacent to water channel (Figure 2L), indicating that the TN in the wetland water comes from agricultural drainage in the water channel. The other maximum value is located 3.87 km (maximum value: 4.07) from the water channel, indicating that the TN tends to gather towards the center of the wetland. The last maximum value is located 7.78 km (maximum value: 4.28) from the water channel, indicating that the TN concentrates near the edge of the wetland.
The minimum values of TNCR are located 1.91 km (minimum value: 3.68) and 6 km (minimum value: 3.64) from the water channel (Figure 2L), indicating that the minimum parts of TNCR are not in the center of the wetland, but in the surrounding parts near the center. The dispersion degree of the STD of TNCR is the largest in the center of the wetland (4 km from the channel). According to the dispersion degree of the STD of TNCR, it is extrapolated gradually from the water channel, which indicates that the difference of TNCR is the largest in the center of the wetland.
The maximum values of the fitting function of the STD of TNCR are located 1.78 km (maximum value: 1.21) and 5.91 km (maximum value: 1.22) from water channel (Figure 2R), indicating that the difference of TNCR is the largest in the part with the largest TNCR. The minimum values are located 0.62 km (minimum value: 0.90), 4 km (minimum value: 0.54), and 7.78 km (minimum value: 0) from water channel (Figure 2R), indicating that the differences of TNCR are the smallest at the edge and center of the wetland and near the water channel.

3.2.2. The Change of the ER between TNCR and NH4-NCR from Water Channel

The ERs gradually gather between TNCR and NH4-NCR from the channel to the wetland center (4 km from the water channel), according to the dispersion degree of the means of the ERs extrapolated from the water channel (Figure 3L). This indicates that the NH4-N in water mainly enters the wetland from the water channel, and the difference of the NH4-N removal gradually decreases from the water channel to the wetland center. The maximum values are located 3.42 km (maximum value: 0.92) and 8 km (maximum value: 0.96) from the water channel, indicating that the weak NH4-N-removal ability leads to the increase of TN concentration in the center and edge of the wetland. The minimum value is located 5.07 km (minimum value: 0.91) from the water channel, which indicates that the strong NH4-N-removal ability reduces the TN concentration in the parts around the wetland center.
The difference between the maximum value (0.96) and the minimum value (0.91) is 0.05 (Figure 3L), and all ERs are greater than 0.77 (p < 0.01) (Figure 3L). These indicate that the NH4-N cannot be fully removed in almost all parts, resulting in an increase of TN concentration throughout the entire wetland. The function curve of the STD of the ERs fluctuates very little between 3.93 km and 4.98 km from the water channel (Figure 3R), which indicates that NH4-N-removal ability is very similar, within the range of the wetland. The lowest values of the STDs of the ERs are located in the center and edge of the wetland, according to the change of dispersion degree (Figure 3R). This indicates that the difference is small in the part with weak NH4-N-removal ability. The maximum value is 4.48 km from the water channel, which indicates that the difference is large in the part with the strong NH4-N-removal ability.

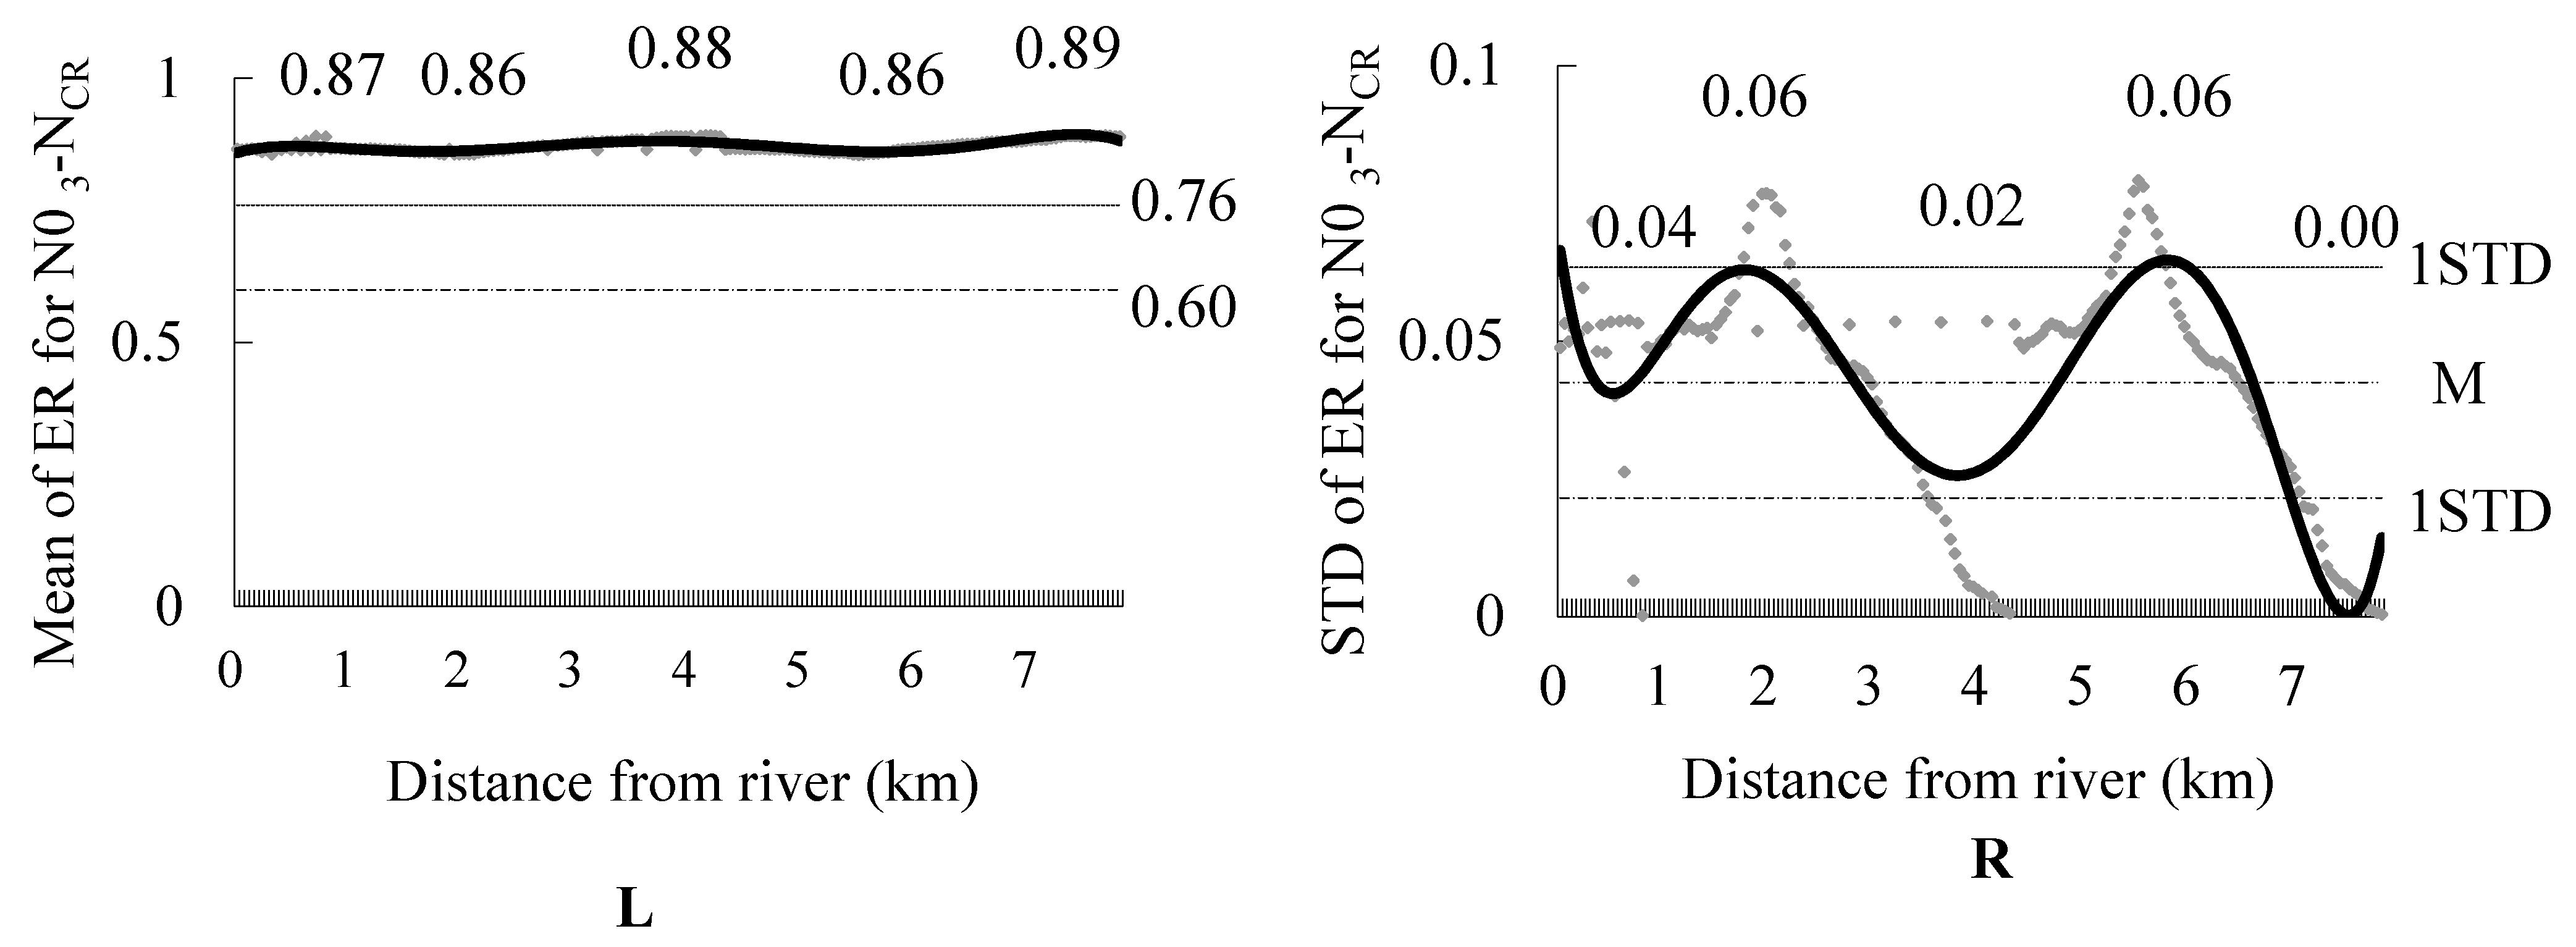
3.2.3. The Change of the ER between TNCR and NO3-NCR from Water Channel

The maximum values of the means of the ERs of the fitting function are located 0.53 km (maximum value: 0.87), 3.82 km (maximum value: 0.88), and 7.60 km (maximum value: 0.89) from the water channel (Figure 4L), indicating that NO3-N tends to accumulate in the center and edge of the wetland and near water channel. The minimum values are 1.73 km (minimum: 0.86) and 5.87 km (minimum: 0.86) from the water channel (Figure 4L), indicating that the part near the center of the wetland has a strong NO3-N-removal ability. The difference between the maximum value (0.89) and the minimum value (0.86) is 0.03, and all the ERs are greater than 0.77 (p < 0.01) (Figure 4L), indicating that the insufficient removal of NO3-N in almost all parts of the wetland is an important factor leading to the increase of TN concentration in the water.
The maximum values of the STD of the ER of the fitting function are 1.82 km (maximum: 0.06) and 5.96 km (maximum: 0.06) from the water channel (Figure 4R), indicating that the difference of the NO3-N-removal ability is strong near the wetland center. The minimum values are 0.58 km (minimum: 0.04), 3.91 km (minimum: 0.02), and 7.69 km (minimum: 0.00) from the water channel (Figure 4R). The downward trend is very obvious in the wetland center, according to the change of the dispersion degree (Figure 4R). This indicates that the difference of the NO3-N-removal ability is small in the parts of NO3-N accumulation at the edge and center of the wetland.

3.3. Change of Spatial Relationships of TNCR and Two ERs for TNCR and NH4-NCR, TNCR and NO3-NCR with Gradual Buffer Extrapolation from the Water Inlet

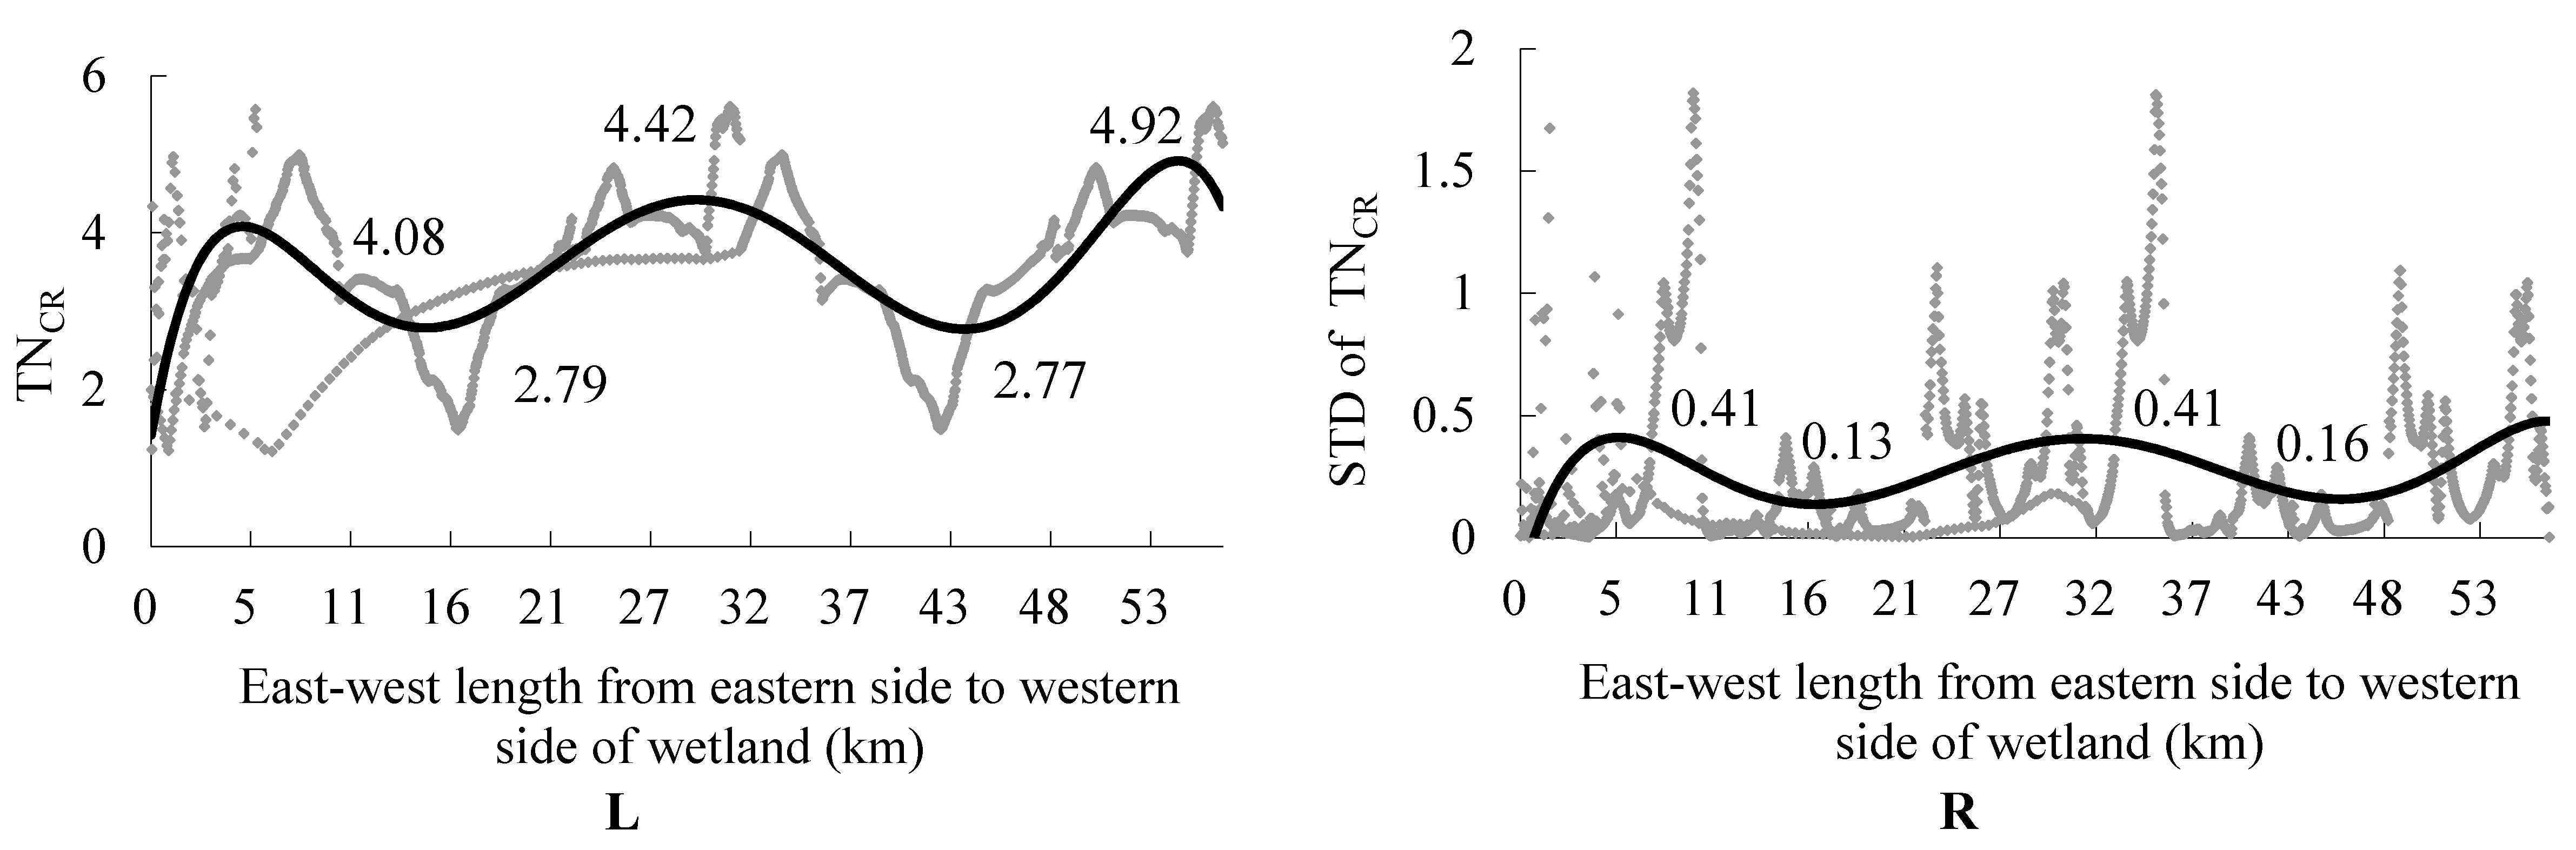
3.3.1. The Change of TNCR from the Water Inlet

The TNCR values gradually gather from the water inlet to the center of the wetland (30 km from the water inlet), according to the dispersion degree of the mean of TNCR extrapolated from the water inlet (Figure 5L). This indicates that the TN in the water mainly flows into the wetland with the river water from the upstream farmland, and the difference in TNCR tends to be consistent from the water inlet to the wetland center.
The maximum values are located 4.97 km (maximum value: 4.08), 29.23 km (maximum value: 4.42), and 54.82 km (maximum value: 4.92) from the water inlet (Figure 5L). This indicates that the TN accumulates at the inlet, outlet, and wetland center. The minimum values are located 14.63 km (minimum value: 2.79) and 43.36 km (minimum value: 2.77) from the water inlet (Figure 5L), indicating that the TNCR is the lowest around the center. The maximum values of the STD of the TNCR of the fitting function are located 5.46 km (maximum value: 0.41) and 31.25 km (maximum value: 0.41) from the water inlet (Figure 5R), indicating a large difference in the TN collection parts. The minimum values are located 16.16 km (minimum value: 0.14) and 45.77 km (minimum value: 0.16) from the water inlet (Figure 5R), indicating a small difference in the low TNCR value part.

3.3.2. The Change of the ER between TNCR and NH4-NCR from the Water Inlet

The means of the ERs gradually gather between TNCR and NH4-NCR from the water inlet to 5 km from the water inlet, according to the dispersion degree of the means of the ERs (Figure 6L). This indicates that the difference of NH4-NCR gradually decreases with the river water entering the wetland for a short distance. The maximum values are located 3.14 km (maximum value: 0.94), 27.68 km (maximum value: 0.90), and 52.79 km (maximum value: 0.92) from the water inlet, indicating that the NH4-N accumulates at the inlet, outlet, and wetland center, and that it cannot be fully removed, resulting in the TN increase. The minimum values are located 14.55 km (minimum value: 0.84) and 41.84 km (minimum value: 0.83) from the water inlet (Figure 6L), indicating that the parts around the center have a strong NH4-N-removal ability.
The means of the ERs are less than 0.60 (p < 0.05) in the range of 18 km–20 km and 43 km–45 km (Figure 6L), indicating that this area accounts for the strongest NH4-N removal. The maximum values of the STD of the ERs are located 6.78 km (maximum value: 0.04) and 35.56 km (maximum value: 0.04) from the water inlet (Figure 6R), indicating great differences in the water inlet and the wetland center. The minimum values are located 19.41 km (minimum value: 0.02) and 49.88 km (minimum value: 0.01) from the water inlet (Figure 6R), indicating that the difference of the ERs between TNCR and NH4-NCR is small around the center.
According to the above analysis, there are two strong NH4-N-removal parts in the wetland. One is 4.48–5.07 km from the water channel and 14.55–20 km from the wetland water inlet. The other is 4.48–5.07 km from water channel and 41.84–45 km from the wetland water inlet. The total area of the two parts is about 508 ha, accounting for 2.03% of the total wetland area. The distance between the two parts is 21.84 km, discontinuous. However, there is no significant difference in NH4-N removal between the two parts and the other parts in the entire wetland.

3.3.3. The Change of the ER between TNCR and NO3-NCR from the Water Inlet

The means of the ERs gradually gather between TNCR and NO3-NCR from the water inlet to 16 km from the water inlet, according to the dispersion degree of the means of the ERs (Figure 7L). This indicates that the difference of the NO3-NCR gradually decreased with the river water entering the wetland to one-third of the east–west linear distance of the wetland. The maximum values are located 11.78 km (maximum value: 0.88) and 45.10 km (maximum value: 0.89) from the water inlet, and the minimum value is 26.93 km from the water inlet (minimum value: 0.86) (Figure 7L), which indicates that the parts around the center have a strong NO3-NCR-removal ability. The difference between the maximum value (0.89) and the minimum value (0.86) is 0.03, and the ERs are greater than 0.60 (Figure 7L). These indicate that the difference of the NO3-N removal is small in the entire wetland, and that the insufficient NO3-N removal is the main factor leading to the increase in the TN concentration in the water.
The maximum values of the STD of the ERs between TNCR and NO3-NCR are located 6.85 km (maximum value: 0.02) and 35.96 km (maximum value: 0.02) from the water inlet (Figure 7R), indicating that the difference of the NO3-N-removal ability is large in the water inlet and the wetland center. The minimum values are located 19.89 km (minimum: 0.01) and 50.31 km (minimum: 0.01) from the water inlet (Figure 7R), indicating that the difference of the NO3-N-removal ability is very small in and around the center. The difference between the maximum (0.02) and minimum (0.01) is only 0.01 (Figure 7R), indicating that the difference of the NO3-N-removal ability is small in the entire wetland.
According to the above analysis, there are two strong NO3-N-removal parts in the wetland. One is 1.73–1.82 km from the water channel and 26.93–35.96 km from the wetland water inlet, and the other is 5.87–5.96 km from the water channel and 26.93–35.96 km from the wetland water inlet. The total area of the two parts is about 163 ha, accounting for 0.65% of the total wetland area. The distance between the two parts is 4.05 km, which is discontinuous, but very close. However, there is no significant difference in NO3-N removal between the two parts and the other parts in the entire wetland.

4. Discussion

4.1. Functional Maintenance of TN Removal in Wetland Water

The TNCR of the entire wetland is greater than 0, indicating that the wetland cannot remove the excess TN from the water in all parts. According to the different significant parts of the two ERs for TNCR and NH4-NCR, TNCR and NO3-NCR, a large amount of NH4-N and NO3-N in the farmland return water cannot be fully removed, along with the flow spreading in the entire wetland, resulting in a large increase of TN. Therefore, the wetland can only continue to discharge downstream the wastewater containing excess TN.
This result is similar to the phenomenon in the Caohai wetland, China, in which the TN removal ability decreases and the water quality deteriorates rapidly with the excessive inflow of nitrogen-containing water from the farmlands [27]. Similarly, the research conclusion is consistent with that in the Limia River basin of Spain: even if the TN concentration in the backwater is low, the water quality around the input point becomes worse [28]. In addition, in the Chaohu wetland, the more nitrogen-containing recession water enters, the higher the TN concentration, and the more difficult the TN removal is, the worse the water quality. Therefore, the increase of nitrogen-containing recession water is the main factor that reduces the TN-removal ability of the wetland [29].
Therefore, it is necessary to establish a mechanism for monitoring the wetland water quality to ensure that the TN in the water is within the wetland’s removal ability. The mechanism should monitor whether the removal function is beyond the bearing range, and will harm the wetland purification function. It is important to establish a pretreatment and rejection mechanism for farmland return water. Protecting wetlands not only involves protecting them from being developed into other land, but also monitoring and protecting their ecological functions, especially the functions that are not easy to visibly identify.

4.2. Deviation from the Geometric Center for Strong NH4-N and NO3-N Removal Areas in Wetlands

The parts with strong NH4-N and NO3-N-removal abilities are not in the geometric center of the wetland. This matches the conclusion that the part with the highest TN removal rate in the Beijing Hanshiqiao wetland is not the geometric center of the wetland; rather, it is the eastern part of the wetland, with higher terrain, faster water flow, and good vegetation growth [30]. The results show that the different ecological functions of wetlands are not concentrated in the same area. For example, the central part of the Baiyangdian wetland, China, is the main part for maintaining the biodiversity function, while the key area for water purification is located in the west of the wetland [31].
In addition, no strong spatial linkage is found between water richness and habitat suitability. Water richness is not a substitute for a suitable wetland habitat in a deltaic environment [32]. However, the parts with strong nitrogen removal decreased with the excessive inputs of NH4-N and NO3-N. The parts with strong NH4-N and NO3-N removal account for 2.03% and 0.65% of the total wetland area, respectively, and are divided into two independent parts with a fragmentation trend. They are not in the center of the wetland. The parts with strong NO3-N removal ability are smaller than those with NH4-N removal and are closer to the wetland center. The results show that the stronger the external disturbance, the more the different ecological functions converge to the geometric center of the wetland. Many wetland functions would disappear simultaneously if the central area received huge losses.

4.3. The Extension Direction of Wetland

Farmland has been converted to wetlands in accordance with the gradual deepening of people’s understanding of the ecological functions of wetlands [33]. It is very important to expand the wetland in the correct direction. Assuming that both the TN-removal ability of the wetland and the TN content entering the wetland are constant, the wetland needs to expand 2.87 times its original area along the direction perpendicular to the water channel, if the TN concentration is to reach the original wetland background value. This is based on the calculation result of the integral curve of the fitting function for the mean of TNCR and the distance of the water channel. In addition, the wetland needs to expand 2.62 times along the direction of the water channel, based on the calculation result of the integral curve of the fitting function for the mean of TNCR and the distance of the water inlet. Therefore, the most favorable direction of wetland restoration for TN removal is to expand upstream and downstream along the water channel.
Similar results were found during the wetland restoration of the Flumen River watershed in Spain. The removal capacity on NO3-N along the water channel is stronger than that in other directions [34]. However, The TN removal along water channel direction is only 0.25 times higher than that perpendicular to the channel direction in Sanhuanpao wetland, indicating that no matter which direction the wetland is restored, it is similar on the capacity of TN-removal. In the northern USA and Canada, the result is the same because only weak differences are found for the nutrient removal/retention capability, regardless of what manner or in what direction the wetlands are restored [35]. Therefore, regarding which direction to expand to maximize the ecological functions of a wetland, the TN-removal function may not be given priority for returning farmland to wetland.

5. Conclusions

The TNCR has a close spatial correlation with NH4-NCR and NO3-NCR in water of the Sanhuanpao wetland while the wetland contains a large amount of farmland nitrogen-containing water. The mean of TNCR is 3.85 (>0) and the area of the third group (mean + 1STD) is the largest (11,661 ha, 46.51%), indicating that the wetland cannot remove the excess TN in the water in the summer; so do significant ER correlations between TNCR and NO3-NCR when the area of the third group (ER > 0.77, p < 0.01) is 22,249 ha, accounting for 88.73% of the total area of the ER between TNCR and NH4-NCR, and the area of the third group (ER > 0.76, p < 0.01) is 23,574 ha, accounting for 94.01% of the total area of the ER between TNCR and NO3-NCR. The wetland cannot sufficiently remove the NH4-N and NO3-N, resulting in an increase of TN. One part with strong NH4-N-removal is 4.48–5.07 km from the water channel and 14.55–20 km from the wetland water inlet. The other is 4.48–5.07 km from the water channel and 41.84–45 km from the wetland water inlet. One part with strong NO3-N-removal is 1.73–1.82 km from water channel and 26.93–35.96 km from the wetland water inlet, and the other is 5.87–5.96 km from the water channel and 26.93–35.96 km from the wetland water inlet. The results show that the parts with strong NH4-N and NO3-N-removal capability are not in the geometric center of the wetland, but are in two separate narrow parts around the center.
It is very important to establish the necessary preventive measures to maintain the water-purification function of the wetland. The wetland needs to expand 2.87 times its original area along the direction perpendicular to water channel and 2.62 times along the direction of water channel, if the TN concentration is to reach the original wetland background value. The TN removal along the water channel direction is only 0.25 times higher than that perpendicular to the channel direction. No matter which direction is increased in the wetland area, it does not affect the TN removal by a significant difference.

Author Contributions

Conceptualization, M.J. and X.W.; Investigation, L.C.; Writing-Original Draft Preparation, X.W. and Y.S.; Writing-Review and Editing, G.W.; Supervision, M.J. All authors have read and agreed to the published version of the manuscript.

Funding

This research was funded by the National Key Research and Development Program of China (2018YFD1100101), the National Natural Science Foundation of China (41877075, 41601263, 41771120 and 41771106), the Technology Development Program of Jilin Province (20190201018JC), Science and Technology Development Plan Project of Jilin Province(20200201207JC), Key Laboratory Project on the Technology Development Program of Jilin Province (202002047JC), Planning project of Jilin Provincial Department of Education (JJKH20210459KJ) and Natural Science Foundation of Changchun Normal University (2016-009).

Acknowledgments

The authors express gratitude to the reviewers and editors for their critical comments on an earlier version of the manuscript.

Conflicts of Interest

The authors declare no conflict of interest.

References

  1. Nepomuscene, N.J.; Jewitt, G.; Graham, M. Effects of land use and land cover changes on water quality in the uMngeni river catchment, South Africa. Phys. Chem. Earth. Parts A/B/C 2018, 105, 247–264. [Google Scholar] [CrossRef]
  2. Zheng, Y.L.; Wang, B.; Elise, W.A.; Chen, J.J.; He, F.; Chen, H.; Gao, B. Reclaiming phosphorus from secondary treated municipal wastewater with engineered biochar. Chem. Eng. J. 2019, 362, 460–468. [Google Scholar] [CrossRef]
  3. Janssen, A.B.G.; Van Wijk, D.; Van Gerven, L.P.A.; Bakker, E.S.; Brederveld, R.J.; Deangelis, D.L.; Janse, J.H.; Mooij, W.M. Success of lake restoration depends on spatial aspects of nutrient loading and hydrology. Sci. Total Environ. 2019, 679, 248–259. [Google Scholar] [CrossRef] [PubMed]
  4. Lin, C.; Huang, C.C.; Ma, R.H.; Ma, Y.X. Can the watershed non-point source phosphorus flux amount be reflected by lake sediment? Ecol. Indic. 2019, 102, 118–130. [Google Scholar] [CrossRef]
  5. Lu, S.B.; Gao, X.R.; Wu, P.T.; Li, W.; Bai, X.; Sun, M.; Wang, A. Assessment of the treatment of domestic sewage by a vertical-flow artificial wetland at different operating water levels. J. Clean. Prod. 2019, 208, 649–655. [Google Scholar] [CrossRef]
  6. Delphey, P.J.; Dinsmore, J.J. Breeding bird communities of recently restored and natural prairie potholes. Wetlands 1993, 13, 200–206. [Google Scholar] [CrossRef]
  7. Spangler, J.T.; Sample, D.J.; Fox, L.J.; Owen, J.S.; White, S.A. Data on floating treatment wetland aided nutrient removal from agricultural runoff using two wetland species. Data Brief 2019, 22, 756–761. [Google Scholar] [CrossRef]
  8. Fan, Y.Y.; Li, X.; Chun, X. Research progress of eutrophication in Wuliangsuhai sea. Environ. Prot. Sci. 2018, 44, 83–88. (In Chinese) [Google Scholar] [CrossRef]
  9. Sun, L.X.; Lin, S.S. Evaluation on impact of farmland withdrawal water on water quality of Chagan Lake based on WASP model. Water Resour. Prot. 2018, 34, 88–94. (In Chinese) [Google Scholar] [CrossRef]
  10. Lu, S.Y.; Zhang, W.T.; Xing, Y. Nitrogen evolution with distance of 10 inflow rivers in the three circles of buffer zone around Erhai Lake. China Environ. Sci. 2016, 36, 1561–1567. (In Chinese) [Google Scholar]
  11. Mukherjee, R.; Kumar, S.; Muduli, P.R. Spatial variation of nitrogen uptake rates in the largest brackish water lagoon of Asia (Chilika, India). Estuar. Coast Shelf Sci. 2019, 216, 87–97. [Google Scholar] [CrossRef]
  12. Sui, Y.Y.; Ou, Y.; Yan, B.X.; Rousseau, A.N.; Fang, Y.T.; Geng, R.Z.; Wang, L.X.; Ye, N. A dual isotopic framework for identifying nitrate sources in surface runoff in a small agricultural watershed, northeast China. J. Clean. Prod. 2019, 246, 1–9. [Google Scholar] [CrossRef]
  13. Valiente, N.; Carrey, R.; Otero, N.; Soler, A.; Sanz, D.; Munoz-Martin, A.; Jirsa, F.; Wanek, W.; Gómez-Alday, J.J. A multi-isotopic approach to investigate the influence of land use on nitrate removal in a highly saline lake-aquifer system. Sci. Total Environ. 2018, 631–632, 649–659. [Google Scholar] [CrossRef] [PubMed]
  14. Sigler, W.A.; Ewing, S.A.; Jones, C.A.; Payn, R.A.; Brookshire, E.N.J.; Jane, K.K.; Jackson-Smith, D.; Weissmann, G.S. Connections among soil, ground, and surface water chemistries characterize nitrogen loss from an agricultural landscape in the upper Missouri River Basin. J. Hydrol. 2018, 556, 247–261. [Google Scholar] [CrossRef] [Green Version]
  15. Chen, R.H.; Mo, D.Q.; Li, J.C.; Deng, Z.Q.; Qin, W.H.; Qin, J.H. Huixian Karst wetland water quality monitoring. Shandong Chem. Ind. 2018, 47, 156–160. (In Chinese) [Google Scholar] [CrossRef]
  16. Naranjo, R.C.; Niswonger, R.G.; Smith, D.; Rosenberry, D.; Chandra, S. Linkages between hydrology and seasonal variations of nutrients and periphyton in a large oligotrophic subalpine lake. J. Hydrol. 2019, 568, 877–890. [Google Scholar] [CrossRef]
  17. Liu, Z.M.; Jiang, M.; Tong, S.Z. Hydrological function of Sanhuanpao flood detention zone. Wetl. Sci. 2008, 6, 242–248. (In Chinese) [Google Scholar] [CrossRef]
  18. Xing, Z.X.; Wang, Y.N.; Ji, Y.; Fu, Q.; Li, H.; Qu, R.Z. Health assessment and spatial variability analysis of the Naolihe basin using a water-based system. Ecol. Indic. 2018, 92, 181–188. [Google Scholar] [CrossRef]
  19. Cui, B.S.; Liu, X.T. An analysis on ecological character changes of wetlands of Naolihe drainage basin in the Sanjiang plain. J. Nat. Resour. 2001, 16, 107–114. (In Chinese) [Google Scholar]
  20. Ma, C.X.; Yin, Z.L.; Yu, H.X. Seasonal dynamics characteristics and physical factors of phytoplankton functional groups in Sanhuanpao wetland. J. Northeast For. Univ. 2016, 44, 45–51. (In Chinese) [Google Scholar] [CrossRef]
  21. Yao, Y.L.; Yu, H.X.; Lu, X.G.; Wang, L. The impacts of wetland cultivation on the regional temperature based on remote sensing—A case study in Naoli watershed of Sanjiang plain, northeast China. Phys. Procedia 2011, 22, 622–626. [Google Scholar] [CrossRef] [Green Version]
  22. Ouyang, W.; Yang, W.X.; Tysklind, M.; Xu, Y.X.; Lin, C.Y.; Gao, X.; Hao, Z.C. Using river sediments to analyze the driving force difference for nonpoint source pollution dynamics between two scales of watersheds. Water Res. 2018, 139, 311–320. [Google Scholar] [CrossRef] [PubMed]
  23. Gu, F.X.; Huang, M.; Zhang, Y.D.; Li, J.; Yan, H.M.; Guo, R.; Zhong, X.L. Modeling the effect of nitrogen input on soil carbon storage in Northeast China. Acta Ecol. Sin. 2016, 36, 5379–5390. (In Chinese) [Google Scholar] [CrossRef]
  24. An, R.; Wang, F.Y.; Yu, H.X.; Ma, C.X. Seasonal dynamics of zooplankton functional groups and their relationships with environmental factors in the sanhuanpao wetland reserve. Acta Ecol. Sin. 2017, 37, 1851–1860. (In Chinese) [Google Scholar] [CrossRef] [Green Version]
  25. Xu, Z.G.; Cai, Y.H.; Fan, G.F.; Liu, X.S.; Dai, Y. Application of atractylodes macrocephala koidz extract in methicillin—Resistant staphylococcus aureus. Procedia Eng. 2017, 174, 410–415. [Google Scholar] [CrossRef]
  26. Li, B.X.; Chen, J.F.; Wu, Z.; Wu, S.F.; Xie, S.G.; Liu, Y. Seasonal and spatial dynamics of denitrification rate and denitrifier community in constructed wetland treating polluted river water. Int. Biodeter. Biodegr. 2018, 126, 143–151. [Google Scholar] [CrossRef]
  27. Xia, P.H.; Xue, F.; Kong, X.L.; Liu, Y.; Lin, T. Spatial characteristics and impact of water quality in agricultural dicth systems of Caohai wetland in the Guizhou plateau, China. Environ. Chem. 2012, 31, 1201–1207. (In Chinese) [Google Scholar]
  28. Garzon-Vidueira, R.; Rial-Otero, R.; Garcia-Nocelo, M.L.; Rivas-Gonzalez, E.; Moure-Gonzalez, D.; Fompedrina-Roca, D.; Vadillo-Santos, I.; Simal-Gandara, J. Identification of nitrates origin in Limia river basin and pollution-determinant factors. Agric. Ecosyst. Environ. 2020, 290, 106775. [Google Scholar] [CrossRef]
  29. Wang, X.Y.; Jiang, B.; Yang, M.F.; Bi, X. Ecological and environmental status of Chaohu Lake and protection counter measures. Yangtze River 2018, 49, 24–30. (In Chinese) [Google Scholar] [CrossRef]
  30. Xiao, H.Y.; Zhang, M.Y.; Cui, L.J.; Yang, S.; Li, W.; Zhao, X.S. Analysis on water quality and evaluation on purification value in the Hanshiqiao Wetland in Beijing City. Prot. For. Sci. Technol. 2016, 156, 4–7. (In Chinese) [Google Scholar] [CrossRef]
  31. Zhu, J.F.; Zhou, Y.; Wang, S.X.; Wang, L.T.; Liu, W.L.; Li, H.T.; Mei, J.J. Ecological function evaluation and regionalization in Baiyangdian Wetland. Acta Ecol. Sin. 2020, 40, 459–472. (In Chinese) [Google Scholar] [CrossRef]
  32. Debanshi, S.; Pal, S. Modelling water richness and habitat suitability of the wetlands and measuring their spatial linkages in mature Ganges delta of India. J. Environ. Manag. 2020, 271, 110956. [Google Scholar] [CrossRef] [PubMed]
  33. Otte, M.L.; Fang, W.T.; Jiang, M. A framework for identifying reference wetland conditions in highly altered landscapes. Wetlands 2021, 41, 40. [Google Scholar] [CrossRef]
  34. Comin, F.A.; Sorando, R.; Darwiche-Criado, N.; Garcia, M.; Masip, A. A protocol to prioritize wetland restoration and creation for water quality improvement in agricultural watersheds. Ecol. Eng. 2014, 66, 10–18. [Google Scholar] [CrossRef] [Green Version]
  35. Walton, C.R.; Zak, D.; Audet, J.; Petersen, R.J.; Lange, J.; Oehmke, C.; Wichtmann, W.; Kreyling, J.; Grygoruk, M.; Jablonska, E.; et al. Wetland buffer zones for nitrogen and phosphorus retention: Impacts of soil type, hydrology and vegetation. Sci. Total Environ. 2020, 727, 138709. [Google Scholar] [CrossRef] [PubMed]
Figure 1. Sampling plots of TN, NH4-N, and NO3-N in the Sanhuanpao wetland in northeast China.
Water 13 02683 g001
Figure 2. Mean and STD functions of TNCR (dependent index) and distance from the water channel (independent index) during the gradual buffer extrapolation, based on the water channel as a start line in the Sanhuanpao wetland. The curve on the left (L) is the mean of TNCR, the curve on the right (R) is the STD of TNCR, and the numbers in the figure are the maximum and minimum values of the fitting functions.
Water 13 02683 g002
Figure 3. Mean and STD functions of the ERs between TNCR and NH4-NCR (dependent index) and the distance of the water channel (independent index) during the gradual buffer extrapolation, based on water channel as a start line in the Sanhuanpao wetland. The curve on the left (L) is the mean of the ERs between TNCR and NH4-NCR, the curve on the right (R) is the STD of the ERs between TNCR and NH4-NCR, and the numbers in the figure are the maximum and minimum values of the fitting functions.
Water 13 02683 g003
Figure 4. Mean and STD functions of the ERs between TNCR and NO3-N (dependent index) and the distance of water channel (independent index) during the gradual buffer extrapolation, based on the water channel as a start line in the Sanhuanpao wetland. The curve on the left (L) is the mean of the ERs between TNCR and NO3-NCR, the curve on the right (R) is the STD of the ERs between TNCR and NO3-NCR, and the numbers in the figure are the maximum and minimum values of the fitting functions.
Water 13 02683 g004
Figure 5. Mean and STD functions of TNCR (dependent index) and the distance of the water inlet (independent index) during the gradual buffer extrapolation, based on the water inlet as a start line in the Sanhuanpao wetland. The curve on the left (L) is the mean of TNCR, the curve on the right (R) is the STD of TNCR, and the numbers in the figure are the maximum and minimum values of the fitting functions.
Water 13 02683 g005
Figure 6. Mean and STD functions of the ERs between TNCR and NH4-NCR (dependent index) and the distance of the water inlet (independent index) during the gradual buffer extrapolation, based on the water inlet as a start line in the Sanhuanpao wetland. The curve on the left (L) is the mean of the ERs between TNCR and NH4-NCR, the curve on the right (R) is the STD of the ERs between TNCR and NH4-NCR, and the numbers in the figure are the maximum and minimum values of the fitting functions.
Water 13 02683 g006
Figure 7. Mean and STD functions of the ERs between TNCR and NO3-N (dependent index) and the distance of the water inlet (independent index) during the gradual buffer extrapolation, based on the water inlet as a start line in the Sanhuanpao wetland. The curve on the left (L) is the mean of the ERs between TNCR and NH4-N, the curve on the right (R) is the STD of the ERs between TNCR and NO3-N, and the numbers in the figure are the maximum and minimum values of the fitting functions.
Water 13 02683 g007
Table 1. Location of sampling plots and TN, NH4-N, and NO3-N concentrations in the Sanhuanpao wetland.
PlotLongitude (W)Latitude (N)TN (mg/L)NH4-N (mg/L)NO3-N (mg/L)
1132°14′38″46°49′20″5.22/9.272.03/0.680.013/0.34
2132°17′8″46°49′23″2.32/9.960.45/0.650.151/0.36
3132°20′16″46°51′30″1.52/10.000.11/0.640.009/0.33
4132°21′8″46°49′37″1.15/10.880.18/0.660.023/0.35
5132°21′9″46°46′33″3.44/10.130.22/0.660.016/0.33
6132°22′50″46°47′28″1.55/8.410.23/0.610.036/0.39
7132°23′22″46°51′31″1.11/10.900.20/0.730.015/0.35
8132°24′29″46°50′16″4.18/10.910.07/0.602.057/0.34
9132°29′8″46°50′56″2.27/10.150.45/0.510.049/0.33
10132°31′48″46°50′18″4.99/9.770.15/0.891.438/0.31
11132°34′12″46°49′34″6.02/9.762.47/0.640.004/0.34
12132°35′55″46°49′15″5.59/10.701.69/1.580.459/0.56
13132°37′58″46°49′40″2.19/10.200.04/0.940.823/0.33
14132°41′42″46°49′23″1.94/10.220.07/0.570.707/0.44
15132°44′47″46°51′46″5.71/12.232.53/2.380.026/0.46
16132°44′53″46°50′16″1.47/10.790.15/0.550.014/0.34
17132°45′27″46°48′13″2.23/10.430.22/1.150.234/0.33
18132°47′20″46°50′20″1.09/11.250.07/2.500.004/0.49
19132°47′21″46°48′26″1.88/9.410.19/0.720.013/0.33
20132°48′49″46°48′26″3.95/9.700.20/0.690.030/0.33
21132°49′46″46°45′26″2.40/9.840.05/0.650.119/0.33
22132°53′2″46°49′18″5.66/11.263.50/1.650.026/0.55
23132°55′58″46°50′53″1.05/9.760.14/0.640.032/0.34
24132°56′57″46°49′41″1.44/11.410.19/1.460.014/0.33
Note: The index values of the TN, NH4-N, and NO3-N concentrations are for spring/summer.
Table 2. Classification accuracy of all types for remote-sensing images in the Sanhuanpao wetland.
TypeSamplesErrorsType Accuracy (%)Overall Classification Accuracy (%)
Building site24010091
Paddy fields26388
Dry land15287
Forest land20480
Water120100
Wetlands30293
Table 3. Eliminated sampling plots and ERs between TNCR and NH4-NCR and ERs between TNCR and NO3-NCR after a step-by-step elimination of the plots.
NH4-NCRNO3-NCR
EliminationEliminated Sampling PlotCorrelation Coefficient after Sampling-Plot Data EliminationEliminationEliminated Sampling PlotCorrelation Coefficient after Sampling-Plot Data Elimination
StepStep
1130.481110.50
270.532230.55
340.60 * 340.60 *
4230.68 *470.65 *
5160.73 *510.69 *
6240.77 ** 6220.73 *
730.81 **7150.76 **
860.85 **8240.79 **
990.87 **950.82 **
10190.90 **10160.84 **
1120.94 **11200.87 **
12170.96 **12120.89 **
13140.98 **13100.93 **
14100.98 **1480.97 **
1580.99 **15140.98 **
16211.00 **16190.99 **
1751.00 **1760.99 **
18151.00 **18210.99 **
19221.00 **1991.00 **
20111.00 **2021.00 **
21201.00 **2131.00 **
2211.00 **22171.00 **
23121.00 **23181.00 **
24181.00 **24131.00 **
Note: * p < 0.05, ** p < 0.01; the bold cell is the elimination step, eliminated sampling plot and correlation coefficient after sampling-plot data elimination when reaching significance (p < 0.05) and extremely significant (p < 0.01).
Table 4. Accuracy of three raster layers.
IndexMean (m)Root-Mean-SquareAverage Standard ErrorRMS/ASE
TNCR161.65351.57631.0490
ER (TNCR and NH4-NCR)180.28320.26861.0544
ER (TNCR and NO3-NCR)210.23220.22381.0375
Table 5. R2 and added R2 values of the fitting function between the mean or STD of the ER (dependent variable) and the distance from the water channel (km) or east–west length of the wetland (km) (independent variable).
Start Line of FunctionsIndexEquation TimesMean of ERSTD of ER
R2R2+R2R2+
Distance from water channelTNCR60.7308 ** 0.27820.6623 * 0.1684
50.45260.00060.49390.0009
40.45200.27020.49300.1593
30.18180.27020.33370.1188
20.12680.08810.21490.0295
10.0387K = 0.00080.1854K = −0.0034
NH4-NCR60.38230.01050.45060.0080
50.37180.05460.44260.0369
40.31720.00040.40570.0299
30.31680.06980.37580.1087
20.24700.00580.26710.0012
10.2412K = 0.00030.2659K = −0.0004
NO3-NCR60.7171 ** 0.24790.7055 ** 0.2379
50.46920.02600.46760.0043
40.44320.13870.46330.1800
30.30450.10050.28330.0980
20.20400.03130.18530.0437
10.1727K = 0.00010.1416K = −0.0002
East–west length of wetlandTNCR60.5025 * 0.27170.09960.0481
50.23080.02950.05150.0332
40.20130.09260.01830.0102
30.10870.05000.00810.0041
20.05870.00480.00400.0001
10.0539K = 0.00050.0039K = 0.0001
NH4-NCR60.06440.04120.08550.0194
50.02320.00180.06610.0615
40.02140.00750.00460.0026
30.01390.00010.00200.0009
20.01380.00960.00110.0007
10.0042K = 0.00010.0004K = 0.0001
NO3-NCR60.27670.06330.08130.0016
50.21340.07320.07970.0770
40.14020.08940.00270.0006
30.05080.00250.00210.0001
20.04830.04550.00200.0019
10.0028K = 0.00010.0001K = 0.0001
Note: * p < 0.05, ** p < 0.01; R2+: added value of R2; ER: elimination correlation coefficient; the bold cells are the selected fitting functions (the largest added value of R2).
Table 6. Areas of four groups for TNCR and the different significant areas of ERs between TNCR and NH4-NCR, and the ERs between TNCR and NO3-NCR in the Sanhuanpao wetland.
GroupTNCRER (TNCR and NH4-NCR)ER (TNCR and NO3-NCR)
Area (ha)Percent (%)Area (ha)Percent (%)Area (ha)Percent (%)
1414316.5210584.22270.11
2648025.8417687.0514745.88
311,66146.5122,24988.7323,57494.01
4279011.13
Note: The groups are defined after Table 4.
Publisher’s Note: MDPI stays neutral with regard to jurisdictional claims in published maps and institutional affiliations.

