2.4.1. The Calculation of Change Rate of TN, NH4-N and NO3-N in Spring and Summer of the Sampling Plots
The change rates of TN, NH4-N, and NO3-N in spring and summer were calculated for the same sampling plots, to analyze the spatial pattern of the TN-removal ability when receiving farmland-recession water. Because the wetlands did not receive farmland return water in the spring, it was assumed that the concentrations of TN, NH4-N, and NO3-N in the water were the base values in the wetlands.
The three wetland water indices changed after the wetlands received the farmland return water in the summer. Therefore, the concentration ratios of summer to spring of the three indices in the same sampling plot were used as the change rates of the three indices. The change rates of the three indices of 24 sampling points were calculated using the following three formulas.
where TN
CR was the change ratio of the TN concentration, TN
SUM was the TN concentration in summer on a sampling plot, and TN
SPR was the TN concentration in spring at the same sampling plot.
where NH
4-N
CR was the change ratio of the NH
4-N concentration, NH
4-N
SUM was the NH
4-N concentration in summer on a sampling plot, and NH
4-N
SPR was the NH
4-N concentration in spring at the same sampling plot.
where NO
3-N
CR was the change ratio of the NO
3-N concentration, NO
3-N
SUM was the NO
3-N concentration in summer on a sampling plot, and NO
3-N
SPR was the NO
3-N concentration in spring at the same sampling plot.
2.4.2. The Calculation of TNCR and the Other Two ERs for the TNCR and NH4-NCR, TNCR and NO3-NCR
We analyzed the significance of difference between the TNCR and NH4-NCR using Tukey’s HSD test of one-way analysis of variance (ANOVA), and the significance of difference between the TNCR and NO3-NCR. The correlation coefficient (R) was 0.40 between TNCR and NH4-NCR and 0.28 between TNCR and NO3-NCR, based on the change rates of the three indices in the spring and summer at 24 sampling points. The two Rs did not reach a significant level (p > 0.05). Then, a step-by-step elimination analysis was used for further calculation.
The data of the 24 sampling plots were eliminated in turn. The calculation process was as follows: we removed the data of No. 1, and calculated the R between TNCR and NH4-NCR from the second to the 24th sampling plots. Then, we replaced the data of No. 1 and removed the data of No. 2, and calculated the R between TNCR and NH4-NCR for the remaining 23 sampling points. The rest were done in the same manner. When all 24 Rs were calculated, the first round of calculations was completed.
The largest R was the elimination correlation coefficient (ER) of the worst sampling plot. Therefore, it was eliminated in the first round. Then, the second round of elimination was carried out, using the same method, and the remaining 23 sampling plots were screened in turn, with one sampling plot eliminated in each round. One sampling plot was left at the last round to complete the screening (
Table 3). The step-by-step elimination analysis also used for NH
4-N
CR calculation was applied to the NO
3-N
CR. The ER was calculated between TN
CR and NO
3-N
CR for each sampling plot (
Table 3).
2.4.3. Spatial Interpolation and Area Calculation of Different Groups of TNCR and the Other Two ERs for the TNCR and NH4-NCR, TNCR and NO3-NCR
A Kriging interpolation was applied to the ArcGIS geographic information system to create three raster layers to cover the entire wetland. They were TN
CR and the other two ERs for TN
CR and NH
4-N
CR, TN
CR and NO
3-N
CR. The mean errors of five layers were from 16 m to 21 m (
Table 4), which were less than 30 m. In addition, the root-mean-square/average standard error (RMS/ASE) of the five raster layers were from 1.0375 to 1.0544 (
Table 4). Therefore, the three layers can be used for our research.
The TNCRs were classified into the following four groups, based on the mean and 1STD of TNCR:
<mean − 1STD (TNCR = 2.76);
From mean − 1STD (TNCR = 2.76) to mean (TNCR = 3.85);
From mean (TNCR = 3.85) to mean +1STD (TNCR = 4.94); and
>mean + 1STD (TNCR = 4.94).
The spatial distribution of TN removal in the water of wetlands was analyzed according to the area of each type and its proportion to the total area. The ERs between TNCR and NH4-NCR were classified into the following three groups, based on the significance level of the ERs:
Positive correlation (0 to 0.60);
Significant positive correlation (0.60 to 0.77 (p < 0.05)); and
Extremely significant positive correlation (ER ≥ 0.77 (p < 0.01)).
The ERs between the TNCR and NO3-NCR were classified into the following three groups, based on the significance level of the ERs:
Positive correlation (0 to 0.60);
Significant positive correlation (0.60 to 0.76 (p < 0.05)); and
Extremely significant positive correlation (ER ≥ 0.76 (p < 0.01)).
The total area and percentage of area for each group were calculated to determine the relationship of NH4-N, NO3-N, and TN.
2.4.4. The Spatial Analysis of TNCR and the Other Two ERs for the TNCR and NH4-NCR, TNCR and NO3-NCR
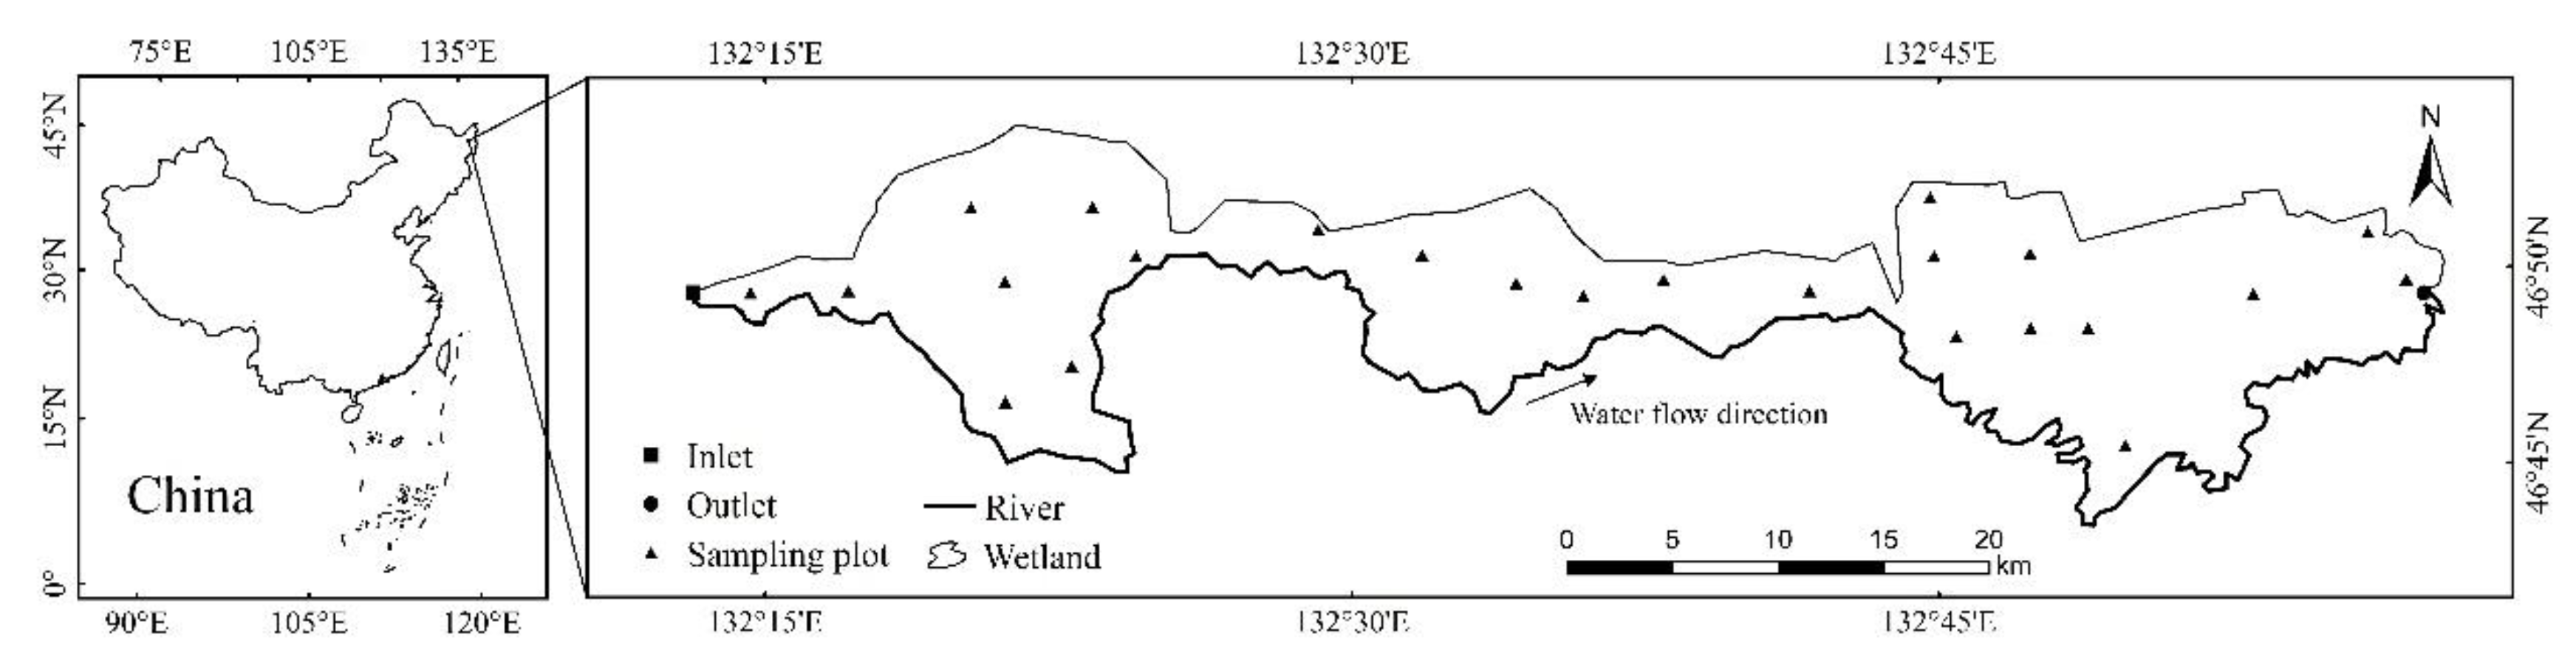
The Sanhuanpao wetland is located north of water channel of the Qixing River. We used water channel as the starting line, and gradually buffer extrapolate wetland to the north, until the northernmost side of the wetland. Because the spatial resolution of the image was 30 m, the buffer used 30 m as the basic unit. That is, the first time, the water channel was used as the baseline to buffer 30 m northward. The next time, a line 30 m away from the north side of the water channel was used as the baseline, and the buffer zone was buffered 30 m northward again, and so on for 8 km (the northernmost side of the wetland) in three raster layers, including TNCR and the other two ERs for TNCR and NH4-NCR, TNCR and NO3-NCR, respectively.
In each buffer zone, the means and standard deviations (STDs) were calculated for TNCR and the two ERs of TNCR and NH4-NCR, TNCR and NO3-NCR. Then, the buffer-zone analysis was carried out from the western side to the eastern side of the wetlands (linear extension, 57 km from east to west in the wetland) with 30 m as the basic unit, using the same method as for channel extrapolation. The means and STDs of TNCR and the two ERs for TNCR and NH4-NCR, TNCR and NO3-NCR were calculated in each buffer zone.
Finally, the fitting functions were used to analyze the spatial pattern of the removal relationship among TN
CR, NH
4-N
CR and NO
3-N
CR. The means and STDs of TN
CR and the two ERs for TN
CR and NH
4-N
CR, TN
CR and NO
3-N
CR were the dependent variables, and the distance from the water channel (km) and the east-west length (km) of the wetland were the independent variables. Each function was fitted from the first to the sixth power, and the function with the largest added values of
R2 (
R2+) was selected for revealing the spatial pattern. There were 12 cases in total (
Table 5), as follows:
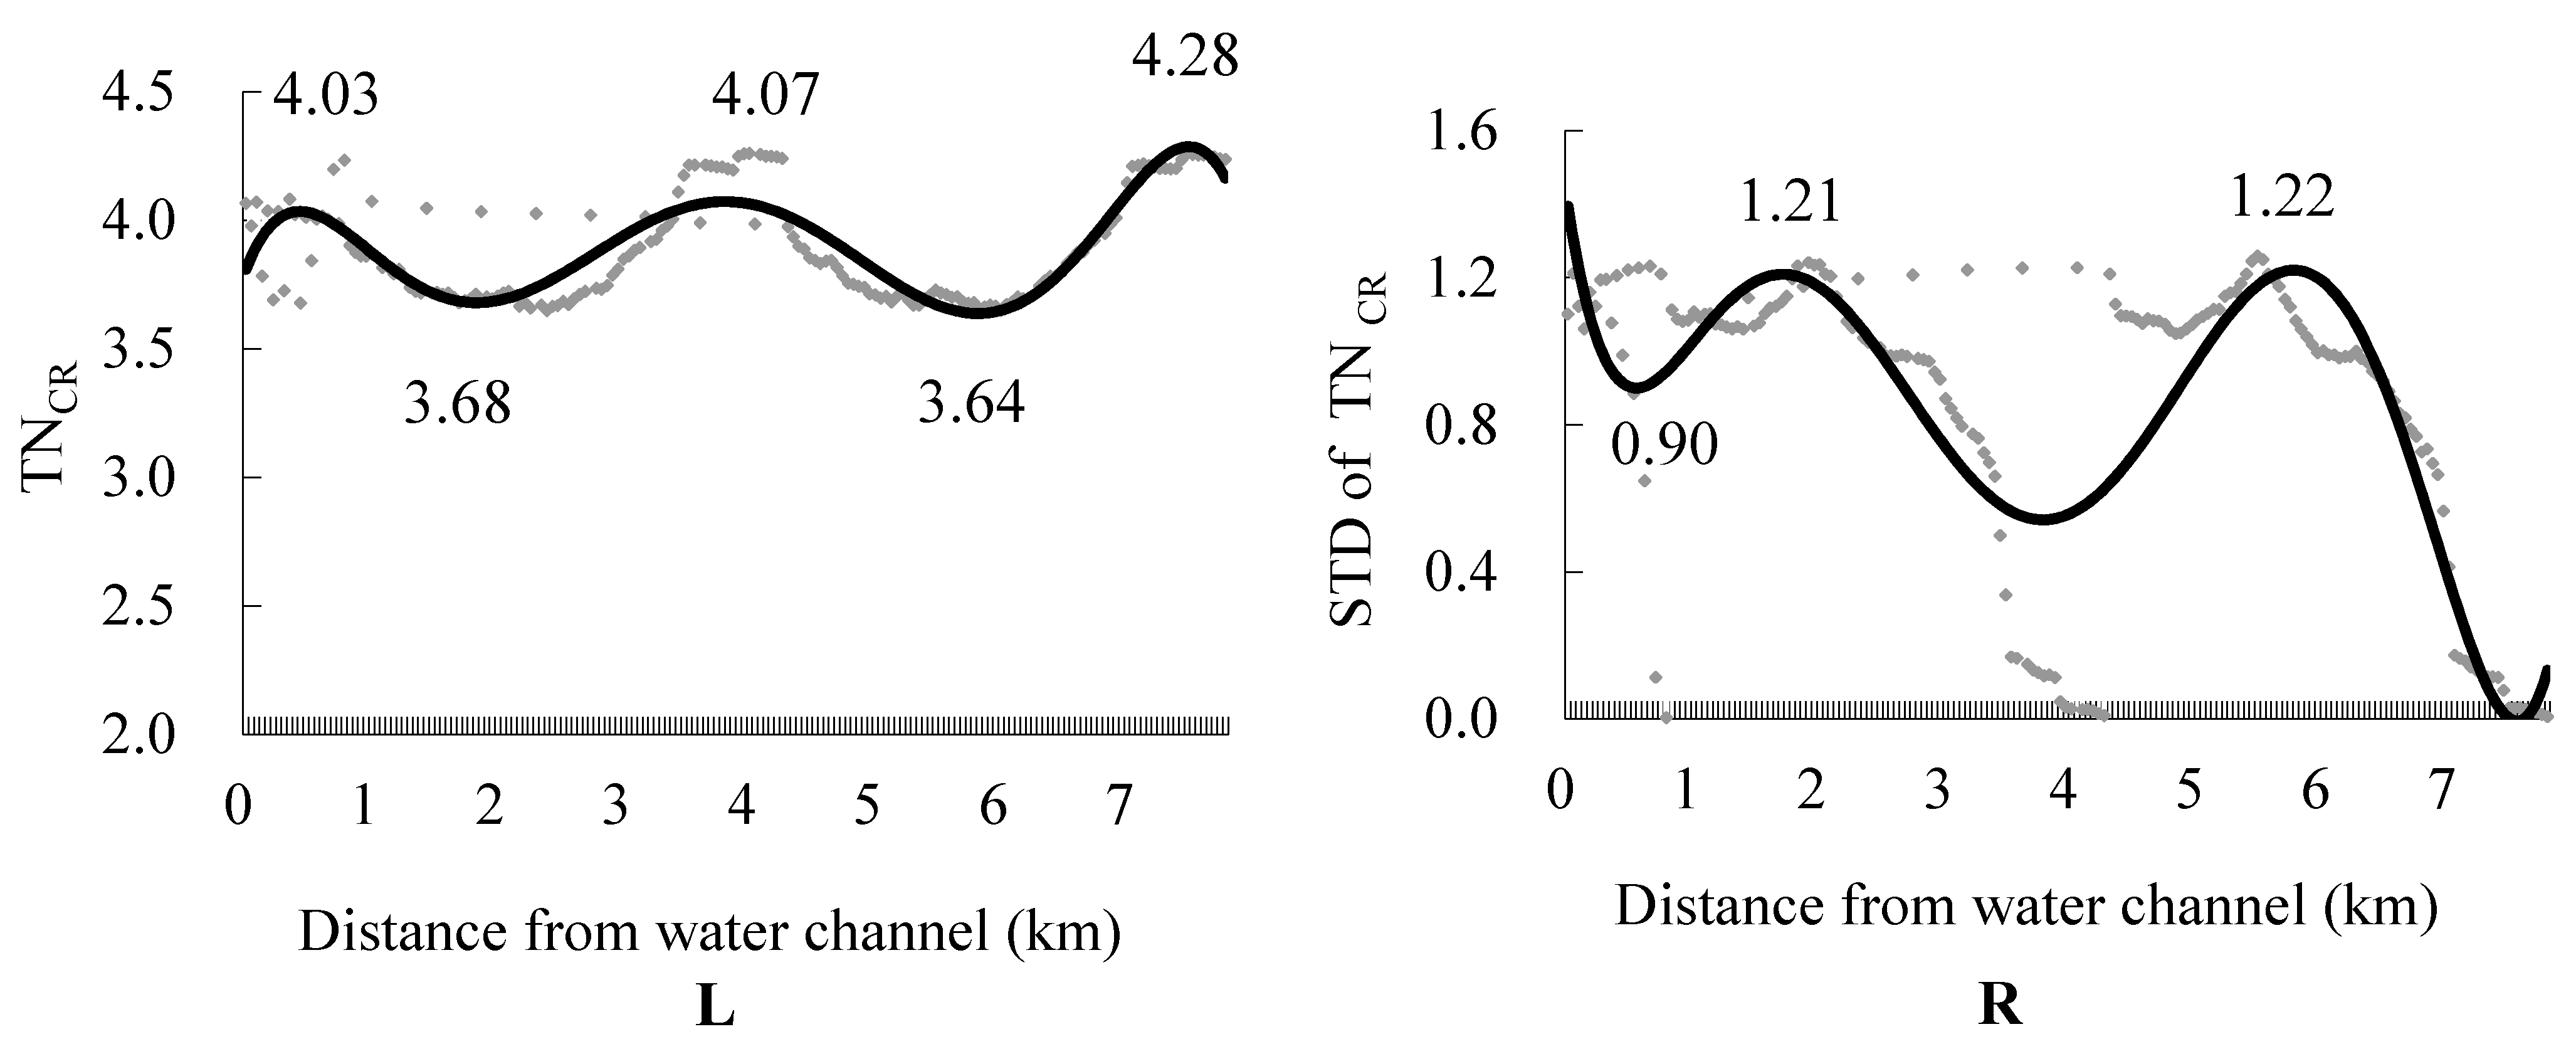
The sixth power function was selected between the mean of TN
CR and the distance from water channel (
R2+: 0.2782) (
Figure 2L);
The sixth power function between the STD of TN
CR and the distance from the water channel (
R2+: 0.1684) (
Figure 2R);
The third power function between the mean of ER for TN
CR and NH
4-N
CR and the distance from the water channel (
R2+: 0.0698) (
Figure 3L);
The third power function between the STD of ER for TN
CR and NH
4-N
CR and the distance from the water channel (
R2+: 0.1087) (
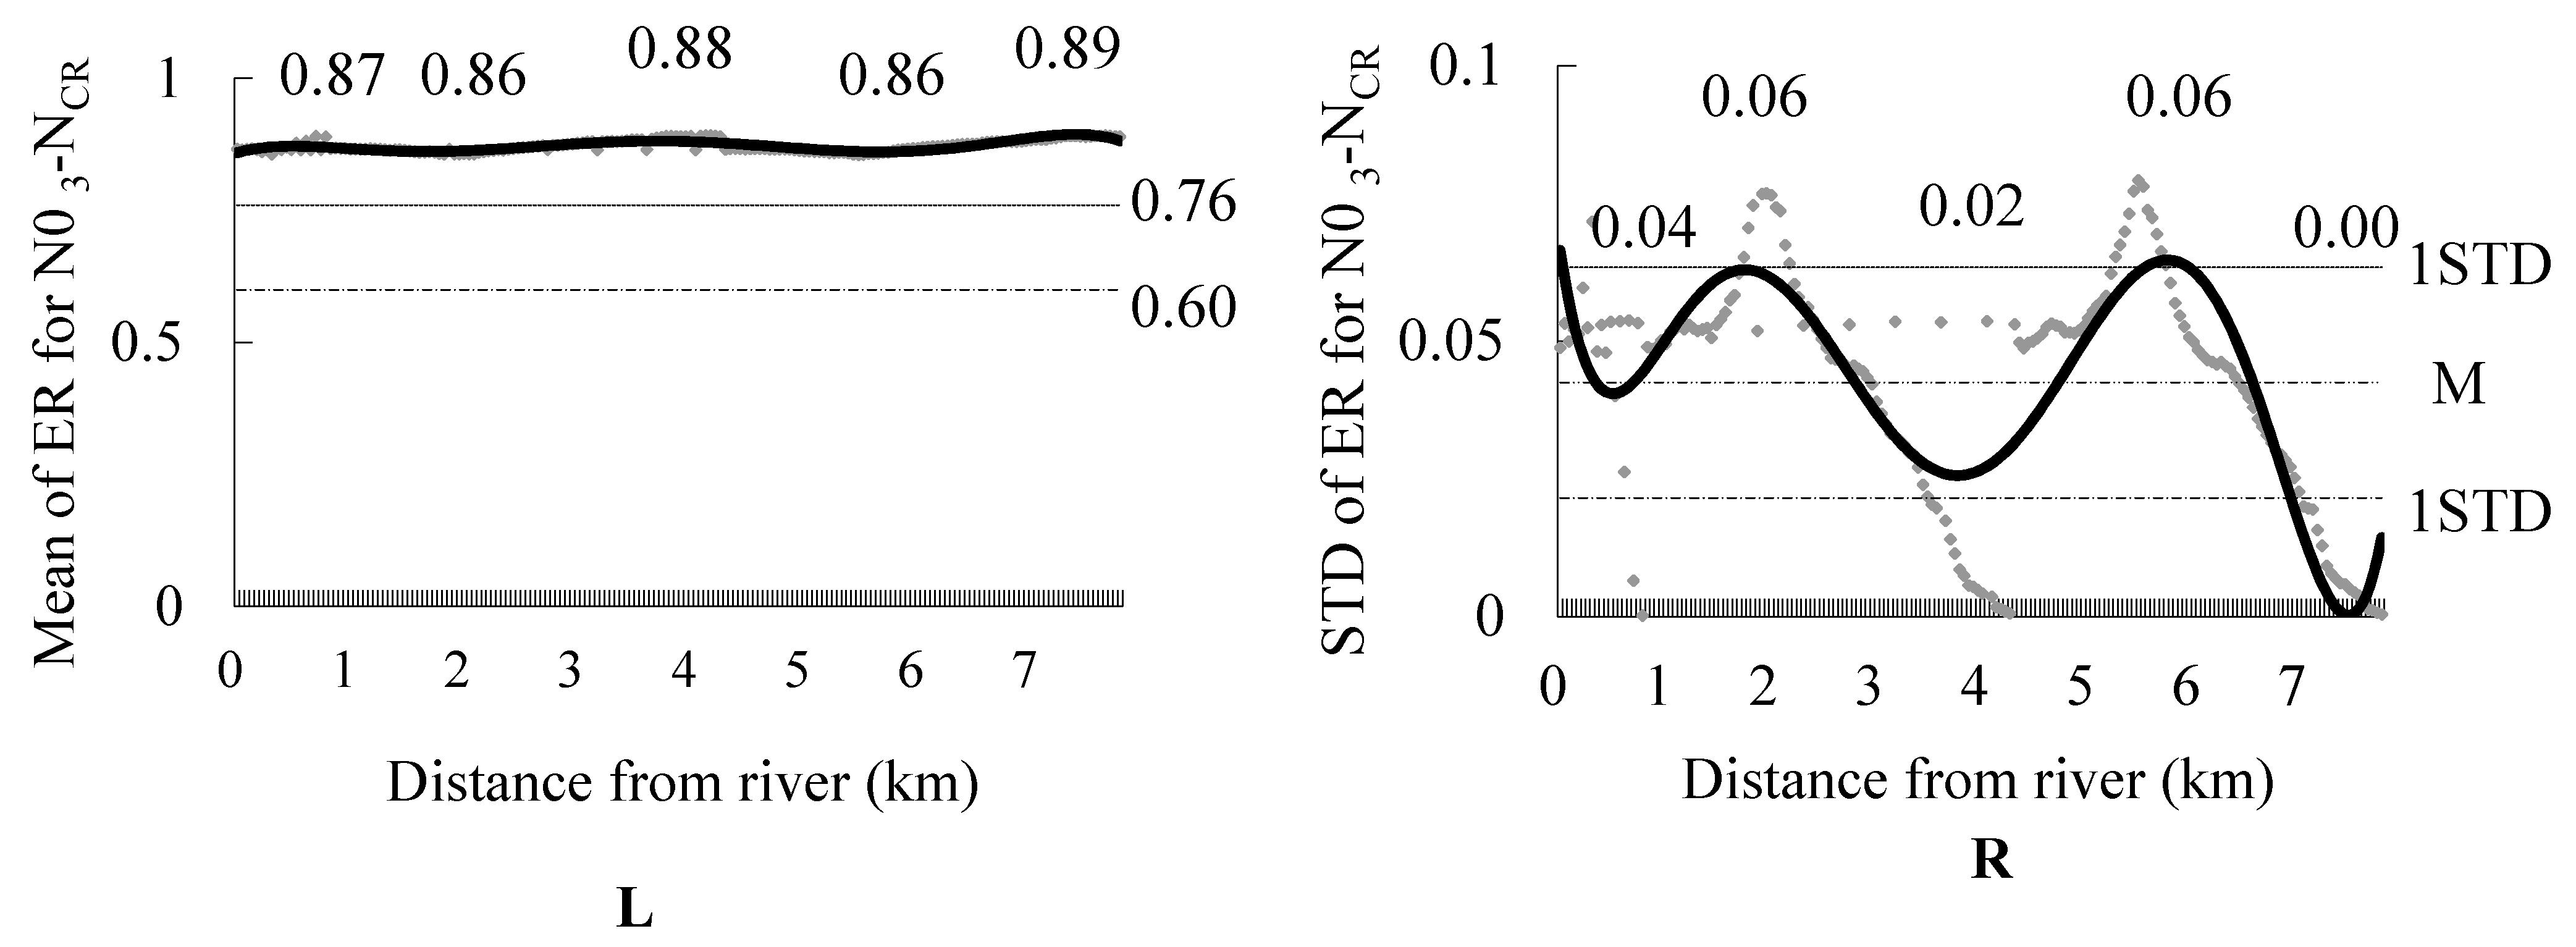
Figure 3R); The sixth power function between the mean of ER for TN
CR and NO
3-N
CR and the distance from the water channel (
R2+: 0.2479) (
Figure 4L); and
The sixth 6th power function between the STD of ER for TN
CR and NO
3-N
CR and the distance from the water channel (
R2+: 0.2379) (
Figure 4R).
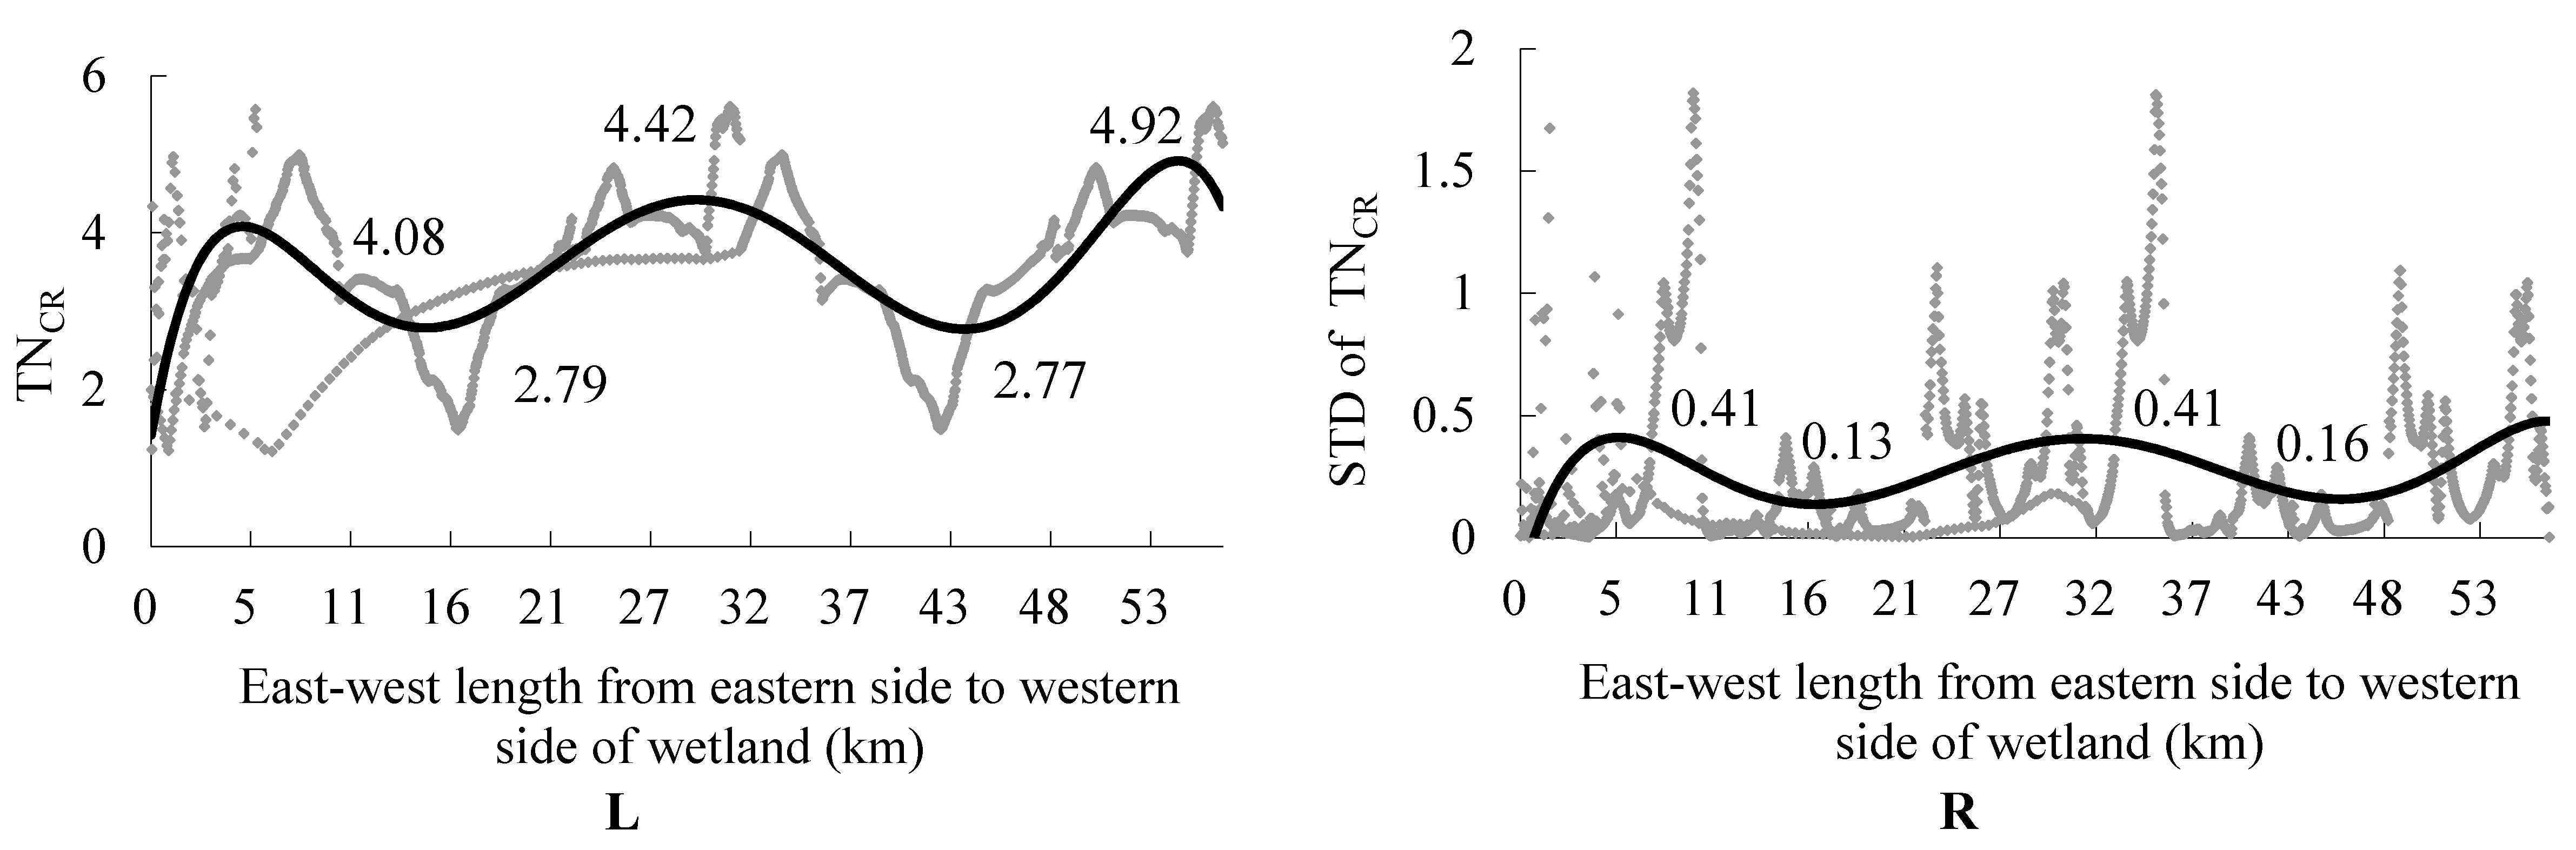
The sixth power function is selected between the mean of TN
CR and the east-west length from the eastern side to the western side of the wetland (taking the water inlet as the starting line) (
R2+: 0.2717) (
Figure 5L);
The sixth power function between the STD of TN
CR and the east–west length (
R2+: 0.0481) (
Figure 5R);
The sixth power function between the mean of ER for TN
CR and NH
4-N
CR and the east–west length (
R2+: 0.0412) (
Figure 6L);
The fifth power function between the STD of ER for TN
CR and NH
4-N
CR and the east–west length (
R2+: 0.1087) (
Figure 6R);
The fourth power function between the mean of ER for TN
CR and NO
3-N
CR and the east–west length (
R2+: 0.0894) (
Figure 7L); and
The fourth power function between the STD of ER for TN
CR and NO
3-N
CR and the east–west length (
R2+: 0.0770) (
Figure 7R).
The TN spatial changes of the water, caused by the spatial pattern of the NH4-N and NO3-N removals, were analyzed, according to the extreme values of the variation characteristics of the curves of these functions.


