Article

Crop Field Level Estimation of Nitrogen Input from Fertilizer Use in Jeju Island, South Korea: Management Methods to Prevent Groundwater NO3-N Contamination

1
Jeju Groundwater Research Center, Jeju Research Institute, 253 Ayeon-ro, Jeju-si 63147, Korea
2
Korea Institute of Geoscience and Mineral Resources, 124 Gwahak-ro, Yuseong-gu, Daejeon 34132, Korea
3
GeoGreen21 Co., Ltd., 901, 55 Digital-ro 33-gil, Guro-gu, Seoul 08376, Korea
*
Author to whom correspondence should be addressed.
Water 2021, 13(19), 2715; https://doi.org/10.3390/w13192715
Submission received: 19 August 2021 / Revised: 25 September 2021 / Accepted: 26 September 2021 / Published: 1 October 2021
(This article belongs to the Section Water Quality and Contamination)

Abstract

:
The application of synthetic nitrogen (N) fertilizers has boosted crop yields globally. However, it has also imposed on environmental pollution problems. An estimation of actual fertilizer N inputs at the crop field level is needed to establish effective N management plans to control groundwater NO3-N contamination. Here, a survey to collect the types of cultivated crop and fertilizer application rate was conducted during 2016–2018, covering 44,253 small crop fields (7730 ha) in the western part (Hanrim and Hankyung regions) of Jeju Island, South Korea. Foreign vegetables, citrus fruits, and bulb vegetables are the major crop types grown in the total cultivated areas of 2165.6 ha, 1718.7 ha, and 944.9 ha, respectively. For several crops (green garlic, potato, and chives), the over-use of N fertilizers is observed, the amount of which is 1.73–4.95 times greater than the standard fertilizer application rate. The highest level of fertilizer N input is observed for bulb vegetables in both the regions (Hanrim: 500.5 kg/ha, Hankyung: 487.1 kg/ha), with nearly 80% of the N fertilizer input turned into surplus N loading. A comparison between a spatial interpolation map of the fertilizer N input and that of the groundwater NO3-N concentration implies that the excessive use of synthetic fertilizer results in the degradation of groundwater quality by NO3-N. N management plans for the study area are suggested based on the N fertilizer input at the crop field level. This study highlights that sustainable N management plans should be arranged at the crop field level, considering the spatial heterogeneity of N fertilizer use.

1. Introduction

Nitrogen (N) is an essential nutrient for plant growth. The mass production of synthetic N fertilizers was initiated using the Haber-Bosch process in the early 1900s, which resulted in a significant increase in crop yield. Subsequently, the global N fertilizer consumption considerably increased from 11.3 Tg N/year in 1960 to 107.6 Tg N/year in 2013 [1]. Although the development of synthetic fertilizers has resulted in a tremendous increase in crop productivity, it has negatively influenced the ecosystems. As crops only use approximately half of the N fertilizer with a 0.45 global nitrogen use efficiency (NUE) [2], the remainder of the applied fertilizer remains in the soil and groundwater, causing adverse environmental problems such as eutrophication [3,4], greenhouse gas emissions [5,6], soil acidification [7], and NO3-N pollution in surface water and groundwater [8,9,10].
During the migration of N fertilizers through the unsaturated zone, surplus N is rapidly transformed into NO3 through nitrification. As NO3 is easily dissolved in water and difficult to adsorb into soil particles, NO3 in an aquifer system could cause long-term water quality degradation unless NO3 is removed by microbial processes. Various studies have assessed the NO3-N contamination of groundwater from N fertilizers and estimated the N budget [2,11], N leaching through soil [12,13,14,15], and NO3-N vulnerability of groundwater using age tracers [16,17,18].
An accurate estimation of N input from fertilizer use is challenging because it requires a vast amount of information on crop type and application rate of the fertilizer at a crop field level. Several studies have estimated national-scale nutrient inputs from fertilizer use [19,20,21,22] based on commercial fertilizer sales data, fertilized area, fertilizer expenditure data, and the national average crop-specific N use rate. Huffman et al. [23] estimated the N fertilizer rate applied in Canada by considering the ratios of the total N sold in the Soil Landscapes of Canada (SLC), the total N recommended in the SLC, and the recommended rate of N fertilizer for crop type. Although the reconstruction of N input from the N fertilizer sales data is an easily available and reliable approach, it is difficult to obtain information on the actual use of N fertilizer at the farm level. Quemada et al. [24] collected data from 1240 farms from surveys conducted in six EU countries and estimated N inputs and outputs to conduct a farm-level evaluation. Bierman et al. [25] provided data on N fertilizer use (application rates, timing, placement, and chemical form of the fertilizer) for cornfields in Minnesota, USA, by surveying 1496 farmers across crop fields totaling 195,539 ha. However, studies assessing N fertilizer input at the farm scale have mostly targeted one type of crop or the average amount for all agricultural land and did not consider different types of cultivated crops individually. For a more accurate estimation of N input into the subsurface, it is necessary to estimate the amount of fertilizer applied to various cultivated crops, considering the difference in N demand for each crop.
On Jeju Island, which is located in the southernmost part of the Korean peninsula, agriculture is one of the most important sources of income, constituting 10.63% of the total gross domestic product (GDP), which is much greater than the average for South Korea as of 2015 (2.09%; [26]). Agricultural land covers more than one-third of the island’s surface (34.9% as of 2016), and nearly half of these cultivated fields are concentrated in the western part of the island (48.7% of the total agricultural land). Along with the vitalization of agricultural practices, the use of synthetic fertilizers has increased in the region, as revealed by the number of sales of a synthetic N fertilizer, totaling 841.9 t/ha/year in 2019 [27]. According to a report by the Jeju Research Institute [28], the daily N loading amount of N fertilizer was estimated as 58% of the total N loading in Jeju (N fertilizer: 38,222 kg/day, livestock waste: 22,208 kg/day, private sewage treatment: 5631 kg/day).
The abundant use of N fertilizer directly increases groundwater pollution problems caused by NO3-N. Koh et al. [29] analyzed 6576 groundwater quality samples across the island and observed that the number of samples contaminated with NO3-N levels exceeding the drinking water standard was much higher than that of the samples contaminated with Cl (NO3-N: 418, Cl: 10 in a total of 1333 data points). Various studies have focused on spatiotemporal characteristics [30,31], the identification of contaminant sources [9,32], and a long-term trend analysis [29,33] in relation to groundwater NO3-N contamination on Jeju Island. In particular, Koh et al. [34] reconstructed the N input history from fertilizer use by matching the NO3-N concentration considering the timing of contamination. Additionally, Koh et al. [35,36] developed numerical models to suggest effective NO3-N management methods and understand the impact of groundwater mixing features on NO3-N contamination. All the above-mentioned studies utilized historical N inputs estimated from the N fertilizer sales data. On Jeju Island, this could result in uncertainty in N input estimation because agricultural activities in the island have been performed by small crop fields; therefore, fertilizer application rates and cultivated crops show a large spatial variability at the crop field level.
On Jeju Island, only commercial fertilizer sales for each administrative district exist. To our knowledge, there has been no effort to acquire N fertilizer input information in actual crop fields. More reliable and effective management methods against NO3-N contamination of groundwater on Jeju Island should be based on fertilizer N input data analyzed at the crop field level. Therefore, the objectives of this study are to (1) survey cultivated crop types and the amount of fertilizer use in the Hanrim and Hankyung regions (located in the western part of Jeju, where severe NO3-N contamination in groundwater has been reported), (2) estimate the crop field level N input and surplus N loading, and (3) suggest N management plans considering the spatial variability of N fertilizer input. The construction of the crop field level N input would help elucidate the actual level of N fertilizer over-use and provide information on groundwater management measures that need to be implemented, at the local level, against NO3-N contamination.

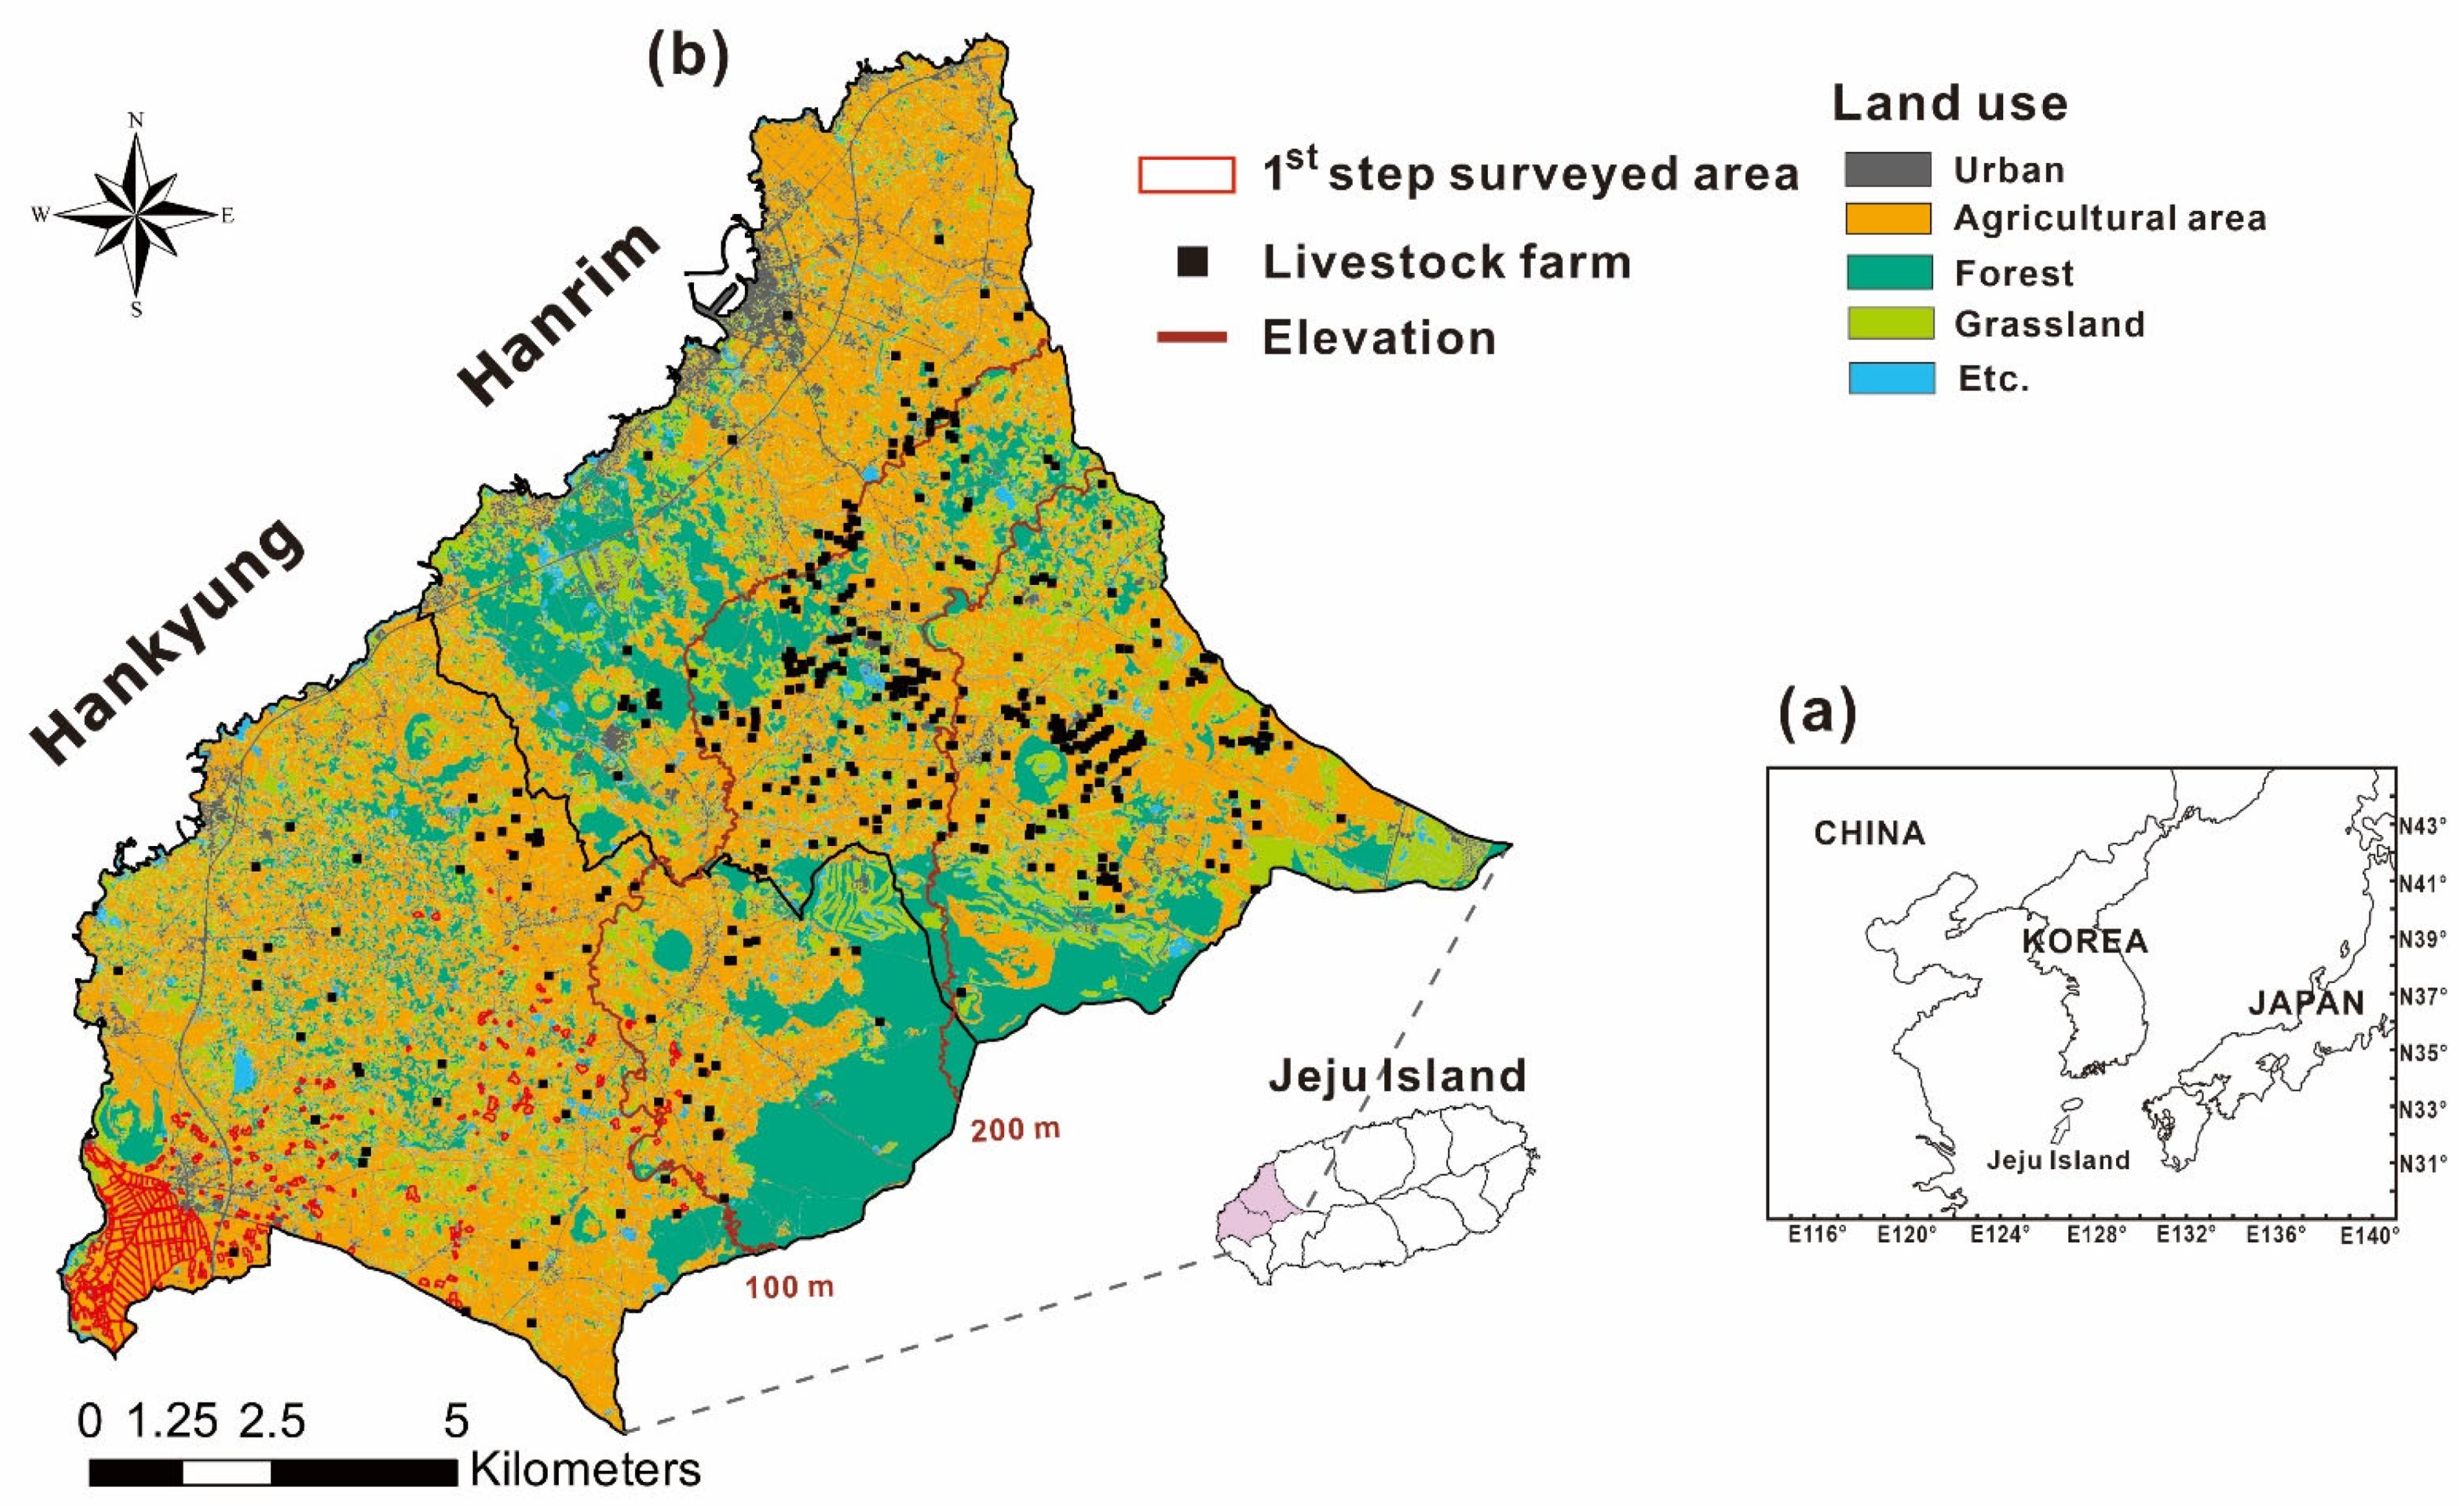
2. Study Area Description

2.1. Hydrogeologic Characteristics of Jeju Island

Jeju Island is the largest island in South Korea, with a total area of 1850 km2. The island was formed by multiple volcanic eruptions (from the Late Pliocene to Quaternary), and various features of volcanic rocks (joints, lava tubes, scoria, and clinkers) are observed throughout the island [37]. The porous volcanic rocks that cover most of the island surface induce easy percolation of precipitation into the subsurface medium [38]. The annual precipitation in Jeju averaged for the past 30 years (1991–2020) was 1745.9 mm/year [39], which is 1.34 times higher than that in the Seoul metropolitan area (1303.05 mm/year). These hydrogeological features, characterized by an abundant rainfall amount and porous volcanic rocks, have been attributed to increased groundwater recharge (40.58% of total precipitation; [40]). Owing to the high groundwater recharge rate and lack of surface water resources, water use in Jeju heavily relies on groundwater resources (81.4% of total water use; [40]). Simultaneously, the hydrogeological and anthropogenic features of the island (high permeability of the volcanic aquifer, intensive agricultural activity, and increasing groundwater use) make groundwater highly vulnerable to contamination by surface pollutants.

2.2. Agricultural Activities in the Study Area

The Hanrim and Hankyung regions, the site of this study, are located in the western part of Jeju Island (Figure 1). After the readjustment of arable land, performed through the 1960s–1970s [41], agricultural practices on the island were concentrated in the study area. In the Hanrim and Hankyung regions, the agricultural land contributed to the largest proportion of the total surface area (Hanrim: 42.6 km2 of 90.8 km2, 46.9%; Hankyung: 43.2 km2 of 79.3 km2, 54.4% as of 2015). On Jeju Island, two to three crops a year, in general, are grown; major cultivated crops include onion, cabbage, white radish, garlic, and sesame [9]. The amount of synthetic N fertilizer in 2018 was 841 t/year for the Hanrim region and 1164 t/year for the Hankyung area, accounting for 5.6% and 7.7% of the total N fertilizer sales on the island, respectively [28].

2.3. The NO3-N Contamination in Groundwater of the Study Area

The average NO3-N level in groundwater of the Hanrim and Hankyung regions (4.93 mg/L and 10.00 mg/L, respectively) was reported to be greater than 1.95 mg/L of the baseline concentration of NO3-N in Jeju [40]. Previous studies also found severe groundwater contamination by NO3-N in the study area, with NO3-N levels exceeding the maximum contamination level (MCL, NO3-N drinking water standard of 10 mg/L) [9,30,42,43]. Using a N stable isotope analysis, the major source of NO3-N contamination was identified as synthetic fertilizers applied in agricultural fields [9,30,42]. Additionally, groundwater contamination by animal wastes was partly observed in the Hanrim area, where livestock farms are predominantly distributed (Figure 1) [42,43].

3. Methods

3.1. Surveying the Application Rates of N Fertilizers and Types of Cultivated Crops

The N fertilizer input in the Hanrim and Hankyung study areas was estimated through a two-step survey. Farm data (crop type and fertilizer use) of some agricultural areas (226 ha) in the Hankyung region (Figure 1) were obtained from the 1st step of the survey. For the entire study area (7730 ha), cultivated crop types were investigated through the 2nd step survey. Then, total N input by the fertilizer uses in the entire study area calculated by applying the farm data obtained from the 1st step of the survey for the same crops over the entire study area (the 2nd step survey).
The 1st step of the survey was conducted from December 2016 to September 2018 by interviewing the farmers using a questionnaire (Table S1), which covered 185 farmhouses corresponding to 925 crop fields (the 1st–6th surveys were conducted for the same crop field). The questionnaire surveying the individual crop field information included the crop name, harvest period, crop yield, harvest labor, non-cultivation period, and chemical fertilizer usage.
For the 2nd step of the survey, information on the types of cultivated crops for each agricultural field in the entire study area was acquired using a field survey in November 2018. Considering that cultivating two to three crops a year is a typical agricultural practice on Jeju Island, the latter survey covered the N fertilizer input in the second half of 2018 (September 2018 to February 2019). The information on cultivated crops in the total 44,253 crop fields was collected through the 2nd step of the survey.

3.2. Estimation of Surplus N Loading

We estimated the surplus N loading to evaluate the influence of the excessive use of fertilizer on the aquifer system. The surplus N loading could be calculated using Equation (1) as follows:
Nsurp = Nfer + Nsoil − Nuptake
where Nsurp is the surplus N loading (kg/ha), Nfer is the N input from the fertilizer (kg/ha), Nsoil is the residual N amount of the soil layer (kg/ha), and Nuptake is the amount of N adsorbed by crops (kg/ha) in the cultivated field. In Equation (1), N refers to the total nitrogen.
Oh et al. [44] estimated the residual amount of N in the soil layer in the Hankyung agricultural area using the measured NO3-N concentrations from the lysimeters and the soil water content. In their study, the Nsoil was calculated as 43 N kg/ha (±18.4 N kg/ha), 35 N kg/ha (±10.7 N kg/ha), 62 N kg/ha (±14.0 N kg/ha) at 0.4 m, 0.7 m, 1.0 m depth of the installed lysimeters, respectively. We used the Nsoil at 0.4 m to calculate the N surplus loading, considering the average root zone depth of the major crops.
Referenced data for the Nuptake amount by crop type were collected from the literature survey and are listed in Table S2. We collected uptake data for 12 crops, including white radishes, barley, garlic, broccoli, cabbage, kohlrabi, onions, potatoes, dry-field rice, chives, wheat, and tomatoes [45,46,47,48,49,50,51,52]. For the red cabbage and Brussel sprouts, the amount of Nuptake was assumed to be the same as that for cabbage (Table S2). For several crops that did not have a reference Nuptake value (citrus fruits, sesame, beans, blueberries, pumpkins, and deodeok), we used the average value of the collected Nuptake (138 N kg/ha ± 30.1 N kg/ha).

4. Results

4.1. Surveyed Information of N Fertilizer Usage by Cultivated Crops

Table 1 contains information on the cultivated crops, cultivation area, fertilizer usage amount for each crop obtained from the survey in the Hankyung area, and the ratio of the N fertilizer use divided by the standard N fertilizer use (Factual/Fstandard). The standard N fertilizer usage for each crop type provided by the agricultural research and extension services of the Jeju Special-Self Province. A Factual/Fstandard ratio greater than one indicates excessive use of chemical fertilizers.
A total of 39 crops was cultivated in the surveyed area receiving 168,932 kg of synthetic N fertilizer. White radish was the most often cultivated crop in 709 crop fields, with a cultivated area of 168 ha, followed by barley and garlic in 541 and 396 crop fields (139 ha and 89 ha, respectively). Green garlic (495 kg/ha), Brussel sprout (368 kg/ha), chives (364 kg/ha), and onion (346 kg/ha) showed the highest amounts of chemical fertilizers. Sesame (55 kg/ha), house citrus (55 kg/ha), bean (61 kg/ha), and wheat (34 kg/ha) revealed a relatively low application rate of chemical fertilizer per unit area. In Figure 2, green garlic accounted for the highest ratio of Factual/Fstandard (4.95), nearly five times greater than the standard fertilizer amount. Additionally, the potato and chives showed considerably large Factual/Fstandard ratios of 3.29 and 1.73, respectively.

4.2. Cultivated Crops in the Hanrim and Hankyung Areas

To estimate the spatially varying N input distribution at the crop field level, a GIS map of the cultivated crop for the second half of 2018 was delineated over the study site (Figure 3). During this process, 68 different crops were categorized into nine major crop types, including citrus fruits, foreign vegetables, bulb vegetables, food crops, green vegetables, root vegetables, fruit vegetables, special-use crops, and other crops. Details of the cultivated crops and major crop types are provided in Table 2. In the entire study area, foreign vegetables accounted for the largest cultivation area, with 2165.6 ha (29.0% of the total area), followed by citrus fruits (1718.7 ha, 23.0%) and bulb vegetables (944.9 ha, 12.7%). In the Hanrim area, the number of foreign vegetables (1262.3 ha) was higher than that in the Hankyung area (903.3 ha). In the Hankyung, the citrus fruits (1082.2 ha) and bulb vegetables (652.6 ha) were the major cultivated crops compared to those in the Hanrim region (citrus fruits: 636.5 ha, bulb vegetables: 292.3 ha). Additionally, the root vegetables were intensively cultivated in Hankyung (Hanrim: 15.1 ha, Hankyung: 252.6 ha). The food crops (Hanrim: 431.3 ha, Hankyung: 421.7 ha) showed similar occupancy for both sites in terms of the total cultivation area.
The citrus fruit fields were mainly located throughout the Hankyung region and western parts of Hanrim (Figure 3). The foreign and bulb vegetables were cultivated in the low elevation area along the seaside, and the green vegetable fields were widely distributed on the seaside of the northern part of the Hanrim. Food crops were majorly raised in the central regions of Hanrim and Hankyung. Root vegetables, such as white radish and carrot, were the major crops grown in the western part of Hankyung. The special-use crop field was mostly concentrated in the seaside zone between the Hanrim and Hankyung regions, whereas the fruit vegetable fields were scattered across the entire study area.

4.3. Crop Field Level N Input and Surplus N Loading

The estimated N input from the cultivated fields of the study area (Figure 4a) ranged from 0.0 to 1584.6 kg, with an average value of 45.1 kg. A high N input, greater than 272.0 kg, was mainly located in the southern part of Hankyung and showed a scattered distribution across the Hanrim area. The total N input from the Hankyung area (1131.9 t) was 1.3 times higher than that from the Hanrim area (862.3 t), because of the larger distribution of total cultivated land in Hankyung (Table 3). In both study regions, a significant N input was estimated for foreign vegetables (Hanrim: 480.8 t, Hankyung: 349.3 t), citrus fruits (Hanrim: 177.3 t, Hankyung: 318.1 t), and bulb vegetables (Hanrim: 146.3 t, Hankyung: 317.9 t).
For the unit areal N input, a large quantity of fertilizer N was applied on the foreign and bulb vegetables in both regions (foreign vegetables: 380.9 kg/ha in Hanrim, 386.7 kg/ha in Hankyung; bulb vegetables: 500.5 kg/ha in Hanrim, 487.1 kg/ha in Hankyung). The fertilizer N input was estimated based on data from the second half of 2018. Therefore, an approximately 2–3 times greater fertilizer N input might be loaded into the subsurface because of the double–triple cropping practice for 1 year.
The estimated surplus N loading (Figure 4b) showed a spatial distribution similar to that of N inputs. Smaller amounts of surplus N loading (0.0–1339.7 kg, average: 29.7 kg) than those of the N input were generally observed because of N removal by crop uptake. Comparisons between the estimated N input and surplus N showed that the cultivated crops absorbed approximately 30–40% of N from the applied fertilizer, indicating that the remaining 60–70% of the applied N would infiltrate into the subsurface and cause groundwater pollution (Table 3). Additionally, Table 3 indicates greater amounts of surplus N loadings from the citrus fruit, foreign vegetable, and bulb vegetable fields for the Hanrim (citrus fruits: 121.3 t ± 52.9 t; foreign vegetables: 239.5 t ± 51.3 t; bulb vegetables: 120.8 t ± 12.2 t) and Hankyung sites (citrus fruits: 222.9 t ± 89.9 t; foreign vegetables: 215.0 t ± 43.1 t; bulb vegetables: 243.9 t ± 42.6 t). Surplus N loading per unit area also showed a similar result to the total N loadings, with the highest values for citrus fruits (Hanrim: 190.6 kg/ha ± 83.1 kg/ha; Hankyung: 206.0 kg/ha ± 83.1 kg/ha), foreign vegetables (Hanrim: 189.7 ± 40.6 kg/ha; Hankyung: 238.0 kg/ha ± 47.7 kg/ha), and bulb vegetables (Hanrim: 413.2 kg/ha ± 41.9 kg/ha; Hankyung: 373.8 kg/ha ± 65.3 kg/ha).

5. Discussion

5.1. Uses of Nitrogen Fertilizers, and NO3-N Contamination in Groundwater

In agricultural areas, intensive use of synthetic fertilizers is directly associated with groundwater quality degradation by NO3-N [9,11,16,53]. On Jeju Island, farmers tend to apply larger amounts of fertilizers than the standard fertilizer application rate, because of the highly permeable volcanic aquifer and thin thickness of the topsoil layer [54]. For example, the average N fertilizer usage amount (323.9 kg/ha) in the study site was 1.6 times higher than that of the N fertilizer sale amounts in South Korea (203.4 kg/ha per year, [27]), although the estimation from Table 3 covered only the second half period of the year. Additionally, the overall NUE at the study site (30–40%) was relatively low compared to that in the European countries (60–65%, [55]) and similar to the NUE in China (39%, [56]). The abundant surplus of N (average: 211.8 kg/ha) in the study area would travel to subsurface and induce NO3-N pollution in groundwater. In the crop fields in the North China Plain [11], nearly 56–91% of total N input (629–3656 kg/ha/yr) turned into the surplus N and it heavily contaminated the shallow groundwater with a maximum NO3-N level of 274.4 mg/L.
To estimate NO3-N concentration leaching into the subsurface aquifer caused by the surplus N loading in the study area, we assumed that most of the surplus N would dissolve in recharged rainwater and infiltrate the aquifer (average precipitation rate in the Hankyung area: 1396 mm, recharge rate: 36.5%, [40]). Significant losses of NO3-N by biogeochemical reactions were not considered because of the high DO (dissolved oxygen) levels of the groundwater samples (average: 9.0 mg/L, [31]) and the high permeability of the aquifer at the study site [38]. The results showed that a total of 1314.9 t of surplus N for the six months would reach the groundwater table, with an average NO3-N concentration of 33.5 mg/L, exceeding the MCL. In the agricultural land in The Netherlands [57], the surplus N loading of 223 kg/ha/year, which was similar to our study, elevated the groundwater NO3-N level over 12 mg/L and area with groundwater NO3-N exceeding the MCL was 29% of the total agricultural land. In the Hanrim and Hanyung areas, various studies have shown that the sources of severe NO3-N contamination in groundwater come from chemical fertilizers applied to agricultural fields, based on a N stable isotope analysis [9,30,32,42,58].
To estimate the spatial trend of N inputs throughout the study area, spatial interpolation was conducted using ArcGIS 10.6 [59]. The 100 × 100 m grids covering the study site were generated, and for each grid, the total N input estimated from Figure 4a was applied. As a result, we obtained a spatial interpolation map of the N input (Figure 5a). A higher application rate of N fertilizer was observed in the northern seaside area of Hanrim and across the entire Hankyung area (Figure 5a). A similar spatial pattern between the interpolation map of the N input and the groundwater NO3-N distribution map in 2018 (Figure 5b) was observed with a statistically significant correlation coefficient, R, of 0.32 (p-value < 0.01). An elevated NO3-N level in groundwater over 5 mg/L matched well with the area having a higher usage of the N input, which implied, again, that the intensive use of chemical fertilizer resulted in the enrichment of the NO3-N concentration in groundwater. Exceptionally high NO3-N concentrations, greater than 10 mg/L, were observed in the western part of Hanrim despite the relatively low N loadings in the area. This site is characterized by the intensive distribution of livestock farms (as shown in Figure 1), indicating that another NO3-N source from animal waste could affect the local groundwater quality in this area [42,43].

5.2. Crop Field Level N Management Strategy

Sustainable N management can be achieved by increasing NUE and crop production and lowering N losses [2,60]. In several European countries, where the Nitrate Directive has been enforced since 1991, decreasing N input trends in recent years have been observed with increases in NUE and a stable crop yield [60,61]. For example, in Denmark, where the usage of agricultural N fertilizers is strictly regulated by the annual permission of N amounts at a farm scale, the average N surplus has been reduced from 170 kg/ha/year to below 100 kg/ha/year during the past 30 years and has brought a positive impact on the aquatic environment [62]. This demonstrates that an ultimate direction to relieve the NO3-N contamination may reduce N inputs from the over-use of synthetic fertilizers in agricultural areas. However, on Jeju Island, the management of NO3-N contamination in groundwater only focuses on the regulations of groundwater well installation near potential contaminant sources and the reorganization of poorly grouted wells [63]. Therefore, in this study, we suggested an effective N management strategy based on crop field level N input estimation.
To establish more efficient N management measures against groundwater contamination from the fertilizers, we categorized the N inputs at the crop field level into three management classes (MC1–MC3). EU countries regulate organic fertilizer use based on the criterion limiting N loading [64]. In this study, we adopted the EU criteria to delineate the management class based on N fertilizer inputs. First, we developed a histogram showing the total cultivated areas for each interval of the N input (<100 kg/ha/year, 100 –<170 kg/ha/year, 170 –<250 kg/ha/year, 250 –<300 kg/ha/year, 300 –<350 kg/ha/year, and ≥350 kg/ha/year), and assessed its cumulative percentage (Figure 6). We defined the management class based on two inflection points, which corresponded to 170 kg/ha/year and 250 kg/ha/year. The management class 1 (MC1) regions were defined as cultivated fields receiving N input over 250 kg/ha/year. Class 2 (MC2) and class 3 (MC3) regions corresponded to the crop fields with a N input between 170 and 250 kg/ha/year and less than 170 kg/ha/year, respectively (Figure 7).
The MC1 regions (total area: 1024 ha) are most likely to impose NO3-N pollution on groundwater; thus, the reinforced NO3-N management plans need to be implemented, including (1) a restriction on the cultivation of crops that require a high amount of fertilizer use, (2) an adjustment of the fertilizer application rate after analyzing the soil N content, (3) cultivating catch crops to uptake residual N in soils after the crop yield, (4) monitoring soil N content, and (5) raising awareness programs for farmers to reduce fertilizer use. For the MC2 regions (total area: 2745 ha), more relaxed management measures could be adopted, including (1) using the standard fertilizer amount, (2) cultivating catch crops, (3) monitoring soil N, and (4) raising awareness programs. For the MC3 regions (total area: 10,848 ha), we recommend applying the present regulations without additional measures if total N inputs do not show significant increases.
Efforts to reduce N losses from fertilizer use hardly achieve an immediate effect in a short time. The subsurface aquifer system shows a delayed response to changes in the surface environment, which can be explained by the concept of groundwater residence time [36]. In Jeju, the groundwater residence time is estimated to be between 2 and 53 years (average: 19 years) [65], indicating that several decades are required to relieve the NO3-N pollution in groundwater. This demonstrates that reduction in the N loading is an essential action to solve the NO3-N problems; thus, the N management plans on Jeju Island should be conducted from a long-term perspective. Moreover, under the crop cultivation system in Jeju, which is based on small agricultural fields, a reliable map of the crop field level N input could be developed for establishing effective NO3-N management plans by reflecting the local heterogeneity in fertilizer N use. This can be an administrative ground for farmers to understand better and follow the NO3-N management regulations.

6. Conclusions

We estimated the crop level application rate of synthetic N fertilizers and types of cultivated crops during the second half of 2018, in 44,253 small crop fields covering an area of 7730 ha through an intensive survey analysis. Sixty-eight crops were cultivated in the study area, receiving 1994.2 t (323.9 kg/ha) of N fertilizer input. The results showed that several types of crops (green garlic, potato, and chives) used a 1.73–4.95 times higher amount of N fertilizer than the standard fertilizer application rate. The cultivated crops in the study area consumed approximately 35% of the fertilized N input (112.1 kg/ha), and the remaining N (211.8 kg/ha) remained in the subsurface as the surplus N loading. A total of 1314.9 t of surplus N loading could degrade the groundwater quality by enriching the NO3-N level to 33.5 mg/L. This study also confirmed that the over-use of N fertilizer shows a similar spatial distribution to the groundwater NO3-N level, with statistical significance (R: 0.31, p-value < 0.01). To increase the NUE and decrease the surplus N, crop field level N management was suggested, in which different management plans were established based on the input amounts of N fertilizer. This study emphasized the importance of constructing actual farm data (a type of cultivated crop and the fertilizer application rate) at a crop field level to understand the behavior of fertilizer over-use and prepare proper measures to mitigate groundwater pollution induced by agricultural activities.

Supplementary Materials

The following are available online at https://www.mdpi.com/article/10.3390/w13192715/s1, Table S1: questionnaire form for surveying farm data, Table S2: nitrogen uptake amount by crops.

Author Contributions

E.-H.K.: analysis and writing—original draft preparation; B.-S.H.: investigation and data curation; E.L.: writing—review and editing; M.-C.K.: investigation and visualization; B.-R.K.: conceptualization and analysis; W.-B.P.: supervision and review; S.-C.J.: funding acquisition. All authors have read and agreed to the published version of the manuscript.

Funding

This research was supported by the Korea Ministry of Environment as “The SEM projects; RE2020002470001”.

Acknowledgments

We thank Ho-Jun Kang of the Jeju Special Self-Governing Province Agricultural Research and Extension Services for his help in investing in cultivated crops.

Conflicts of Interest

The authors declare no conflict of interest.

References

  1. Lu, C.; Tian, H. Global nitrogen and phosphorus fertilizer use for agriculture production in the past half century: Shifted hot spots and nutrient imbalance. Earth Syst. Sci. Data 2017, 9, 181–192. [Google Scholar] [CrossRef] [Green Version]
  2. Bouwman, A.F.; Beusen, A.H.W.; Lassaletta, L.; van Apeldoorn, D.F.; van Grinsven, H.J.M.; Zhang, J.; Ittersum van, M.K. Lessons from temporal and spatial patterns in global use of N and P fertilizer on cropland. Sci. Rep. 2017, 7, 40366. [Google Scholar] [CrossRef] [PubMed] [Green Version]
  3. Cho, H.M.; Kim, G.; Shin, K.H. Tracing nitrogen sources fueling coastal green tides off a volcanic island using radon and nitrogen isotopic tracers. Sci. Total Environ. 2019, 665, 913–919. [Google Scholar] [CrossRef] [PubMed]
  4. Glibert, P.M.; Harrison, J.; Heil, C.; Seitzinger, S. Escalating worldwide use of urea—A global change contributing to coastal eutrophication. Biogeochemistry 2006, 77, 441–463. [Google Scholar] [CrossRef]
  5. Snyder, C.S.; Bruulsema, T.W.; Jensen, T.L.; Fixen, P.E. Review of greenhouse gas emissions from crop production systems and fertilizer management effects. Agric. Ecosyst. Environ. 2009, 133, 247–266. [Google Scholar] [CrossRef]
  6. Xiao, G.; Zhao, Z.; Liang, L.; Meng, F.; Wu, W.; Guo, Y. Improving nitrogen and water use efficiency in a wheat-maize rotation system in the North China Plain using optimized farming practices. Agric. Water Manag. 2019, 212, 172–180. [Google Scholar] [CrossRef]
  7. Tian, D.; Niu, S. A global analysis of soil acidification caused by nitrogen addition. Environ. Res. Lett. 2015, 10, 024019. [Google Scholar] [CrossRef]
  8. Green, C.T.; Bekins, B.A.; Kalkhoff, S.J.; Hirsch, R.M.; Liao, L.; Barnes, K.K. Decadal surface water quality trends under variable climate, land use, and hydrogeochemical setting in lowa, USA. Water Resour. Res. 2014, 50, 2425–2443. [Google Scholar] [CrossRef]
  9. Koh, E.H.; Kaown, D.; Mayer, B.; Kang, B.R.; Moon, H.S.; Lee, K.K. Hydrogeochemistry and isotopic tracing of nitrate contamination of two aquifer systems on Jeju Island, Korea. J. Environ. Qual. 2012, 41, 1835–1845. [Google Scholar] [CrossRef] [PubMed]
  10. Wang, M.; Lu, B.; Wang, J.; Zhang, H.; Guo, L.; Lin, H. Using Dual Isotopes and a Bayesian Isotope Mixing Model to Evaluate Nitrate Sources of Surface Water in a Drinking Water Source Watershed, East China. Water 2016, 8, 355. [Google Scholar] [CrossRef] [Green Version]
  11. Ju, X.T.; Kou, C.L.; Zhang, F.S.; Christie, P. Nitrogen balance and groundwater nitrate contamination: Comparison among three intensive cropping systems on the North China Plain. Environ. Pollut. 2006, 143, 117–125. [Google Scholar] [CrossRef] [Green Version]
  12. Barton, L.; Schipper, L.A.; Barkle, G.F.; McLeod, M.; Speir, T.W.; Taylor, M.D.; McGill, A.C.; van Schaik, A.P.; Fitzgerald, N.B.; Pandey, S.P. Land application of domestic effluent onto four soil types: Plant uptake and nutrient leaching. J. Environ. Qual. 2005, 34, 635–643. [Google Scholar] [CrossRef]
  13. Constantin, J.; Mary, B.; Laurent, F.; Aubrion, G.; Fontaine, A.; Kerveillant, P.; Beaudoin, N. Effects of catch crops, no till and reduced nitrogen fertilization on nitrogen leaching and balance in three long-term experiments. Agric. Ecosyst. Environ. 2010, 135, 268–278. [Google Scholar] [CrossRef]
  14. Jalali, M. Nitrates leaching from agricultural land in Hamadan, western Iran. Agric. Ecosyst. Environ. 2005, 110, 210–218. [Google Scholar] [CrossRef]
  15. Colombani, N.; Mastrocicco, M.; Vincenzi, F.; Castaldelli, G. Modeling Soil Nitrate Accumulation and Leaching in Conventional and Conservation Agriculture Cropping Systems. Water 2020, 12, 1571. [Google Scholar] [CrossRef]
  16. Alikhani, J.; Deinhart, A.; Visser, A.; Bibby, R.; Purtshert, R.; Moran, J.; Massoudieh, A.; Esser, B. Nitrate vulnerability projections from Bayesian inference of multiple groundwater age tracers. J. Hydrol. 2016, 543, 167–181. [Google Scholar] [CrossRef] [Green Version]
  17. Burow, K.R.; Shelton, J.L.; Dubrovsky, N.M. Regional nitrate and pesticide trends in ground water in the eastern San Joaquin Valley, California. J. Environ. Qual. 2008, 37, S249–S263. [Google Scholar] [CrossRef] [PubMed] [Green Version]
  18. McMahon, P.B.; Böhlke, J.K.; Kauffman, L.J.; Kipp, K.L.; Landon, M.K.; Crandall, C.A.; Burow, K.R.; Brown, C.J. Source and transport controls on the movement of nitrate to public supply wells in selected principal aquifers of the United States. Water Resour. Res. 2008, 44, W04401. [Google Scholar] [CrossRef] [Green Version]
  19. Alexander, R.B.; Smith, R.A. County-Level Estimates of Nitrogen and Phosphorus Use in the United States, 1945–1985; US Geological Survey: Fairfax, VA, USA, 1990.
  20. Battaglin, W.A.; Goolsby, D.A. Spatial Data in Geographic Information System Format on Agricultural Chemical Use—Land Use, and Cropping Practices in the United States; U.S. Geological Survey: Fairfax, VA, USA, 1995; Volume 94, p. 4176.
  21. Cao, P.; Lu, C.; Yu, Z. Historical nitrogen fertilizer use in agricultural ecosystems of the contiguous United States during 1850–2015: Application rate, timing, and fertilizer types. Earth Syst. Sci. Data 2018, 10, 969–984. [Google Scholar] [CrossRef] [Green Version]
  22. Ruddy, B.C.; Lorenz, D.L.; Mueller, D.K. County-level estimates of nutrient inputs to the land surface of the conterminous United States, 1982–2001. U.S. In Geological Survey Scientific Investigations Report 2006, 2006-5012; USGS: Fairfax, VA, USA, 2006. [Google Scholar]
  23. Huffman, T.; Yang, J.Y.; Drury, C.F.; De Jong, R.; Yang, X.M.; Liu, Y.C. Estimation of Canadian manure and fertilizer nitrogen application rates at the crop and soil-landscape polygon level. Can. J. Soil Sci. 2008, 88, 619–627. [Google Scholar] [CrossRef] [Green Version]
  24. Quemada, M.; Lassaletta, L.; Jensen, L.S.; Godinot, O.; Brentrup, F.; Buckley, C.; Foray, S.; Hvid, S.K.; Oenema, J.; Richards, K.G.; et al. Exploring nitrogen indicators of farm performance among farm types across several European case studies. Agric. Syst. 2020, 177, 102689. [Google Scholar] [CrossRef]
  25. Bierman, P.M.; Rosen, C.J.; Venterea, R.T.; Lamb, J.A. Survey of nitrogen fertilizer use on corn in Minnesota. Agric. Syst. 2012, 109, 43–52. [Google Scholar] [CrossRef]
  26. Korea Rural Economic Institute. A Case Study of Agricultural Statistics for Supporting Agricultural and Rural Policy; KREI: Seoul, Korea, 2018. [Google Scholar]
  27. Ministry of Agriculture, Food and Rural Affairs (MAFRA). Agriculture, Food and Rural Affairs Statistics Yearbook 2020; MAFRA: Sejong, Korea, 2020.
  28. Jeju Research Institute. Research of Water Quality Improvement and Methods for Pollution Prevention of Groundwater; Jeju Research Institute: Jeju City, Korea, 2019. [Google Scholar]
  29. Koh, E.H.; Lee, S.H.; Kaown, D.; Moon, H.S.; Lee, E.; Lee, K.K.; Kang, B.R. Impacts of land use change and groundwater management on long-term nitrate–nitrogen and chloride trends in groundwater of Jeju Island, Korea. Environ. Earth Sci. 2017, 76, 176. [Google Scholar] [CrossRef]
  30. Choung, S.W.; Woo, N.C.; Lee, K.S. Temporal & Spatial variations of groundwater quality in Hanlim, Jeju Island. J. Geol. Soc. Korea 2004, 40, 537–558. [Google Scholar]
  31. Koh, D.C.; Cheon, S.H.; Park, K.H. Characterization of groundwater quality and recharge using periodic measurements of hydrogeochemical parameters and environmental tracers in basaltic aquifer of Jeju Island. J. Soil Ground. Environ. 2007, 12, 60–71. [Google Scholar]
  32. Koh, D.-C.; Chang, H.-W.; Lee, K.-S.; Ko, K.-S.; Kim, Y.; Park, W.-B. Hydrogeochemistry and environmental isotopes of ground water in Jeju volcanic island, Korea: Implications for nitrate contamination. Hydrol. Process. 2005, 19, 2225–2245. [Google Scholar] [CrossRef]
  33. Kim, G.B.; Kim, J.W.; Won, J.H.; Koh, G.W. Regional trend analysis for groundwater quality in Jeju Island: Focusing on chloride and nitrate concentrations. J. Korea Water Resour. Assoc. 2007, 40, 469–483. [Google Scholar] [CrossRef] [Green Version]
  34. Koh, D.C.; Plummer, L.N.; Solomon, D.K.; Busenberg, E.; Kim, Y.J.; Chang, H.W. Application of environmental tracers to mixing, evolution, and nitrate contamination of ground water in Jeju Island, Korea. J. Hydrol. 2006, 327, 258–275. [Google Scholar] [CrossRef]
  35. Koh, E.H.; Lee, E.; Lee, K.K. Impact of leaky wells on nitrate cross-contamination in a layered aquifer system: Methodology for and demonstration of quantitative assessment and prediction. J. Hydrol. 2016, 541, 1133–1144. [Google Scholar] [CrossRef]
  36. Koh, E.H.; Lee, E.; Kaown, D.; Green, C.T.; Koh, D.C.; Lee, K.K.; Lee, S.H. Comparison of groundwater age models for assessing nitrate loading, transport pathways, and management options in a complex aquifer system. Hydrol. Process. 2018, 32, 923–938. [Google Scholar] [CrossRef]
  37. Koh, G.W. Characteristics of the Groundwater and Hydrogeologic Implication of the Seoquipo Formation in Cheju Island. Ph.D. Thesis, Busan National University, Busan City, Korea, 1997. [Google Scholar]
  38. Won, J.H.; Lee, J.Y.; Kim, J.W.; Koh, G.W. Groundwater occurrence on Jeju Island, Korea. Hydrogeol. J. 2006, 14, 532–547. [Google Scholar] [CrossRef]
  39. Korea Meteorological Administration. Available online: http://www.kma.go.kr (accessed on 14 January 2021).
  40. Jeju Special Self-Governing Province. 2018–2022. Comprehensive Plan for Managing Water Resource in Jeju Special Self-Governing Province; Jeju Special Self-Governing Province: Jeju City, Korea, 2018.
  41. Food and Agriculture Organization of the United Nations. Tube Well Irrigation Project, Republic of Korea: Groundwater Resources of Selected Area of Cheju Island and the Mainland; UNDP Tech. Rep. 1972, DP. ROK/68/524; FAO: Rome, Italy, 1972. [Google Scholar]
  42. Hyun, G.T.; Song, S.T.; Joa, D.H.; Ko, Y.H. Characteristics of groundwater and soil contamination in Hallim area of Jeju Island. J. Soil Ground. Environ. 2010, 15, 44–51. [Google Scholar]
  43. Kim, S.H.; Kim, H.R.; Yu, S.; Kang, H.J.; Hyun, I.H.; Song, Y.C.; Kim, H.; Yun, S.T. Shift of nitrate sources in groundwater due to intensive livestock farming on Jeju Island, South Korea: With emphasis on legacy effects on water management. Water Res. 2021, 191, 116814. [Google Scholar] [CrossRef]
  44. Oh, S.S.; Hyun, I.H.; Song, Y.C.; Kim, S.M.; Kim, S.J.; Kang, B.R. Effect of surplus nitrate–nitrogen in the farm on the groundwater quality. In Environmental Resource Research, 21st Report of JIHE, Jeju Special Self-Governing Province, Korea; Jeju Research Institute of Public Health and Environment: Jeju City, Korea, 2010; pp. 135–155. [Google Scholar]
  45. Agricultural Research & Extension Services. Integrated Nutrition Management for Crop Cultivation; Agricultural Research & Extension Services: Wanju City, Korea, 2005.
  46. Badr, M.A.; Abou-Hussein, S.D.; El-Tohamy, W.A. Tomato yield, nitrogen uptake and water use efficiency as affected by planting geometry and level of nitrogen in an arid region. Agric. Water Manag. 2016, 169, 90–97. [Google Scholar] [CrossRef]
  47. Jeju Agricultural Research & Extension Services. Manual of Organic Broccoli Farming; Jeju Agricultural Research & Extension Services: Seogwipo City, Korea, 2015.
  48. Jeju Agricultural Research & Extension Services. Manual of Organic Garlic Farming; Jeju Agricultural Research & Extension Services: Seogwipo City, Korea, 2019.
  49. Karklins, A.; Ruza, A. Nitrogen apparent recovery can be used as the indicator of soil nitrogen supply. Zemdirb. Agric. 2015, 102, 133–140. [Google Scholar] [CrossRef]
  50. Nasreen, S.; Haque, M.M.; Hossain, M.A.; Farid, A.T.M. Nutrient uptake and yield of onion as influenced by nitrogen and sulphur fertilization. Bangladesh J. Agric. Res. 2007, 32, 413–420. [Google Scholar] [CrossRef] [Green Version]
  51. National Institute of Agricultural Sciences and Technology. Test Research Report; National Institute of Agricultural Sciences and Technology: Jeonju City, Korea, 2000.
  52. Seogwipo Agricultural Research & Extension Services. Standard Fertilizer Usage of Kohlrabi in Jeju Island; Agricultural Research & Extension Services: Seogwipo, Korea, 2021.
  53. Nolan, B.T.; Stoner, J.D. Nutrients in groundwaters of the conterminous United States, 1992–1995. Environ. Sci. Technol. 2000, 34, 1156–1165. [Google Scholar] [CrossRef] [Green Version]
  54. Jejudo. White Paper of the Environment. 2002. [Google Scholar]
  55. Schröder, J.J.; Aarts, H.F.M.; ten Berge, H.F.M.; van Keulen, H.; Neeteson, J.J. An evaluation of whole-farm nitrogen balances and related indices for efficient nitrogen use. Eur. J. Agron. 2003, 20, 33–44. [Google Scholar] [CrossRef]
  56. Gu, B.; Ju, X.; Chang, S.X.; Ge, Y.; Chang, J. Nitrogen use efficiencies in Chinese agricultural systems and implications for food security and environmental protection. Reg. Environ. Chang. 2017, 17, 1217–1227. [Google Scholar] [CrossRef]
  57. Oenema, O.; Boers, P.C.M.; van Eerdt, M.M.; Fraters, B.; van der Meer, H.G.; Roest, C.W.J.; Schröder, J.J.; Willems, W.J. Leaching of nitrate from agriculture to groundwater: The effect of policies and measures in the Netherlands. Environ. Pollut. 1998, 102 (Suppl. 1), 471–478. [Google Scholar] [CrossRef]
  58. Oh, Y.K.; Hyun, I.H. Estimation of nitrate–nitrogen contamination sources in Cheju Island groundwater using δ15N values. J. Korean Soc. Soil Ground. Environ. 1997, 4, 1–4. [Google Scholar]
  59. ESRI. ArcGIS Desktop: Release 10; ESRI, Inc.: Redlands, CA, USA, 2018; p. 6. [Google Scholar]
  60. Hansen, B.; Thorling, L.; Schullehner, J.; Termansen, M.; Dalgaard, T. Groundwater nitrate response to sustainable nitrogen management. Sci. Rep. 2017, 7, 8566. [Google Scholar] [CrossRef]
  61. Lassaletta, L.; Billen, G.; Grizzetti, B.; Anglade, J.; Garnier, J. 50 year trends in nitrogen use efficiency of world cropping systems: The relationship between yield and nitrogen input to cropland. Environ. Res. Lett. 2014, 9, 105011. [Google Scholar] [CrossRef]
  62. Dalgaard, T.; Hansen, B.; Hasler, B.; Hertel, O.; Hutchings, N.J.; Jacobsen, B.H.; Stoumann Jensen, L.; Kronvang, B.; Olesen, J.E.; Schjørring, J.K.; et al. Policies for agricultural nitrogen management—Trends, challenges and prospects for improved efficiency in Denmark. Environ. Res. Lett. 2014, 9, 115002. [Google Scholar] [CrossRef]
  63. Jeju Special Self-Governing Province. Regulations for Managing Groundwater; Jeju Special Self-Governing Province: Jeju City, Korea, 2020.
  64. EU Commission. Directive 91/676/EEC. Council Directive of 12 December 1991 concerning the protection of waters against pollution caused by nitrates from agricultural sources. Off. J. Eur. Community 1991, L375, 1–8. [Google Scholar]
  65. Jejudo. Research of Hydrogeology and Groundwater Resource of Jeju Island(I). 2001. [Google Scholar]
Figure 1. (a) Location map of Jeju Island and (b) the Hanrim and Hankyung study areas, showing livestock farms and land use (2016).
Water 13 02715 g001
Figure 2. N fertilizer usages per unit area and ratio of actual N fertilizer use divided by standard N fertilizer use (Factual/Fstandard).
Water 13 02715 g002
Figure 3. Spatial map of cultivated crops during the second half of 2018.
Water 13 02715 g003
Figure 4. Spatial distribution of (a) N input and (b) surplus N loading across the study area during the second half of 2018.
Water 13 02715 g004
Figure 5. Map of (a) spatially interpolated N input and (b) groundwater NO3-N level over the study area.
Water 13 02715 g005
Figure 6. Histogram showing total cultivated area for different intervals of N input (orange bar) and its cumulative percentage (blue line).
Water 13 02715 g006
Figure 7. Suggested management zones for controlling N fertilizer use.
Water 13 02715 g007
Table 1. Information on cultivated crops, fertilizer usage, and standard fertilizer use, from the survey.
Cultivated CropThe Number of Crop FieldCultivated AreaTotal N Fertilizer Usages N Fertilizer Usages per Unit Area Standard N Fertilizer Usages N Fertilizer Usages/Standard N Fertilizer Usages (Factual/Fstandard)
hakgkg/hakg/ha
White radish70916830,4081812800.65
Barley54113915,362110801.38
Garlic3968926,9313032501.21
Broccoli3478227,2513333201.04
Millet25962430069900.77
Cabbage1664613,2282863200.89
Kohlrabi1472980162742601.05
Onion1123010,5273462401.44
Beet1082371823183200.99
Cheonhyehyang citrus a962626981031740.59
Sesame741688155800.69
Lawn66154848316993.19
Open-field citrus a551719121121740.65
Hanrabong citrus a411016341671740.96
Green garlic31735894951004.95
Red cabbage23718302792501.11
Potato23515683291003.29
Brussels sprout19517603683201.15
Dry-field rice plant19550698801.23
Chives19311393642101.73
Red Hyang citrus a18811651441740.83
House citrus a155253551740.32
Bean13316061800.76
Wheat813434820.41
Cherry tomato82176832260.37
Corn711801241580.79
Buckwheat619593821.13
Etc. b40912991422800.65
a Different types of citrus; b Etc.: tomatoes, Hwang Geum Hyang citruses, pumpkins, chilies, large green onions, deodeok, Chinese cabbage, watermelons, rape, green onions, strawberries, and sweet potatoes.
Table 2. Cultivated crops and area in the Hankyung and Hanrim study regions.
Major Crop TypeCrop NameEntire AreaHanrimHankyung
ha
Citrus fruitsCheonhyehyang, Open-field citrus, Hanrabong, Red Hyang, House citrus, Hwang Geum Hyang1718.7
(23.0%)
636.5
(18.9%)
1082.2
(26.4%)
Foreign vegetablesCabbage, Broccoli, Red cabbage, Beet, Cauliflower, Kohlrabi, Chicory2165.6
(29.0%)
1262.3
(37.5%)
903.3
(22.0%)
Bulb vegetablesGarlic, Onion, Chives, Large green onion, Green onion944.9
(12.7%)
292.3
(8.7%)
652.6
(15.9%)
Food cropsPotato, Sweet potato, Millet, Bean, Wheat, Corn, Buckwheat853.1
(11.4%)
431.3
(12.8%)
421.7
(10.3%)
Green vegetablesChinese cabbage, Kale, Dropwort, Lettuce20.7
(0.3%)
11.7
(0.3%)
9.0
(0.2%)
Root vegetablesWhite radish, Carrot267.7
(3.6%)
15.1
(0.4%)
252.6
(6.2%)
Fruit vegetablesPersimmon, Tomato, Cherry tomato, Strawberry, Red pepper, Plum, Blueberry, Pumpkin, Watermelon, Chili89.8
(1.2%)
41.8
(1.2%)
48.1
(1.2%)
Special-use cropsDeodeok, Cactus, Balloon flower76.8
(1.0%)
25.8
(0.8%)
51.0
(1.2%)
Other cropsLandscape tree71.1
(1.0%)
45.2
(1.3%)
25.9
(0.6%)
Fallow land 1255.6
(16.8%)
601.8
(17.9%)
653.8
(15.9%)
Total area 7463.9
(100.0%)
3363.7
(100.0%)
4100.1
(100.0%)
Table 3. N fertilizer input in the Hanrim and Hankyung areas.
Cultivated CropHanrimHankyung
N InputSurplus NN InputSurplus N
tkg/hatkg/hatkg/hatkg/ha
Total862.3317.2521.2
(±120.9)
191.7
(±44.5)
1131.9330.6793.7
(±120.9)
231.8
(±71.9)
Citrus fruits177.3278.6121.3
(±52.9)
190.6
(±83.1)
318.1293.9222.9
(±89.9)
206.0
(±83.1)
Foreign vegetables480.8380.9239.5
(±51.3)
189.7
(±40.6)
349.3386.7215.0
(±43.1)
238.0
(±47.7)
Bulb vegetables146.3500.5120.8
(±12.2)
413.2
(±41.9)
317.9487.1243.9
(±42.6)
373.8
(±65.3)
Food crops39.190.74.7
(±2.0)
11.0
(±4.7)
53.1125.820.8
(±9.0)
49.3
(±21.3)
Green vegetables3.9332.02.1
(±0.5)
183.6
(±39.0)
3.9429.21.6
(±0.8)
181.7
(±94.6)
Root vegetables4.4294.22.4
(±0.4)
160.2
(±26.0)
75.8300.040.4
(±4.6)
160.0
(±18.4)
Fruit vegetables7.2171.43.3
(±1.2)
79.3
(±29.0)
9.0187.64.3
(±1.5)
89.3
(±30.8)
Special-use crops2.6101.30.4
(±0.2)
14.5
(±9.6)
4.486.00.6
(±0.4)
12.1
(±7.3)
Other crops0.614.30.5
(±0.1)
11.1
(±2.6)
0.519.30.1
(±0.0)
4.3
(±0.9)
Publisher’s Note: MDPI stays neutral with regard to jurisdictional claims in published maps and institutional affiliations.

