Article

Assessment of Drought Severity and Vulnerability in the Lam Phaniang River Basin, Thailand

by
Kittiwet Kuntiyawichai
1,2,* and
Sarayut Wongsasri
1,2
1
Sustainable Infrastructure Research and Development Center, Department of Civil Engineering, Faculty of Engineering, Khon Kaen University, Khon Kaen 40002, Thailand
2
Center for Water Resources Engineering and Environment, Faculty of Engineering, Khon Kaen University, Khon Kaen 40002, Thailand
*
Author to whom correspondence should be addressed.
Water 2021, 13(19), 2743; https://doi.org/10.3390/w13192743
Submission received: 26 August 2021 / Revised: 23 September 2021 / Accepted: 25 September 2021 / Published: 2 October 2021
(This article belongs to the Section Hydrology)

Abstract

:
The Lam Phaniang River Basin is one of the areas in Northeast Thailand that experiences persistent drought almost every year. Therefore, this study was focused on the assessment of drought severity and vulnerability in the Lam Phaniang River Basin. The evaluation of drought severity was based on the Drought Hazard Index (DHI), which was derived from the Standardized Precipitation-Evapotranspiration Index (SPEI) calculated for 3-month (short-term), 12-month (intermediate-term), and 24-month (long-term) periods. Drought vulnerability was assessed by the Drought Vulnerability Index (DVI), which relied on water shortage, water demand, and runoff calculated from the WEAP model, and the Gross Provincial Product (GPP) data. A drought risk map was generated by multiplying the DHI and DVI indices, and the drought risk level was then defined afterwards. The CNRM-CM5, EC-EARTH, and NorESM1-M global climate simulations, and the TerrSet software were used to evaluate the potential impacts of future climate under RCPs 4.5 and 8.5, and land use during 2021–2100, respectively. The main findings compared to baseline (2000–2017) revealed that the average results of future rainfall, and maximum and minimum temperatures were expected to increase by 1.41 mm, and 0.015 °C/year and 0.019 °C/year, respectively, under RCP 4.5 and by 2.72 mm, and 0.034 °C/year and 0.044 °C/year, respectively, under RCP 8.5. During 2061–2080 under RCP 8.5, the future annual water demand and water shortage were projected to decrease by a maximum of 31.81% and 51.61%, respectively. Obviously, in the Lam Phaniang River Basin, the upper and lower parts were mainly dominated by low and moderate drought risk levels at all time scales under RCPs 4.5 and 8.5. Focusing on the central part, from 2021–2040, a very high risk of intermediate- and long-term droughts under RCPs 4.5 and 8.5 dominated, and occurred under RCP 8.5 from 2041–2060. From 2061 to 2080, at all time scales, the highest risk was identified under RCP 4.5, while low and moderate levels were found under RCP 8.5. From 2081–2100, the central region was found to be at low and moderate risk at all time scales under RCPs 4.5 and 8.5. Eventually, the obtained findings will enable stakeholders to formulate better proactive drought monitoring, so that preparedness, adaptation, and resilience to droughts can be strengthened.

1. Introduction

Presently, the people living in the Northeast of Thailand are now facing a water scarcity problem almost every year, especially for household consumption during the dry season [1,2]. The continuation of rainfall variability due to climate change will also lead to severe drought, particularly water shortages for agriculture, which results in decreased soil moisture, affecting crop growth and its yield [3,4,5]. The likelihood of drought and climate change occurrences can also threaten other water users, particularly those in the industrial and ecological systems. The above statements are supported by various studies, which demonstrate adverse impacts on multiple stakeholders. For instance, the investigation carried out by Babel et al. [6] regarding the effects of climate change on rainfed rice yield in Northeast Thailand using the CERES-rice crop growth model. The obtained results revealed that, under the ECHAM4 A2 climate scenario, a declining trend in rice yield was observed by 17.81%, 27.59%, and 24.34% for the 2020s, 2050s and 2080s, respectively, compared to the average yield during 1997–2006. In addition, Polthanee et al. [7] also studied rainfall characteristics in Northeast Thailand in relation to the impacts of drought on rice production in 2012, as well as assessing drought adaptation strategies of farmers. It was found that the mean annual rainfall recorded at Nakhon Ratchasima Province in 2012 declined by 239 mm compared to the mean value during the reference period 2001–2011 (1204 mm), while the mean annual rainfall observed at Kalasin Province in 2012 was also found to be decreased by 375 mm in comparison to the baseline (1508 mm). Furthermore, the actual yield loss due to drought was estimated to be 59–68% in Nakhon Ratchasima Province and 55–65% in Kalasin Province, respectively, in comparison to the attainable yield. Regarding the adaptation strategies, the farmers introduced crop diversification for short-term adaptation options, changed land use patterns for long-term adaptation options, and built on farm ponds in the paddy fields, in order to cope with drought impacts. Similarly, Prabnakorn et al. [8] also investigated past climatic conditions (1984–2013) and assessed the impacts of recent climate trends on rice yields in the Mun River Basin in Northeast Thailand. The main findings indicated that the total yield losses due to past climate trends are rather low, by less than 50 kg/ha per decade (3% of actual average yields). However, the future yield reduction is likely to be more serious if the observed trends in temperature and rainfall remain the same. That is to say, the increasing trend of maximum temperature, especially reaching more than 35 °C in October, may lead to spikelet sterility and severe yield losses. Likewise, the increasing trend of rainfall and its intensity occurring in September may also lead to more severe yield losses. Due to the above shortcoming, this study was then highlighted on the assessment of drought severity and vulnerability in the Lam Phaniang River Basin, where the pattern and consequences of recurrent drought was found to be a prominent event in this study area. According to the Department of Water Resources [9], it was revealed that the Lam Phaniang River Basin is highly prone to drought compared to other sub-basins, with about 55.7% of its total area under extreme drought conditions, whereas approximately 27.4% fall in moderate drought conditions. In this study, three indicators, i.e., meteorological drought index, spatial sensitivity of drought, and adaptive capacity to climate change, were used to evaluate the drought severity. Moreover, additional recurrent and intense droughts were also investigated under climate and land use changes, including mapping of drought risk areas at the sub-basin scale. Eventually, the main findings from this study might be beneficial for developing frameworks and plans regarding equity, efficiency and sustainability in water allocation in the Lam Phaniang River Basin.

2. Materials and Methods
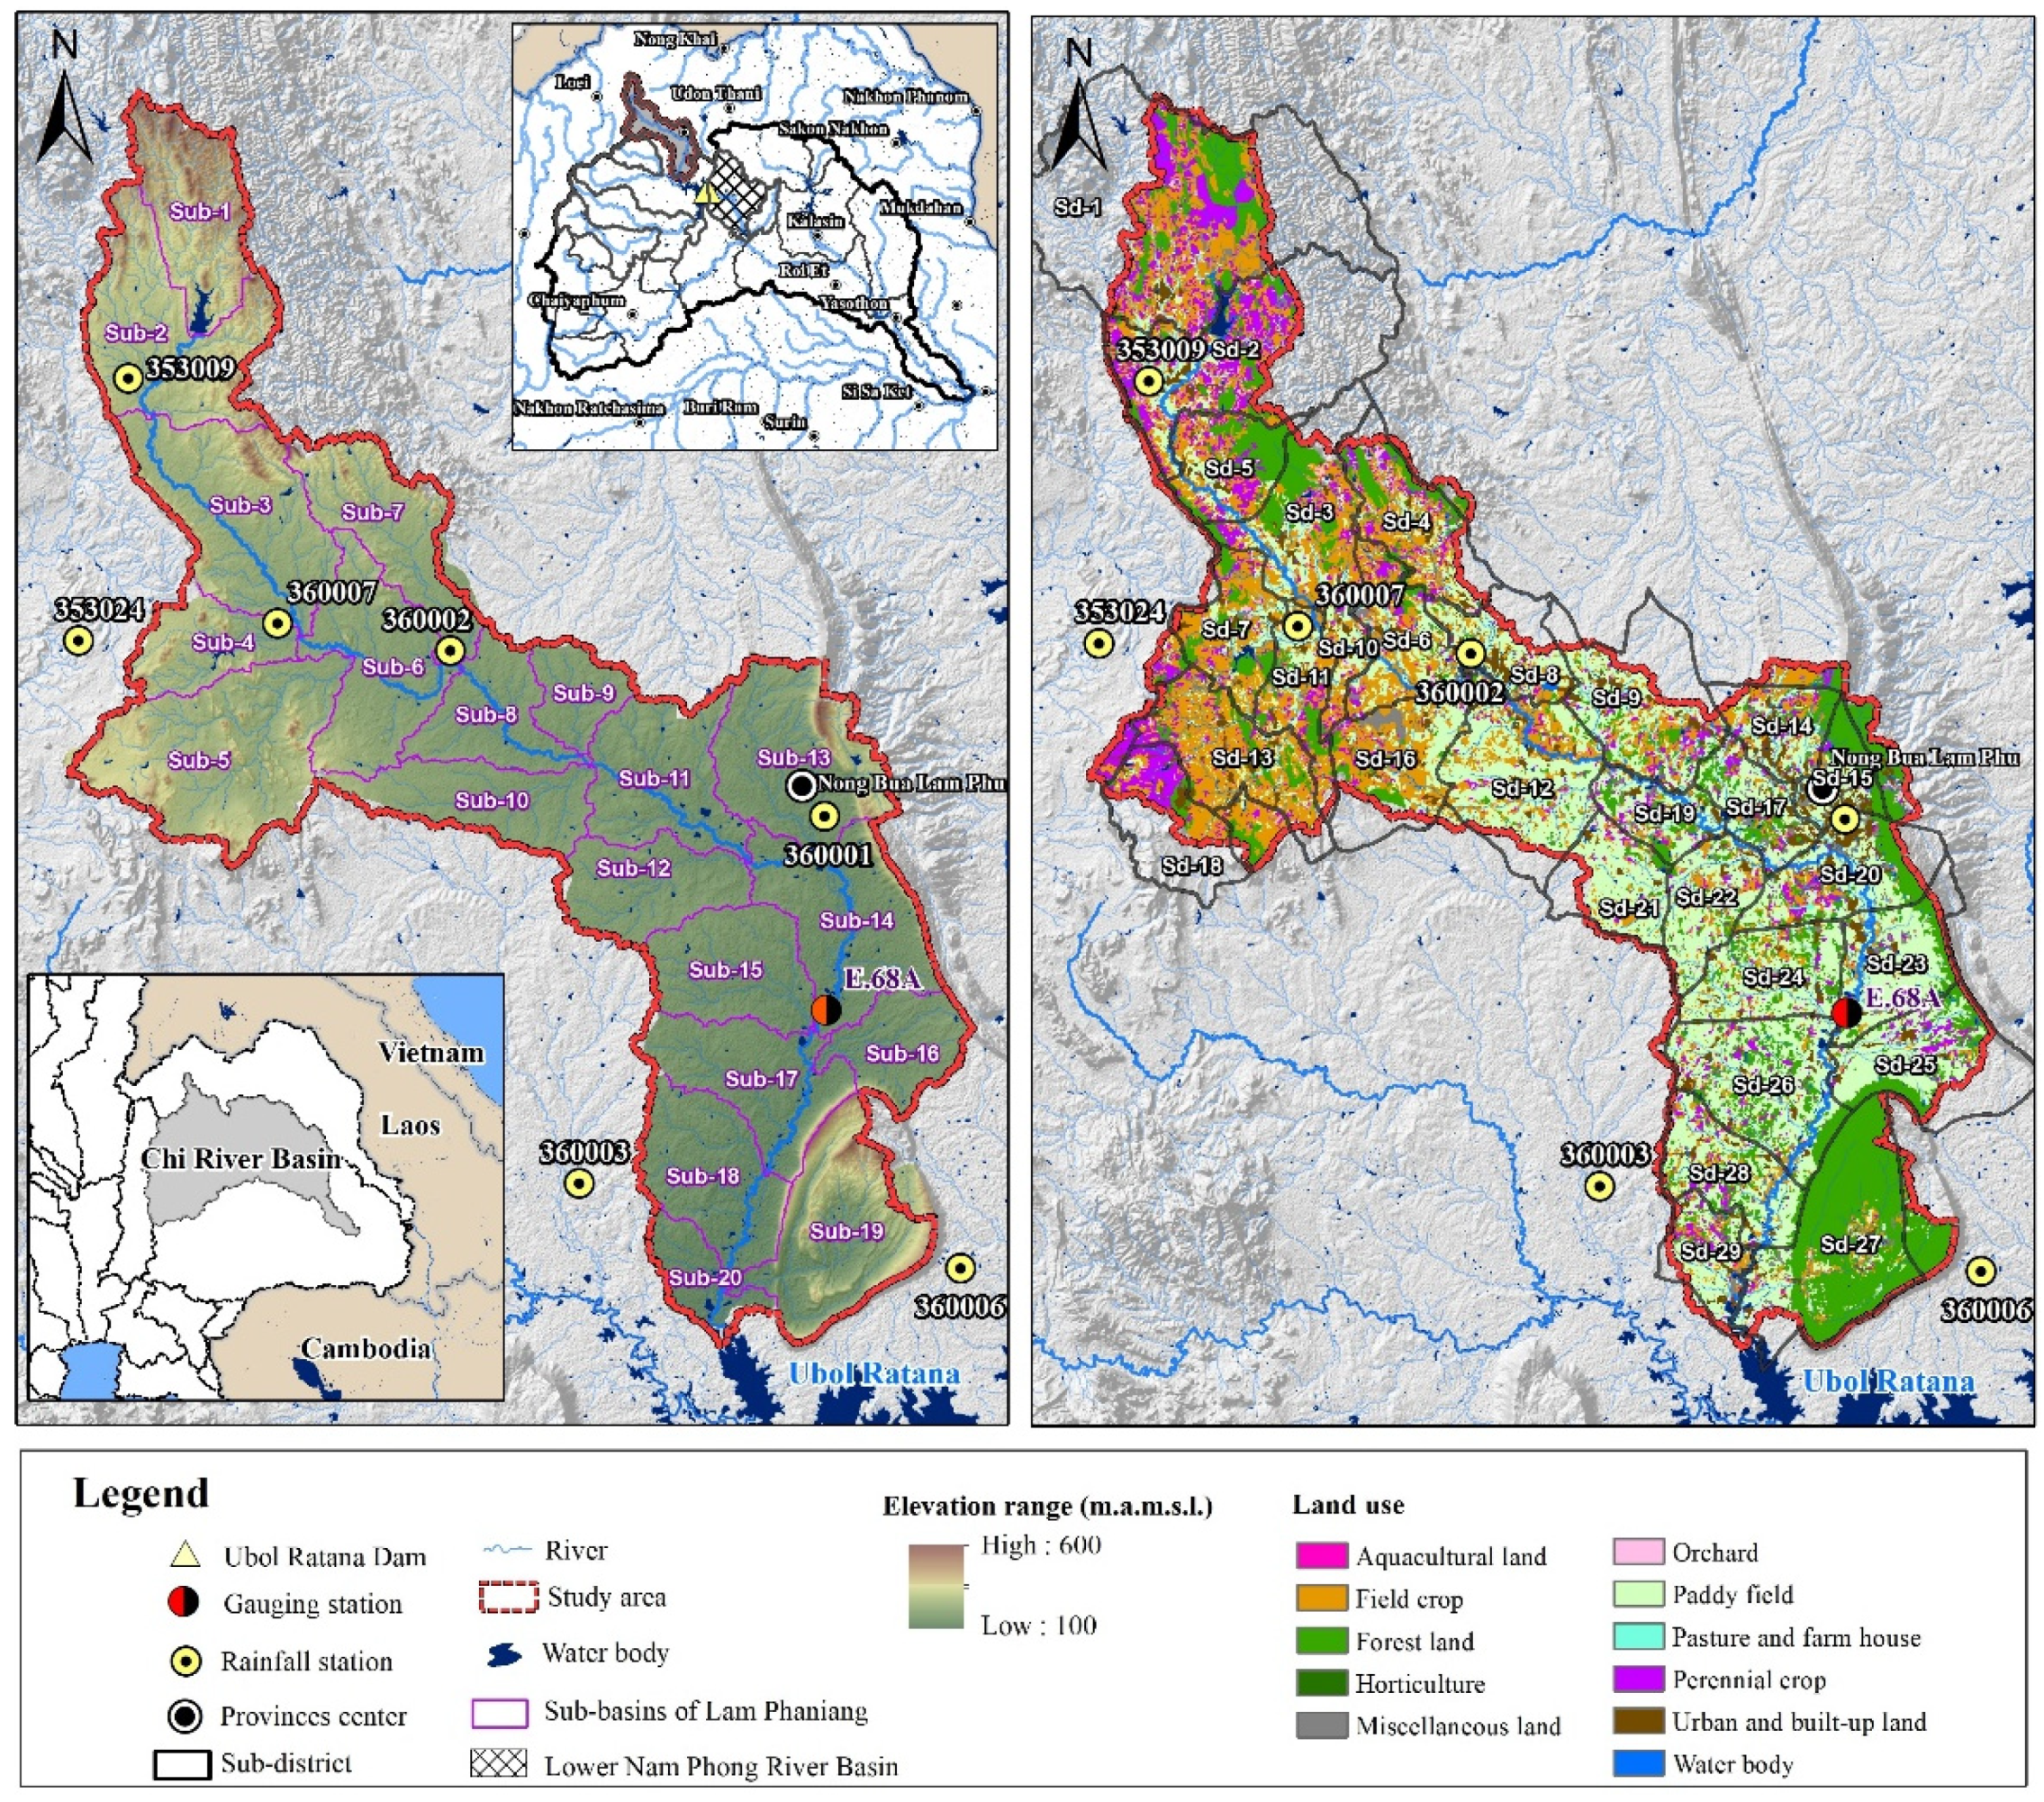
2.1. Study Area

The Lam Phaniang River Basin, which is the main sub-basin of the Chi River Basin, is located in the northeastern part of Thailand. The Lam Phaniang River is the main river of the study area with the length of 150 km originating from Phu Khao Range at the eastern part of Loei Province, passing through Nong Bua Lamphu Province, and flowing into the Ubol Ratana Reservoir. The total area of the Lam Phaniang River Basin is approximately 1912 km2 (3.9% of the entire Chi River Basin) with a long and narrow S-shape, which results in a relatively small peak discharge during floods [9]. The elevation along the flow path varies from 600 m above mean sea level (m.a.m.s.l.) at the upstream to approximately 100–200 m.a.m.s.l. at the downstream end of the targeted area (see Figure 1). The 2015 land use in the study area can be classified into agricultural land covering the area of 1302.0 km2 (68.1%), forest covering 413.0 km2 (21.6%), urban and built-up areas covering 98.6 km2 (5.2%), water bodies covering 48.7 km2 (2.5%), and miscellaneous covering 49.7 km2 (2.6%). Referring to the information from Secretariat Office of the Chi River Basin Committee [10], the climate of the study area is a tropical monsoon type with 1240.2 mm of mean annual rainfall, while the highest mean monthly rainfall amount was recorded in September (237.7 mm) and the lowest was found in January (5.7 mm). The mean annual temperature was reported to be about 26.7 °C, which varies from a maximum of 36.4 °C in April to a minimum of 16.7 °C in December. The mean annual runoff was estimated to be approximately 10.1 m3/s, in which the highest and lowest runoff were observed in September and April by 49.0 m3/s and 0.1 m3/s, respectively.

2.2. Data Collection

The data used in this study involved three types of primary data, namely (1) the historical measurements of daily rainfall, daily maximum and minimum temperatures, and daily river discharge; (2) digital descriptions of the landscape gathered from the Land Development Department (LDD), i.e., Digital Elevation Model (DEM) with 30 m horizontal spatial resolution, land use, and soil type; and (3) statistics data such as population and factory information, which were used to calculate the water demand for household and industry, respectively. Regarding the daily observations during 2000–2017, the rainfall and maximum and minimum temperature data were collected from seven rain gauge stations and one meteorological station of the Thai Meteorological Department (TMD), respectively, whereas the discharge recorded at gauging station E.68A (Ban Khong Po, Mueang District, Nong Bua Lamphu) were collected from the Royal Irrigation Department (see Figure 1 for locations).

2.3. Climate Models for Climate Scenarios

2.3.1. Applicability of GCM Dataset

The analysis of future climate change was carried out based on future changes in rainfall and maximum and minimum temperatures. The detailed assessment of likely future climate change was then used for sensitivity analysis conducted by the Water Evaluation and Planning System (WEAP model), and an analysis on exposure to the future climate.
Regarding the analysis of future climate change from 2021–2100, the projections were generated by downscaling the simulations of three Global Climate Models (GCMs), i.e., CNRM-CM5, EC-EARTH, and NorESM1-M, which were obtained from the Coordinated Regional Climate Downscaling Experiment (CORDEX) initiative covering continental Asia at a horizontal resolution of 50 km × 50 km. The chosen reference period was 1989–2005, whereas the projections were carried out for 2021–2040, 2041–2060, 2061–2080, and 2081–2100 using two Representative Concentration Pathways (RCPs 4.5 and 8.5) (note: the 20 years projection interval was considered to get a realistic picture of each 20-year future period due to natural variations and anthropogenic increases in greenhouse gas emissions that may cause climate change).

2.3.2. Bias Correction

The Regional Climate Models (RCMs) are generated in a high spatial resolution by nesting a secondary model with respect to the driving Global Climate Models (GCMs) over the area bounding a specified domain of interest [11]. Consequently, within this domain, more spatially detailed output, i.e., rainfall and maximum and minimum temperatures, can be produced. However, RCMs cannot be directly used in this impact assessment, as they have substantial biases [12,13]. Therefore, a tailor-made tool for bias correction called “Climate Model data for hydrologic modeling (CMhyd)” developed by Rathjens et al. [14] was used to deal with systematic model biases. In this study, as suggested by Teutschbein and Seibert [15], the option called “Linear Scaling” was applied to correct biases in the observed and historical downscaled rainfall and maximum and minimum temperature datasets from 1989 to 2005.

2.4. Projection of Future Land Use Change

The analysis of future land use change is increasingly prominent, as it is crucial with the multiple consequences induced by increasing drought on water availability and demand, agricultural production, food security, and livelihoods. Therefore, the land use model is considered to be useful for a better understanding of drivers and resultant consequences of changes by predicting and projecting future land use [16]. In this study, the Land Change Modeler (LCM) built-in module with TerrSet software (formerly known as IDRISI) developed by Clark Labs at Clark University was applied. As inputs, land use maps from two different historical periods, i.e., 2010 and 2015 were used to derive the future land use and its changes from 2010 (historical) to 2100 (future) based on relevant driving factors and their causal influence on accelerated land conversion [17]. A modeling method relies on Multi-Layer Perceptron (MLP) neural network and Markov Chain (MC), in which the MLP was trained to model land use transitions through creating transition potential maps. The transition potential maps were created based on a set of descriptive environmental variables called drivers, i.e., agricultural areas, distance to urban areas, rivers, roads, as well as altitude, slope, and aspect of land [18]. Thereafter, the Markov Chain method was then applied to process the transition maps for the prediction process [19], based on the past trends of land use changes from 2010 to 2015. The Markov Chain method was selected as it is a powerful descriptive and predictive model for land use change and future land use distribution. It has been widely used with the potential to provide timely projection of land use changes, and the minimum data requirement is desirable. However, its main limitation would be the ignorance of interactions between contiguous land areas for broad scale application, and it cannot be used to determine its spatial position or the characteristics of spatial change and distribution [20,21]. There is one more aspect to be noted; the land use modeling process relies on the integration of both changes in environmental and socio-economic drivers. Unfortunately, the incorporation of socio-economic factors was restricted by the lack of spatial data and the difficulties in integration with other environmental data [22]; only environmental variables were then used as driver variables for changes on all spatial and temporal scales.

2.5. Assessment of Water Availability and Demand

2.5.1. WEAP Model Set-Up

It is a fact that hydrological process simulation models focusing on only water supply issues are probably not adequate or satisfactory. Therefore, a software tool called “Water Evaluation and Planning model (WEAP)”, developed by the Stockholm Environment Institute (SEI), which addresses the water supply and demand issues, as well as challenges and concerns for limited water resources and policies on sustainable water use [23], was applied for enabling the assessment of water availability and demand within the Lam Phaniang River Basin. In detail, essential information related to the irrigated area, domestic and industrial sites, irrigation water requirements, and streamflow for both historical (2000–2017) and future conditions (2021–2100) were imported into the WEAP model. Current and future climate and land use scenarios were utilized in the WEAP model to investigate the water supply and demand relations through scenario evaluation. As a prerequisite to the WEAP model set-up, the watershed was delineated and divided into several sub-basins using Arc Hydro Tools in ArcGIS 10.5 software, based on the 30-m Digital Elevation Model (DEM) and stream network. In consequence, the Lam Phaniang River Basin was then delineated and divided into 20 sub-basins (see more details in Figure 1). There are nine different types of physical components (so-called “nodes”), i.e., Demand Site, Catchment, Groundwater, Flow Requirement, Reservoir, River, Transmission Link, Runoff/Infiltration Link, and Return Flow Link, that were incorporated in the WEAP model, together with GIS-shapefiles of catchment and sub-district boundaries, river networks, and surface water storage, in order to capture the features of water systems. The daily climate data during 2000–2017 and 2018–2100, i.e., minimum and maximum temperature, and rainfall, were used to calculate crop and irrigation water demand, as well as streamflow estimates.

2.5.2. Water Demand Calculation for Different Purposes

In the Lam Phaniang River Basin, the water demand for four different purposes, i.e., ecology as the 1st priority, domestic use (2nd priority), agriculture (3rd priority), and industry (4th priority), was estimated by the WEAP model. In detail, the calculation of ecological water demand was carried out using the functions “Flow Duration Curve shift” or “FDC shift”, to estimate the environmental flow requirements based on a range of Environmental Management Classes (EMC), from “Class A: Natural Flow” to “Class F: Critically Modified” for maintaining the stream in a given ecological condition [24]. For the ecosystem of Lam Phaniang, the “Moderately Modified” condition (Class C), which corresponds to moderate modification of the natural state, was considered. The water demand for domestic use was based mainly on the water consumption per capita and the 2017 population of all 29 sub-districts within the Lam Phaniang River Basin (see Figure 1 for their locations). For the agricultural water demand calculation, the MABIA Method in WEAP, which uses the “dual Kc” approach to simulate the daily soil water budget under various water availability situations, and the calculation of crop water requirement (ETc) and irrigation water requirement (IWR) based on the FAO Penman–Monteith equation, was applied. Based on the 2017 list of factory type and classification specified by the Department of Industrial Works, the industrial water demand was calculated from the industrial area of 130 factories covering 2.2 km2 within 29 sub-districts, and the water consumption per area of water used by each factory.

2.5.3. WEAP Model Calibration and Validation

Before applying the WEAP model to the Lam Phaniang River Basin, calibration is a crucial and necessary step to adjust the parameters under the catchment node that affect streamflow generation within the study area, i.e., maximum infiltration rate and effective rainfall, until the simulated monthly discharge matches the historical observed data (2000–2008) collected at the E.68A gauging station (situated at Ban Khong Po, Mueang District, Nong Bua Lamphu Province as shown in Figure 1). To ensure that the calibrated parameters could properly produce outputs close to the observed data, model validation was then executed against a different period of data used for calibration; 2009–2017. It should be noted that the 2000–2017 period was considered due to limited data availability. Regarding the evaluation of WEAP model efficiency, two widely-used statistical indicators were employed; the Coefficient of Determination (R2), ranging from 0 meaning poor model performance to 1 showing good performance, and Nash–Sutcliffe Efficiency (NSE) ranging from negative infinity to 1 showing better agreement between the observed and simulated flows. In this study, the performance of the WEAP model was considered to be acceptable/satisfactory when the R2 and NSE values were greater than 0.5, as suggested by [25,26].

2.6. Assessment of Drought Hazard and Vulnerability

A systematic approach for the assessment of drought hazard and identification of drought vulnerability indicators for the Lam Phaniang River Basin was addressed in this study. The drought index, known as the Standardized Precipitation Evapotranspiration Index (SPEI), was used to understand the characteristics of droughts in the study area. A composite risk assessment was then carried out by considering a combined effect of drought hazard (likelihood) and drought consequence (vulnerability), which were quantified via standardized indices like the Drought Hazard Index (DHI), Drought Vulnerability Index (DVI), and Drought Risk Index (DRI). The classification scheme was employed for the aforementioned indices to be grouped into classes ranging from low to very high. Then, mapping of the DHI, DVI, and DRI classes was performed to generate drought risk maps for the Lam Phaniang River Basin.

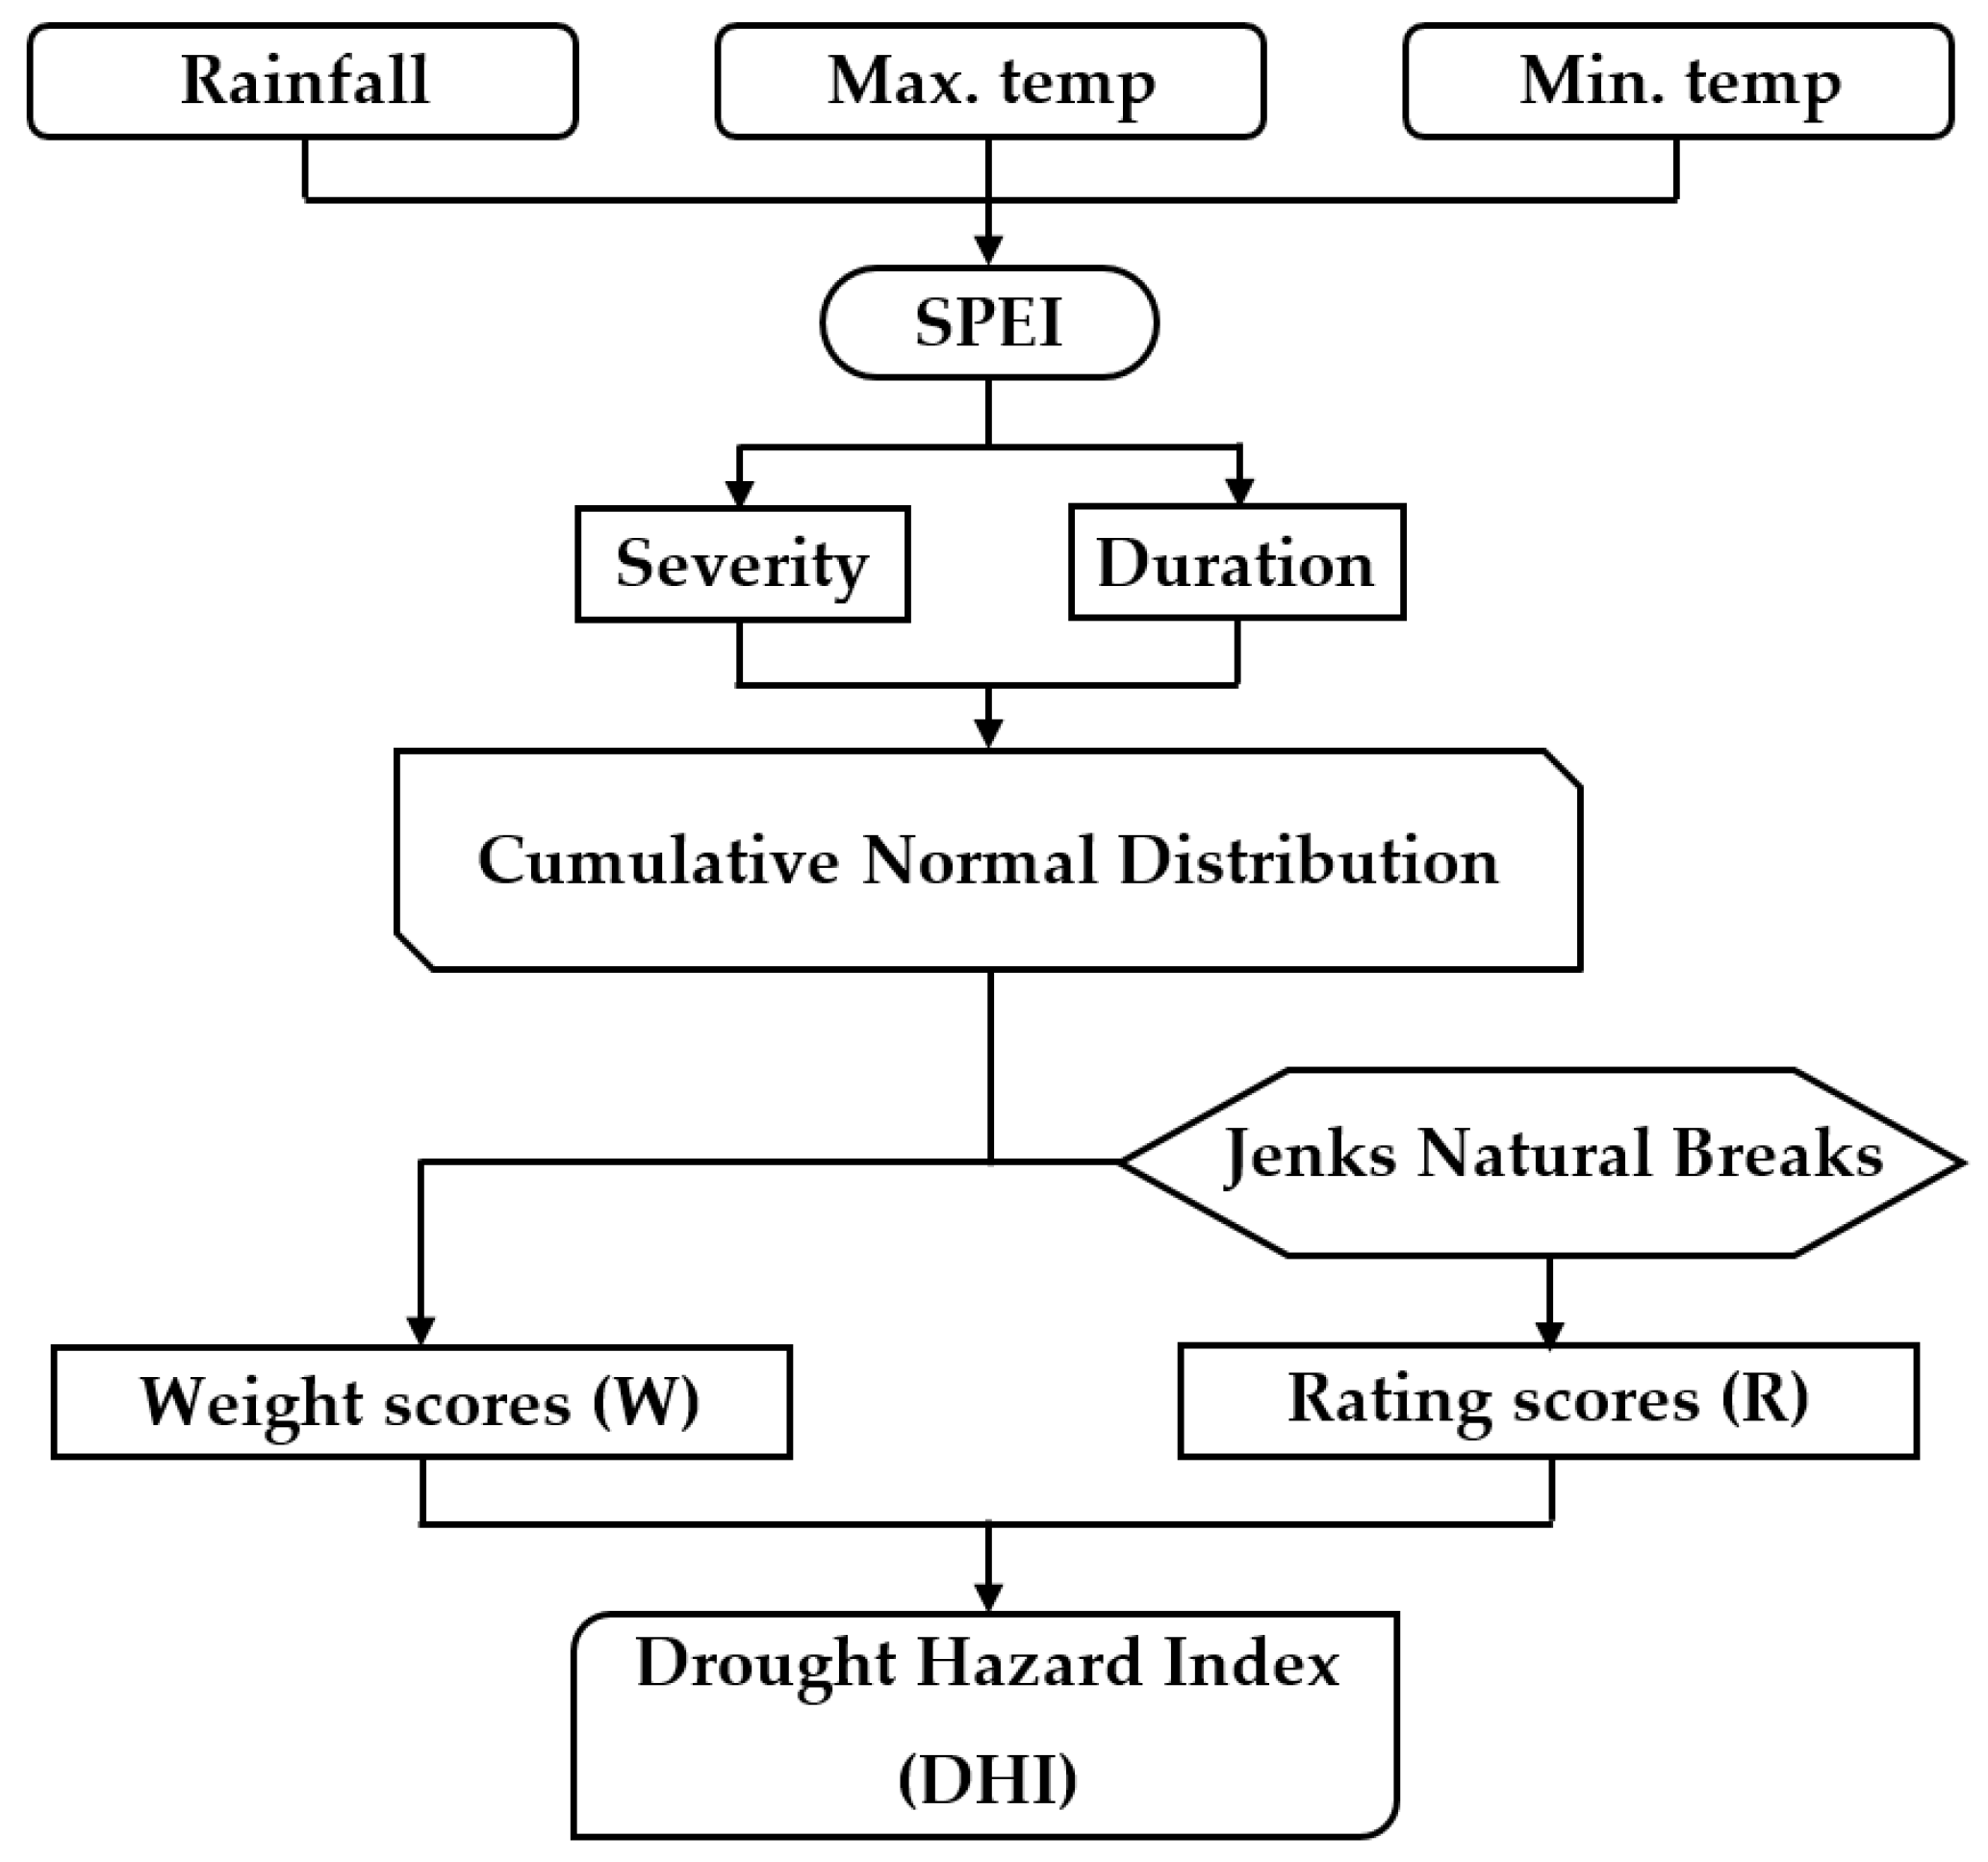
2.6.1. Calculation of SPEI Drought Index

To represent the relative probability occurrences of drought events in the Lam Phaniang River Basin, the Standardized Precipitation Evapotranspiration Index (SPEI) was calculated, which describes the trend, frequency, and characteristic values of droughts like severity, duration, and intensity, due to the simplicity of the calculation procedure including the effects of temperature variability for drought assessment [27]. In principle, the SPEI is a comparison of the accumulated climatic water balance (rainfall minus potential evapotranspiration) over a specific month (i, i − 1,…, i − n) to the equivalent n month accumulations over the historical record (2000–2017). For computing the SPEI values, the historical rainfall data of each station were fitted to a gamma probability distribution function. To obtain the SPEI, the cumulative probability, which allows the distribution of a rainfall event at the station to be effectively represented for each month of the year and at different time scales, was then transformed to the standard normal distribution or standardized normal variable. With a mean SPEI value of 0 and a standard deviation of 1, the SPEI value can be compared with other values over time and space [27]. Referring to Zeng et al. [28], the classification of drought intensities based on the range of SPEI dimensionless values was made into four different drought categories, where negative and positive values indicate drier and wetter than average conditions, respectively (see Table 1).

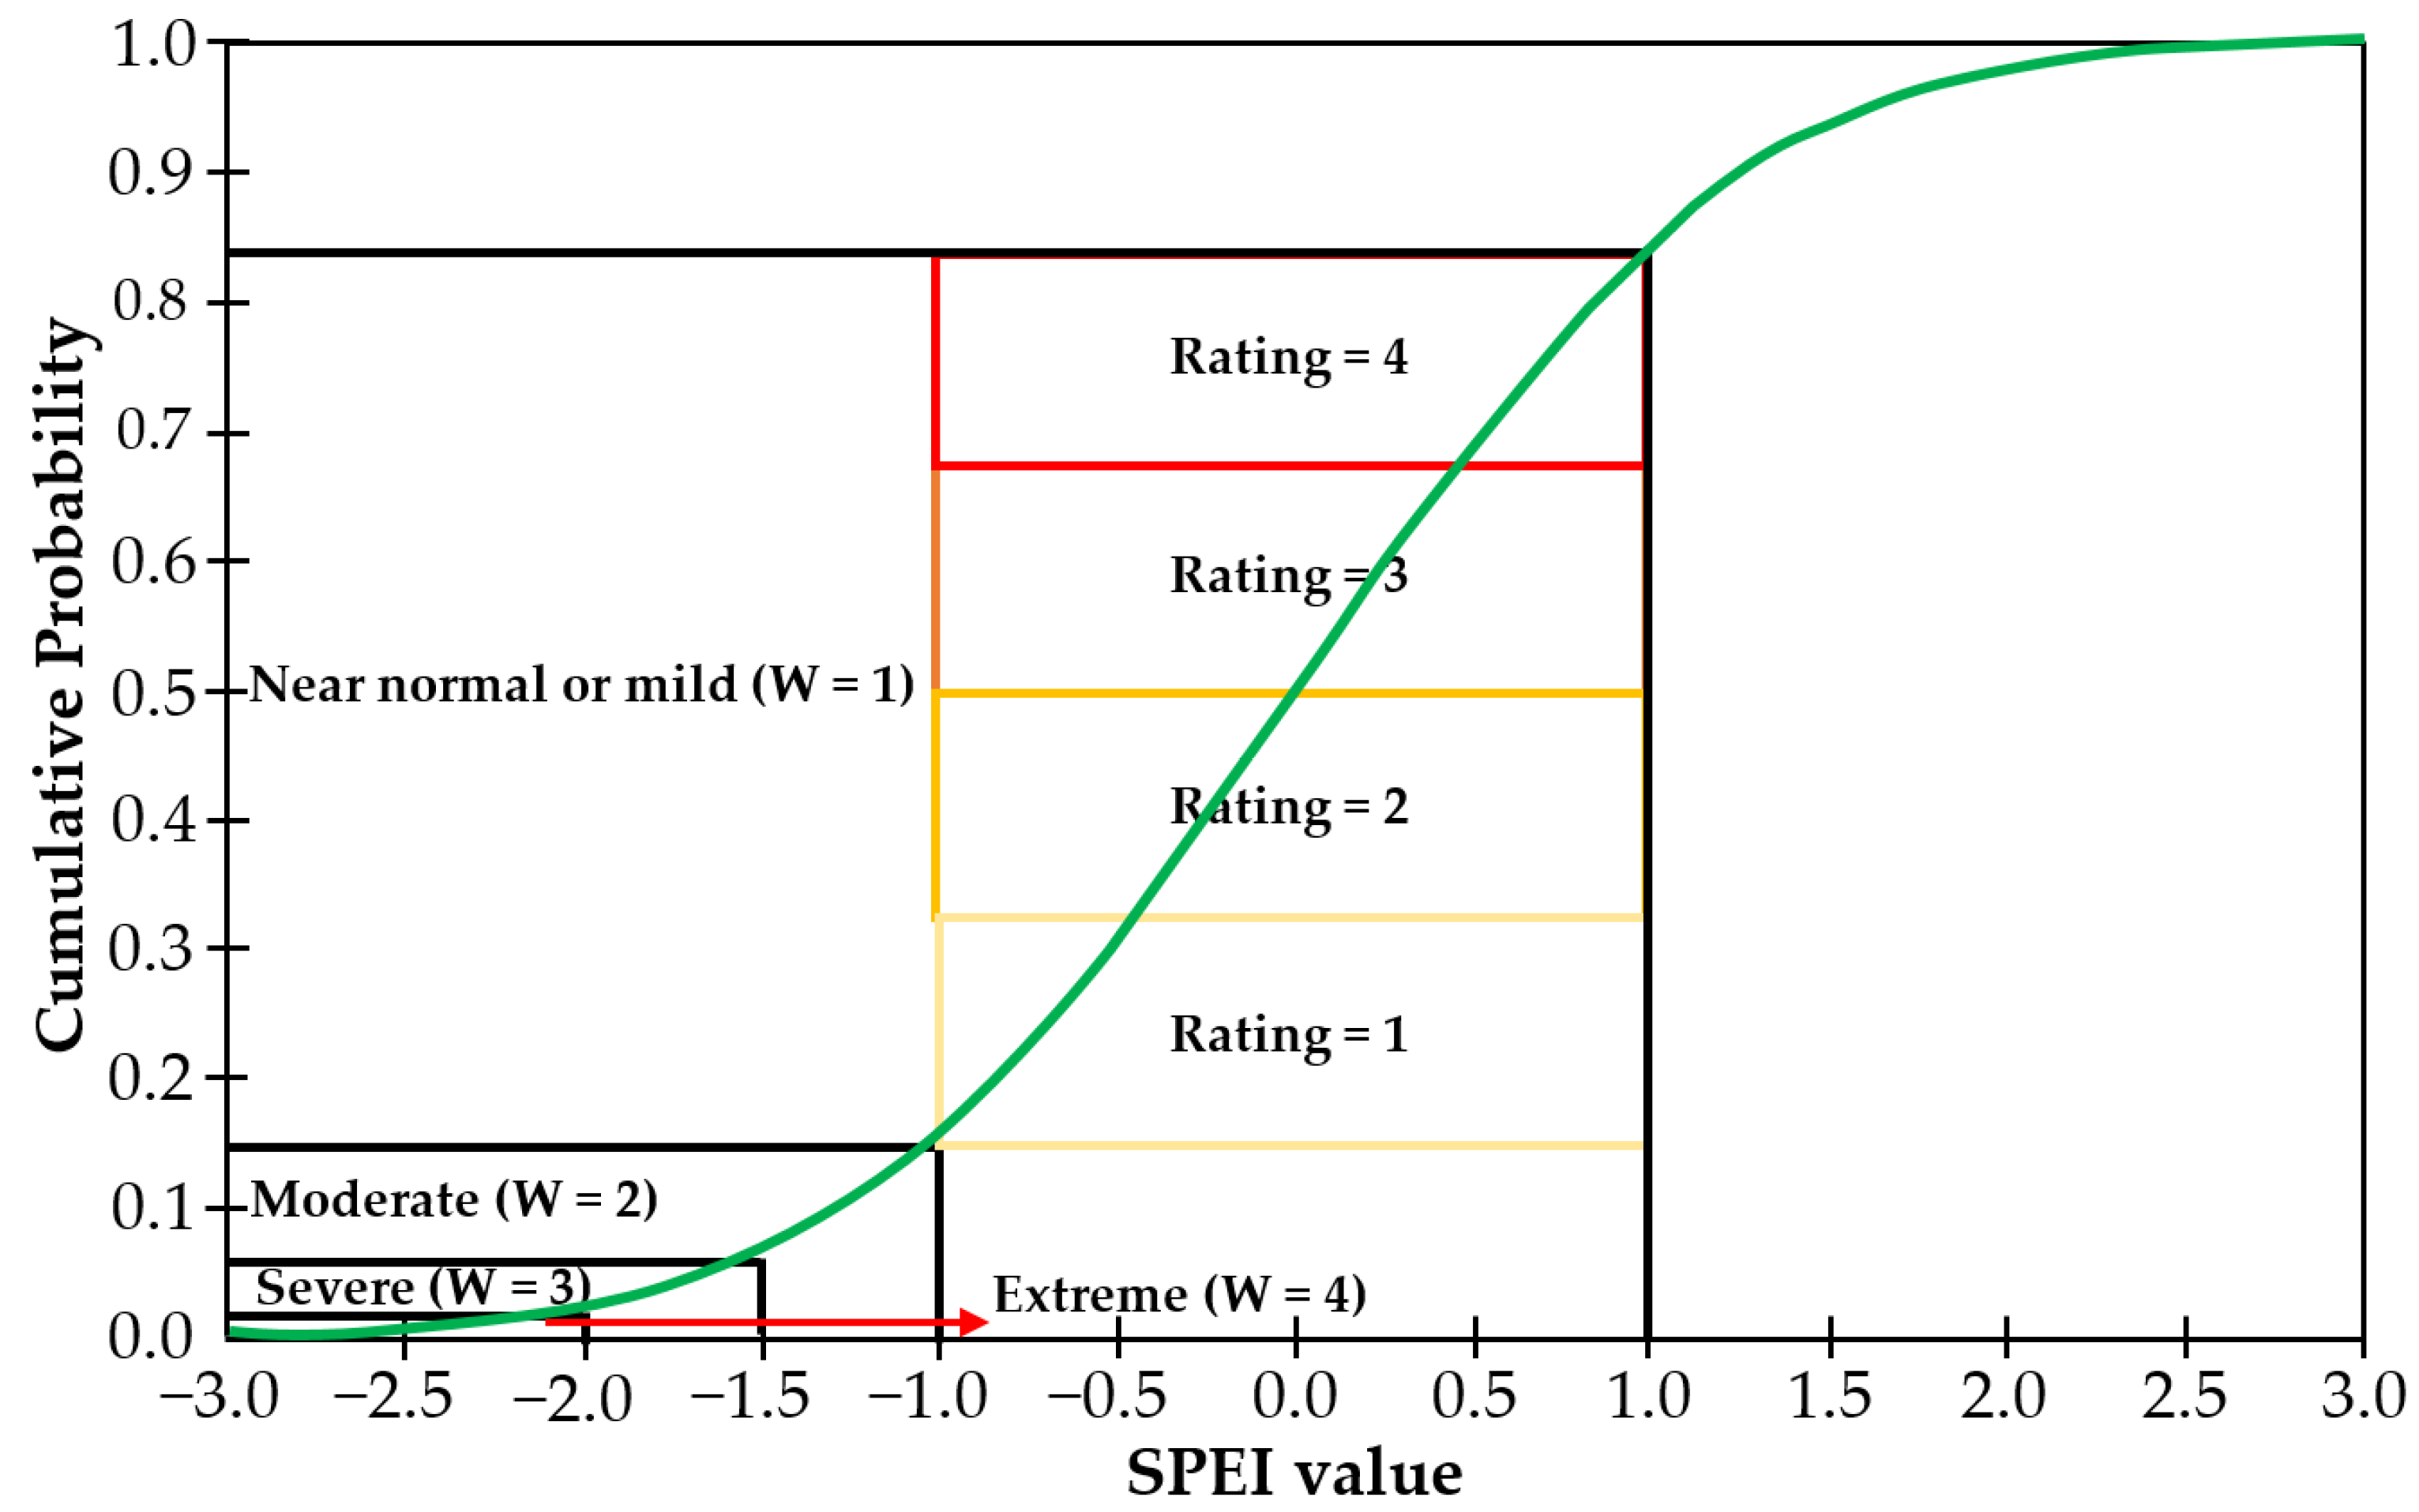
2.6.2. Weights and Ratings for Evaluating Drought Potential

Based on the cumulative distribution function of SPEI, each drought severity category was assigned with a particular weight from 1 to 4 by considering the SPEI intervals (Table 1). In detail, the mild (M), moderate (MO), severe (S), and extreme (E) classifications were defined the weights (W) of 1, 2, 3, and 4, respectively, in which a high value indicated a high drought intensity. Thereafter, each weighted category was further divided into four rating scores (R) ranging from 1 to 4 using the Jenks Natural Breaks classification method in ArcGIS 10.5, in which the order is increased through evenly dividing the interval of the cumulative probabilities for each drought range (see Figure 2) (note: the Jenks Natural Breaks method creates ranges based on the average of each range to distribute the data more evenly across the ranges, in which the data values within each range are also fairly close together [29]).

2.6.3. Calculation of Drought Hazard Index

By integrating the weights and ratings of various categories using Equation (1) for seven rain gauges, the Drought Hazard Index (DHI) was then calculated for 3-, 12-, and 24-months SPEI values for 2000–2017 and 2021–2100 under both RCPs 4.5 and 8.5 (see Figure 3 for detailed procedure).
D H I = i = 1 N W i × R i
where N refers to the number of SPEI values for selected time interval, and Wi and Ri represent the weights and ratings for each drought category, respectively.
Subsequently, the DHI values were rescaled to a scale of 0–1 and evenly divided into four groups using the Jenks Natural Breaks method (Table 2). Based on the DHI value of each grid, the drought hazard map was then generated by using the Inverse Distance Weighting (IDW) interpolation method with ArcGIS 10.5 software. The obtained drought hazard maps were then overlaid on the sub-district map of the Loei, Nong Bua Lamphu, and Udon Thani Provinces, for creating sub-district scale drought hazard maps, in which the calculation of the area-weighted average DHI for each sub-district was also performed.

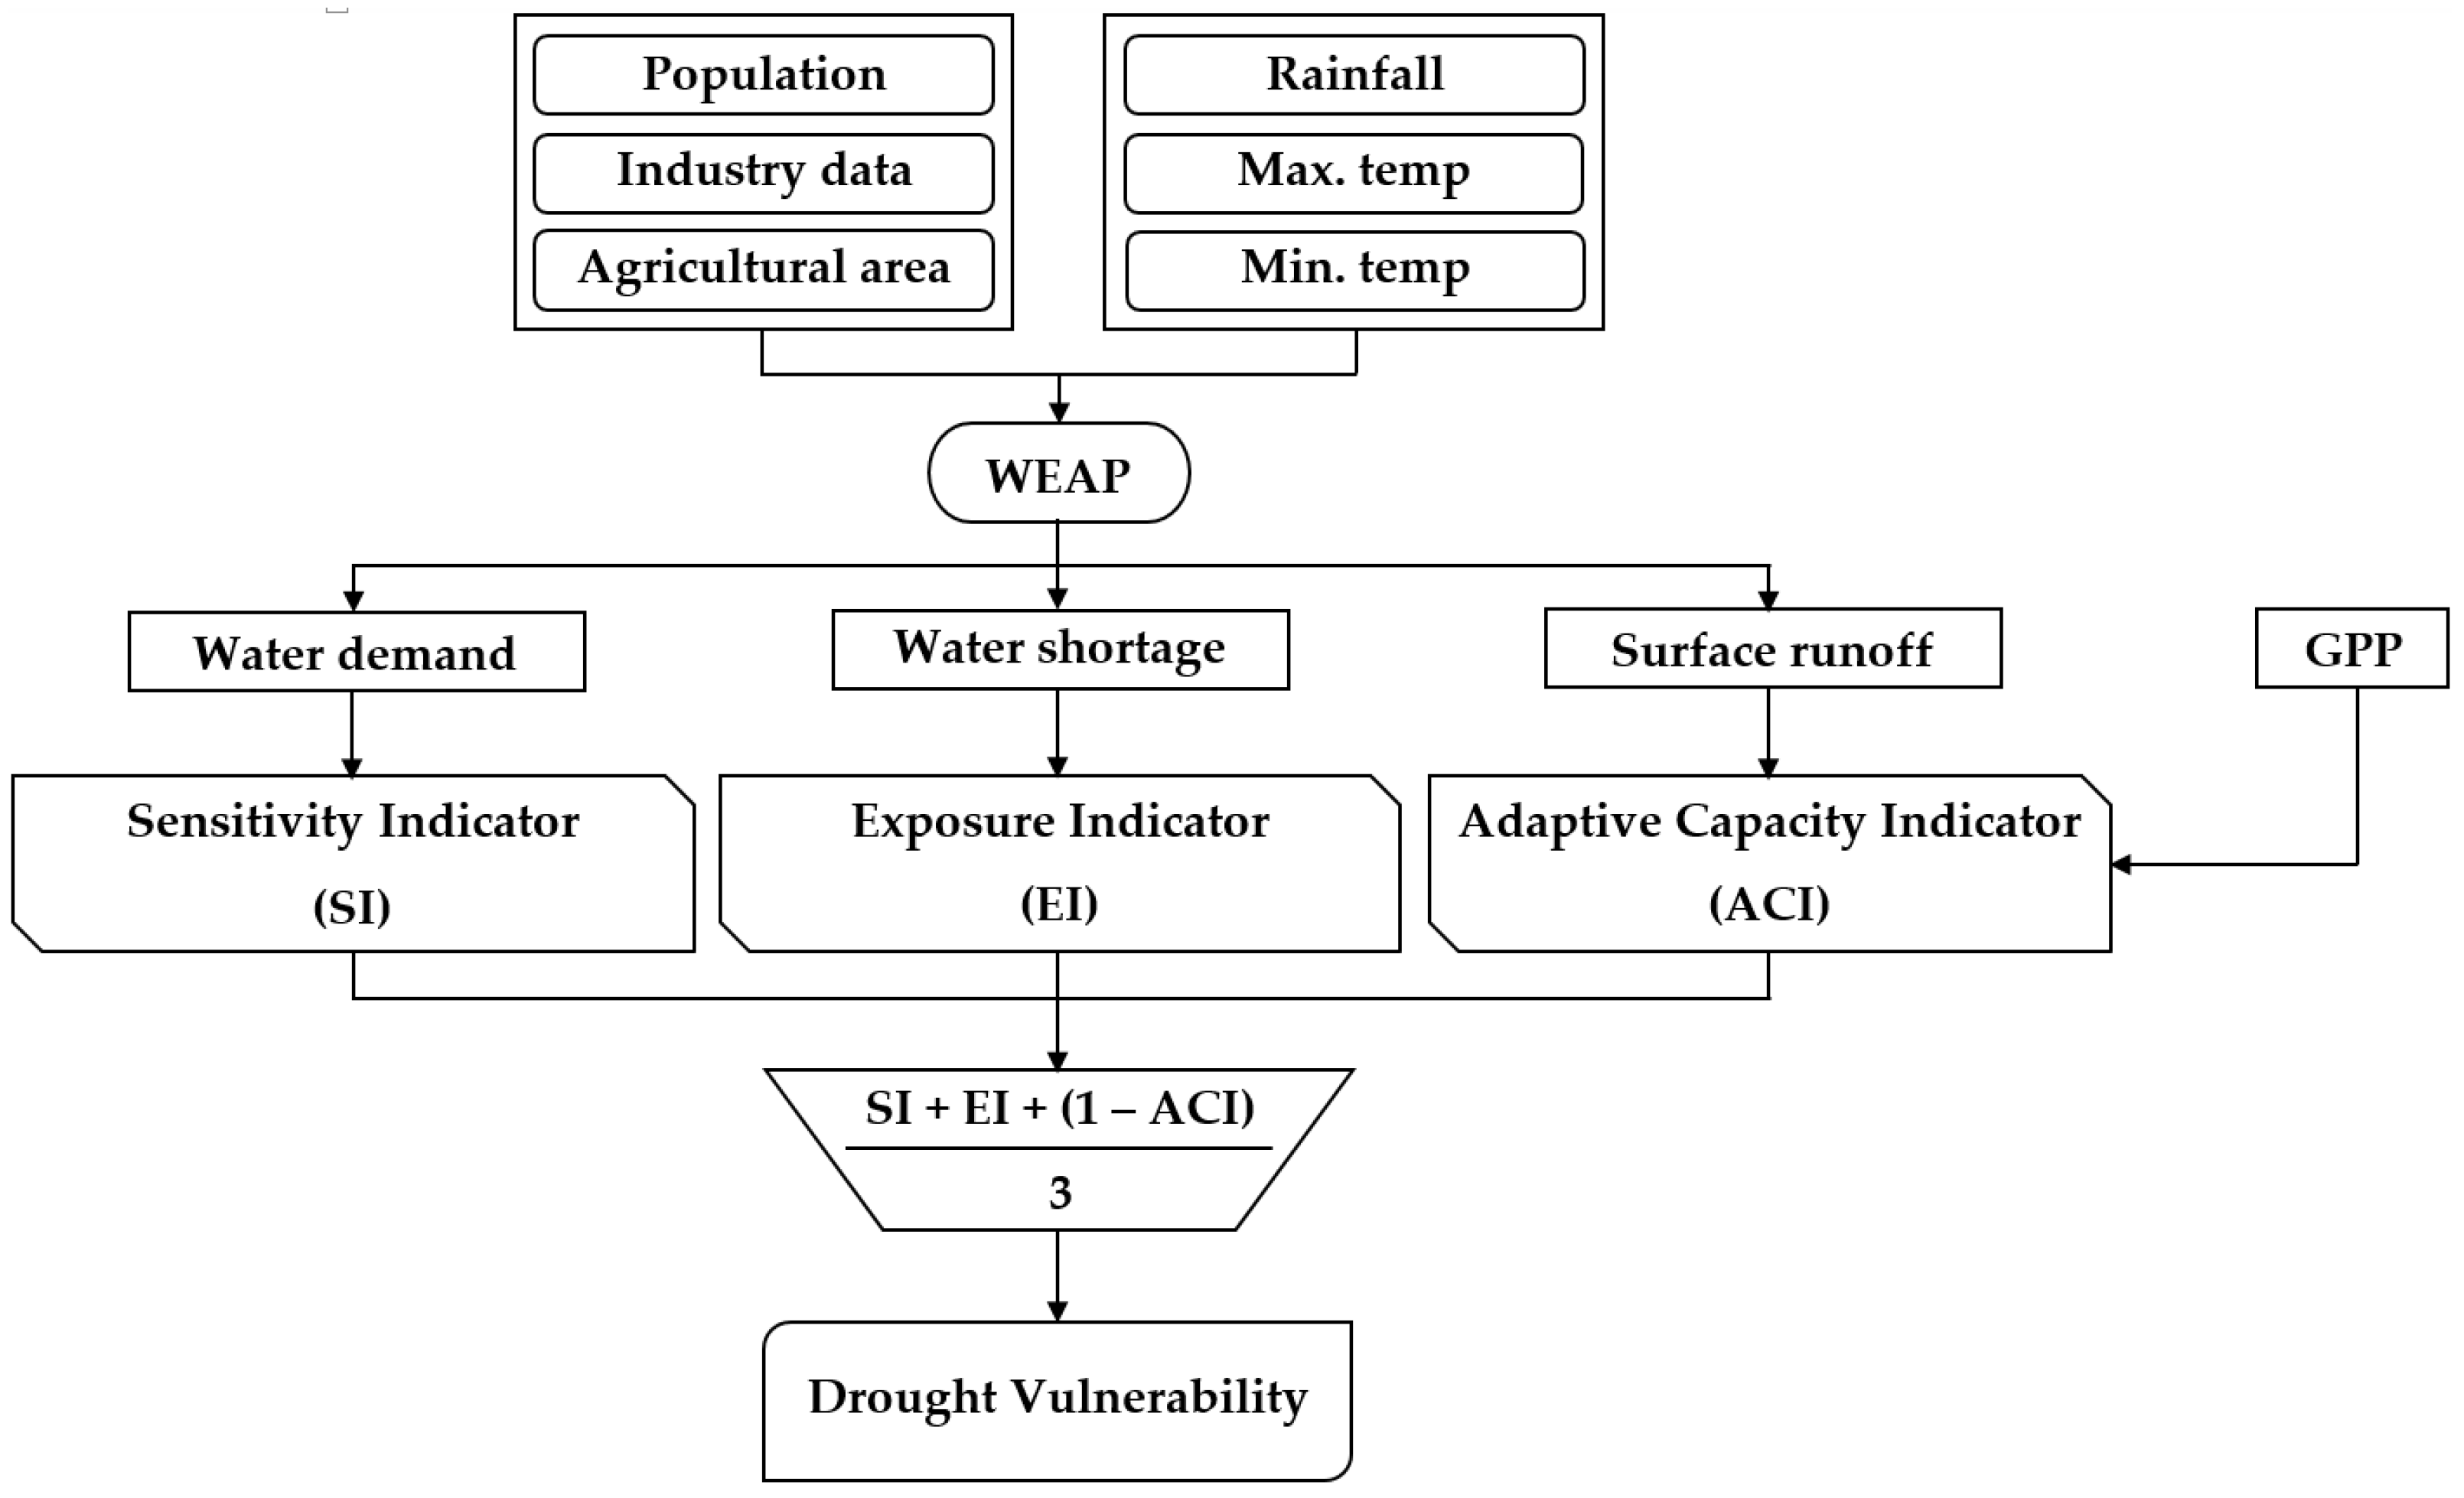
2.6.4. Calculation of Drought Vulnerability Index

The magnitude of a drought’s impact depends mainly on the vulnerability of exposed elements to a drought event, which is an imbalance among exposure, sensitivity, and adaptive capacity [30]. Therefore, the vulnerability to drought of each sub-district within the Lam Phaniang River Basin, which refers to a relative measure of levels of susceptibility to damage caused by occurrence of drought with an incapability to cope with its adverse consequences, was assessed and eventually aggregated into a single Drought Vulnerability Index (DVI) (see the overall framework in Figure 4). To define the effective set of indicators reflecting the vulnerability in each drought category and sub-district, three individual physical and socio-economic vulnerability indicators related to vulnerability components were considered and used in this study, with details as follows.
  • Sensitivity Indicator (SI) was used to describe the degree to which the sub-districts within the Lam Phaniang River Basin were adversely affected by drought with either positive or negative impacts. In this study, the WEAP simulated water demand for domestic use, agriculture, and industry, was used to measure the sensitivity to the drought-associated complications, as higher water demand can lead to more vulnerability to the adverse impacts of drought.
  • Exposure Indicator (EI) to drought was captured by water shortage for domestic use, agriculture, and industry, under climate change impacts for affected sub-districts within the Lam Phaniang River Basin.
  • Adaptive Capacity Indicator (ACI), which is a function of three determinants, including socio-economic, technological, and institutional capabilities, was considered since the greater the adaptive capacity of the Lam Phaniang River Basin to a specific climate event, the less vulnerable to drought due to climate change. In this study, two indicators, i.e., Gross Provincial Product (GPP) and surface runoff simulated by WEAP, were used to quantify adaptive capacity to climate change, because the higher the GPP and more sufficient the water supply are, the higher the adaptive capacity.
It can be noted that the indicators (SI, EI, and ACI) were expressed in different units of measurement, their values were then normalized as dimensionless values within a range of 0–1 in order to overcome the different unit effects. Each indicator was also divided into four classes using the Jenks Natural Breaks method, with a rating on a scale of 0–1 for each class. Thereafter, by assigning equal weightage for each indicator, the aggregate DVI was calculated using a simple average of individual indicators (Equation (2)). However, before aggregating the DVI value, the ACI value would need to be modified by deducting from 1 in order to adjust the direction of ACI to be the same as the SI and EI. That is to say, for the SI and EI the higher the value, the higher the vulnerability, while the higher the ACI, the lower the vulnerability. Subsequently, the DVI was again re-scaled to a 0–1 range, and evenly classified into four classes using the Jenks Natural Breaks method based upon the criteria described in Table 2. The DVI was then used for integrating the sub-district level thematic maps for the Lam Phaniang River Basin, in which the sub-districts were also classified into four classes according to the DVI values.
D V I = S I + E I + ( 1 A C I ) 3

2.7. Assessment of Drought Risk

Drought risk is defined as the combination of drought occurrence and its severity, resulting from hazards that could cause physical harm to vulnerable elements (persons or property damage) [31]. Therefore, the determination of drought risk was carried out by combining vulnerability (DVI) and hazard information (DHI), since neither vulnerability nor hazard alone determines the occurrence of drought. To capture the potential drought hazard consequences, the Drought Risk Index (DRI) was calculated and used to assess drought risk for different administrative sub-districts of the Lam Phaniang River Basin (see Equation (3)). Then, the spatial distribution maps of drought risk across the Lam Phaniang River Basin were generated to identify the vulnerable sub-district areas to drought risk, using the same classification criteria as in Table 2.
D R I = D H I × D V I

3. Results and Discussion

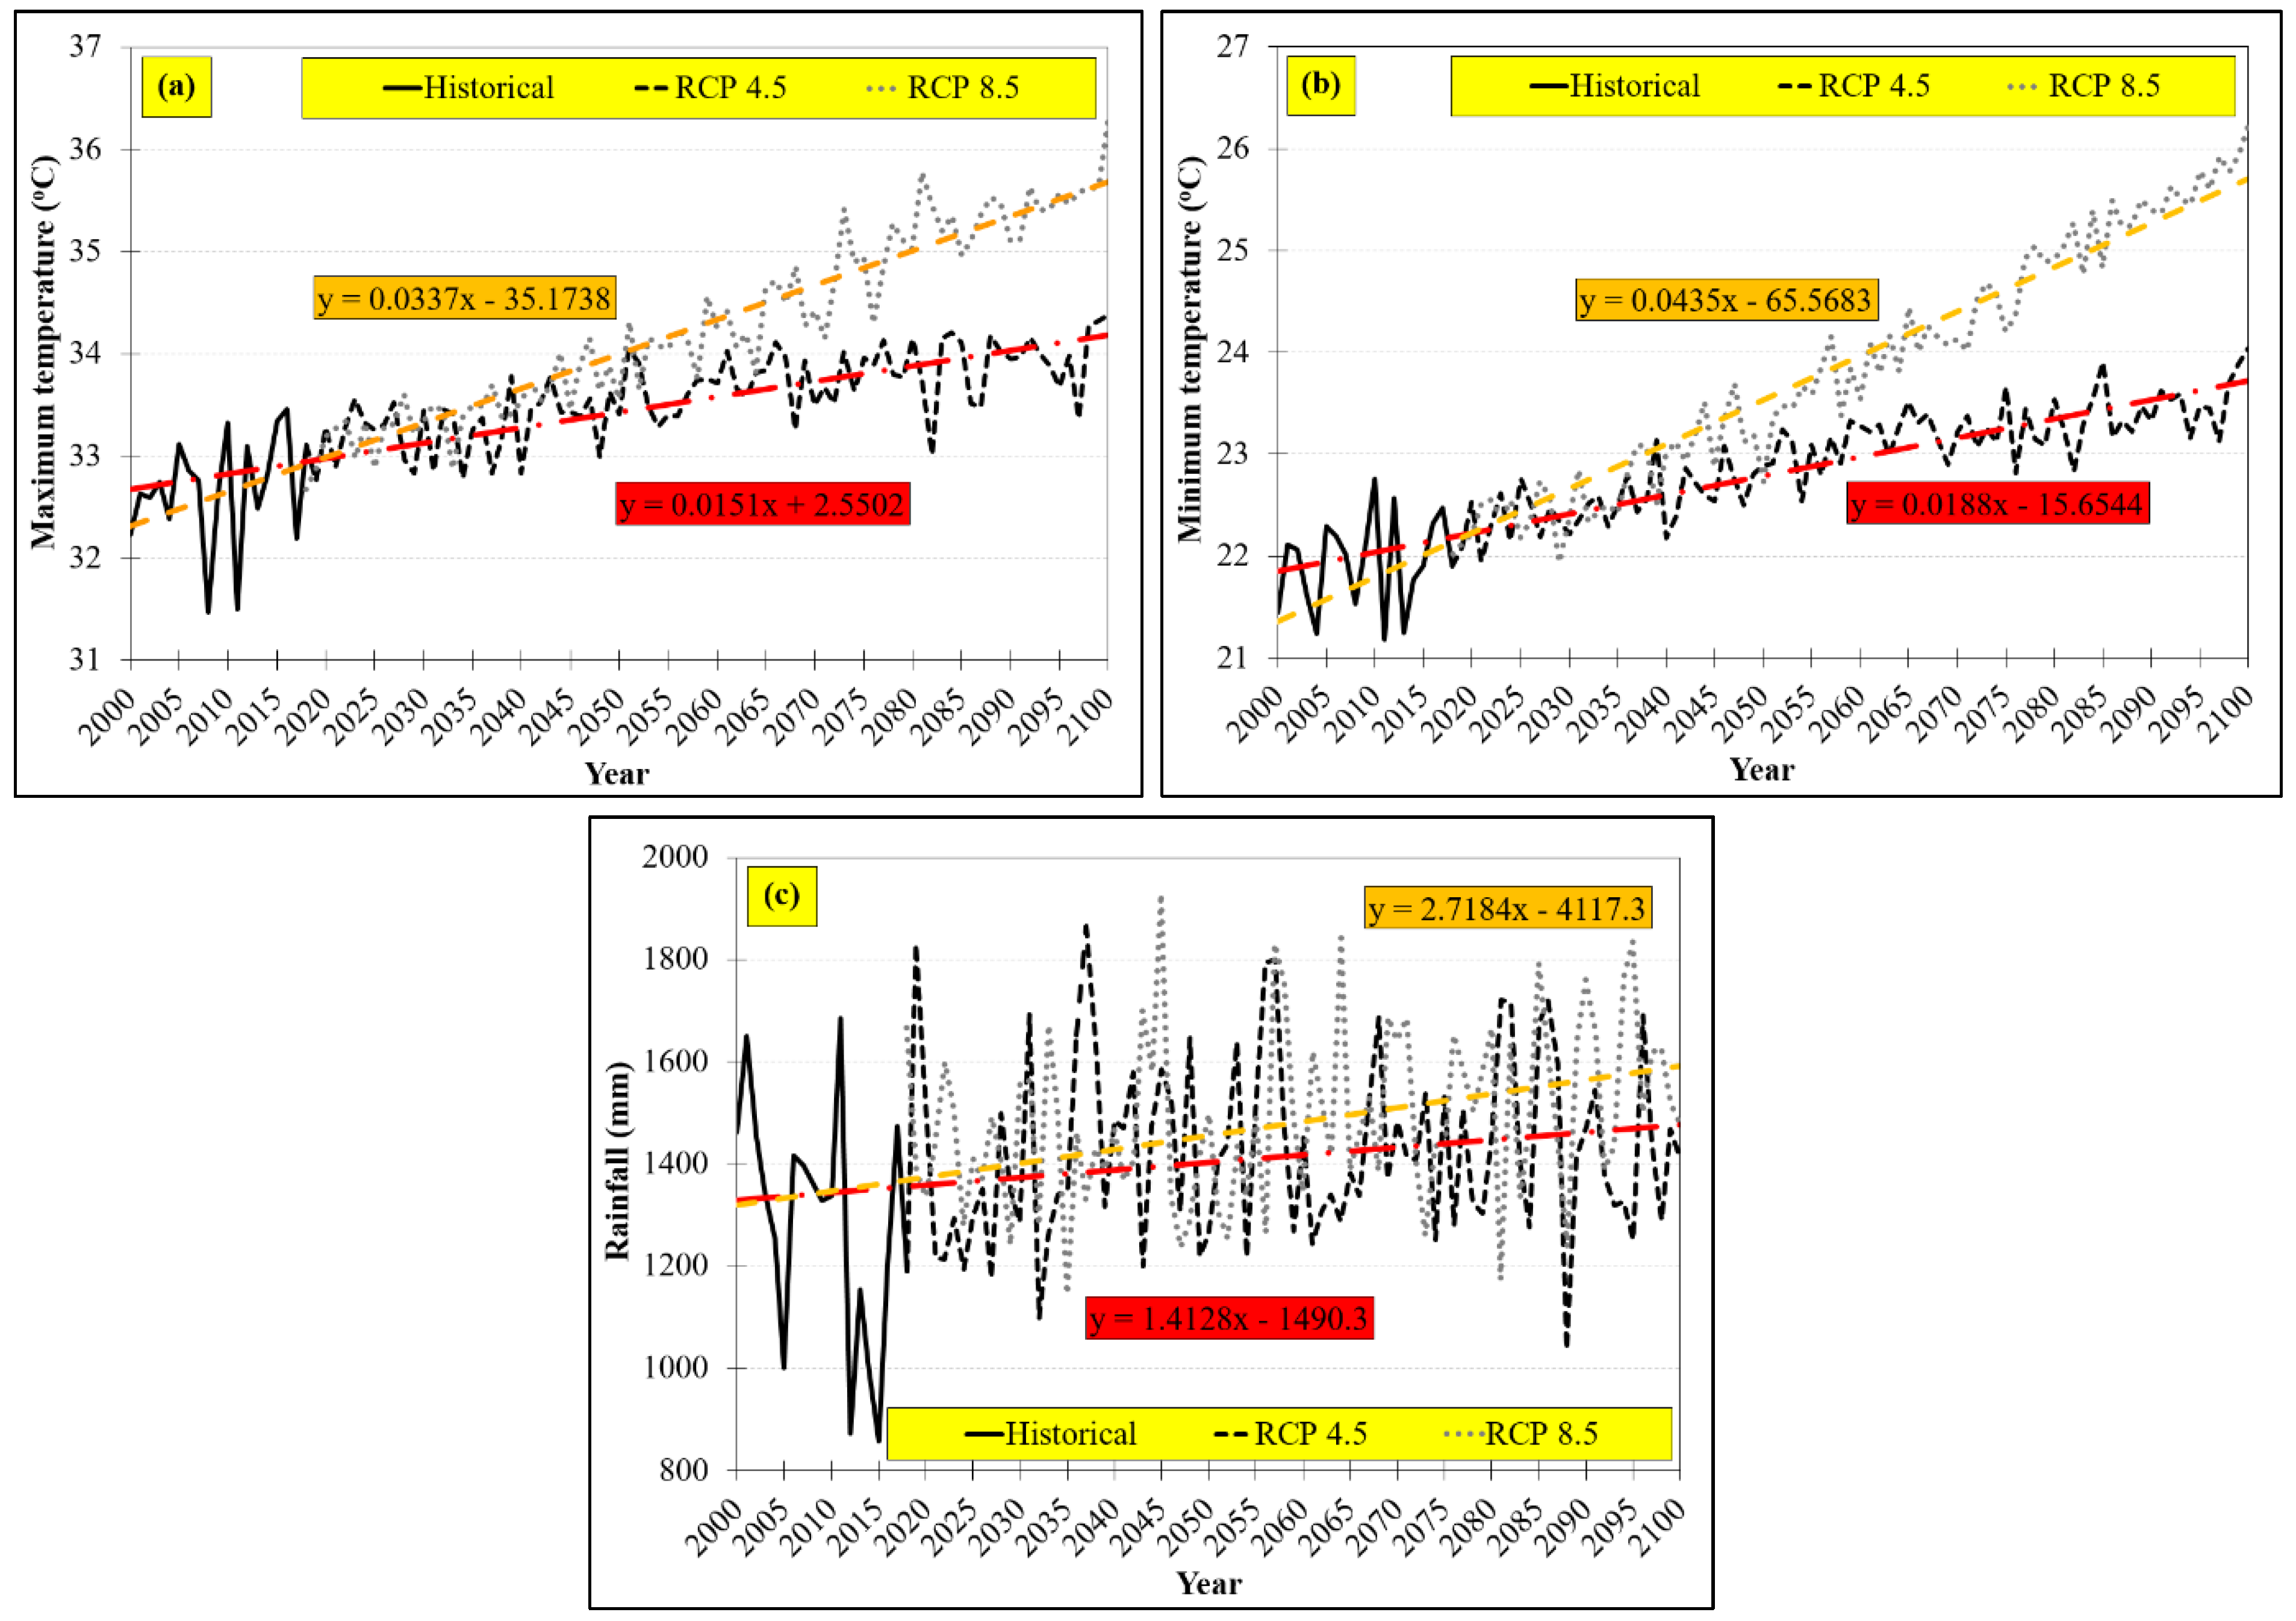
3.1. Analysis of Climate Change Impacts

The results from the analysis of climate change impacts was in the form of future daily rainfall, and maximum and minimum temperatures during 2021–2100 projected by CNRM-CM5, EC-EARTH, and NorESM1-M (note: multiple GCMs were employed to minimize the degree of uncertainty for a better representation and assessment of future climate changes, rather than rely on a single GCM as suggested by Shiferaw et al. [32]). Thereafter, the obtained future climate data from the three GCM models were averaged, in which the rainfall of the Lam Phaniang River Basin was then calculated by the Thiessen polygon method and contribution of every rain gauge was determined using ArcGIS 10.5. Obviously, Figure 5 indicates increasing trends in annual average values of rainfall, and both maximum and minimum temperatures, which were statistically significant at the P < 0.05 level. This is supported by the study of Pipitpukdee et al. [33], who reported the future increases in total rainfall, growing season temperature, and extreme maximum temperature in Northeast Thailand, compared to the baseline. In addition, the rates of their increases under RCP 8.5 were also found to be higher than RCP 4.5. In detail, for the 2021–2100 period against the baseline, the future annual maximum and minimum temperatures were found to be increased by 0.015 °C/year and 0.019 °C/year under RCP 4.5, and 0.034 °C/year and 0.044 °C/year under RCP 8.5, respectively. Under RCPs 4.5 and 8.5, on average in 2100, the increase in maximum temperature from the present situation (2020) would be up to 1.21 °C and 2.70 °C, respectively (Figure 5a), while the minimum temperature would also rise to about 1.50 °C and 3.48 °C, respectively, more than that of present (Figure 5b). The future annual average rainfall across the river basin was also projected to increase by between 1.41 mm (RCP 4.5) and 2.72 mm (RCP 8.5), as illustrated in Figure 5c. By 2100, the future annual rainfall projections under RCP 4.5 were expected to increase to about 113.02 mm and 217.47 mm for RCP 8.5 compared to the present year (2020).

3.2. Analysis of Land Use Change

The detailed results of the analysis of land use change were mainly focused on four different periods, i.e., 2021–2040, 2041–2060, 2061–2080, and 2081–2100. Regarding land use change detection, four classified land use patterns were compared with the 2015 data, in which the identification of changes “-from, -to” information was performed based on a pixel-by-pixel basis between each of the two patterns (see Table 3). Referring to Table 3, the field crop and forested areas tended to decrease over every 20-year future time frame, while a large significant decrease was found by 296.3 km2 and 115.5 km2, respectively, for the period 2081–2100. This corresponds to the statement of the Office of Strategy Management [34] that there would be a decrease in the cultivation areas of field crops due to insufficient water resources to meet its demand within the Upper Northeastern Provincial Cluster 1 (Udon Thani, Loei, Nong Bua Lamphu, Nong Khai, and Bueng Kan Provinces). The 2016 data from reviewed literature (e.g., Office of the National Economic and Social Development Council [35]) also revealed a decrease in forest areas in Northeast Thailand due to expansion of agricultural activities. In contrast, perennial crops were found to increase over every 20-year future time span, and a significant increase was most markedly found during 2081–2100 by 335.5 km2. These findings conform to the observation of Gitz et al. [36], who indicated that the land in Northeast Thailand under perennial rubber tree cultivation has grown rapidly in competition with cassava and rice.

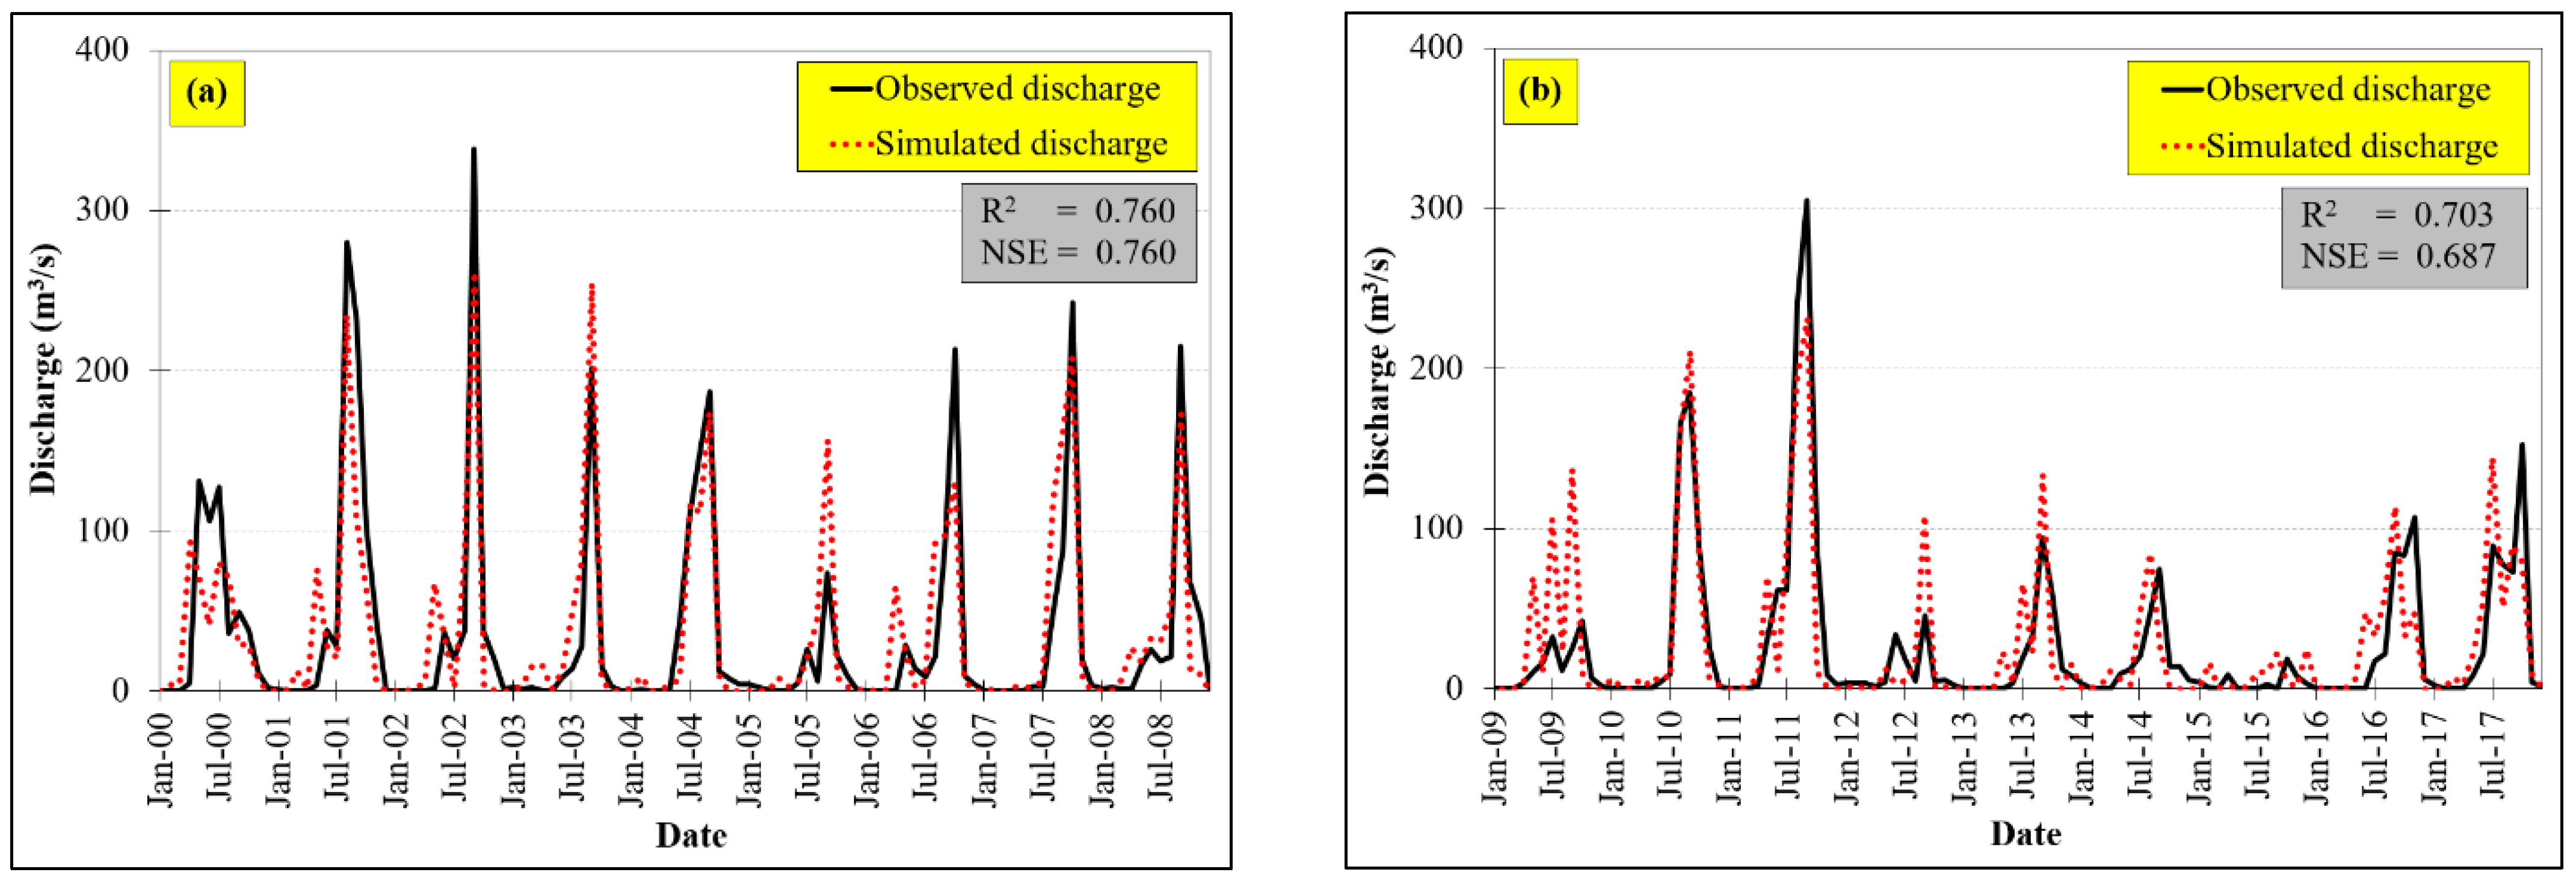
3.3. Calibration and Validation Results of WEAP Model

In this study, the WEAP model was manually calibrated via trial and error [37], and was validated to ensure the simulated monthly discharge of years 2000–2008 and 2009–2017 satisfactorily fit the observed data at station E.68A. Firstly, a graphical technique was used for visual comparisons for both discharges, and for an initial overview of model performance [38]. It was noted that both compared discharges during both periods were in close agreement, however, there was a slight under/over estimation of peaks (see Figure 6). In addition, the robustness and performance of the WEAP model was also found to be good with both calibration and validation statistics of R2 and NSE values equal to 0.76, 0.76 and 0.70, 0.69, respectively. These obtained results indicate the acceptable efficiency of the WEAP model in simulating hydrologic behavior of the Lam Phaniang River Basin, as well as representing river basin processes accurately and predicting their responses to different outputs.

3.4. Analysis of River Basin Water Balance

To capture relevant hydrological processes and river basin water balance, the WEAP model was applied on a monthly basis to incorporate the quantity of water available and the connections among all prioritized users (abstractions, discharge, water transfer, etc.) within the Lam Phaniang River Basin. Based on the WEAP simulation results, the values of all computed variables, i.e., runoff, water demand, and water shortage, were transformed into the mean monthly water balance over the specified time horizons (2000–2100), which was tabulated in Table 4. Interestingly, from the end of the rainy season until the middle of the dry season (October to February), runoff was found to be decreased due to the decrease in rainfall. In contrary, water demand showed the opposite trend to the runoff due to the growing of second rice crops, maize, cassava, and sugarcane after the rainy season, as indicated in the cropping calendar of the Nong Bua Lamphu Provincial Agricultural Extension Office. As a result, water shortage was noticeable during the aforementioned period. In detail, the increase in future annual runoff under RCP 8.5 was higher than RCP 4.5 for all projected periods, while an increase was also found for both RCPs 4.5 and 8.5 scenarios compared to the baseline, except under RCP 4.5 for 2061–2100 due to low rainfall at some certain periods of these years (see Figure 5c and Table 4). The future annual water demand was found to decrease from the baseline due to a large increase in future runoff, especially during 2061–2080 under RCP 8.5, with the largest reduction of approximately 31.81%. Of course, the significant increase in future annual runoff and decrease in future annual water demand would probably ensure sufficient water availability for satisfying long-term average requirements, and also for hedging against water shortages, with a maximum decrease of 51.61% during 2061–2080 under RCP 8.5 compared to the years 2000–2017 (288.93 million m3). However, due to a certain range of total annual water deficit between supply and demand from 139.82 to 288.93 million m3/year, it is still expected that the Lam Phaniang River Basin would probably continue to suffer from a scarcity of water. This interpretation is in line with the findings of Pandhumas et al. [39] that the area of the Lower Nam Phong River Basin (see Figure 1 for its location) would have the highest chance of severe drought due to future climate change.

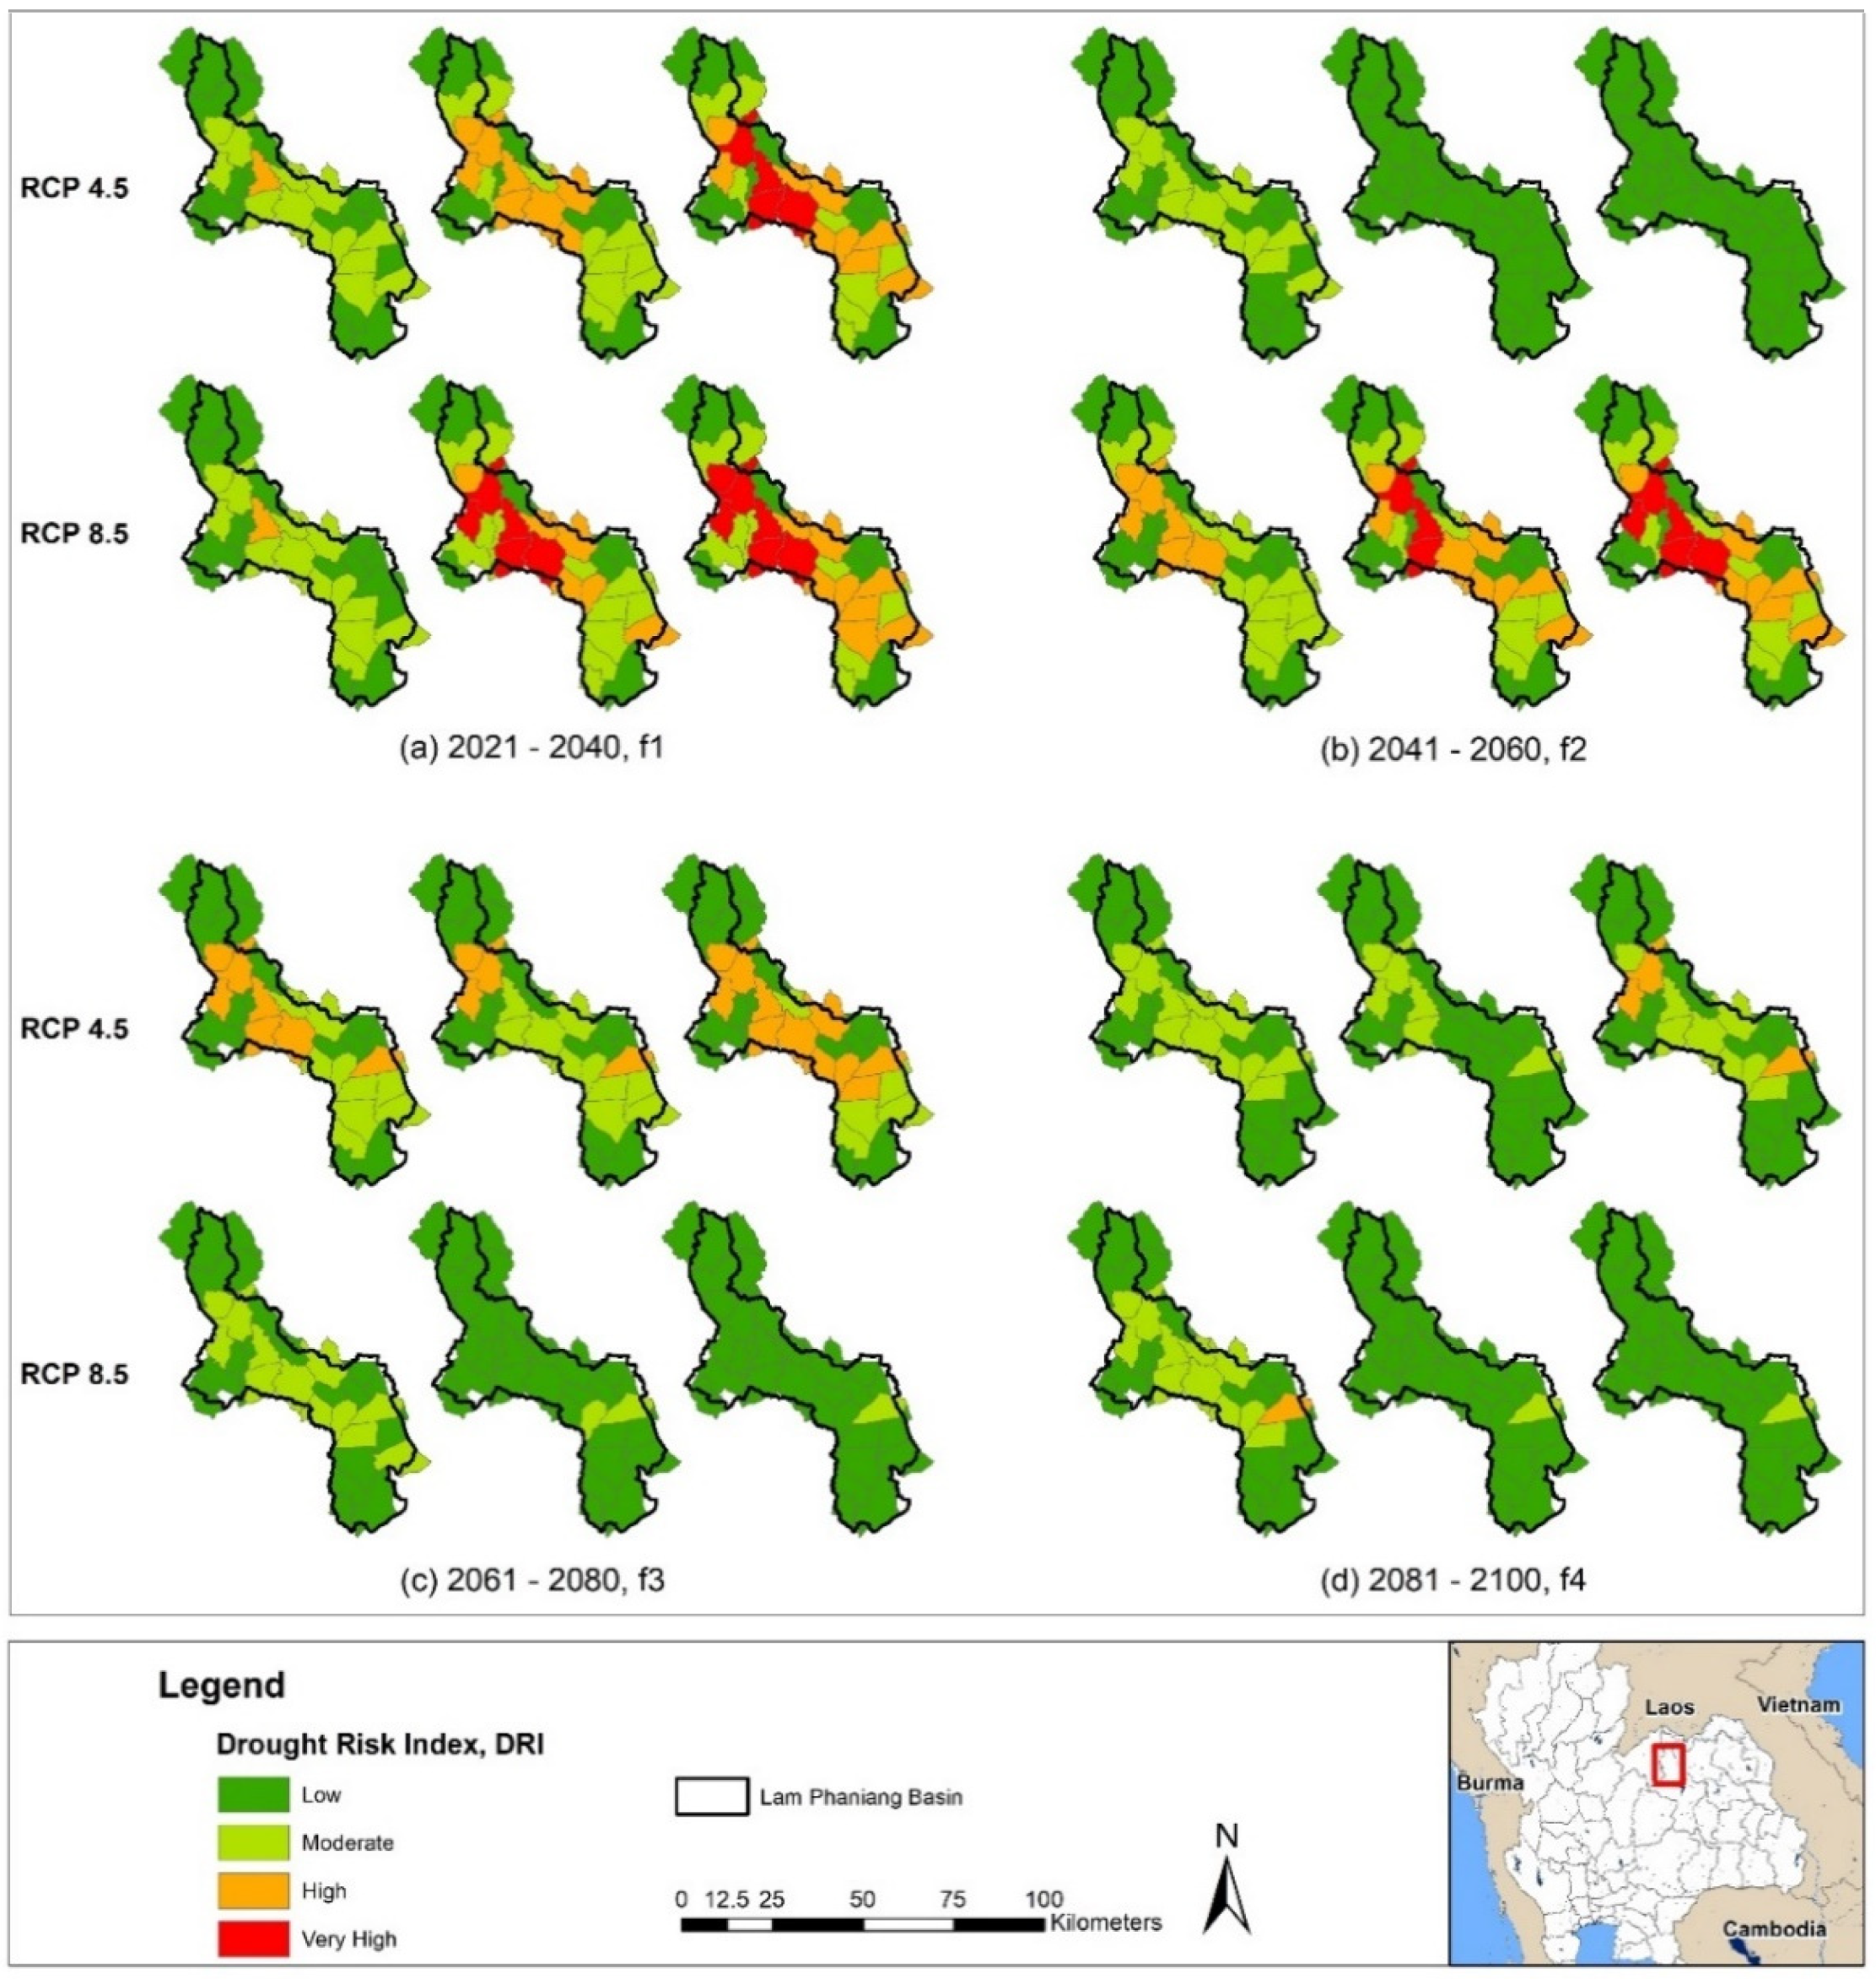
3.5. Comprehensive Analysis of Drought Risk Assessment

To accurately identify the distribution of drought risk, maps of drought risk in the Lam Phaniang River Basin were produced based on the combination of representative indicators of drought vulnerability and hazard. The raster grids of the two aforementioned indicators were calculated by the layer operation function of ArcGIS, in which the drought risk index layer with four risk levels (low, moderate, high, and very high) using the Jenks Natural Breaks method was obtained. Thereafter, the relative risk grade division of drought based on 29 sub-district polygons within the Lam Phaniang River Basin for each period (2000–2017 and 2021–2100) was produced in the form of drought risk maps of 3-, 12-, and 24-month time scales for the Lam Phaniang River Basin. The red color in the maps in Figure 7 and Figure 8 showed the most dangerous risk within a particular time scale and period, while the dark green color shows the area least affected.
In this study, short-term drought was represented by a 3-month time scale, which reflects the soil moisture available from germination until maturity of the crop, and also provides a thorough evaluation of seasonal rainfall during different stages of plant development. However, as emphasized by Vogt et al. [40] and UNDRR [41], the 3-month short-term scale is not able to detect predominantly severe conditions at the drought peak, since the previous quarter rainfall was close to normal. Therefore, intermediate- and long-term droughts (12-month and 24-month) were considered to reflect inter-seasonal and long-term rainfall patterns, which would potentially show the lack of rainfall during the previous one and two years, respectively, and is likely to lead to changing of streamflow, groundwater, and reservoir levels [42,43,44,45]. When considering the average drought risk in sub-districts in the Lam Phaniang River Basin, during 2000–2017 at a 3-month time scale, the dark green polygons located in the western part covering some parts of the Sap Phaiwan Sub-district (Sd-18), Erawan District, Loei Province, central part covering Thep Khiri Sub-district (Sd-10), Na Wang District, Nong Bua Lamphu Province, eastern part covering some parts of Nong Phai Sun (Sd-14), Lam Phu (Sd-15), Pho Chai (Sd-17), and Nong Sawan (Sd-19) Sub-districts, Mueang District, Nong Bua Lamphu Province, and southern part covering Khok Muang Sub-district (Sd-27), Non Sang District and Nong Bua Tai Sub-district (Sd-29), Si Bun Rueang District, Nong Bua Lamphu Province, showed a homogenized low drought risk zone. The remaining light green part falls into moderate drought conditions (Figure 7a), which corresponds to the study of TNMC [46], who found that Nong Bua Lamphu Province (covering most of the area of the Lam Phaniang River Basin) was likely to be drought-prone with high vulnerability for both domestic water and agriculture. The outputs of the 12-month time scale revealed that a low drought risk area was found in six sub-districts located in the midstream of the Lam Phaniang River Basin, i.e., Pha Sam Yot (Sd-13) and Sap Phaiwan (Sd-18) Sub-districts, Erawan District, Loei Province, and Nong Bua Lamphu Province covering Wang Thong (Sd-7), Thep Khiri (Sd-10), and Na Lao (Sd-11) Sub-districts, Na Wang District, and Kut Hae Sub-district (Sd-4), Na Klang District. Twelve sub-districts of Nong Bua Lamphu Province located in the downstream were also identified as low risk zone, i.e., sub-districts within Mueang District including Nong Phai Sun (Sd-14), Lam Phu (Sd-15), Pho Chai (Sd-17), Nong Sawan (Sd-19), Nong Bua (Sd-20), Ban Kham (Sd-23), Ban Phrao (Sd-24), Na Mafueang (Sd-25), Hua Na (Sd-26), and Pa Mai Ngam (Sd-28), Non Sang District including Khok Muang Sub-district (Sd-27), and Si Bun Rueang District including Nong Bua Tai Sub-district (Sd-29), while the remaining sub-districts were at moderate level (Figure 7b). In addition, the entire river basin area was found at a low drought risk level for a 24-month time scale (Figure 7c). It can be noticed that for short- and intermediate-time scales, the upstream dominant field crop together with the dominant paddy field grown in the mid- and downstream areas, were designated to be at moderate risk (see Figure 1 for land use types). As a consequence, the effects may eventually lead to a reduction of crop yield, which requires various drought risk reduction interventions for resilience and disaster preparedness for effective response.
Regarding the future drought risk under RCP 4.5 during 2021–2040 (Figure 8a), at the 3-month time scale, high drought risk was mainly located in the middle part of the river basin, i.e., Dan Chang Sub-district (Sd-6), Na Klang District, Nong Bua Lamphu Province, in which the moderate drought risk was identified at the mid- and downstream parts, and the rest was defined as low risk level. When focusing on the 12-month time scale, high drought risk expanded in the central part of the river basin within Nong Bua Lamphu Province covering Na Wang District, i.e., Na Kae (Sd-3), Wang Pla Pom (Sd-5), and Wang Thong (Sd-7) Sub-districts, Na Klang District, i.e., Dan Chang (Sd-6), Fang Daeng (Sd-12), and Uthai Sawan (Sd-16) Sub-districts, and Mueang District, i.e., Na Kham Hai (Sd-9) and Non Khamin (Sd-21) Sub-districts, whereas the up- and downstream parts were mostly at a moderate risk level. At the 24-month time scale, within Nong Bua Lamphu Province, a very high drought risk zone was found in the midstream area including Na Wang District, i.e., Na Kae Sub-district (Sd-3), and Na Klang District, i.e., Dan Chang (Sd-6), Fang Daeng (Sd-12), and Uthai Sawan (Sd-16) Sub-districts, which were encompassed by high risk areas such as Na Wang District, i.e., Wang Pla Pom (Sd-5) and Wang Thong (Sd-7) Sub-districts, Na Klang District, i.e., Na Klang Sub-district (Sd-8), and Mueang District, i.e., Na Kham Hai (Sd-9), Nong Bua (Sd-20), Non Khamin (Sd-21), Nong Wa (Sd-22), Ban Phrao (Sd-24), and Na Mafueang (Sd-25). For RCP 8.5, at the 3-month time scale, the drought risk levels were found to be the same as RCP 4.5, except for a change at the downstream from a low to moderate level at Pa Mai Ngam Sub-district (Sd-28), and vice versa at Nong Bua Sub-district. The drought risk at the 12-month time scale under RCP 8.5 compared to RCP 4.5 was transformed in Nong Bua Lamphu Province from a high to very high level at Na Wang District, i.e., Na Kae (Sd-3) and Wang Thong (Sd-7) Sub-districts and Na Klang District, i.e., Dan Chang (Sd-6), Fang Daeng (Sd-12), and Uthai Sawan (Sd-16) Sub-districts, while the other areas remained almost the same risk levels. At the 24-month time scale under RCP 8.5, the high risk level was raised to a very high level at Wang Pla Pom (Sd-5) and Wang Thong (Sd-7) Sub-districts, Na Wang District, Nong Bua Lamphu Province, whereas the other risk zones and levels were found to be the same as RCP 4.5.
In Figure 8b, during 2041–2060, at the 3-month time scale under RCP 4.5, the drought risk in Na Wang District, i.e., Na Kae (Sd-3), Wang Pla Pom (Sd-5), and Wang Thong (Sd-7) Sub-districts and Na Klang District, i.e., Dan Chang (Sd-6), Fang Daeng (Sd-12), and Uthai Sawan (Sd-16) Sub-districts, Nong Bua Lamphu Province, was exacerbated from a moderate to high risk level when compared to RCP 8.5, in which the risk level in the areas of Loei Province, i.e., Na Duang Sub-district (Sd-2), Na Duang District and Nong Bua Lamphu Province, i.e., Na Klang Sub-district (Sd-8), Na Klang District, and Ban Kham (Sd-23), Hua Na (Sd-26), and Pa Mai Ngam (Sd-28) Sub-districts, Mueang District, was shifted from low to moderate. Considering the 12-month time scale, the low risk level under RCP 4.5 was converted to a very high risk level under RCP 8.5 in Na Wang District, i.e., Na Kae Sub-district (Sd-3) and Na Klang District, i.e., Dan Chang (Sd-6) and Uthai Sawan (Sd-16) Sub-districts, Nong Bua Lamphu Province, while the low risk level was also transferred to a high risk level at Na Wang District, i.e., Wang Pla Pom (Sd-5) and Wang Thong (Sd-7) Sub-districts, Na Klang District, i.e., Fang Daeng Sub-district (Sd-12), Mueang District, i.e., Na Kham Hai (Sd-9), Nong Bua (Sd-20), Non Khamin (Sd-21), Nong Wa (Sd-22), and Na Mafueang (Sd-25) Sub-districts, Nong Bua Lamphu Province. At the 24-month time scale, the risk levels remained unchanged from the 12-month time scale for both RCPs 4.5 and 8.5, except the risks under RCP 8.5 in the areas of Na Wang District, i.e., Wang Thong Sub-district (Sd-7), Na Klang District, i.e., Fang Daeng Sub-district (Sd-12), and Mueang District, i.e., Nong Sawan (Sd-19) and Ban Phrao (Sd-24) Sub-districts, Nong Bua Lamphu Province, which were elevated from high to very high, high to very high, low to moderate, and moderate to high levels, respectively. Importantly, especially under the more severe RCP 8.5 scenario, the results for this period are also consistent with the near future period (2021–2040), which strongly indicates the high and very high drought risk levels for some districts located at the midstream of the Lam Phaniang River Basin.
For the period 2061–2080 (Figure 8c), at the 3-month time scale under RCP 4.5, high risk was found at Na Wang District, i.e., Na Kae (Sd-3), Wang Pla Pom (Sd-5), and Wang Thong (Sd-7) Sub-districts, Na Klang District, i.e., Dan Chang (Sd-6), Fang Daeng (Sd-12), and Uthai Sawan (Sd-16) Sub-districts, and Mueang District, i.e., Nong Bua Sub-district (Sd-20), Nong Bua Lamphu Province, while the risk level at the same areas was determined to be on the moderate category under RCP 8.5. Based on the 12-month time-scale under RCP 4.5, a high risk level was only found at Na Wang District, i.e., Na Kae (Sd-3), Wang Pla Pom (Sd-5), and Wang Thong (Sd-7) Sub-districts and Mueang District, i.e., Nong Bua Sub-district (Sd-20), Nong Bua Lamphu Province, while under RCP 8.5, a moderate level was only observed at Mueang District, i.e., Nong Bua (Sd-20) and Nong Wa (Sd-22) Sub-districts, Nong Bua Lamphu Province, and the rest were low level. At 24-month time scale under RCP 4.5, the high risk level extended further from the 3-month time scale to the areas of Mueang District, i.e., Na Kham Hai (Sd-9), Non Khamin (Sd-21), Nong Wa (Sd-22), and Ban Phrao (Sd-24) Sub-districts, Nong Bua Lamphu Province, while under RCP 8.5, most of the areas were at a low level except Nong Bua Sub-district (Sd-20), Mueang District, Nong Bua Lamphu Province, which were moderate level.
During 2081–2100 (Figure 8d), at the 3-month time scale, the same risk levels were observed for both RCP 4.5 and 8.5, except for moderate risk under RCP 4.5 at Nong Bua Sub-district (Sd-20), Mueang District, Nong Bua Lamphu Province, which turned to high risk under RCP 8.5. At the 12-month time scale under RCP 4.5, moderate risk was found at Na Wang District, i.e., Na Kae (Sd-3), Wang Pla Pom (Sd-5), and Wang Thong (Sd-7) Sub-districts, Na Klang District, i.e., Dan Chang (Sd-6) and Uthai Sawan (Sd-16) Sub-districts, Mueang District, i.e., Nong Bua Sub-district (Sd-20), Nong Bua Lamphu Province, and the remaining areas were observed as low risk. Regarding the 24-month time scale under RCP 4.5, moderate risk turned to high risk at Na Wang District, i.e., Na Kae (Sd-3) and Wang Thong (Sd-7) Sub-districts and Mueang District, i.e., Nong Bua Sub-district (Sd-20), Nong Bua Lamphu Province, while at the 12- and 24-month time scales under RCP 8.5, only Nong Bua Sub-district (Sd-20), Mueang District, and Nong Bua Lamphu Province remained at moderate level and others remained at low level. When considering the period 2061–2100, the overall drought risk levels under both RCPs 4.5 and 8.5 mostly varied between low to moderate with the exception of the period 2061–2080 under RCP 4.5, where the drought risk level at the midstream increased to high.
Referring to Table 5, a large picture of drought risk based on DRI in the entire Lam Phaniang River Basin was delineated for evaluating long-term drought trends, as well as tracking directly how drought levels have changed over time. Overall, drought risk has a decreasing trend throughout the future time periods. In details, the results for the 3-month time scale showed moderate drought risk for the baseline and the period 2021–2060 under both RCPs, and low drought risk for the period 2061–2100, with the exception of RCP 4.5 during 2041–2060 and 2061–2080 where drought risks turn to low and moderate categories, respectively. At the 12-month time scale, the severity of drought was projected from low risk at baseline to moderate risk during 2021–2060, and remains at low risk during 2061–2100, with the exception of RCP 4.5 during 2041–2060 and 2061–2080 where low and moderate risks were found, respectively. When considering the 24-month time scale, the drought risks were most likely to be the same as the case of 12-month time scale, except the high drought risk which seems to have an upsurge during 2021–2040 under RCP 8.5.

4. Conclusions

This study assessed future climate and land use change impacts on drought severity and vulnerability of the Lam Phaniang River Basin. Based on the future simulations (2021–2100) of three GCMs, i.e., CNRM-CM5, EC-EARTH, and NorESM1-M under RCPs 4.5 and 8.5, against baseline (2000–2017), it was found that the average results of future rainfall, and maximum and minimum temperatures were expected to increase by 1.41 mm, and 0.015 °C/year and 0.019 °C/year, respectively, under RCP 4.5 and by about 2.72 mm, and 0.034 °C/year and 0.044 °C/year, respectively, under RCP 8.5. For change detection over the previous years (2010 to 2015), future land use from 2021 to 2100 were predicted. It was found that compared to the 2015 baseline, field crops would continue to decrease significantly through 2100 with a tremendous increase by 296.3 km2 during 2081–2100, while in contrast perennial crops would continue to increase remarkably through 2100 with a maximum decrease by 335.5 km2 during 2081–2100. The WEAP model was then applied in combination with downscaled climate and land use projections to indicate how the future status of water shortage would change due to ongoing changes. The WEAP simulation results revealed that compared to baseline, future annual water demand was projected to decrease by up to 31.81% under RCP 8.5 during 2061–2080. Consequently, a decrease of future water shortage seems to occur in which a maximum decrease of 51.61% was found during 2061–2080 under RCP 8.5 compared to baseline. The outputs of GCMs coupled with WEAP model and SPEI drought index were used to assess the drought risk at 3-, 12-, and 24-month time scales for the Lam Phaniang River Basin. For a better understanding of the spatial characteristics of drought risk prone areas, drought risk maps were created. Based on a river basin-wide assessment, the spatial pattern of drought risk tendency revealed that the Lam Phaniang River Basin is exposed to future climate and land use changes to varying degrees. Clearly, the vast majority of the upper and lower parts were dominated by low and moderate risk levels at all time scales under both RCP 4.5 and 8.5. In the central part, during 2021–2040, a very high risk level of the 12- and 24-month time scales under both RCP 4.5 and 8.5 was found especially in Na Wang District (Na Kae, Wang Pla Pom, and Wang Thong Sub-districts), Na Klang District (Dan Chang, Fang Daeng, and Uthai Sawan Sub-districts), and Nong Bua Lamphu Province. During 2041–2060, a very high risk level of the 12- and 24-month time scales under only RCP 8.5 was concentrated particularly in Na Wang District (Na Kae and Wang Thong Sub-districts), Na Klang District (Dan Chang, Fang Daeng, and Uthai Sawan Sub-districts), and Nong Bua Lamphu Province. For the period 2061–2080, the high drought risk level was identified at all time scales only under RCP 4.5, while low and moderate levels were determined at all time scales under RCP 8.5. Over the period 2081–2100, the drought risk decreases to low and moderate levels at all time scales under both RCP 4.5 and 8.5. The overall findings implicate that the comprehensive framework applied herein for the Lam Phaniang River Basin could be applied and adapted for other river basins in Northeast Thailand, in which the obtained findings could be utilized as necessary information and guidance for preparedness, resilience, adaptive behavior, and intensified localized planning schemes to droughts under climate and land use change impacts. Finally, despite the efforts already made so far, there are points that require further work to be undertaken. One is that there is a desire for the detailed application of crop simulation models for assessing climate change impacts on growth, yield, and water requirement of crops in the Lam Phaniang River Basin. For the development of a realistic simulation, depending on crop types and geographical locations, the consideration of adaptation in cultivation practices, e.g., shifting of non-suitable areas to suitable agricultural production based on a “Zoning by Agri-Map”, changing the cropping calendar, adopting new cultivars, etc. should also be addressed.

Author Contributions

Conceptualization, K.K.; methodology, K.K.; software, K.K. and S.W.; validation, K.K. and S.W.; formal analysis, S.W.; investigation, K.K. and S.W.; writing—original draft preparation, K.K.; writing—review and editing, K.K.; supervision, K.K.; project administration, K.K. All authors have read and agreed to the published version of the manuscript.

Funding

This research was funded by Department of Civil Engineering, Faculty of Engineering, Khon Kaen University, contract number 5/2561.

Acknowledgments

The authors gratefully acknowledge the financial support for this study provided by the Department of Civil Engineering, Faculty of Engineering, Khon Kaen University, as well as the helpful comments and suggestions of several anonymous reviewers. Appreciation is expressed for the contributions by Department of Civil Engineering, Faculty of Engineering, Khon Kaen University, Sustainable Infrastructure Research and Development Center (SIRDC), and Center for Water Resources Engineering and Environment. A number of institutions, i.e., Regional Irrigation Office 6, Royal Irrigation Department, Water Resources Regional Office 4, Department of Water Resources, Northeast Hydro Power Plant, Electricity Generating Authority of Thailand (EGAT), Upper Northeastern Meteorological Center, Thai Meteorological Department, and Land Development Department (LDD), also deserve special acknowledgment from the authors for their magnificent cooperation in providing data used in this study.

Conflicts of Interest

The authors declare no conflict of interest. The funders had no role in the design of the study; in the collection, analyses, or interpretation of data; in the writing of the manuscript, or in the decision to publish the results.

References

  1. Krittasudthacheewa, C.; Polpanich, O.; Bush, A.; Srikuta, P.; Kemp-Benedict, E.; Inmuong, Y.; Inmuong, U.; Featherston, P.; Eagleton, G.; Naruchaikusol, S.; et al. Final Report for the Northeast Thailand Futures: A Local Study of the Exploring Mekong Region Futures Project. Report submitted to Commonwealth Scientific and Industrial Research Organisation. 2012. Available online: https://www.weap21.org/downloads/07_Final%20Completion%20Report_NE%20Thailand_Futures_12Dec2012.pdf (accessed on 20 March 2021).
  2. Van Dau, Q.; Kuntiyawichai, K.; Suryadi, F.X. Drought Severity Assessment in the Lower Nam Phong River Basin, Thailand. Songklanakarin J. Sci. Technol. 2017, 40, 985–992. [Google Scholar]
  3. Ahokpossi, Y. Analysis of the Rainfall Variability and Change in the Republic of Benin (West Africa). Hydrol. Sci. J. 2018, 63, 2097–2123. [Google Scholar] [CrossRef]
  4. Meliho, M.; Khattabi, A.; Jobbins, G.; Sghir, F. Impact of Meteorological Drought on Agriculture in the Tensift Watershed of Morocco. J. Water Clim. Chang. 2020, 11, 1323–1338. [Google Scholar] [CrossRef]
  5. Silungwe, F.R.; Graef, F.; Bellingrath-Kimura, S.D.; Tumbo, S.D.; Kahimba, F.C.; Lana, M.A. Analysis of Intra and Interseasonal Rainfall Variability and its Effects on Pearl Millet Yield in a Semiarid Agroclimate: Significance of Scattered Fields and Tied Ridges. Water 2019, 11, 578. [Google Scholar] [CrossRef] [Green Version]
  6. Babel, M.S.; Agarwal, A.; Swain, D.K.; Herath, S. Evaluation of Climate Change Impacts and Adaptation Measures for Rice Cultivation in Northeast Thailand. Clim. Res. 2011, 46, 137–146. [Google Scholar] [CrossRef] [Green Version]
  7. Polthanee, A.; Promkhumbut, A.; Bamrungrai, J. Drought Impact on Rice Production and Farmers’ Adaptation Strategies in Northeast Thailand. Int. J. Environ. Rural Dev. 2014, 5-1, 45–52. [Google Scholar]
  8. Prabnakorn, S.; Maskey, S.; Suryadi, F.X.; de Fraiture, C. Rice Yield in Response to Climate Trends and Drought Index in the Mun River Basin, Thailand. Sci. Total Environ. 2018, 621, 108–119. [Google Scholar] [CrossRef] [PubMed]
  9. Department of Water Resources. The Comprehensive Water Resources Management Plan in the Chi River Basin: Report for the Lam Phaniang River Basin; Ministry of Natural Resources and Environment: Bangkok, Thailand, 2006. (In Thai) [Google Scholar]
  10. Secretariat Office of the Chi River Basin Committee. Management of the Chi River Basin; Water Resources Regional Office 4, Department of Water Resources, Ministry of Natural Resources and Environment: Khon Kaen, Thailand, 2012. (In Thai) [Google Scholar]
  11. Torma, C.; Giorgi, F.; Coppola, E. Added Value of Regional Climate Modeling over Areas Characterized by Complex Terrain—Precipitation over the Alps. J. Geophys. Res. Atmos. 2015, 120, 3957–3972. [Google Scholar] [CrossRef]
  12. Durman, C.F.; Gregory, J.M.; Hassell, D.C.; Jones, R.G.; Murphy, J.M. A Comparison of Extreme European Daily Precipitation Simulated by a Global and a Regional Climate Model for Present and Future Climates. Q. J. R. Meteorol. Soc. 2001, 127, 1005–1015. [Google Scholar] [CrossRef]
  13. Herrera, S.; Fita, L.; Fernández, J.; Gutiérrez, J.M. Evaluation of the Mean and Extreme Precipitation Regimes from the ENSEMBLES Regional Climate Multimodel Simulations over Spain. J. Geophys. Res. 2010, 115, D21117. [Google Scholar] [CrossRef] [Green Version]
  14. Rathjens, H.; Bieger, K.; Srinivasan, R.; Chaubey, I.; Arnold, J.G. Cmhyd User Manual: Documentation for Preparing Simulated Climate Change Data for Hydrologic Impact Studies. Available online: https://swat.tamu.edu/media/115265/bias_cor_man.pdf (accessed on 6 January 2020).
  15. Teutschbein, C.; Seibert, J. Bias Corretion of Regional Climate Model Simulations for Hydrological Climate-Change Impact Studies: Review and Evaluation of Different Methods. J. Hydrol. 2012, 456–457, 12–29. [Google Scholar] [CrossRef]
  16. Heistermann, M.; Muller, C.; Ronneberger, K. Land in Sight? Achievements, Deficits and Potentials of Continental to Global Scale Modeling. Agric. Ecosyst. Environ. 2006, 114, 141–158. [Google Scholar] [CrossRef]
  17. Eastman, J.R. Terrset Geospatial Monitoring and Modeling System; Clark Labs, Clark University: Worcester, MA, USA, 2016. [Google Scholar]
  18. Kuntiyawichai, K.; Sri-Amporn, W.; Wongsasri, S.; Chindaprasirt, P. Anticipating of Potential Climate and Land Use Change Impacts on Floods: A Case Study of the Lower Nam Phong River Basin. Water 2020, 12, 1158. [Google Scholar] [CrossRef] [Green Version]
  19. Kamal, N.; Imran, M.; Tripati, N.K. Greening the Urban Environment using Geospatial Techniques, A Case Study of Bangkok, Thailand. Procedia Environ. Sci. 2017, 37, 141–152. [Google Scholar] [CrossRef]
  20. Lambin, E.F. Modelling Deforestation Processes: A Review; TREES Publications Series B. Research Report No.1, EUR 15744 EN; European Commission: Luxenbourg, 1994. [Google Scholar]
  21. Moghadam, H.S.; Helbich, M. Spatiotemporal Urbanization Processes in the Megacity of Mumbai, India: A Markov Chains-Cellular Automata Urban Growth Model. Appl. Geogr. 2013, 40, 140–149. [Google Scholar] [CrossRef]
  22. Veldkamp, A.; Lambin, E.F. Predicting Land-Use Change. Agric. Ecosyst. Environ. 2001, 85, 1–6. [Google Scholar] [CrossRef]
  23. Stockholm Environment Institute (SEI). WEAP Tutorial: A Collection of Stand-Alone Modules to Aid in Learning the WEAP Software; Stockholm Environment Institute: Stockholm, Sweden, 2016. [Google Scholar]
  24. Okyereh, S.A.; Ofosu, E.A.; Kabobah, A.T. Modelling the Impact of Bui Dam Operations on Downstream Competing Water Uses. Water-Energy Nexus 2019, 2, 1–9. [Google Scholar] [CrossRef]
  25. Me, W.; Abell, J.M.; Hamilton, D.P. Effects of Hydrologic Conditions on SWAT Model Performance and Parameter Sensitivity for a Small, Mixed Land Use Catchment in New Zealand. Hydrol. Earth Syst. Sci. 2015, 19, 4127–4147. [Google Scholar] [CrossRef] [Green Version]
  26. Ligaray, M.; Kim, M.; Baek, S.; Ra, J.S.; Chun, J.A.; Park, Y.; Boithias, L.; Ribolzi, O.; Chon, K.; Cho, K.H. Modeling the Fate and Transport of Malathion in the Pagsanjan-Lumban Basin, Philippines. Water 2017, 9, 451. [Google Scholar] [CrossRef] [Green Version]
  27. Vicente-Serrano, S.M.; Begueria, S.; Lopez-Moreno, J.I. A Multiscalar Drought Index Sensitive to Global Warming: The Standardized Precipitation Evapotranspiration Index. J. Clim. 2010, 23, 1696–1718. [Google Scholar] [CrossRef] [Green Version]
  28. Zeng, Z.; Wu, W.; Li, Z.; Zhou, Y.; Huang, H. Quantitative Assessment of Agricultural Drought Risk in Southeast Gansu Province, Northwest China. Sustainability 2019, 11, 5533. [Google Scholar] [CrossRef] [Green Version]
  29. Smith, R.M. Comparing Traditional Methods for Selecting Class Intervals on Choropleth Maps. Prof. Geogr. 1986, 38, 62–67. [Google Scholar] [CrossRef]
  30. Parry, M.L.; Canziani, O.F.; Palutikof, J.P.; van der Linden, P.J.; Hanson, C.E. (Eds.) IPCC. Climate Change 2007: Impacts, Adaptation and Vulnerability. In Contribution of Working Group II to the Fourth Assessment Report of the Intergovernmental Panel on Climate Change; Cambridge University Press: Cambridge, UK, 2007; 976p. [Google Scholar]
  31. Birkmann, J. Risk and Vulnerability Indicators at Different Scales: Applicability, Usefulness and Policy Implications. Environ. Hazards 2007, 7, 20–31. [Google Scholar] [CrossRef]
  32. Shiferaw, H.; Gebremedhin, A.; Gebretsadkan, T.; Zenebe, A. Modelling Hydrological Response under Climate Change Scenarios using SWAT Model: The Case of Ilala Watershed, Northern Ethiopia. Modeling Earth Syst. Environ. 2018, 4, 437–449. [Google Scholar] [CrossRef]
  33. Pipitpukdee, S.; Attavanich, W.; Bejranonda, S. Climate Change Impacts on Sugarcane Production in Thailand. Atmosphere 2020, 11, 408. [Google Scholar] [CrossRef] [Green Version]
  34. Office of Strategy Management. The 4-Year Development Plan of Upper Northeastern Provincial Cluster 1 (2017–2021); The Office of Strategy Management: Upper Northeastern Provincial Cluster 1: Udon Thani, Thailand, 2015. (In Thai) [Google Scholar]
  35. Office of the National Economic and Social Development Council. The Direction of the Twelfth National Economic and Social Development Plan (2017–2021); Office of The Prime Minister: Bangkok, Thailand, 2017. (In Thai) [Google Scholar]
  36. Gitz, V.; Meybeck, A.; Pinizzotto, S.; Nair, L.; Penot, E.; Baral, H.; Jianchu, X. Sustainable Development of Rubber Plantations in a Context of Climate Change: Challenges and Opportunities; FTA Brief 4; CIFOR: Bogor, Indonesia, 2020. [Google Scholar]
  37. Yates, D.; Purkey, D.; Sieber, J.; Huber-Lee, A.; Galbraith, H. WEAP21—A Demand-, Priority-, and Preference-Driven Water Planning Model. Water Int. 2005, 30, 501–512. [Google Scholar] [CrossRef]
  38. Krause, P.; Boyle, D.P.; Base, F. Comparison of Different Efficiency Criteria for Hydrological Model Assessment. Adv. Geosci. 2005, 5, 89–97. [Google Scholar] [CrossRef] [Green Version]
  39. Pandhumas, T.; Kuntiyawichai, K.; Jothityangkoon, C.; Suryadi, F.X. Assessment of Climate Change Impacts on Drought Severity using SPI and SDI over the Lower Nam Phong River Basin, Thailand. Eng. Appl. Sci. Res. 2020, 47, 326–338. [Google Scholar]
  40. Vogt, J.V.; Naumann, G.; Masante, D.; Spinoni, J.; Cammalleri, C.; Erian, W.; Pischke, F.; Pulwarty, R.; Barbosa, P. Drought Risk Assessment and Management. A Conceptual Framework; EUR 29464 EN; Publications Office of the European Union: Luxembourg, 2018; ISBN 978-92-79-97469-4. [Google Scholar] [CrossRef]
  41. UNDRR. Global Assessment Report on Disaster Risk Reduction, Geneva, Switzerland; United Nations Office for Disaster Risk Reduction UNDRR: Geneva, Switzerland, 2019. [Google Scholar]
  42. Rouault, M.; Richard, Y. Intensity and Spatial Extension of Drought in South Africa at Different Timescales. Water SA 2003, 29, 489–500. [Google Scholar]
  43. Livada, I.; Assimakopoulos, V.D. Spatial and Temporal Analysis of Drought in Greece using the Standardized Precipitation Index (SPI). Theor. Appl. Climatol. 2007, 89, 143–153. [Google Scholar] [CrossRef]
  44. Roushangar, K.; Ghasempour, R.; Nourani, V. The Potential of Integrated Hybrid Pre-Post-Processing Techniques for Short- to Long-Term Drought Forecasting. J. Hydroinform. 2021, 23, 117–135. [Google Scholar] [CrossRef]
  45. Alahacoon, N.; Edirisinghe, M.; Ranagalage, M. Satellite-Based Meteorological and Agricultural Drought Monitoring for Agricultural Sustainability in Sri Lanka. Sustainability 2021, 13, 3427. [Google Scholar] [CrossRef]
  46. TNMC. Drought and Climate Change Impacts and Vulnerability Assessment for Northeast Thailand: Final Report; Thai National Mekong Committee Secretariat: Vientiane, Laos, 2016. [Google Scholar]
Figure 1. Location of the study area, and its topography and land use.
Water 13 02743 g001
Figure 2. Weights and rating scores based on cumulative distribution function of SPEI for the calculation of Drought Hazard Index (DHI).
Water 13 02743 g002
Figure 3. Steps used for estimating the Drought Hazard Index (DHI).
Water 13 02743 g003
Figure 4. The vulnerability assessment framework used in this study.
Water 13 02743 g004
Figure 5. Average annual maximum and minimum temperatures (a,b), and average annual rainfall (c) under RCP 4.5 and 8.5 scenarios.
Water 13 02743 g005
Figure 6. Observed and simulated monthly discharge during (a) calibration period and (b) validation period, at gauging station E.68A.
Water 13 02743 g006
Figure 7. Spatial drought risk maps of the Lam Phaniang River Basin during 2000–2017 at (a) 3-, (b) 12-, and (c) 24-month time scales.
Water 13 02743 g007
Figure 8. Spatial drought risk maps of the Lam Phaniang River Basin at 3-, 12-, and 24-month time scales under RCPs 4.5 and 8.5 during (a) 2021–2040, (b) 2041–2060, (c) 2061–2080, and (d) 2081–2100.
Water 13 02743 g008
Table 1. Classification of SPEI index and weighting scheme for drought hazard assessment [28].
SPEI ValueClassificationWeights Assigned
−1.00 to 1.00Near normal or mild (M)1
−1.50 to −1.00Moderate (MO)2
−2.00 to −1.50Severe (S)3
−2.00 or lessExtreme (E)4
Table 2. The classification of DHI for drought hazard assessment.
DHI ValueClassification
0.00 to 0.25Low
0.25 to 0.50Moderate
0.50 to 0.75High
0.75 to 1.00Very High
Table 3. Changes in future land use patterns compared to the year 2015.
Land Use TypePeriod
20152021–20402041–20602061–20802081–2100
AreaAreaChangeAreaChangeAreaChangeAreaChange
Aquaculture land1.31.30.01.30.01.30.01.30.0
Field crop435.1216.7−218.4161.6−273.5143.3−291.8138.8−296.3
Forest land407.1366.6−40.5337.5−69.6312.5−94.6291.6−115.5
Horticulture0.90.90.00.90.00.90.00.90.0
Miscellaneous land47.047.00.047.00.047.00.047.00.0
Orchard21.411.1−10.39.7−11.79.5−11.99.7−11.7
Paddy field642.5665.322.8673.130.6677.334.8679.837.3
Pasture and farmhouse0.70.70.00.70.00.70.00.70.0
Perennial crop183.7407.6223.9473.3289.6503.5319.8519.2335.5
Urban and built-up land97.2119.622.4131.734.5140.943.7147.850.6
Water body48.048.00.048.00.048.00.048.00.0
Total1884.801884.80 1884.80 1884.80 1884.80
Note: The unit of area and change is km2.
Table 4. Simulated mean monthly water balance results for the baseline and climate scenarios for the Lam Phaniang River Basin.
Water Balance ComponentsPeriodRCPValue (Million m3)
JanFebMarAprMayJunJulAugSepOctNovDecTotal
Runoff2000–2017-1.543.396.8620.0931.1816.2658.81101.86168.6041.933.993.14457.65
2021–20404.50.181.4920.0033.6116.1923.4640.29155.92215.910.710.000.00507.77
8.50.062.6412.3632.6411.0720.9545.89181.26236.110.760.000.00543.75
2041–2060 4.50.081.9019.3245.0618.3024.2832.84193.29194.210.270.000.00529.55
8.50.121.7215.6935.6015.8037.2567.16167.53197.600.240.000.00538.71
2061–2080 4.50.243.1819.2741.2412.9918.0341.23140.08154.830.500.000.01431.61
8.50.233.0621.4643.1014.0719.7340.28194.31193.710.420.000.01530.38
2081–21004.50.113.1723.0442.5813.3115.6139.37136.66143.630.130.000.00417.63
8.50.232.8520.8646.7013.2736.4547.54154.94153.850.200.000.00476.90
Water demand2000–2017-47.1452.0456.9750.1069.6288.3868.5451.5330.3573.7964.4741.52694.43
2021–2040 4.533.0432.8829.9621.9863.7369.0863.1025.096.4477.7965.3227.90516.29
8.532.4732.2532.7923.2066.6466.7558.5618.174.5979.3361.9027.42504.08
2041–2060 4.529.4128.9626.9214.1459.1069.2866.5717.559.1684.9170.4124.37500.79
8.528.9828.6528.2317.9960.4160.6157.6422.278.3689.5374.1624.06500.90
2061–2080 4.529.0427.2626.2314.5264.4368.9254.0124.9314.7386.7675.1023.83509.77
8.528.0228.3124.8115.3463.2465.9059.1812.309.6082.4060.9823.43473.52
2081–21004.531.3929.7027.5216.9063.4172.0159.1425.5212.0888.6374.2626.04526.60
8.531.6429.8428.5416.8863.3758.5956.9021.4814.1891.9780.4926.75520.61
Water shortage2000–2017-42.8442.3336.7020.1916.0817.6111.421.220.2321.3142.9736.03288.93
2021–2040 4.530.3820.391.770.172.363.778.820.000.0016.3654.8227.09165.92
8.529.8318.275.120.302.603.875.910.000.0014.2753.9926.42160.57
2041–2060 4.527.9516.800.830.012.726.736.810.000.0023.4064.6223.24173.11
8.526.6516.803.030.062.193.262.420.000.0027.2168.0623.45173.14
2061–2080 4.526.6412.850.640.032.026.104.130.000.0025.4464.6622.53165.04
8.524.6815.210.430.013.393.093.540.000.0015.8550.7322.88139.82
2081–21004.529.3315.432.090.010.784.605.680.000.0023.3668.8825.47175.62
8.528.6016.200.810.001.255.385.610.000.0030.7975.7326.09190.46
Table 5. Average Drought Risk Index values for the Lam Phaniang River Basin at different time scales under RCPs 4.5 and 8.5 during 2000–2100.
PeriodScenarioAverage DRI Values at Different Time Scales
3-Month12-Month24-Month
ValueClassValueClassValueClass
2000–2017Baseline0.31Moderate0.23Low0.11Low
2021–2040RCP 4.50.26Moderate0.37Moderate0.45Moderate
RCP 8.50.25Moderate0.45Moderate0.50High
2041–2060RCP 4.50.21Low0.09Low0.08Low
RCP 8.50.32Moderate0.40Moderate0.43Moderate
2061–2080RCP 4.50.30Moderate0.28Moderate0.38Moderate
RCP 8.50.21Low0.12Low0.08Low
2081–2100RCP 4.50.22Low0.16Low0.22Low
RCP 8.50.20Low0.06Low0.06Low
Publisher’s Note: MDPI stays neutral with regard to jurisdictional claims in published maps and institutional affiliations.

